Article

A Comparison of Meteor Radar Observation over China Region with Horizontal Wind Model (HWM14)

1
Department of Space Physics, School of Electronic Information, Wuhan University, Wuhan 430072, China
2
Beijing Institute of Applied Meteorology, Beijing 100029, China
*
Author to whom correspondence should be addressed.
Atmosphere 2021, 12(1), 98; https://doi.org/10.3390/atmos12010098
Submission received: 16 December 2020 / Revised: 6 January 2021 / Accepted: 8 January 2021 / Published: 11 January 2021

Abstract

:
This paper compares the wind fields measured by the meteor radar at Mohe, Beijing, Wuhan, and Sanya stations and horizontal wind model (HWM14) predictions. HWM14 appears to successfully reproduce the height-time distribution of the monthly mean zonal winds, although large discrepancies occur in wind speed between the model and measurement, especially in the summer and winter months. For meridional wind, the consistency between model prediction and radar observation is worse than that of zonal wind. The consistency between radar measurements and model prediction at Sanya station is worse than other sites located at higher latitudes. Harmonic analysis reveals large discrepancies in diurnal, semidiurnal, and terdiurnal tides extracted from meteor radar observations and HWM14 predictions.

1. Introduction

Horizontal wind field at mesosphere and lower thermosphere (MLT) is an important parameter to present the general circulation at this level. Ground-based instruments, such as meteor radar, medium frequency radar, and lidar are the primary means to measure the wind fields at the MLT region. Those instruments can continuously measure the vertical wind profiles with high temporal resolution at specific sites for a relatively long period.
Horizontal Wind Model (HWM) [1,2,3,4,5,6] is an international reference atmospheric model, that provides average horizontal winds of Earth’s atmosphere from the ground to the exobase (0–500 km). HWM has been extensively used by the upper atmospheric research. For instance, HWM provides realistic observational based drivers of the neutral winds for ionospheric model development and space weather applications [7,8]. Also, HWM provides background wind fields for investigations of ionospheric data assimilation [9,10], and wave propagation [11].
Although HWM can provide reference wind field with high spatiotemporal resolution at MLT region, some studies indicate that there are great discrepancies between the model results and observations. Hibbins et al. detected large differences between wind fields measured by Falkland Islands SuperDARN radar (52° S, 59° W) and HWM07-predicted model winds for diurnal, semidiurnal, and terdiurnal tides at southern middle latitudes [12]. HWM07 is one of the Horizontal Wind Model series. Day et al. compared model results of HWM07 with zonal and meridional winds in MLT region measured by a meteor radar at Bear Lake Observatory (42° N, 111° W) [13]. Their results demonstrate that the model-calculated zonal wind in winter is 2 times stronger than the radar-measured zonal wind below 85 km height. Su et al. analyzed horizontal winds and tides in MLT region from the data measured by Chung-Li (24.9° N, 121° E), Taiwan meteor radar [14]. Comparison between the meteor radar winds and HWM07 results show that the amplitudes of the mean wind, diurnal, and semidiurnal tides of the radar-measured winds in 82–100 km height are larger than those of the model-calculated winds by up to a factor of 3.
In this paper, we compare the meteor radar-measured wind fields in China region with HWM14 (the latest version). The purpose of this comparison is to find the discrepancy between HWM14 prediction and meteor radar observation, and to provide a reference for the update of future HWM version. The paper is organized as follows. The meteor radar data utilized and HWM14 are described in Section 2. Comparisons between the radar wind measurement and model results of HWM14 are made in Section 3. The discussion and summary are given in Section 4.

2. Data Set and HWM14

Meteor radar wind observations of 8-year period from 2011 to 2018 at Mohe (52.5° N, 122.3° E), Beijing (40.3° N,116.2° E), Wuhan (30.5° N, 114.6° E), and of 6-year period from 2011 to 2016 at Sanya (18.3° N, 109.6° E) are used to compare with the model results of HWM14. Figure 1 presents geographical distribution of the Mohe, Beijing, Wuhan, and Sanya meteor radar stations. Zonal (positive eastward) and meridional (positive northward) wind from 70 to 110 km are acquired from meteor radar with 1-h time resolution and 2-km height resolution. The neutral wind data are published at the website of world data center for Geophysics, Beijing: http://wdc.geophys.ac.cn/index.asp.
HWM14 is the newest version for HWM series which has updated in the thermosphere with new measurements and formulation changes. The HWM14 provides average horizontal winds as a function of day of year τ, solar local time δ, colatitude θ, longitude ϕ, and altitude z from the ground to the exobase. A height-modulated vector spherical harmonic basis function (1) is used to present the atmosphere’s dominant recurring cyclical climatological variations.
U ( τ ,   δ ,   θ ,   ϕ ,   z )   =   j β j ( z ) u j ( τ ,   δ ,   θ ,   ϕ )
where β j ( z ) represents the amplitude of the jth vertical cubic B-spline weighting kernel and u j ( τ ,   δ ,   θ ,   ϕ ) is the periodic horizontal spatiotemporal variations for the jth vertical kernel. Here, U ( τ ,   δ ,   θ ,   ϕ ,   z ) represents the zonal wind. The horizontal variation u j ( τ ,   δ ,   θ ,   ϕ ) is given below:
u j ( τ ,   δ ,   θ ,   ϕ )   =   s = 0 S n = 1 N Ψ j 1 ( τ ,   δ ,   s ,   n )                                             + s = 0 S l = 1 L n = 1 N Ψ j 2 ( τ ,   δ ,   θ ,   s ,   l ,   n )                                             + s = 0 S m = 1 M n = 1 N Ψ j 3 ( τ ,   ϕ ,   θ ,   s ,   m ,   n )
where Ψ j 1 ( τ ,   δ ,   s ,   n ) are the annual and semiannual harmonics for the zonal mean general circulation, Ψ j 2 ( τ ,   δ ,   θ ,   s ,   l ,   n ) represents the westward migrating diurnal, semidiurnal, and terdiurnal harmonics, and Ψ j 3 ( τ ,   ϕ ,   θ ,   s ,   m ,   n ) is the stationary planetary wave harmonics. More details about HWM14 are provided by Drob et al. [6].

3. Results and Analysis

3.1. Mean Winds

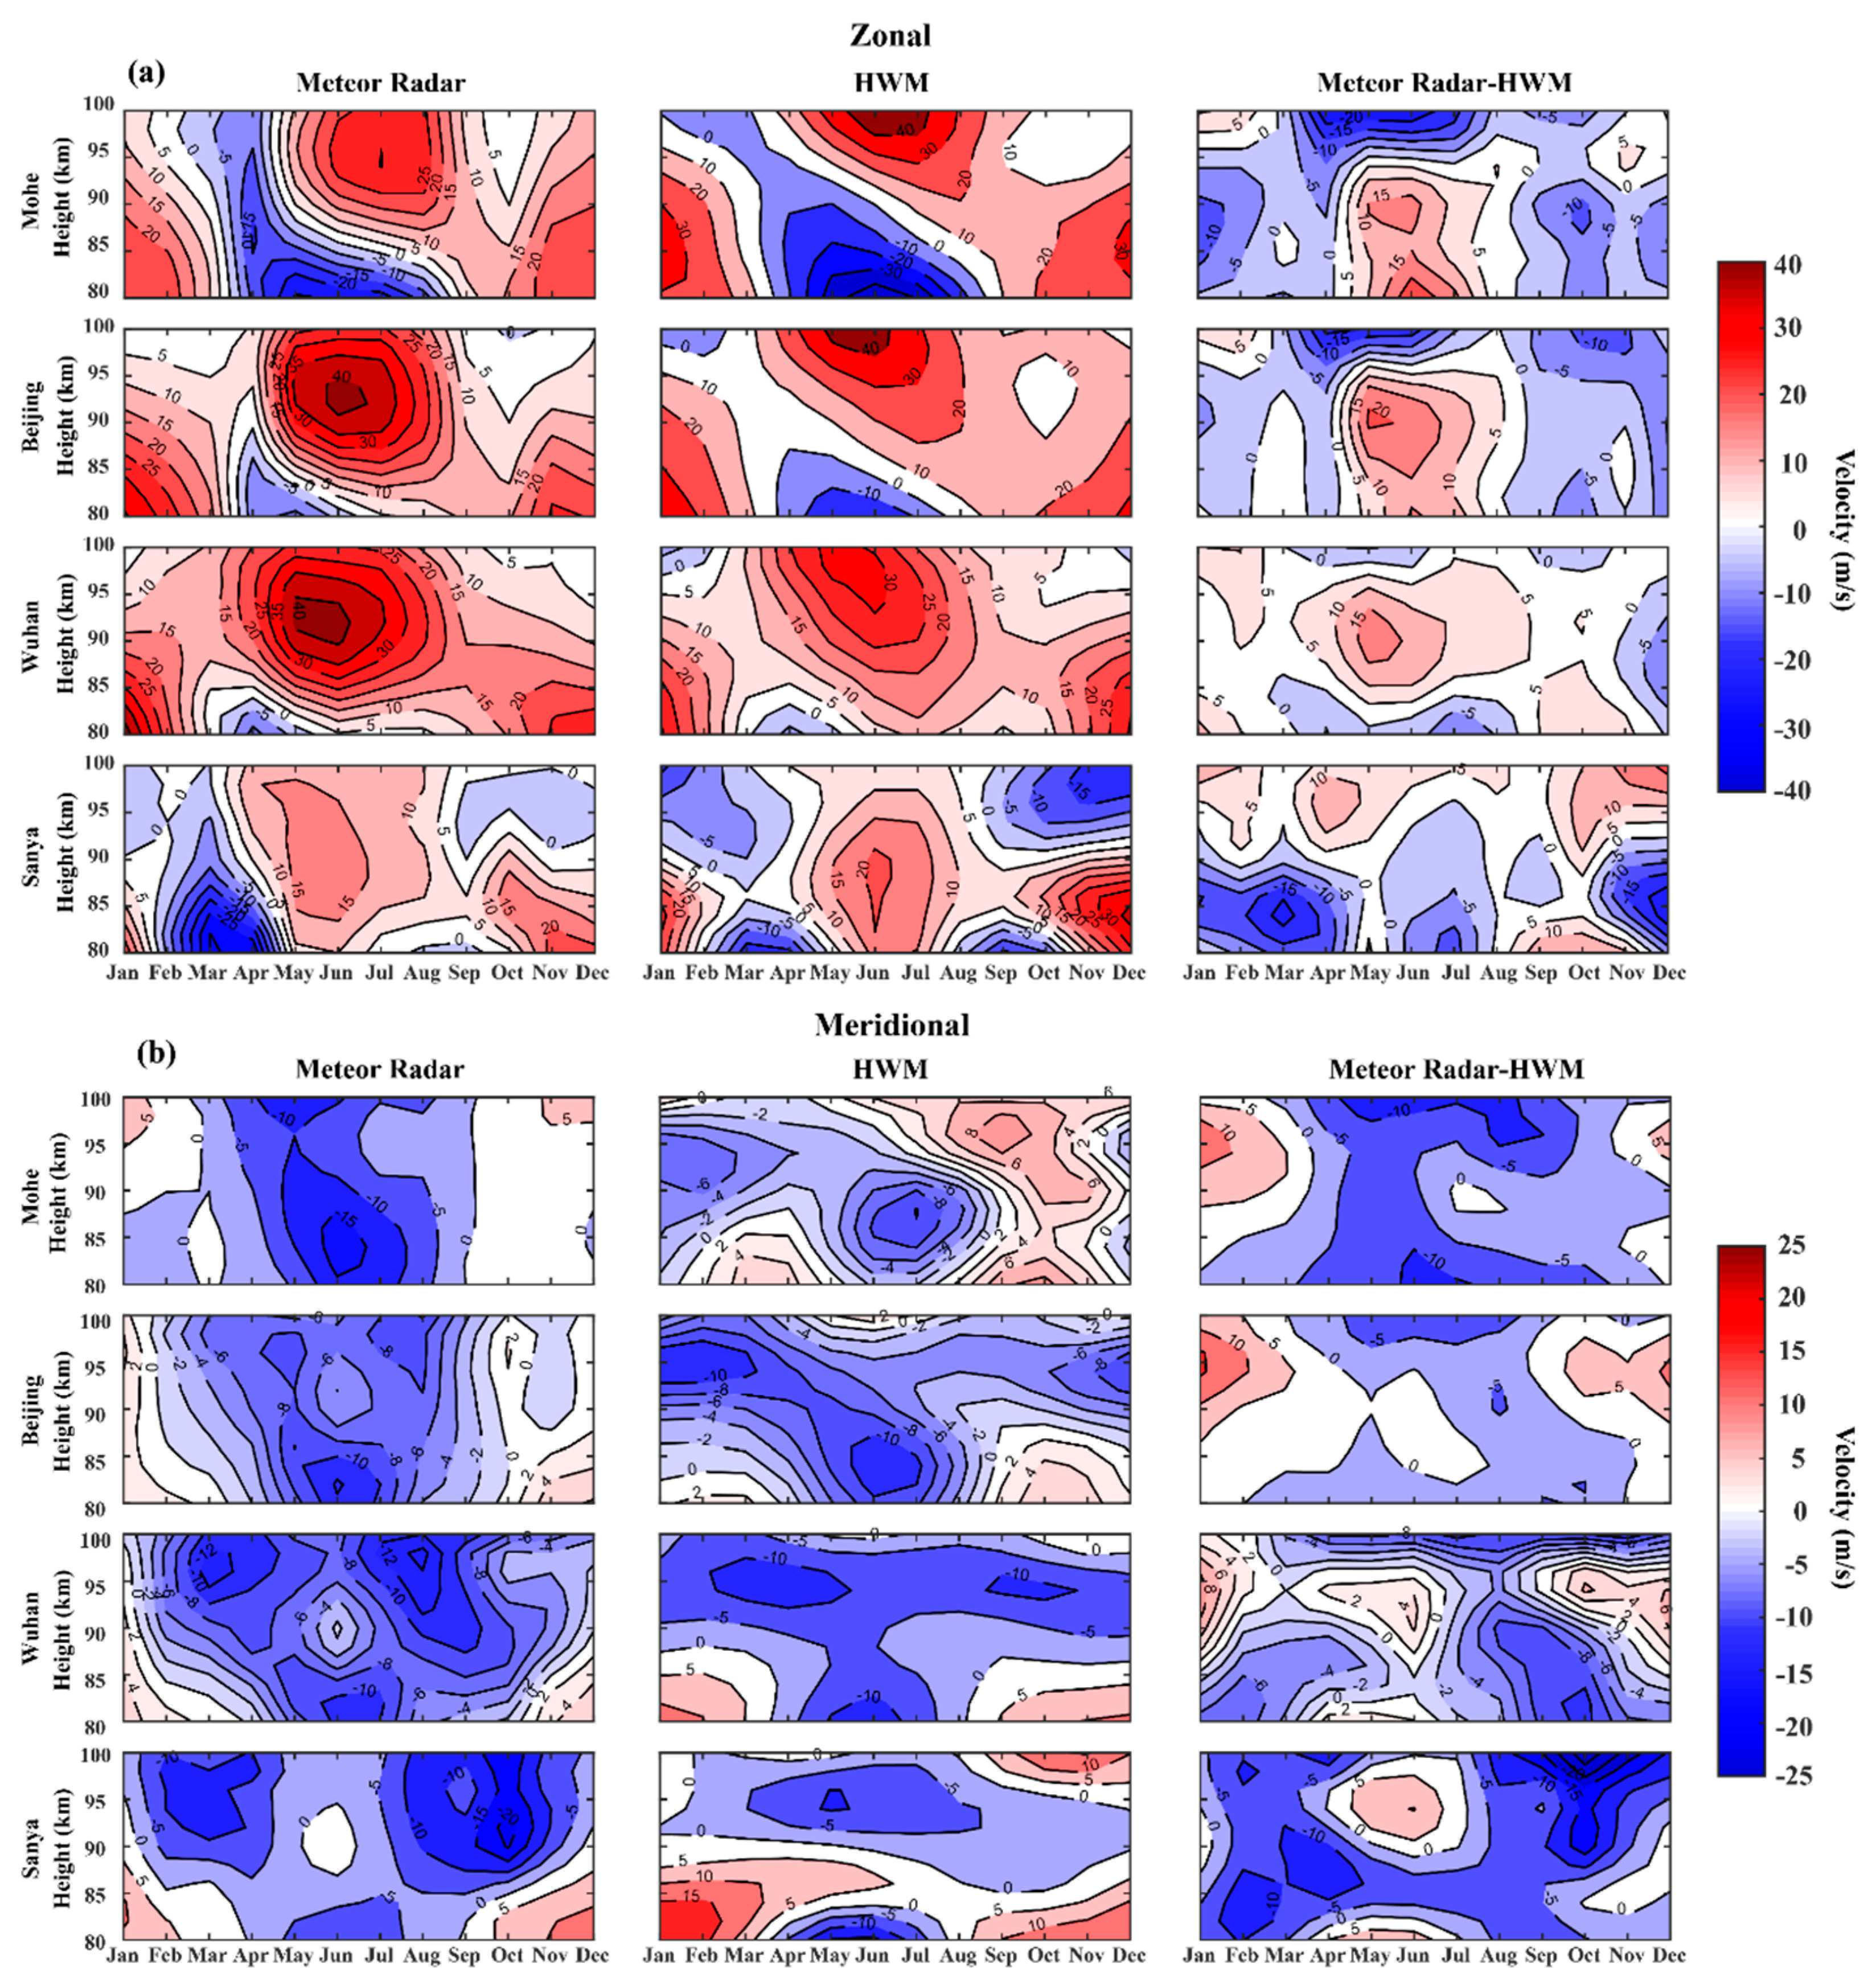
Figure 2 compares the monthly mean zonal (top) and meridional (bottom) wind in the composite year by the meteor radar chain observations (left column) and HWM14 predictions (middle column) in the height range of 80–100 km. The right column is the wind difference between meteor radar and HWM14. As shown in the left column of Figure 2a, two eastward jets are observed at all meteor radar stations. One appears above ~85 km height in the time range from April to August, and another one occurs below ~95 km altitude in the period from October to February. A westward jet is found below 85 km in the time interval from April to July at all mid-latitude stations. Also, the observational results present evident latitudinal differences. The strength of the eastward jet measured at Sanya station is weaker than others. Besides, three westward jets are observed at the Sanya station. One occurs below ~85 km in the period from February to April, the second one appears below ~80 km in the time interval between August to September, and the third one presents above ~90 km in the time range from September to January.
Comparing the middle with the left column of Figure 2a, we can find that the HWM14 captures the major characters of radar observations by presenting two eastward jets and a westward jet during same time periods at all mid-latitude sites. However, the peak height of the eastward jet appearing in the period from April to August predicted by HWM14 model is ~10 km higher than that of radar observations at Mohe, Beijing, and Wuhan stations. In addition, the eastward and westward wind velocity calculated by HWM14 are nearly twice as fast as Mohe radar observation, which leads to more than 20 m/s differences between the observation and the model in summer season, as shown in the right column of Figure 2a. Wuhan radar measured summer eastward flow velocity is 15 m/s faster than model prediction. At Sanya site, wind patter of HMW14 is similar to that of radar observation. However, eastward jet below 90 km from September to February calculated by HWM14 is greater than that of radar observation. Besides, the westward jet calculated by model occurs above ~90 km and lasts from September till April, and its velocity is even triple as fast as the observation. Generally, the radar-measured and the model-predicted zonal component present similar wind pattern. Large discrepancies are mainly found during summer and winter months in the middle latitudes, and during spring and winter months in the low latitude.
The results of the monthly mean meridional winds obtained from the observation and the HWM14 model are shown in Figure 2b. At Mohe, the mean meridional winds are southward (negative) in the period from March to August and northward in the time range from September to November at all observed altitudes. Whereas, HWM14 model predicts southward wind below 95 km during the period from May to August. Besides, model predicts greater northward wind velocity during the time range from September to December. What’s more, the wind directions of model and observation above 85 km in the period from January to February are opposite. At Beijing, the observed meridional wind is mostly southward except during winter, but the model predicts stronger southward above 90 km in winter. Both Wuhan and Sanya observational results show a three-cell pattern of southward wind. At Wuhan station, two cells occur above 90 km around March and August, and the other one appears below 85 km in June. At Sanya station, two cells appear above 90 km height around March and October, and another one occurs below 85 km in June. However, the model only reproduces the three-cell structure at Wuhan site.
Figure 3 present the relative difference between meteor radar observed and HWM14 predicted zonal (the left column) and meridional (the right column) wind. Compared to zonal wind, the meridional component shows larger discrepancies between observations and model predictions.

3.2. Tides

Harmonic analysis is a method that widely used to decompose the constituents of the time series. In this work, a linear least squares fit is utilized to retrieve the amplitude of the specified harmonics. A 15-day window is incremented in 1-day step through the radar measured and HWM14 predicted meridional and zonal wind time series and hourly winds are fitted by Equation (3) with a superposition of the mean wind, diurnal (DT), semidiurnal (SDT), and terdiurnal (TDT) harmonic components.
f ( t ) = a 0 + a 1 cos ( 2 π 24 ( t ϕ 1 ) + a 2 cos ( 2 π 12 ( t ϕ 2 ) ) + a 3 cos ( 2 π 8 ( t ϕ 3 ) )
where f is the zonal or meridional component, a 0 presents mean wind, a 1 , a 2 , a 3 and ϕ 1 , ϕ 2 , ϕ 3 are the amplitude and phase of diurnal, semidiurnal, and terdiurnal tides, respectively.
Figure 4 presents the diurnal, semidiurnal, and terdiurnal tidal amplitude obtained from Mohe meteor radar measurement and HWM14 prediction. It can be seen from Figure 2 that the semidiurnal tide dominates over the diurnal and terdiurnal tides for both the radar measured and model predicted zonal and meridional wind. However, there are large differences in the temporal and altitude behavior of these tides. For the zonal component, enhanced diurnal tidal activity is seen above 95 km during the time interval from May to June and during December in radar measurement. The model predicted diurnal tide is active above 90 km altitude during the time interval between January and March and between May and June. The radar also shows enhanced diurnal tidal activity below 87 km altitude in March, whereas HWM14 presents a strong amplitude of diurnal tide below 85 km during a whole year. Semidiurnal tide obtained from radar measurement presents strong amplitude at all height range during fall equinox season, while no significant enhancement is seen in the model prediction during this time period. Both the observation and prediction show enhanced semidiurnal tide during winter season, but radar observed enhanced semidiurnal tide activity almost covers all observed height. Terdiurnal tide shares the smallest proportion among these three tidal components. For the meridional component, both radar and HWM14 display obvious strong amplitude of diurnal tide from April to September. Semidiurnal and turdiurnal tidal patterns of radar measured and the model predicted meridional wind are similar with those of radar measured and model predicted zonal wind.
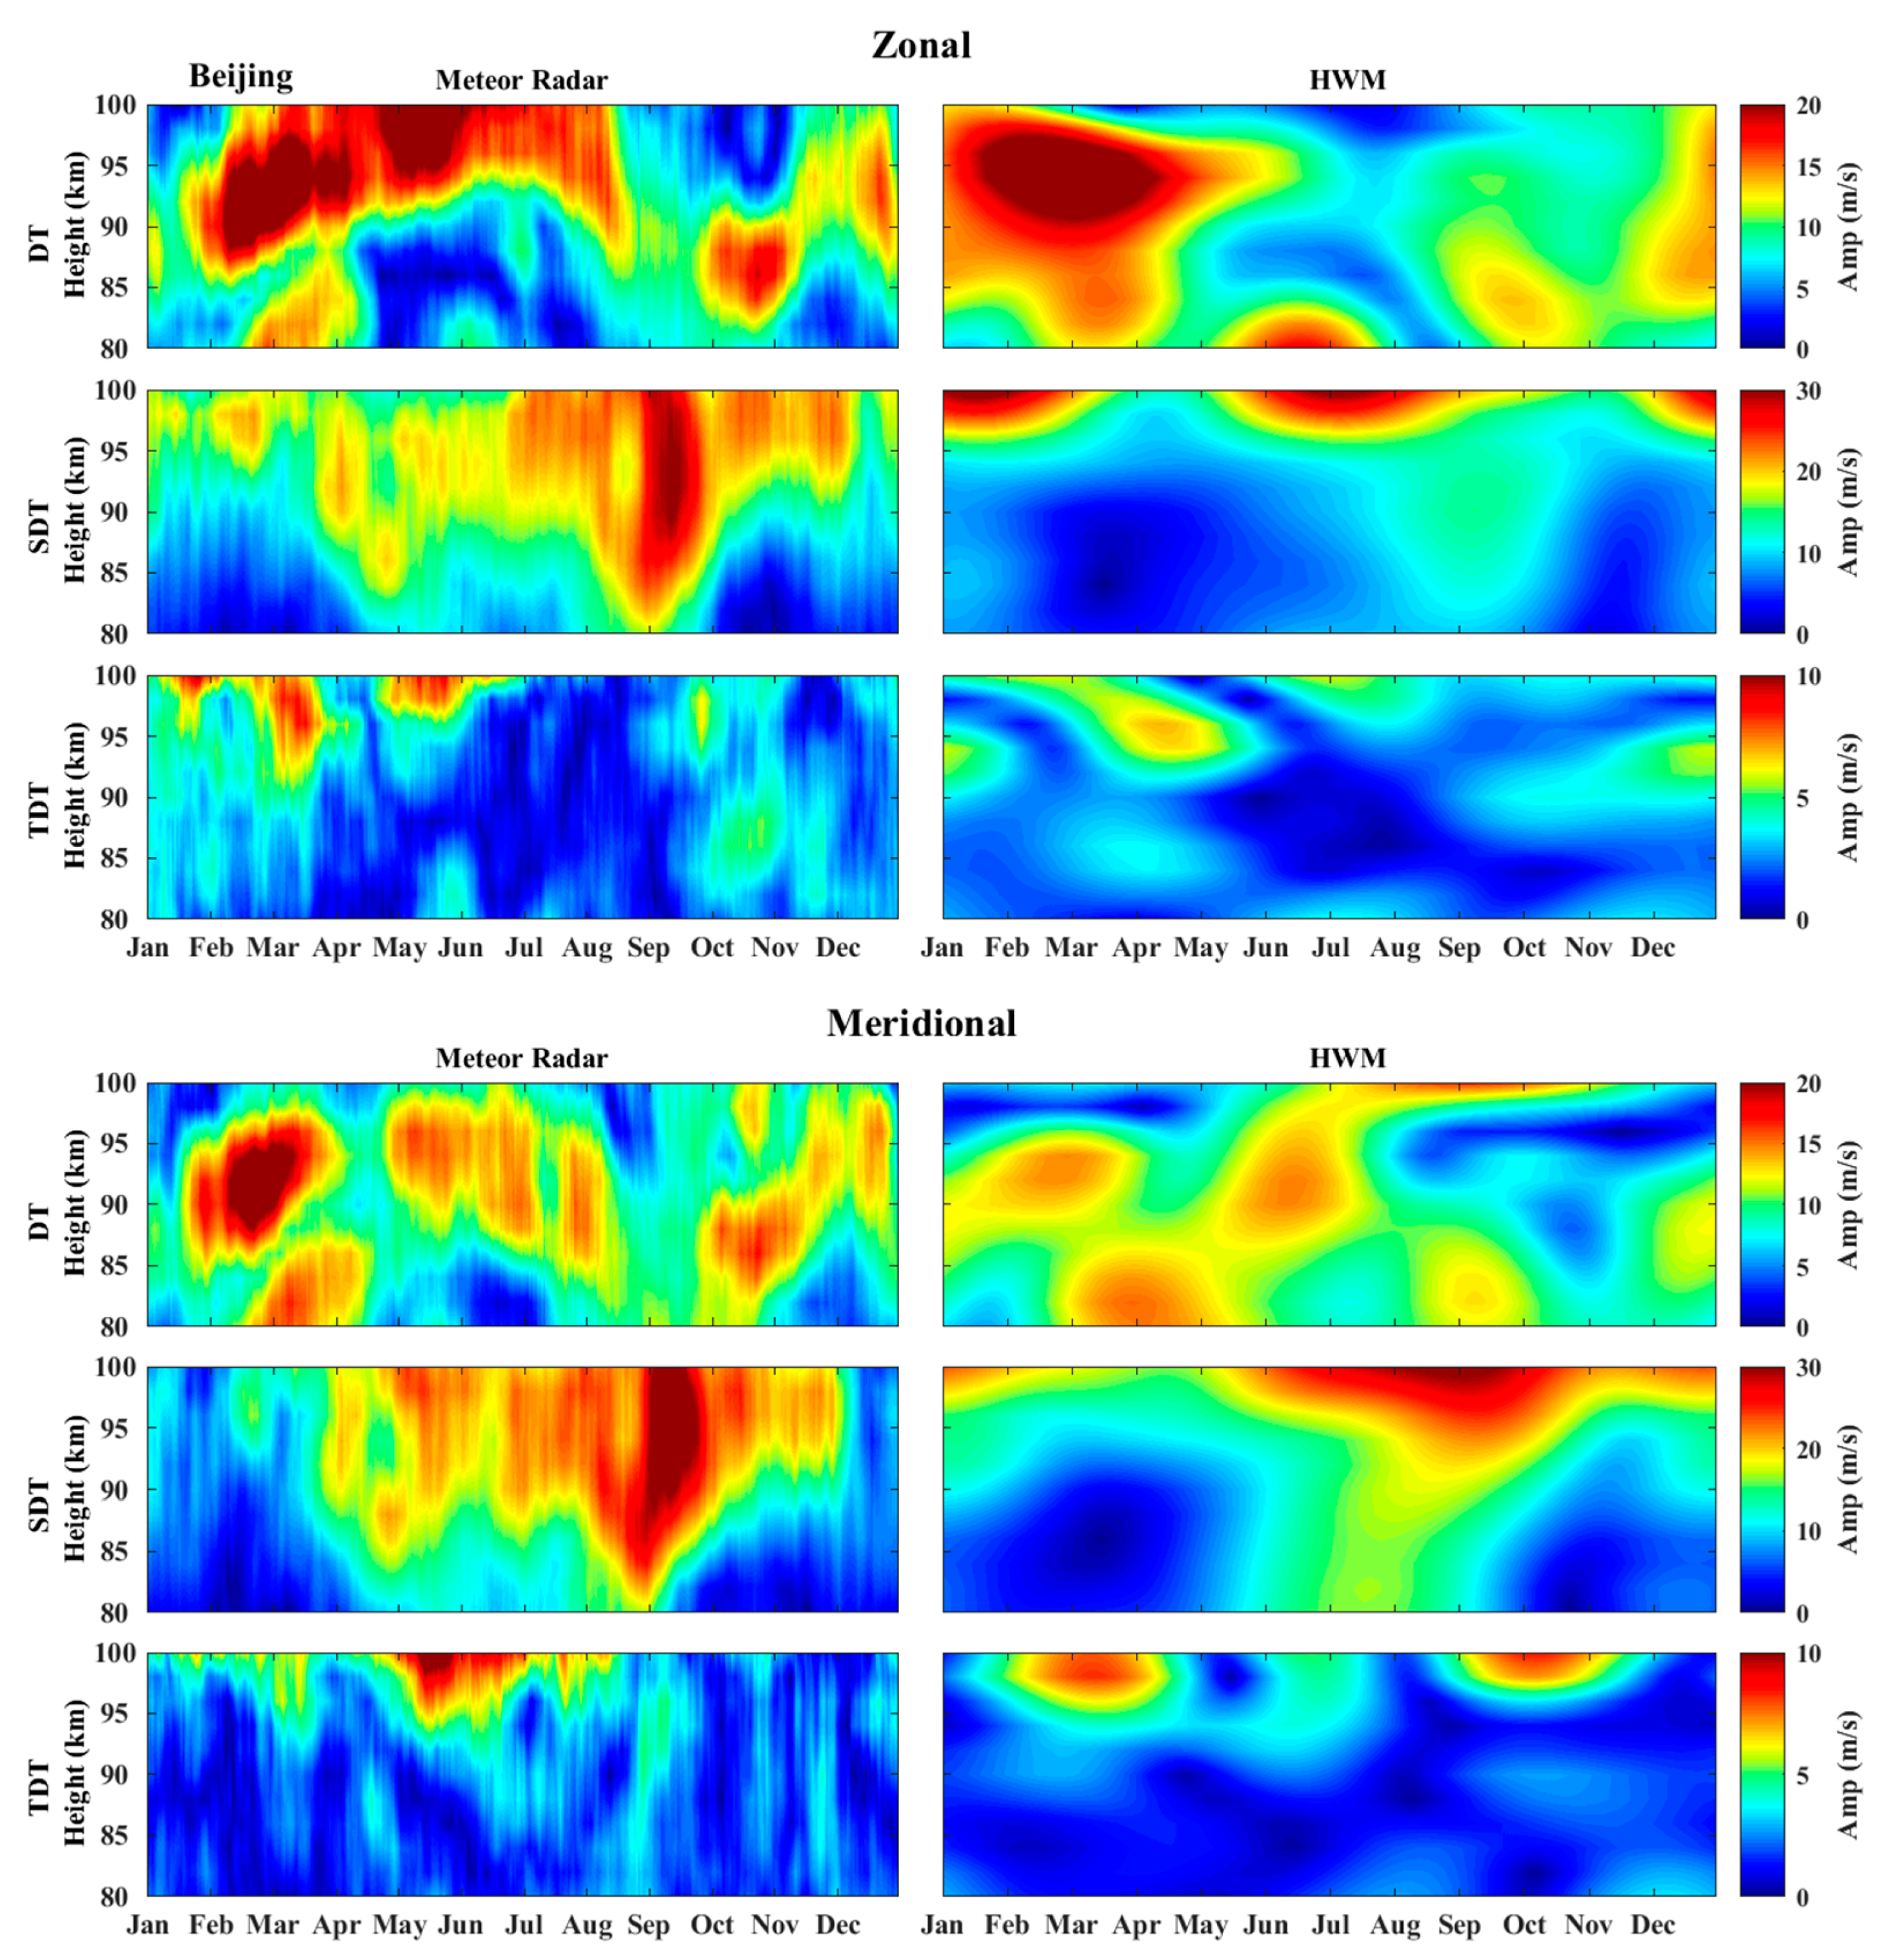
Figure 5 compares the diurnal, semidiurnal, and terdiurnal tidal amplitude obtained from Beijng meteor radar measurement and HWM14 prediction. For the zonal component, radar observed and HWM predicted diurnal tide is active during the time range from February to July and from January to April, respectively. The radar observation exhibits obvious semidiurnal tidal activity during an entire year apart from winter, and the peak appears in September. However, HWM prediction only presents enhancement above 95 km height during summer and winter. The terdiurnal tide of radar observation is active above 95 km altitude during January and May, and above 93 km in March. The model predicted terdiurnal tide only shows an obvious enhancement in April. For the Meridional wind, diurnal tidal pattern of radar measurement is similar to that of model calculation. However, the amplitude of radar measured diurnal tide in February is 10 m/s greater than that of model prediction. Similar to the semidiurnal tide obtained from radar measured zonal wind, radar observed meridional wind also presents stronger semidiurnal tidal activity above 85 km altitude during a whole year except from winter. However, HWM14 only shows an obvious enhancement of semidiurnal tide above 90 km from June to September. Terdiurnal tide extracted from radar observation merely shows an enhancement during summer, whereas two obvious enhancements are found in HWM prediction during spring and fall equinoxes.
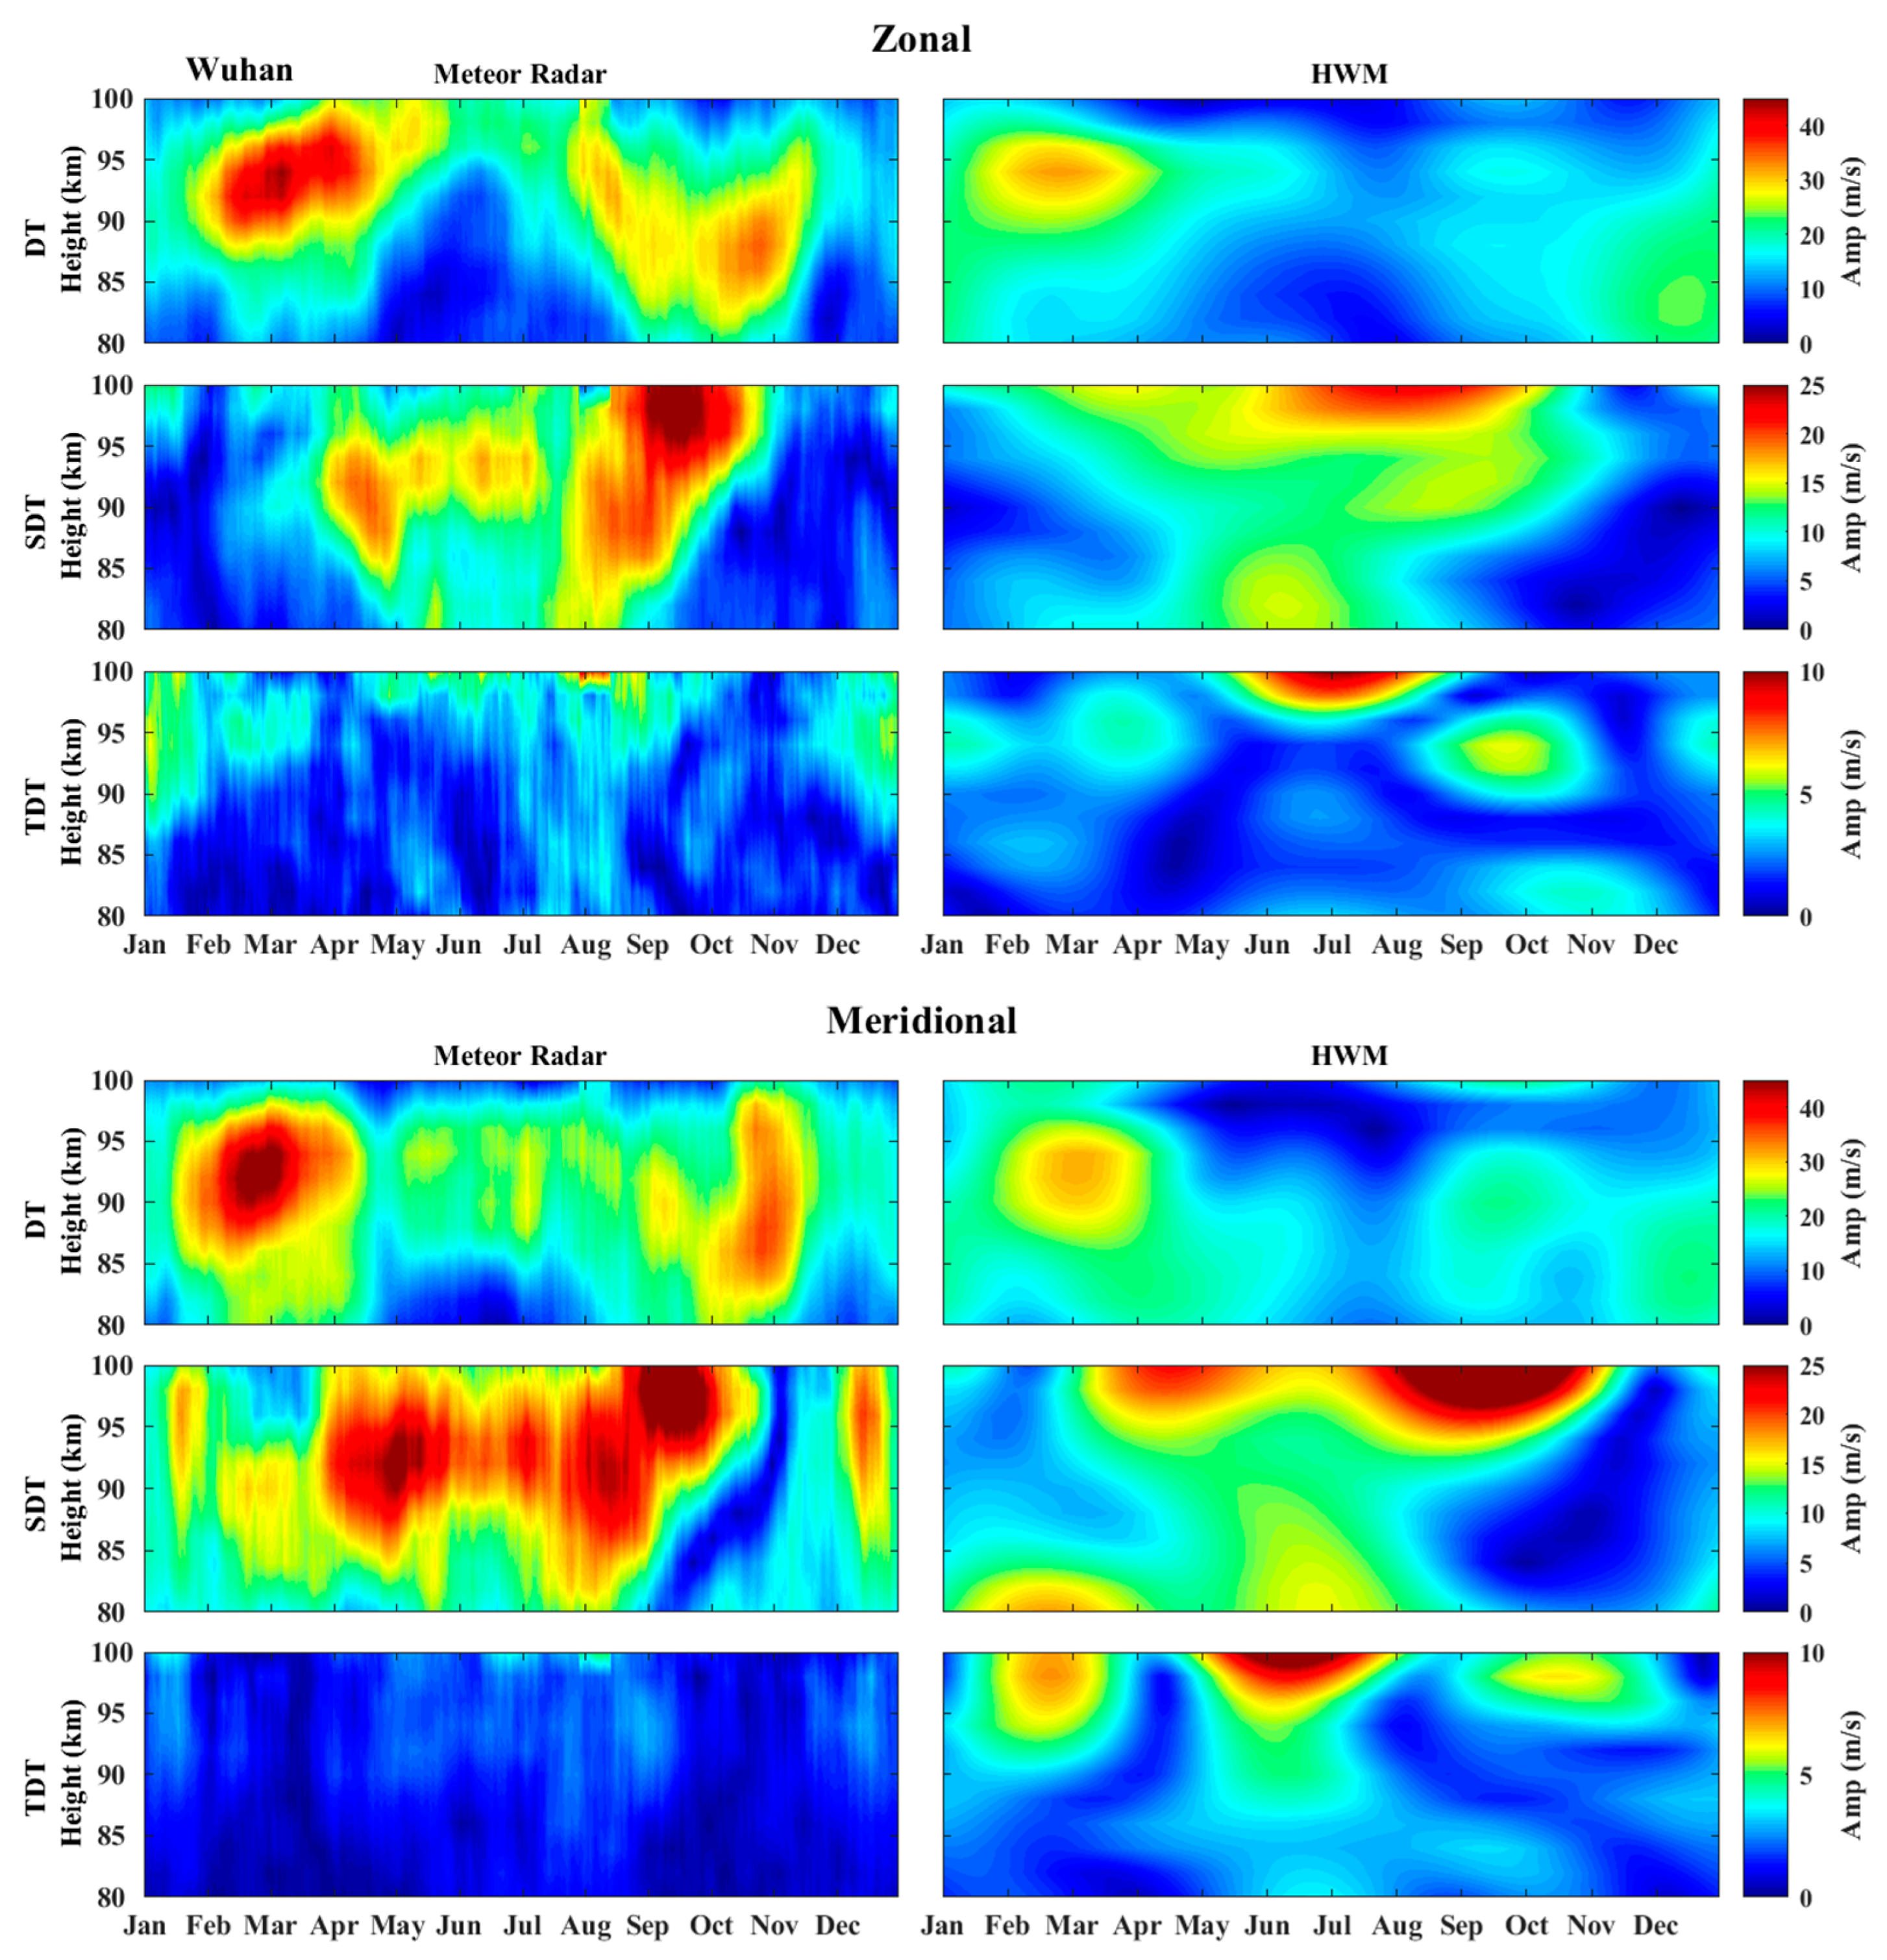
Figure 6 illustrates the evolution of tidal components derived from Wuhan radar observation and HWM calculation. Differ from two sites mentioned above, the diurnal tidal component becomes the dominant tide at this station. Both the radar observed zonal and meridional wind present two significant enhanced activities of diurnal tide during the period from the end of January to April and from August to November. However, model predicted diurnal tide only shows an obvious enhancement during the time range between February to March. Semidiurnal tide in radar measured zonal wind shows two significant enhancements in the height range of 85–95 km in April, and above 85 km altitude during the time range from August to October. However, the model prediction only presents a significant enhanced semidiurnal tidal activity above 97 km from June to September. The radar observed meridional wind shows strong semidiurnal tidal activity above 85 km during the time interval between April and October, whereas obvious tidal activity is merely seen above 95 km altitude in model calculation during this time period. Terdiurnal tide obtained from radar measured zonal and meridional is relative stable during a whole year, however, two obvious enhancements are seen in July and October in HWM predicted zonal wind, and three significant enhancements are seen during February, June, and October in the model predicted meridional wind.
Figure 7 compares the tidal components extracted from Sanya meteor radar observation and HWM14 prediction. For the zonal wind, radar measurement presents two significant diurnal tidal activities during the time range between January and March and between August and November, and the peak amplitude is over 35 m/s. However, HWM14 merely shows an obvious amplification of diurnal tide from January to March, and its peak amplitude is just ~20 m/s. Radar observed semidiurnal tide is active above 85 km from February to August. Model prediction presents enhanced semidiurnal tidal activity from April to November, and the enhanced tidal activity during the time range between April and June covers the entire height range. Radar measured terdiurnal tide shows two short-time enhancements above 95 km height in March and July. Meanwhile, the model predicts significant enhanced terdiurnal tidal activity above 95 km during entire summer, and a short-time enhancement at 90 km altitude in September. For the meridional wind, diurnal tide derived from radar measurement is active during a whole year, while model only presents enhancements in winter and autumn. The radar observed semidiurnal tide shows two significant enhancements almost at all observed height range during the period from February to March and from November to December. However, model only presents an enhanced semidiurnal tide activity below 84 km height during the time interval between January and March. The radar measured turdiurnal tide presents significant enhancement above 85 km in May, while model predicted turdiurnal tide is active above 95 km height from April to June.

4. Discussion and Summary

In the above analysis, we compare the meteor radar wind fields over China region with the model results of HWM14. According to the comparisons, the inconsistencies between radar observed and HWM14 model predicted mean winds are summarized as follows. (1) The model results show larger discrepancies in the zonal component with the observations measured by the meteor radars at mid-latitude in summer and winter months. (2) The observation and the model have better consistency in the zonal component than in the meridional component. (3) The difference between radar measurements and HWM14 predictions at low latitude is larger than that at middle latitudes. Although the HWM14 database in MLT region includes a great number of ground-based instruments, such as Farbry–Perot interferometer, incoherent scatter radar, medium-frequency (MF) radar, and lidar around the world, no meteor radar measurements are included, and in the East Asia area, only the data of MF radar at Yamagawa (31.2° N, 130.6° E) and Wakkanai (45.4° N, 141.8° E) are used [4,6]. Comparing the meteor radar mean winds at Wuhan with the Yamagawa MF radar measurements [15], we can see that the strength of the zonal eastward flow during summer months at Yamagawa is weaker than that at Wuhan. The zonal winds measured by the Wakkanai MF radar and the Beijing meteor radar show similar circulation features, whereas the peak height of the summer eastward jet at Wakkanai is over 95 km, which is higher than that at Beijing centering at 92 km altitude [15]. Besides, many studies confirm that MF radar winds tend to be around 20% lower than meteor radar measurements [16,17,18]. As a result, the larger discrepancy during summer months is likely due to the instrument biases between MF and meteor radars and limited data used to develop HWM14 model.
Korotyshkin et al. studied the MLT wind structure by using two SKiYMET meteor radars (MRs) at Collm (51° N, 13° E) and Kazan (56° N, 49° E), and proposed that the stationary planetary waves (SPWs) significantly contribute to the difference between zonal prevailing winds mainly in winter [19]. Sudden stratospheric warming (SSW) is a large-scale thermo-dynamical phenomenon in the winter polar region, and the principal mechanism of SSW is attributed to amplified upward propagating SPWs [20]. Many research works have demonstrated that SSW events play an important effect on mean winds in the MLT region [21,22,23,24]. During the radar observational periods in this study, three major and six minor SSW events are included. SSW’s contribution to the disturbance of mean wind at MLT region could be one of the causes that lead to the larger discrepancy in winter.
A possible reason for explaining the larger differences between the observation and model in the meridional component is that the meridional wind in the MLT region has clear longitudinal dependencies [16,25,26]. This implies that the model could not accurately predict the meridional wind only based on the input at limit longitudes. For example, the model does not reproduce the three-cell pattern at Sanya station. This pattern is rarely reported, although there are many studies focus on the variation of the mean wind at low latitudes [27,28,29,30,31]. The observational dataset used to construct the HWM14 model in MLT region do not contain any low-latitude ground-based instrument in Asian sector. This is very likely one of the causes responsible for the larger difference between Sanya meteor radar measurements and HWM14 predictions.
As we can see from Figure 4, Figure 5, Figure 6 and Figure 7, there are obvious discrepancies between radar measured and model predicted tidal components. Manson et al. [32] studied the global HRDI tidal structures and found significant longitudinal variations in the global distribution of semidiurnal and diurnal tide. Forbes et al. analyzed wind measurements near 95 km from the HRDI and WINDII instruments on UARS and found significant longitudinal variability of the diurnal tide between ±40 latitude [33]. Also, they proposed that a total diurnal tidal field with appreciable longitude variability results from the aggregate interference between nonmigrating and migrating tidal components. However, as mentioned above, in the East Asia area, only the data of MF radar at Yamagawa (31.2° N, 130.6° E) and Wakkanai (45.4° N, 141.8° E) are used in HWM14 [4,6], which prevents the model from having a good prediction based on input data at limited longitudes. In addition, a series of review paper and tutorials [34,35,36,37,38,39,40,41] demonstrated that nonmigrating tides emerged as important sources resulting in tidal variabilities in the upper mesosphere and lower thermosphere. However, HWM14 does not include any representation of nonmigrating tidal effects. Moreover, the longitudinal variations of atmospheric gravity waves’ (AGW) force can also contribute to the disturbance of tides and mean wind. Gardner et al. pointed out that most AGW can be dissipated in the region from 80 to 90 km altitude due to triggering the local atmospheric static or dynamic instabilities by AGW superimposed on the tides and mean winds [42]. Theoretically, dissipations of AGW will place accelerations or drags on wind fields. AGW activities depend on latitudes and longitudes. As a result, longitudinal variations of AGW activities can cause the longitudinal variations of dissipations and forcing, and therefore lead to longitudinal variations of local mean winds and tides. On the contrary, in HWM14 model, no effects of gravity waves are included.

Author Contributions

Methodology and investigation, Q.T. and J.Q.; data curation, and writing—original draft preparation, Q.T.; writing—review and editing, Q.T., C.Z., Y.L. and G.C.; funding acquisition, C.Z., Y.Z. and Z.D. All authors have read and agreed to the published version of the manuscript.

Funding

This research was funded by the National Natural Science Foundation of China (NSFC grant No. 41574146 and 41774162), the National Key R&D Program of China (Grant No. 2018YFC1503506), and the foundation of National Key Laboratory of Electromagnetic Environment (Grant No. 6142403180204).

Institutional Review Board Statement

Not applicable.

Informed Consent Statement

Not applicable.

Data Availability Statement

The Meteor radar data used in this study are from the website of world data center for Geophysics, Beijing: http://wdc.geophys.ac.cn/index.asp.

Acknowledgments

We acknowledge the use meteor radar dataset provided by Beijing National Observatory of Space Environment, Institute of Geology and Geophysics Chinese. We also acknowledge the use of HWM14 provided by National Space Science Data Center (NSSDC).

Conflicts of Interest

The authors declare no conflict of interest.

References

  1. Hedin, A.E.; Spencer, N.; Killeen, T. Empirical global model of upper thermosphere winds based on atmosphere and dynamics explorer satellite data. J. Geophys. Res. 1988, 93, 9959–9978. [Google Scholar] [CrossRef]
  2. Hedin, A.E.; Biondi, M.A.; Burnside, R.G.; Hernandez, G.; Johnson, R.M.; Killeen, T.L.; Mazaudier, C.; Meriwether, J.; Salah, J.E.; Sica, R.J.; et al. Revised global model of thermosphere winds using satellite and ground-based observations. J. Geophys. Res. 1991, 96, 7657–7688. [Google Scholar] [CrossRef] [Green Version]
  3. Hedin, A.E.; Fleming, E.L.; Manson, A.H.; Schmidlin, F.J.; Avery, S.K.; Clark, R.R.; Franke, S.J.; Fraser, G.J.; Tsuda, T.; Vial, F.; et al. Empirical wind model for the upper middle and lower atmosphere. J. Atmos. Terr. Phys. 1996, 58, 1421–1447. [Google Scholar] [CrossRef]
  4. Drob, D.P.; Emmert, J.T.; Crowley, G.; Picone, J.M.; Shepherd, G.G.; Skinner, W.; Hays, P.; Niciejewski, R.J.; Larsen, M.; She, C.Y.; et al. An empirical model of the Earth’s horizontal wind fields: HWM07. J. Geophys. Res. 2008, 113, A12304. [Google Scholar] [CrossRef]
  5. Emmert, J.; Drob, D.; Shepherd, G.; Hernandez, G.; Jarvis, M.J.; Meriwether, J.; Niciejewski, R.; Sipler, D.; Tepley, C. DWM07 global empirical model of upper thermospheric storm-induced disturbance winds. J. Geophys. Res. 2008, 113, A11319. [Google Scholar] [CrossRef]
  6. Drob, D.P.; Emmert, J.T.; Meriwether, J.W.; Makela, J.J.; Doornbos, E.; Conde, M.; Hernandez, G.; Noto, J.; Zawdie, K.A.; McDonald, S.E.; et al. An update to the horizontal wind model (HWM): The quiet time thermosphere. Earth Space Sci. 2015, 2, 301–319. [Google Scholar] [CrossRef]
  7. Huba, J.; Ossakow, S.; Joyce, G.; Krall, J.; England, S. Three-dimensional equatorial spread F modeling: Zonal neutral wind effects. Geophys. Res. Lett. 2009, 36, L19106. [Google Scholar] [CrossRef]
  8. Kelly, M.; Comberiate, J.; Miller, E.; Paxton, J. Progress toward forecasting of space weather effects on UHF SATCOM after operation Anaconda. Space Weather 2014, 12, 601–611. [Google Scholar] [CrossRef]
  9. Pi, X.; Wang, C.; Hajj, G.A.; Rosen, G.; Wilson, B.D.; Bailey, G.J. Estimation of ExB drift using a global assimilative ionospheric model: An observation system simulation experiment. J. Geophys. Res. 2003, 108, 1075. [Google Scholar] [CrossRef]
  10. Schunk, R.W.; Scherliess, L.; Sojka, J.J.; Thompson, D.C.; Anderson, D.N.; Codrescu, M.; Minter, C.; Fuller-Rowell, T.J.; Heelis, R.A.; Hairston, M.; et al. Global assimilation of ionospheric measurements (GAIM). Radio Sci. 2004, 39, RS1S02. [Google Scholar] [CrossRef]
  11. Drob, D.P.; Picone, J.M.; Garce’s, M. Global morphology of infrasound propagation. J. Geophys. Res. 2003, 108, 4680. [Google Scholar] [CrossRef]
  12. Hibbins, R.E.; Freeman, M.P.; Milan, S.E.; Ruohoniemi, J.M. Winds and tides in the mid-latitude Southern Hemisphere uppermesosphere recorded with the Falkland islands SuperDARN radar. Ann. Geophys. 2011, 29, 1985–1996. [Google Scholar] [CrossRef] [Green Version]
  13. Day, K.A.; Taylor, M.J.; Mitchell, N.J. Mean winds, temperatures and the 16- and 5-day planetary waves in the mesosphere and lower thermosphere over bear lake Observatory (42° N, 111° W). Atmos. Chem. Phys. 2012, 12, 1571–1585. [Google Scholar] [CrossRef] [Green Version]
  14. Su, C.L.; Chen, H.C.; Chu, Y.H.; Chung, M.Z.; Kuong, R.M.; Lin, T.H.; Tzeng, K.J.; Wang, C.Y.; Wu, K.H.; Yang, K.F. Meteor radar wind over Chung-Li (24.9° N, 121° E), Taiwan, for the period 10-25 November 2012 which includes Leonid meteor shower: Comparison with empirical model and satellite measurements. Radio Sci. 2014, 49, 597–615. [Google Scholar] [CrossRef] [Green Version]
  15. Namboothiri, S.P.; Kishore, P.; Igarashi, K.; Nakamura, T.; Tsuda, T. MF radar observations of mean winds over Yamagawa (31.2° N, 130.6° E) and Wakkanai (45.4° N, 141.7° E). J. Atmos. Sol. Terr. Phys. 2000, 62, 1177–1187. [Google Scholar] [CrossRef]
  16. Manson, A.; Meek, C.; Hall, C.; Nozawa, S.; Mitchell, N.; Pancheva, D.; Singer, W.; Hoffmann, P. Mesopause dynamics from the Scandinavian triangle of radars within the PSMOSDAT AR Project. Ann. Geophys. 2004, 22, 367–386. [Google Scholar] [CrossRef]
  17. Hall, C.M.; Aso, T.; Tsutsumi, M.; Nozawa, S.A.; Manson, H.; Meek, C.E. A comparison of mesosphere and lower thermosphere neutral winds as determined by meteor and medium-frequency radar at 70° N. Radio Sci. 2005, 40, RS4001. [Google Scholar] [CrossRef]
  18. Engler, N.; Singer, W.; Latteck, R.; Strelnikov, B. Comparison of wind measurements in the troposphere and mesosphere by VHF/MF radars and in-situ techniques. Ann. Geophys. 2008, 26, 3693–3705. [Google Scholar] [CrossRef] [Green Version]
  19. Korotyshkin, D.; Merzlyakov, E.; Jacobi, C.; Lilienthal, F.; Wu, Q. Longitudinal MLT wind structure at higher mid-latitudes as seen by meteor radars at Central and Eastern Europe (13° E/49° E). Adv. Space Res. 2019, 63, 3154–3166. [Google Scholar] [CrossRef]
  20. Matsuno, T. A dynamical model of the stratospheric sudden warming. J. Atmos. Sci. 1971, 28, 1479–1494. [Google Scholar] [CrossRef]
  21. Chau, J.L.; Hoffmann, P.; Pedatella, N.M.; Matthias, V.; Stober, G. Upper mesospheric lunar tides over middle and high latitudes during sudden stratospheric warming events. J. Geophys. Res. 2015, 120, 3084–3096. [Google Scholar] [CrossRef]
  22. Mbatha, N.; Sivakumar, V.; Malinga, S.B.; Bencherif, H.; Pillay, S.R. Study on the impact of sudden stratosphere warming in the upper mesosphere-lower thermosphere regions using satellite and HF radar measurements. Atmos. Chem. Phys. 2010, 10, 3397–3404. [Google Scholar] [CrossRef] [Green Version]
  23. Stray, N.H.; Orsolini, Y.J.; Espy, P.J.; Limpasuvan, V.; Hibbins, R.E. Observations of planetary waves in the mesosphere-lower thermosphere during stratospheric warming events. Atmos. Chem. Phys. 2015, 15, 4997–5005. [Google Scholar] [CrossRef] [Green Version]
  24. Ma, Z.; Gong, Y.; Zhang, S.; Zhou, Q.; Huang, C.; Huang, K.; Yu, Y.; Li, G.; Ning, B.; Li, C. Responses of quasi 2 day waves in the MLT region to the 2013 SSW revealed by a meteor radar chain. Geophys. Res. Lett. 2017, 44, 9142–9150. [Google Scholar] [CrossRef]
  25. Hu, X.; Zhang, X.; Igarashi, K.; Zhang, D. A preliminary comparison of observations with MF radars in Wuhan and Yamagawa at 30–31° N. J. Atmos. Sol. Terr. Phys. 2006, 68, 1036–1042. [Google Scholar] [CrossRef]
  26. Jacobi, Ch.; Hoffmann, P.; Liu, R.Q.; Merzlyakov, E.G.; Portnyagin, Yu.I.; Manson, A.H.; Meek, C.E. Long-term trends, their changes, and interannual variability of Northern Hemisphere midlatitude MLT winds. J. Atmos. Sol. Terr. Phys. 2012, 75, 81–91. [Google Scholar] [CrossRef]
  27. Day, K.A.; Mitchell, N.J. Mean winds in the MLT, the SQBO and MSAO over Ascension Island (8° S, 14° W). Atmos. Chem. Phys. 2013, 13, 9515–9523. [Google Scholar] [CrossRef] [Green Version]
  28. Venkateswara Rao, N.; Tsuda, T.; Riggin, D.M.; Gurubaran, S.; Reid, I.M.; Vincent, R.A. Long-term variability of mean winds in the mesosphere and lower thermosphere at low latitudes. J. Geophys. Res. 2012, 117, A10312. [Google Scholar] [CrossRef] [Green Version]
  29. Li, N.; Chen, J.; Ding, Z.; Zhao, Z. Mean winds observed by the Kunming MF radar in 2008–2010. J. Atmos. Sol. Terr. Phys. 2015, 122, 58–65. [Google Scholar] [CrossRef]
  30. Sharma, A.K.; Rokade, M.V.; Rao, R.K.; Gurubaran, S.; Patil, P.T. Comparative study of MLT mean winds using MF radars located at 16.8° N and 8.7° N. J. Earth Syst. Sci. 2010, 119, 461–470. [Google Scholar] [CrossRef]
  31. Sridharan, S.; Tsuda, T.; Gurubaran, S. Radar observations of long-term variability of mesosphere and lower thermosphere winds over Tirunelveli (8.7° N, 77.8° E). J. Geophys. Res. 2007, 112, D23105. [Google Scholar] [CrossRef] [Green Version]
  32. Manson, A.H.; Luo, Y.; Meek, C. Global distributions of diurnal and semi-diurnal tides: Observations from HRDI-UARS of the MLT region. Ann. Geophys. 2002, 20, 1877–1890. [Google Scholar] [CrossRef] [Green Version]
  33. Forbes, J.M.; Zhang, X.; Talaat, E.R.; Ward, W. Nonmigrating diurnal tides in the thermosphere. J. Geophys. Res. 2003, 108, 1033. [Google Scholar] [CrossRef]
  34. Forbes, J.M.; Garrett, H.B. Theoretical studies of atmospheric tides. Rev. Geophys. 1979, 17, 1951–1981. [Google Scholar] [CrossRef]
  35. Kato, S. Dynamics of the Upper Atmosphere; Kluwer Academy: Norwell, MA, USA, 1980. [Google Scholar]
  36. Forbes, J.M. Middle atmosphere tides. J. Atmos. Terr. Phys. 1984, 46, 1049–1067. [Google Scholar] [CrossRef]
  37. Volland, H. Atmospheric Tidal and Planetary Waves; Kluwer Academy: Norwell, MA, USA, 1988. [Google Scholar]
  38. Vial, F. Tides in the middle atmosphere. J. Atmos. Terr. Phys. 1989, 51, 3–17. [Google Scholar] [CrossRef]
  39. Vial, F.; Forbes, J.M. Recent progress in tidal modeling. J. Atmos. Terr. Phys. 1989, 51, 663–671. [Google Scholar] [CrossRef]
  40. Forbes, J.M.; Makarov, N.A.; Portnyagin, Y.I. First results from a meteor radar at South Pole: A large 12-hour oscillation with zonal wavenumber one. Geophys. Res. Lett. 1995, 22, 3247–3250. [Google Scholar] [CrossRef]
  41. Hagan, M.E. Atmospheric tidal propagation across the stratopause. In Atmospheric Science Across the Stratopause; Siskind, D.E., Eckermann, S.D., Summers, M.E., Eds.; AGU: Washington, DC, USA, 2000; Volume 123. [Google Scholar]
  42. Gardner, C.S.; Zhao, Y.; Liu, A.Z. Atmospheric stability and gravity wave dissipation in the mesopause region. J. Atmos. Sol. Terr. Phys. 2002, 64, 923–929. [Google Scholar] [CrossRef] [Green Version]
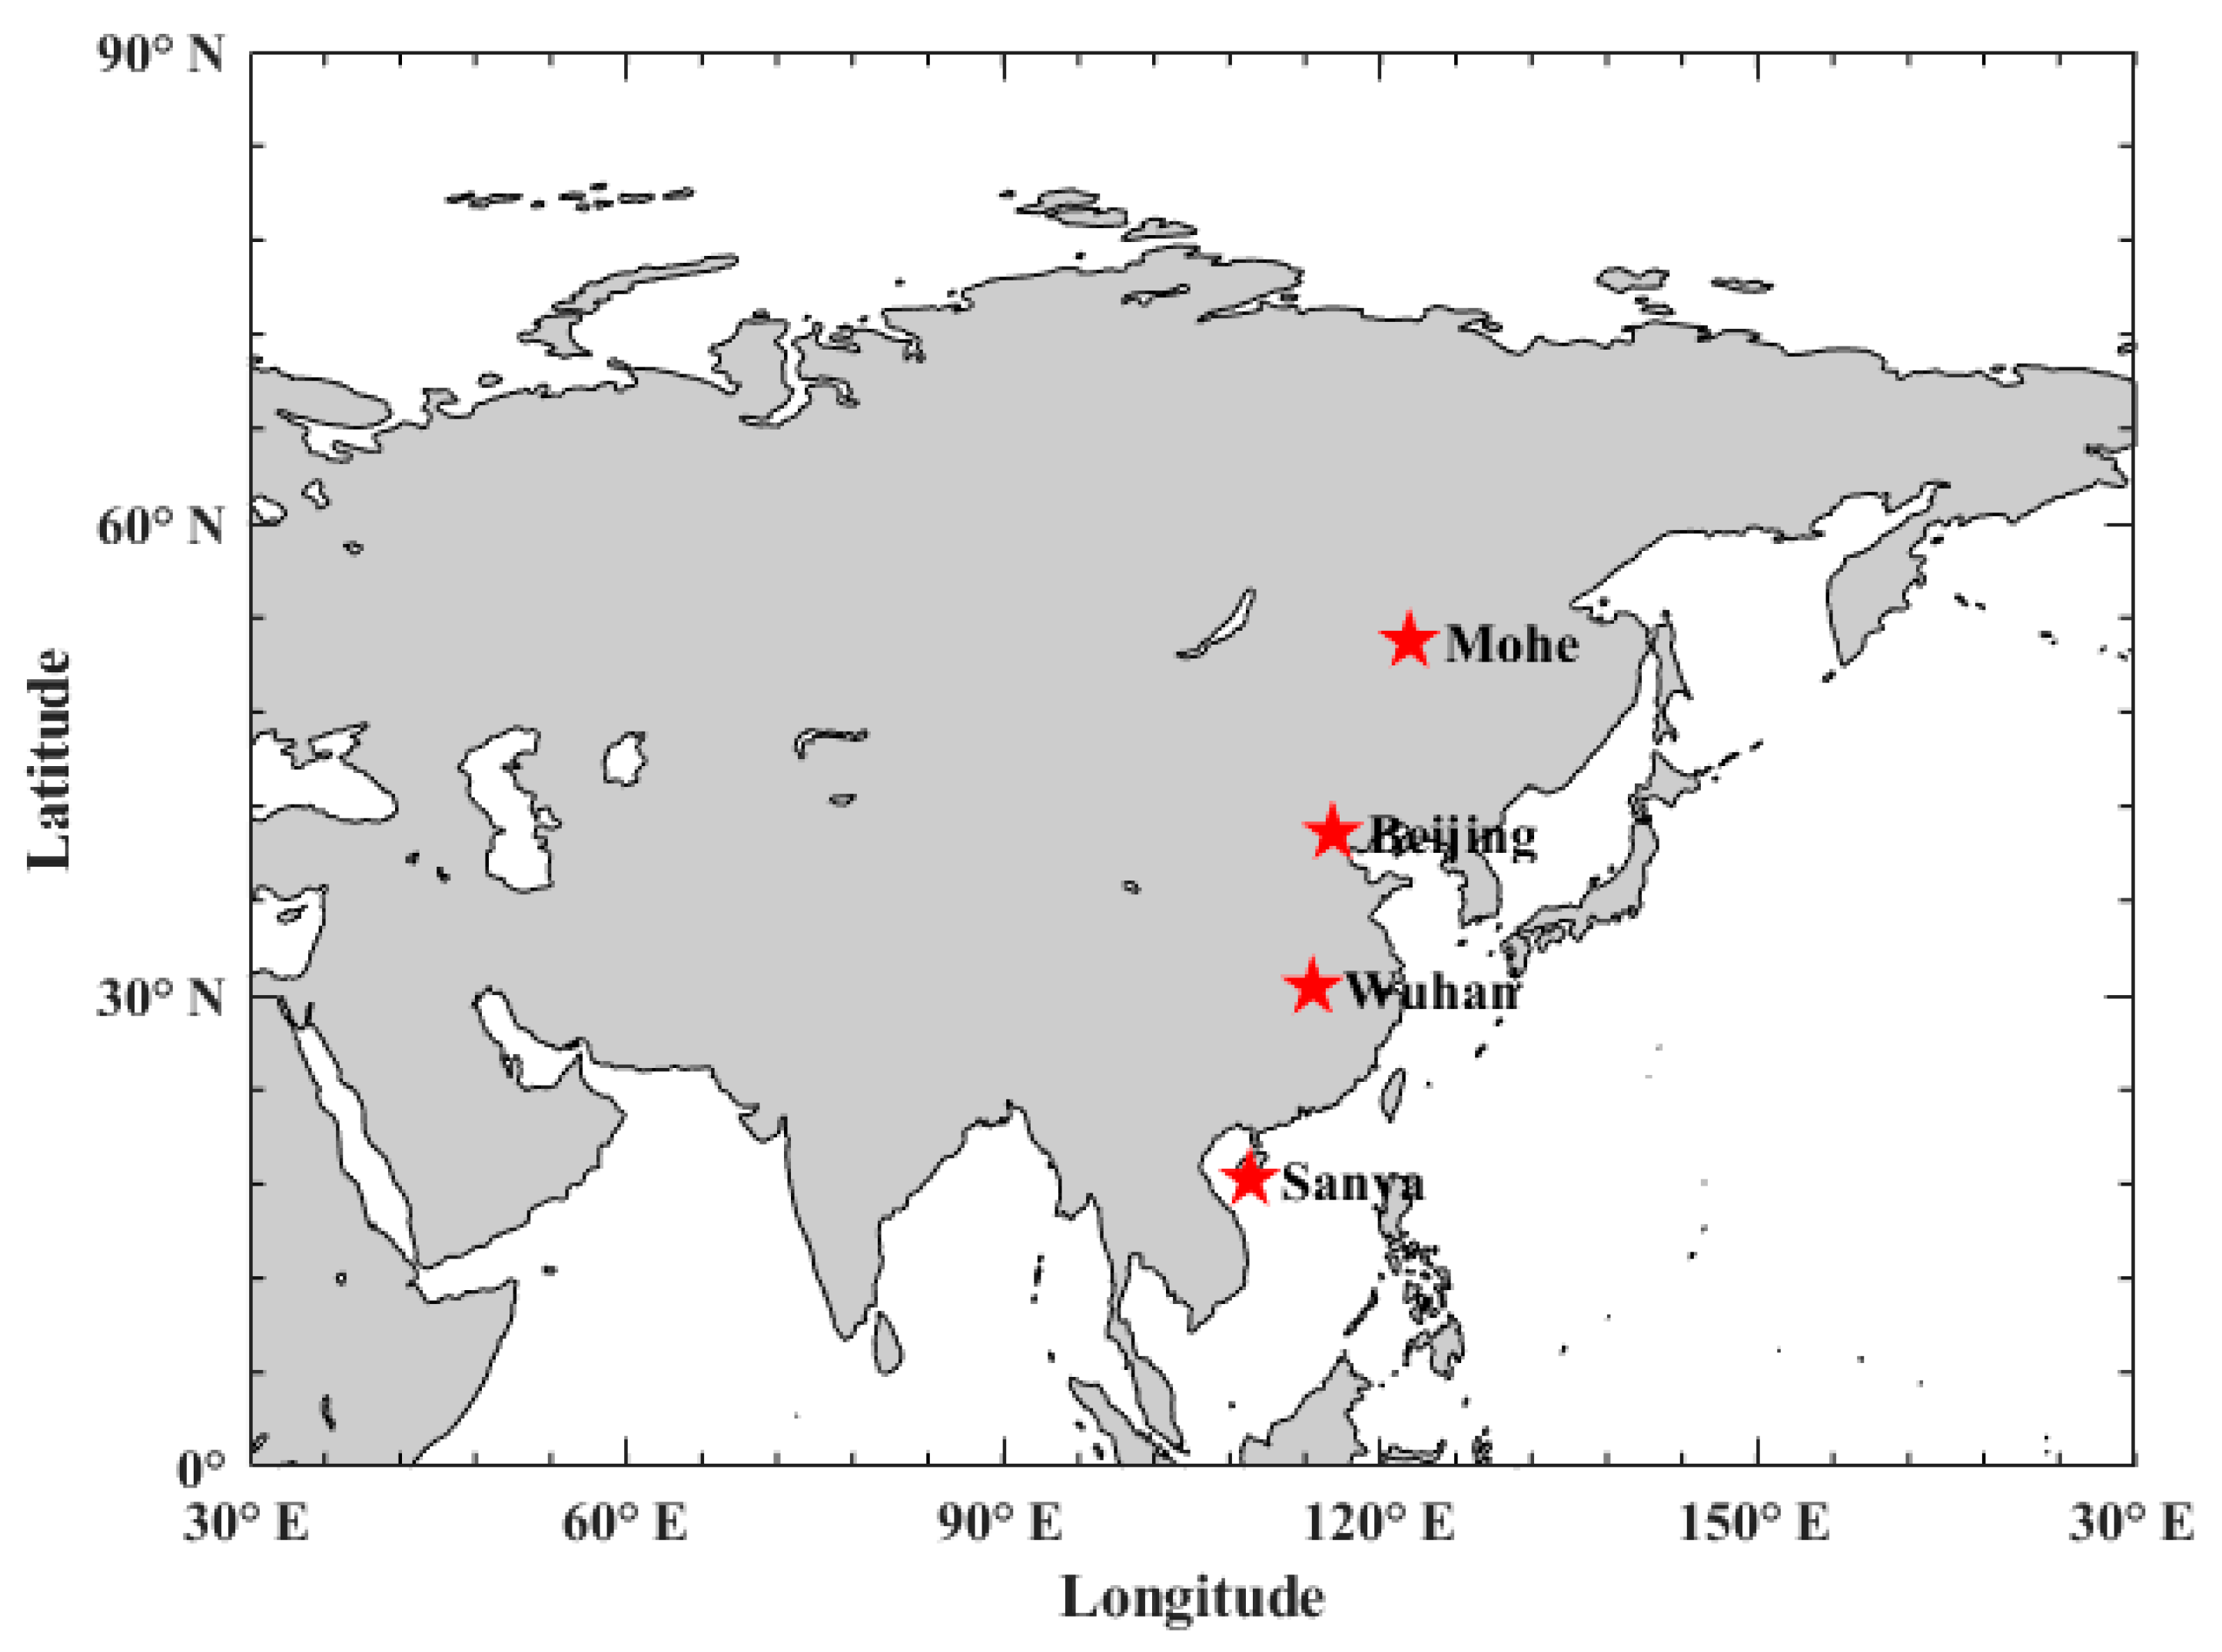
Figure 1. Geographical distribution of Mohe, Beijing, Wuhan, and Sanya meteor radar stations.
Atmosphere 12 00098 g001
Figure 2. Comparison of the monthly mean zonal (a) and meridional (b) wind in the composite year between meteor radar (left column) and Horizontal Wind Model (HWM14) (middle column). The right column is the difference between radar measurement and model prediction.
Atmosphere 12 00098 g002
Figure 3. The relative difference between radar observation and HWM prediction.
Atmosphere 12 00098 g003
Figure 4. Diurnal (DT), semidiurnal (SDT), terdiurnal (TDT) tidal amplitude obtained from Mohe meteor radar measurements (left column) and HWM14 (right column).
Atmosphere 12 00098 g004
Figure 5. Diurnal (DT), semidiurnal (SDT), and terdiurnal (TDT) tidal amplitude obtained from Beijing meteor radar measurements (left column) and HWM14 (right column).
Atmosphere 12 00098 g005
Figure 6. Diurnal (DT), semidiurnal (SDT), terdiurnal (TDT) tidal amplitude obtained from Wuhan meteor radar measurements (left column) and HWM14 (right column).
Atmosphere 12 00098 g006
Figure 7. Diurnal (DT), semidiurnal (SDT), and terdiurnal (TDT) tidal amplitude obtained from Sanya meteor radar measurements (left column) and HWM14 (right column).
Atmosphere 12 00098 g007
Publisher’s Note: MDPI stays neutral with regard to jurisdictional claims in published maps and institutional affiliations.