Review

Moisture Removal Techniques for a Continuous Emission Monitoring System: A Review

Department of Civil and Environmental Engineering, Konkuk University, 120 Neungdong-ro, Gwangjin-Gu, Seoul 05029, Korea
*
Author to whom correspondence should be addressed.
Atmosphere 2021, 12(1), 61; https://doi.org/10.3390/atmos12010061
Submission received: 2 November 2020 / Revised: 20 December 2020 / Accepted: 29 December 2020 / Published: 1 January 2021
(This article belongs to the Section Air Quality)

Abstract

:
A continuous emission monitoring system (CEMS) is a well-known tool used to analyze the concentrations of air pollutants from stationary sources. In a CEMS, the presence of a high moisture level in a sample causes a loss of analytes due to artifact formation or absorption. This issue brings about a bias in the measurement data. Thus, moisture removal is an important pretreatment step. Condensation and permeation methods have been widely employed to remove moisture from the CEMS for gaseous compounds. In terms of particulate matter, dilution methods have been applied to reduce the moisture level in the gas stream. Therefore, condensation, permeation, and dilution methods are critically reviewed in this work. The removal efficiencies and recovery rates of analytes are discussed, as well as the advantages and disadvantages of each technique. Furthermore, the suitable applications of each technique are determined. Condensation methods have not been well documented so far, while permeation and dilution methods have been continuously studied. Many types of permeation materials have been developed. The limitations of each method have been overcome over the years. However, the most reliable technique has not yet been discovered.

1. Introduction

The continuous emission monitoring system (CEMS) has been applied to monitor the air pollutants emitted from stationary sources. An extractive method, in which air pollutants are delivered to analyzers located in a shelter, and an in situ method, in which analyzers are attached directly to an emission stack, are used for the CEMS [1]. The CEMS is usually applied to detect the emissions of air pollutants such as carbon monoxide (CO), carbon dioxide (CO2), sulfur oxides (SOx), nitrogen oxides (NOx), hydrogen chloride (HCl), hydrogen fluoride (HF), ammonia (NH3), water vapor (H2O), particulate matter, etc. Spectroscopy analyzers have been widely installed in CEMS due to the advantage of continuous monitoring and good accuracy. As a spectroscopy analyzer, nondispersive infrared (NDIR) and Fourier transform infrared analyzers have been widely used because they operate consistently with low energy consumption compared to other spectroscopy technologies [2]. However, moisture (H2O) in the gas stream is a significant interference since it affects the accuracy of the NDIR analyzer [3]. Moisture can cause a bias of the NDIR analyzer up to 30% for NO2 (i.e., at a wavelength of 6.21 µm), 20% for SO2 (i.e., at a wavelength of 7.45 µm), and 5% for NO (i.e., at a wavelength of 5.25 µm) [4]. For particulate matter, the particle concentration can be monitored by light scattering analyzers (e.g., optical particle counter or condensation particle counter) [5,6,7,8,9], light absorption analyzers (e.g., spot meters, aethalometer, photoacoustic soot sensor, or laser-induced incandescence) [5,6,10], light extinction analyzers (e.g., cavity ring-down or opacity meter) [5,6,11,12] and microbalance analyzers (e.g., tapered element oscillation microbalance or quartz crystal microbalance) [5,6,13]. Size distributions of particles can be continuously determined using a fast-mobility particle sizer and an electric low-pressure impactor [5,6,14,15,16]. Among these methods, light-scattering meters, opacity meters, Beta attenuation meters, and electrification devices have been widely applied for CEMS [17,18]. However, H2O has a significant effect on the light-scattering method used to measure particulate matter [18,19,20,21]. It was found that light-scattering ratios of sodium chloride particles increased from 1- to 10-fold when the relative humidity increased from 20% to 80%. On the other hand, these values for uranine dye particles were increased 1–2-fold due to their lower hygroscopicity [18]. Zieger et al. (2013) found that light-scattering ratios were increased approximately 5-, 7-, 9-, and 16-fold with respect to (NH4)2SO4, NaNO3, Na2SO4, and H2SO4 particles, respectively, at 85% relative humidity and a 589 nm wavelength [19]. It was also found that the number of particles increased by approximately 50%, and the PM10 concentration increased by as much as 46% when the experiment was conducted at 75% relative humidity [20]. For electrification devices, wet gas streams had significant effects on the probe electrification [17]. It is now well known that the moisture content in the flue gas is high, as shown in Table 1. The United States Environmental Protection Agency (U.S. EPA) stated that moisture is one of the significant bias sources for extractive CEMS [22]. Moisture causes effects such as the absorption of water-soluble gases or artifact formation. For artifact formation in the presence of moisture, HCl may react with NH3 to produce ammonium chloride salt [23]. In a municipal waste incinerator, NH3 was found to react with HCl or SO2 to create ammonia salts such as ammonium chloride or ammonium sulfite [24]. For the absorption, a negative measurement bias for NH3 was found due to condensation [24]. Thirty percent of 10 ppmv SO2 was found to be lost at 20% absolute humidity [22]. The condensed water could also corrode the system and cause a leak [22]. In combination with particles in the gas stream, mud could form and plug the system [22]. Hence, moisture removal is an important issue for extractive CEMS.
Reactions and dissociations of several analytes may occur in two ways as follows [25,26,27,28,29]:
In the first case, moisture is condensed as liquid droplets:
CO2(g) + 2H2O(aq) ↔ H3O+ + HCO3
HCO3 + H2O(aq) ↔ CO32− + H3O+
NH3(g) + H2O(aq) ↔ NH4+ + OH
NH3(g) + HCO3 ↔ NH2COO + H2O
SO2(g) + 2H2O(aq) ↔ H3O+ + HSO3
2NO2(g) + H2O(aq) ↔ NO2- + 2H+ + NO3
2NO2(g) + HSO3+ H2O(aq) ↔ 3H+ + 2NO2 + SO42−
SO2(g) + H2O (aq) → H2SO3
In the second case, moisture remains in the gas phase:
2NH3(g)+SO2(g)+H2O(g) ↔ (NH4)2SO3(s)
NH3(g)+SO2(g)+H2O(g) ↔ NH4HSO3(s)
2NH3(g)+NO2(g)+H2O(g) ↔ (NH4)2NO3(s)
NH3(g) + NO2(g) + H2O(g) ↔ NH4HNO3(s)
To reduce the effect of water vapor, three methods have been used to date. In the first method, both extractive sampling lines and the gas cells of analyzers are heated to prevent water vapor from forming condensation. The high energy consumption caused by a heater is a disadvantage of this method. In addition, air pollutants in contact with a high-energy light source in the analyzer such as UV or IR can cause reactions among the pollutants. Another disadvantage of the method is the measurement bias because of the sample temperature [23]. It was found that the HCl measurement results involved a negative bias when the sample temperature was lower than the stack temperature. In contrast, when the sample temperature was higher than the stack temperature, particulate ammonium chloride might volatilize to produce HCl and NH3, which brought about a positive measurement bias for HCl and NH3 [23]. The second method involves the dilution of flue gas to reduce the concentration of water. However, dilution factors are dependent on the detection limit of the gas analyzer. Therefore, this method requires highly sensitive analyzers that increase the cost of the CEMS. The third method, which has been popularly employed, is the cool/dry method. In this approach, moisture in the flue gas is removed using a moisture removal system. The removal of moisture from the flue gas helps to reduce the energy consumption of a heater, the interference of target compound detection, and artifact formation. Due to the high concentration of moisture in the gas stream emitted from a stack, two types of moisture removal methods are commonly used: condensation and permeation [1]. Condensation processes are generally classified into homogeneous and heterogeneous condensation [36]. In homogeneous condensation, a liquid droplet embryo is formed within the supercooled vapor. On the other hand, in heterogeneous condensation, liquid droplet nucleation occurs at the interface of another phase (e.g., a cold solid wall or particle) at a low temperature [36]. For the permeation method, permeation membranes are divided into dense (i.e., pores of ~0.1 nm) and porous (i.e., pores of ~0.1 µm) types [37]. However, an ideal method has not yet been invented since each of these has limitations [22].
Although moisture removal is an important issue in CEMS, scientific research into this topic is lacking. Almost all moisture removal technologies are presented as patents and commercial products. However, many studies have been carried out on moisture control for other processes such as air conditioning [38,39,40,41,42,43,44], chemical analysis [45,46,47,48,49,50,51,52], clothes drying [53,54,55,56,57], gas turbines [58,59,60], and laundering [61,62,63]. Consequently, the aim of this study is to review the moisture removal methods for extractive CEMS. As for gaseous compounds, condensation and permeation methods are taken into account here. For particulate matter, dilution methods are discussed. The advantages and disadvantages of each gas and particle method will be addressed as well. Furthermore, future research will be suggested to develop the best moisture removal system for CEMS.

2. Methodology

Moisture removal methods for CEMS are systematically reviewed in this study. Google Scholar, Google Patent, ScienceDirect, and the library database of Konkuk University were the databases used to search for references. The scope of the review was condensation and permeation methods for gaseous compounds and dilution methods for particulate matter in CEMS. Since the review work was carried out to determine the development of moisture removal methods for CEMS, publication years of references were not limited. Published patents, peer-review articles, conference papers, books, and standard methods were searched out in the English language. All searches were conducted by May 2020. Keywords including moisture removal, dehumidifier, continuous emission monitoring system, cooler, moisture permeation, moisture membrane, Nafion® dryer, stack dilution sampling, and pretreatment device were used. First, the title and abstract of references were read to select references relevant to the scope of this study. Then, full-text copies of relevant papers were downloaded and read. Bibliographies of the selected references were also used to find more relevant papers. Condensation, permeation, and dilution techniques applied for the monitoring of gaseous compounds and particulate matter were taken into account. For the condensation technique, a schematic diagram of a device, condensation type, temperature, moisture removal efficiency, and loss ratio of an analyte were collected. For the permeation method, the structure of a device, membrane material, membrane selectivity, membrane permeability, temperature, purging rate, moisture removal efficiency, and loss ratio of an analyte were considered. In terms of the dilution method, the flowrate, dilution ratio, temperature, type of particulate matter, and measurement errors were summarized, and schematic diagrams of devices were collected. In addition, the advantages and disadvantages of each technique were studied. The bias of each technique was observed in the study. The advantages and disadvantages were assessed based on the references and the experience of our authors. Application scopes of each technique were recommended based on the characteristics of the technique.

3. Results and Discussion

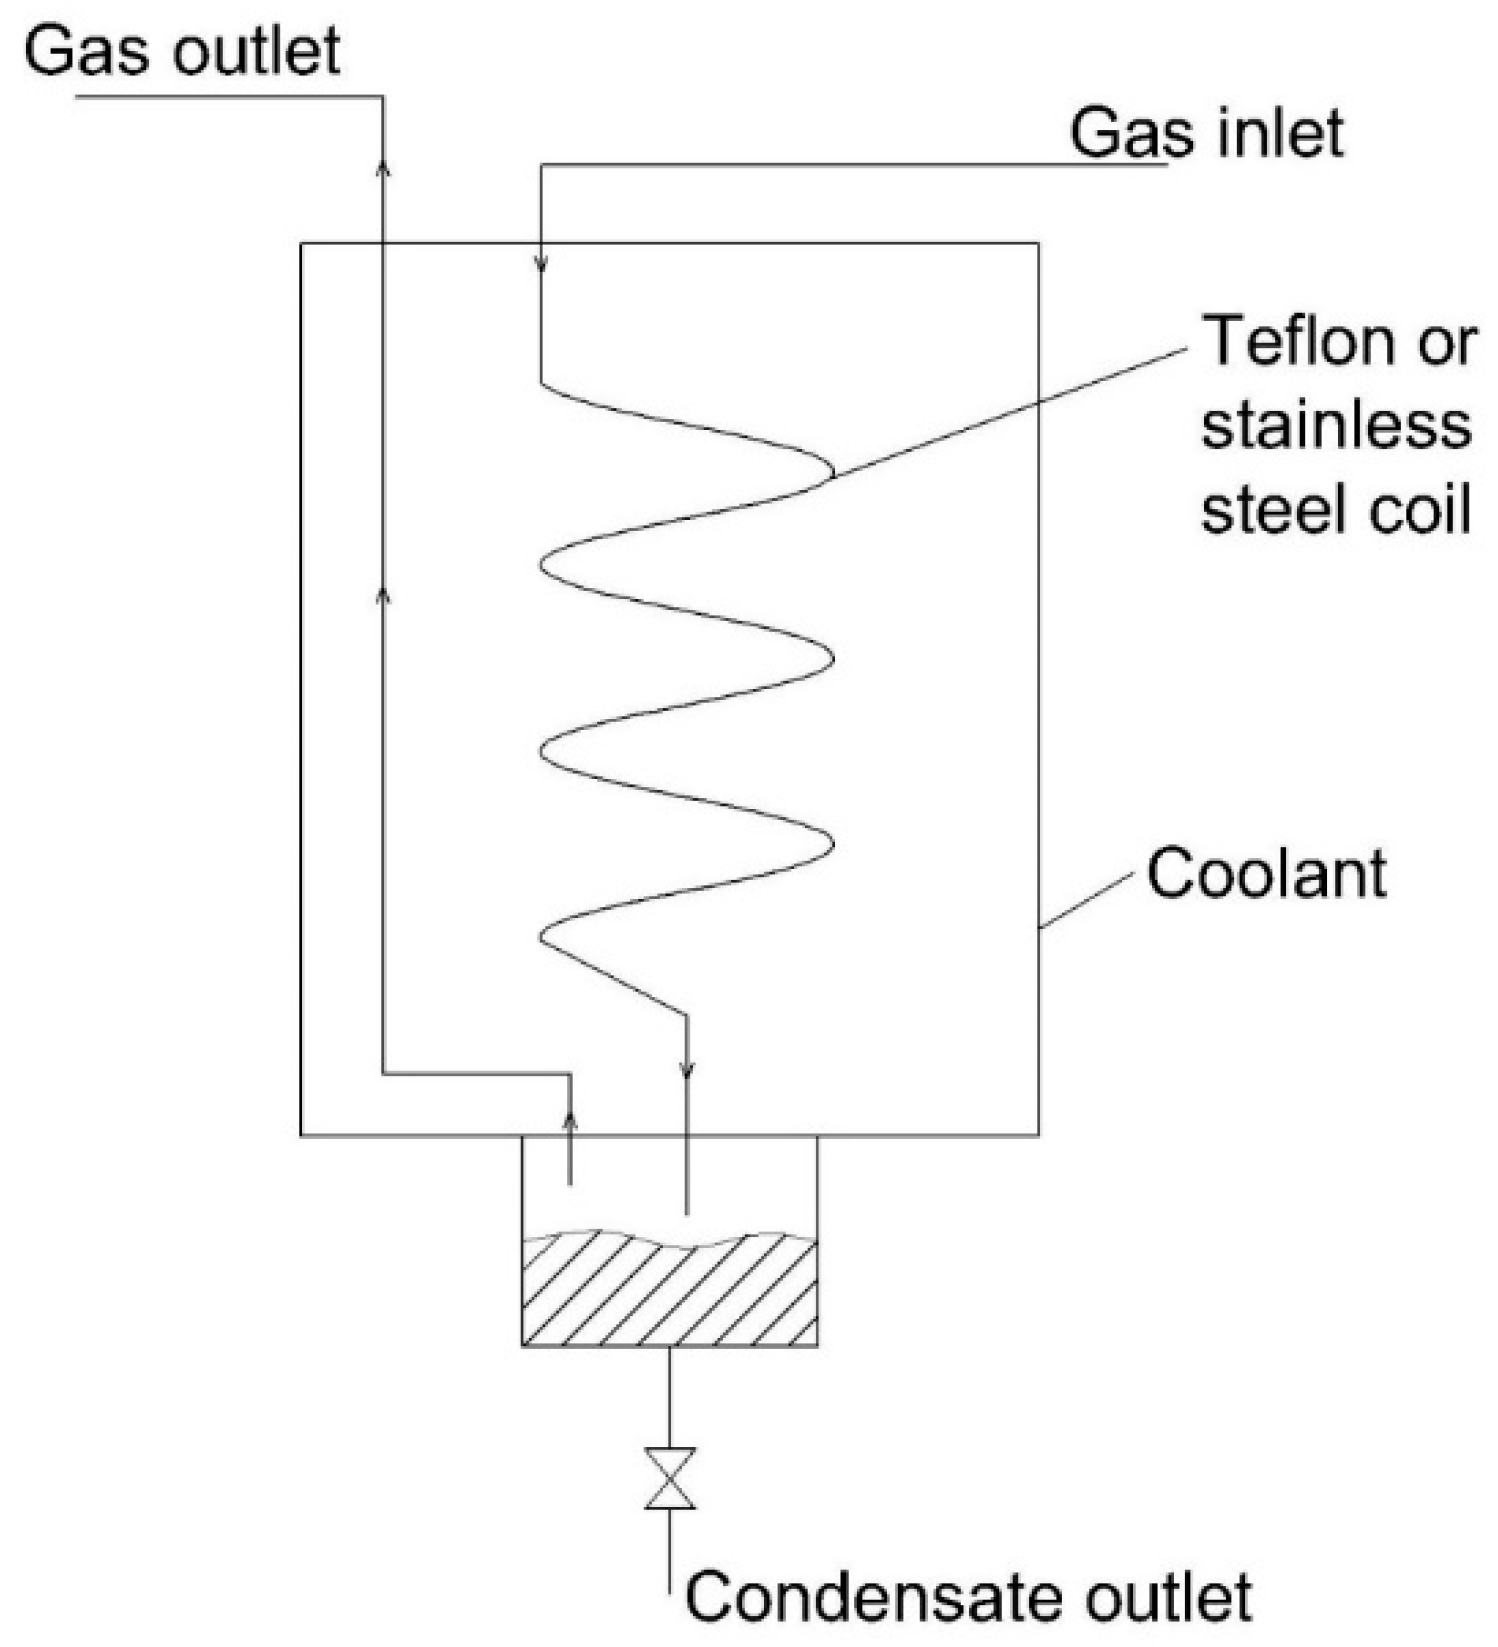
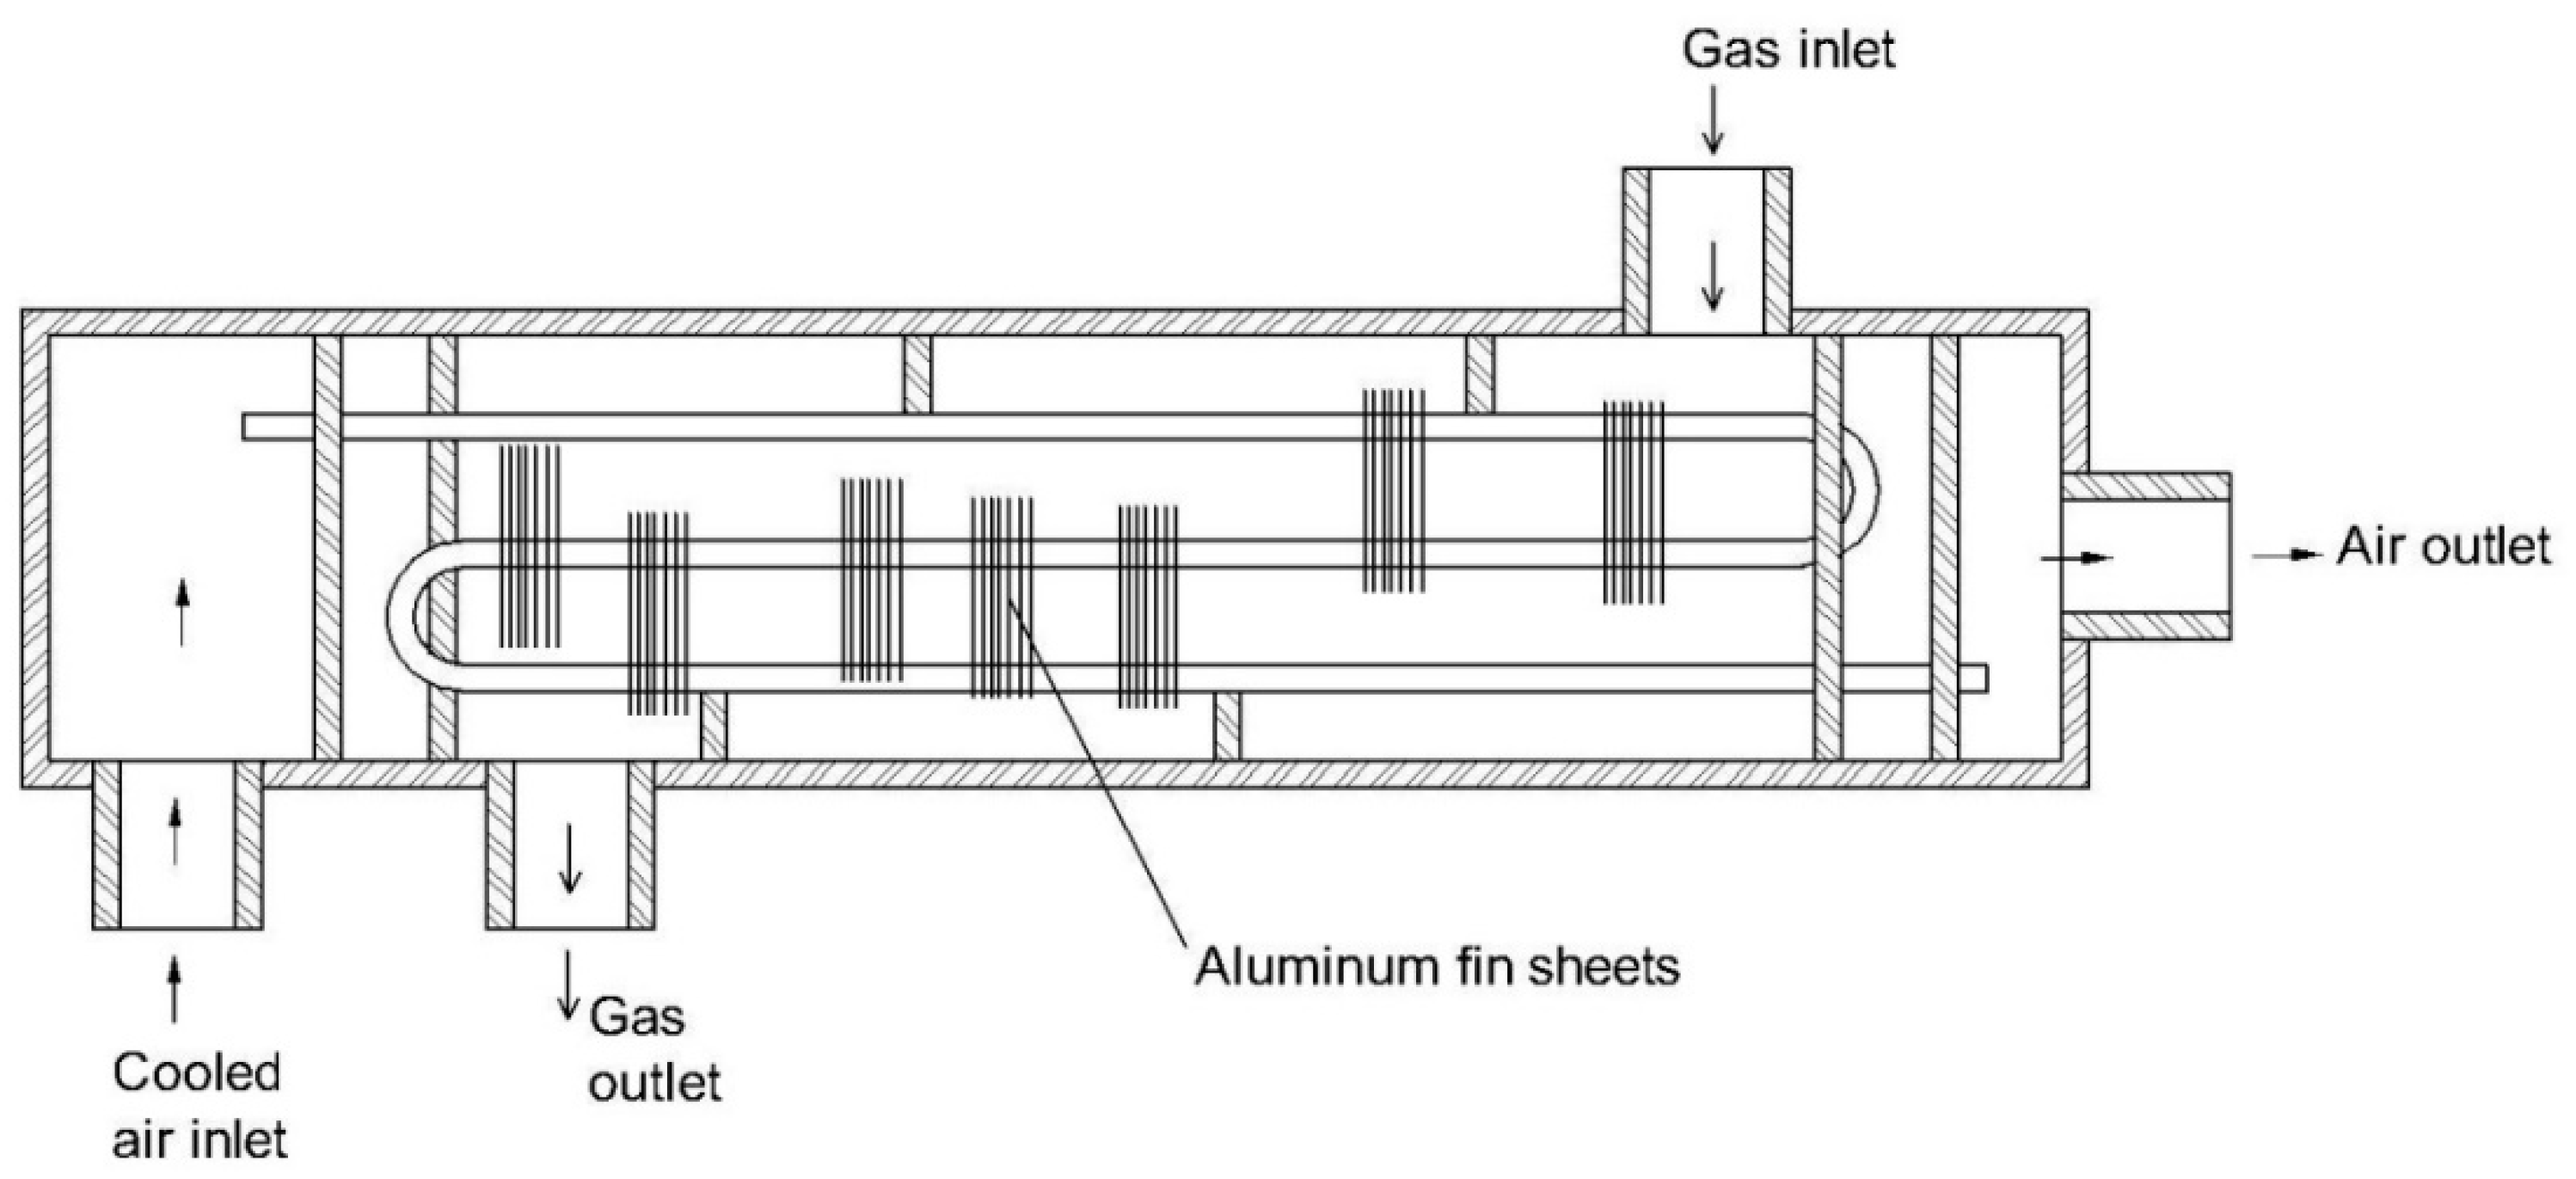
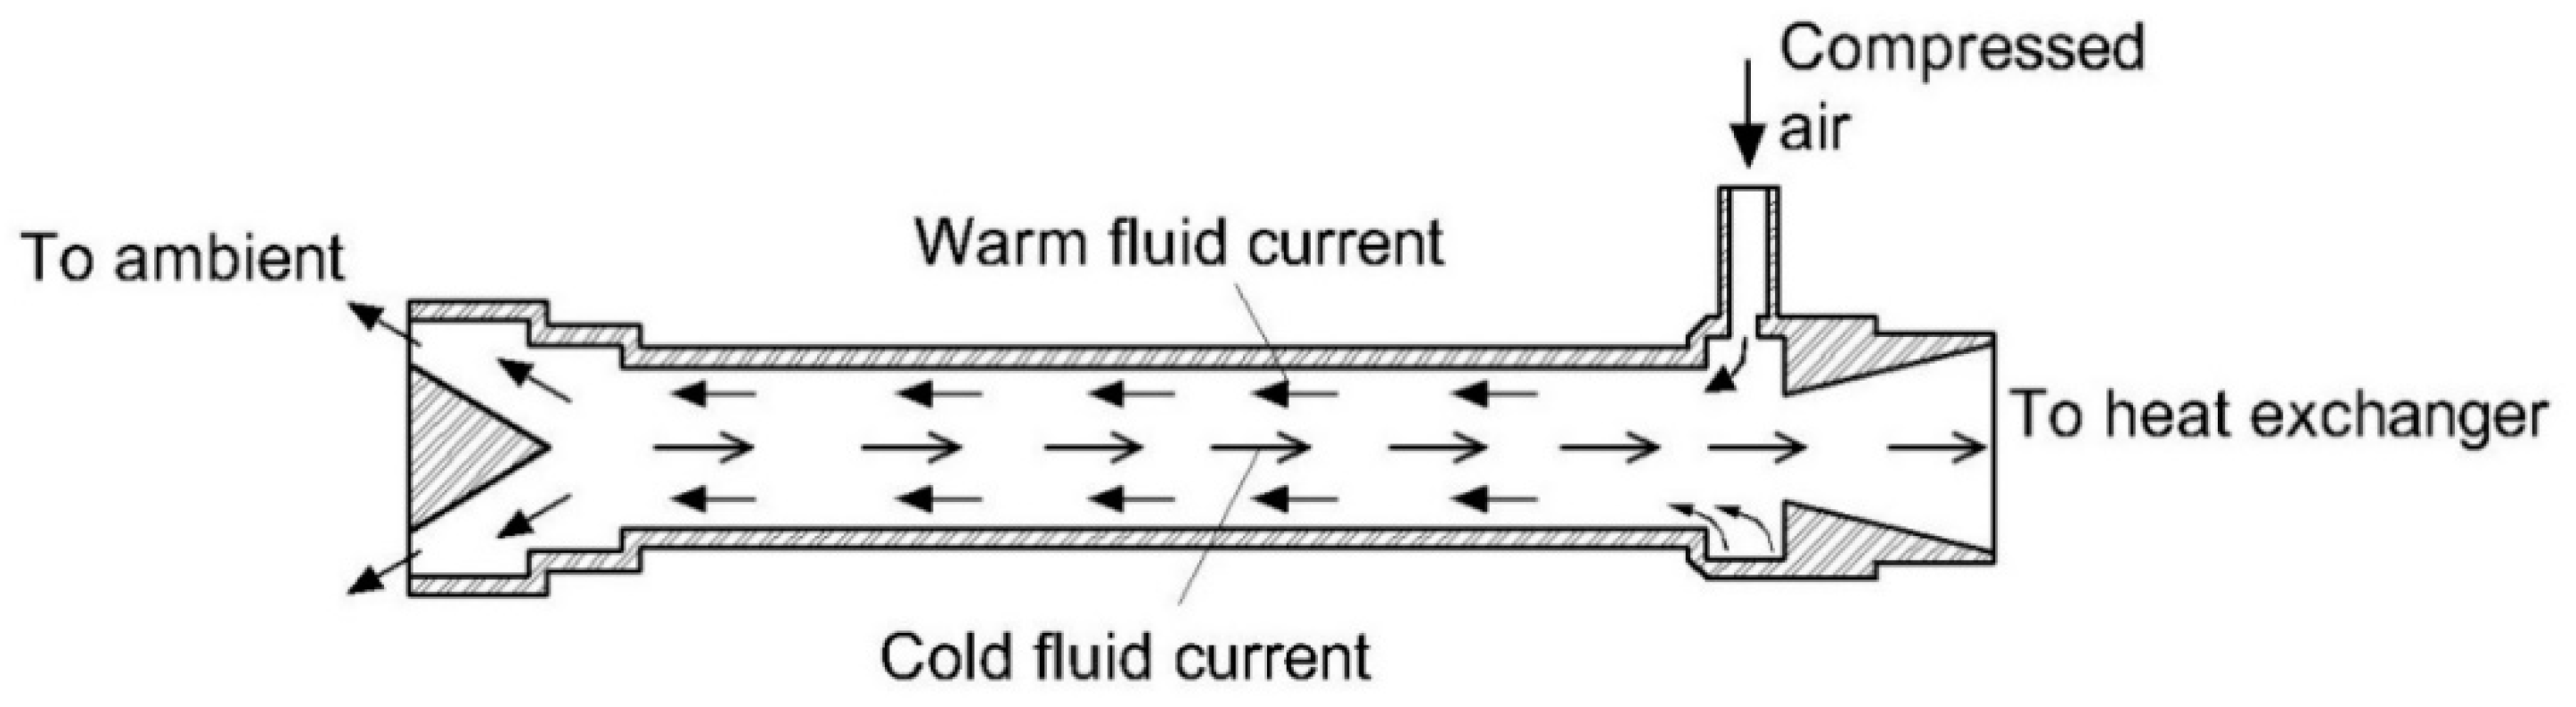
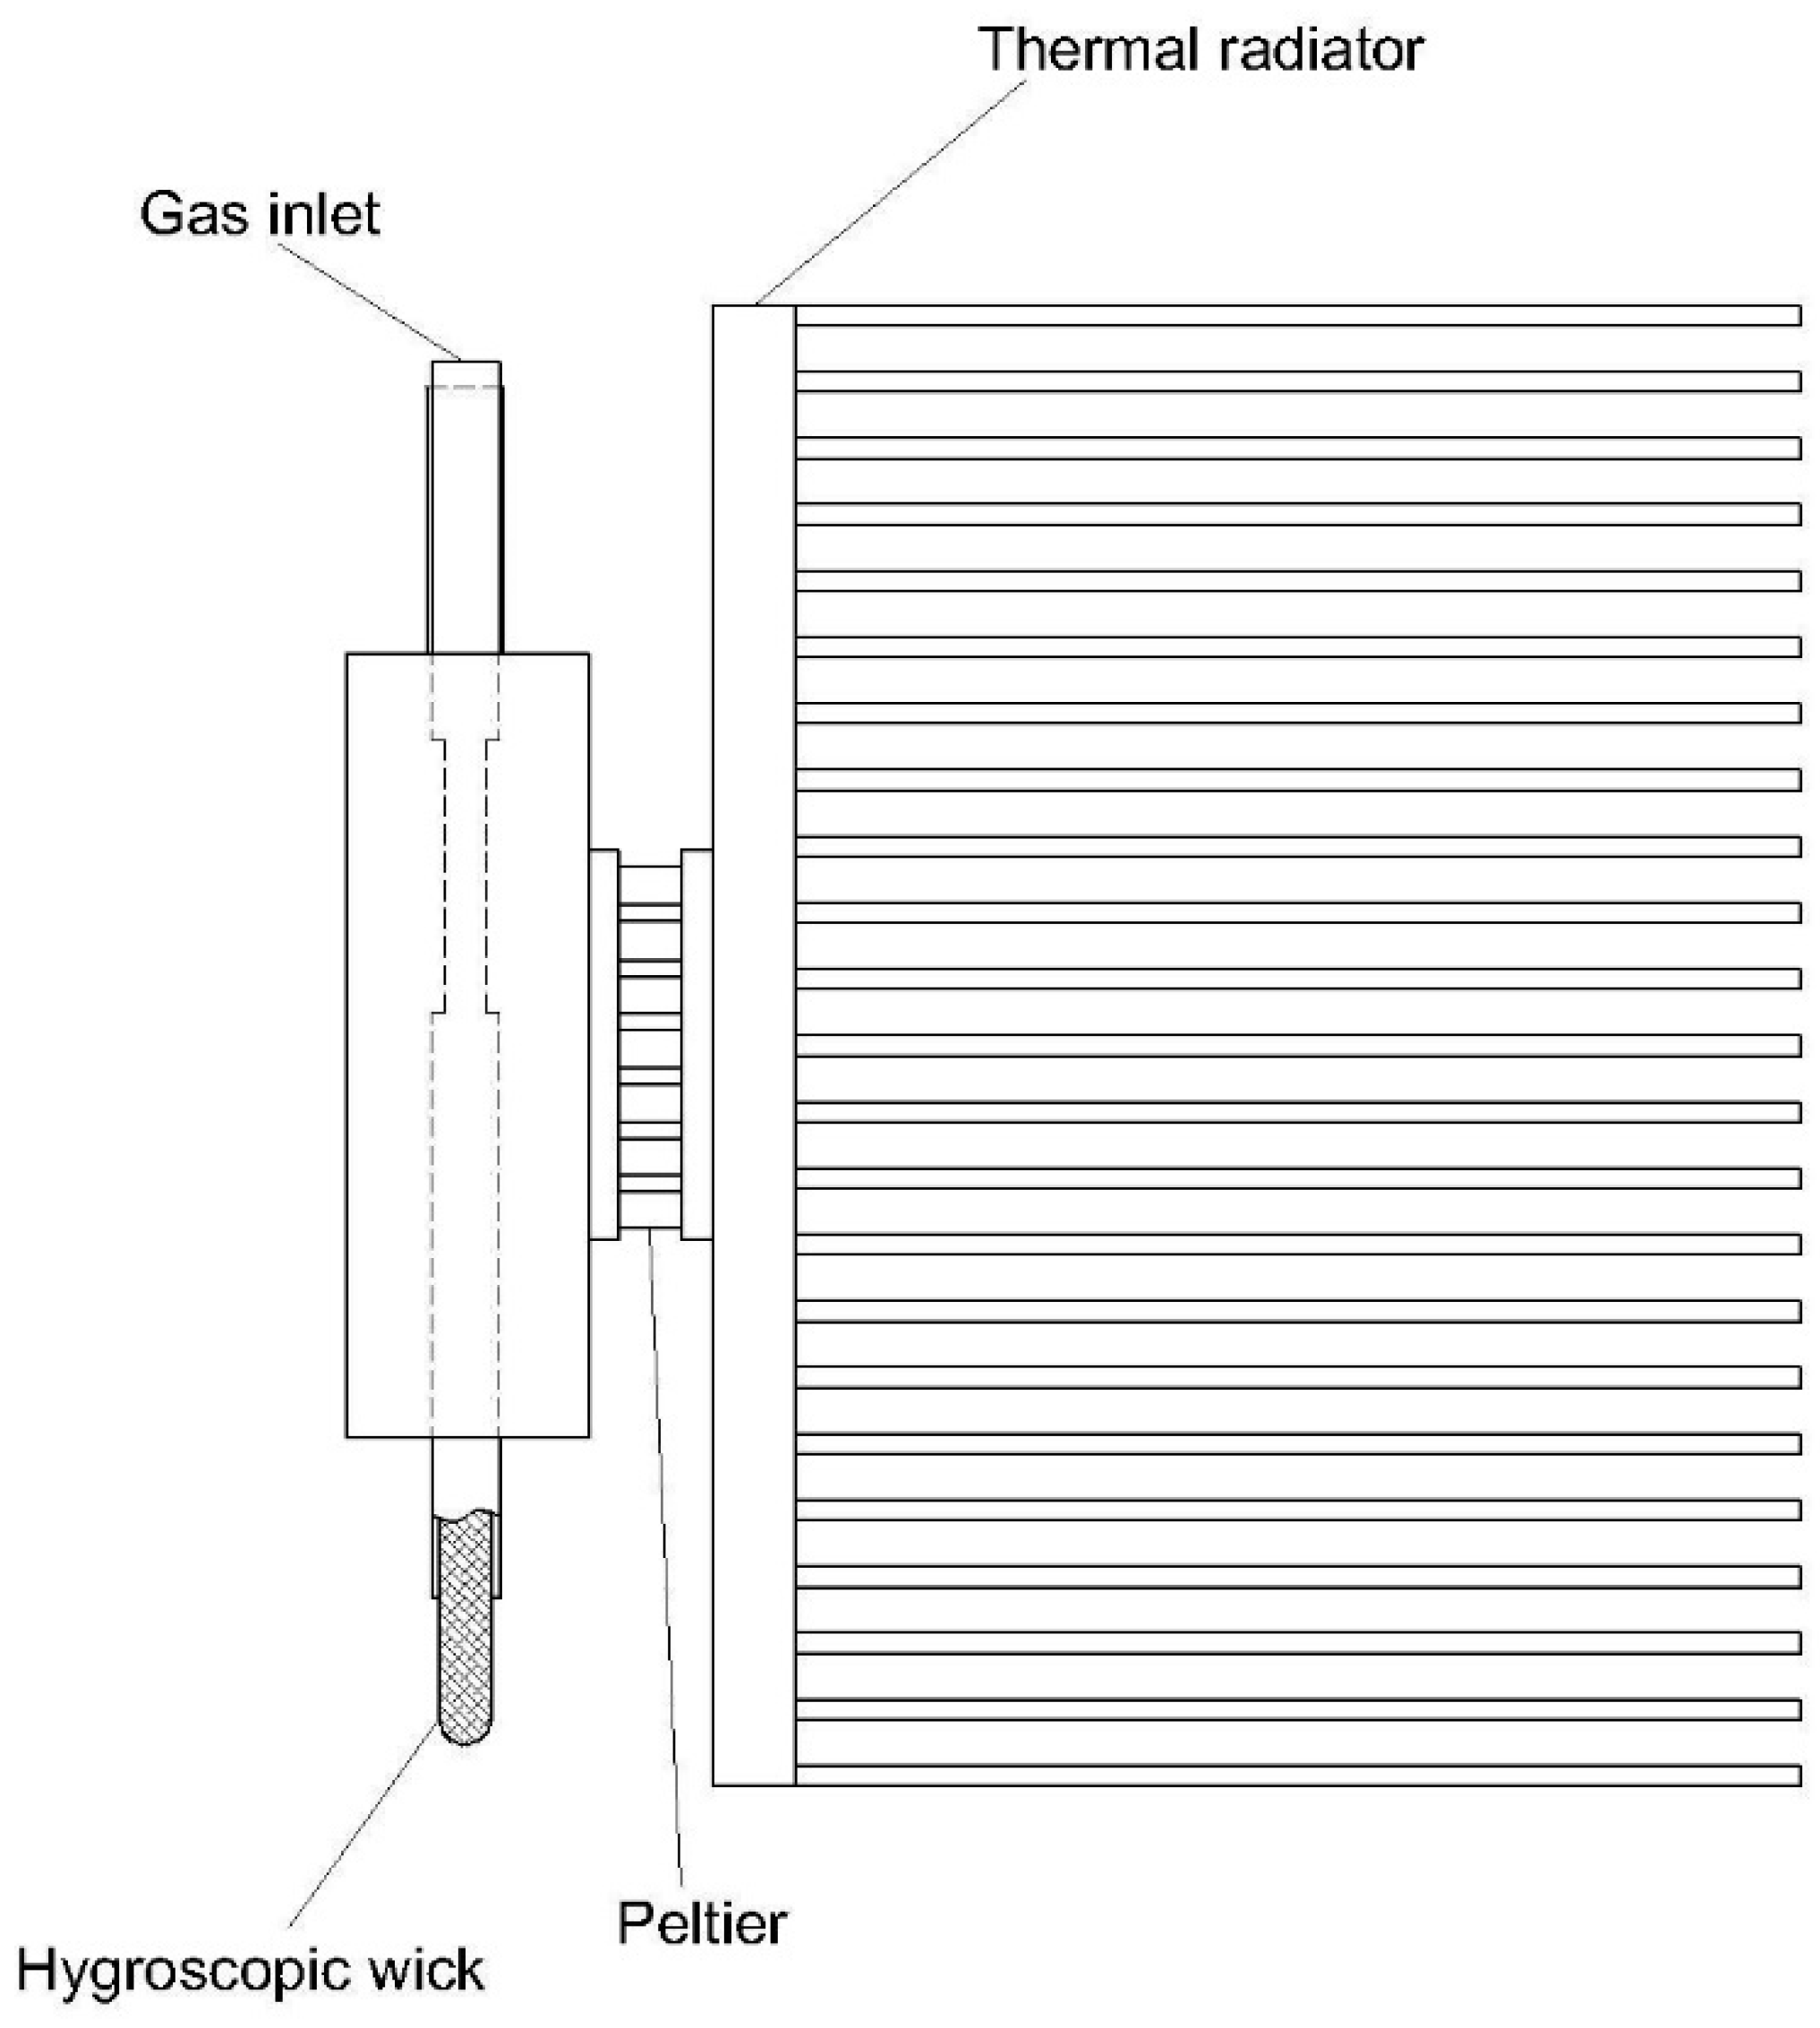
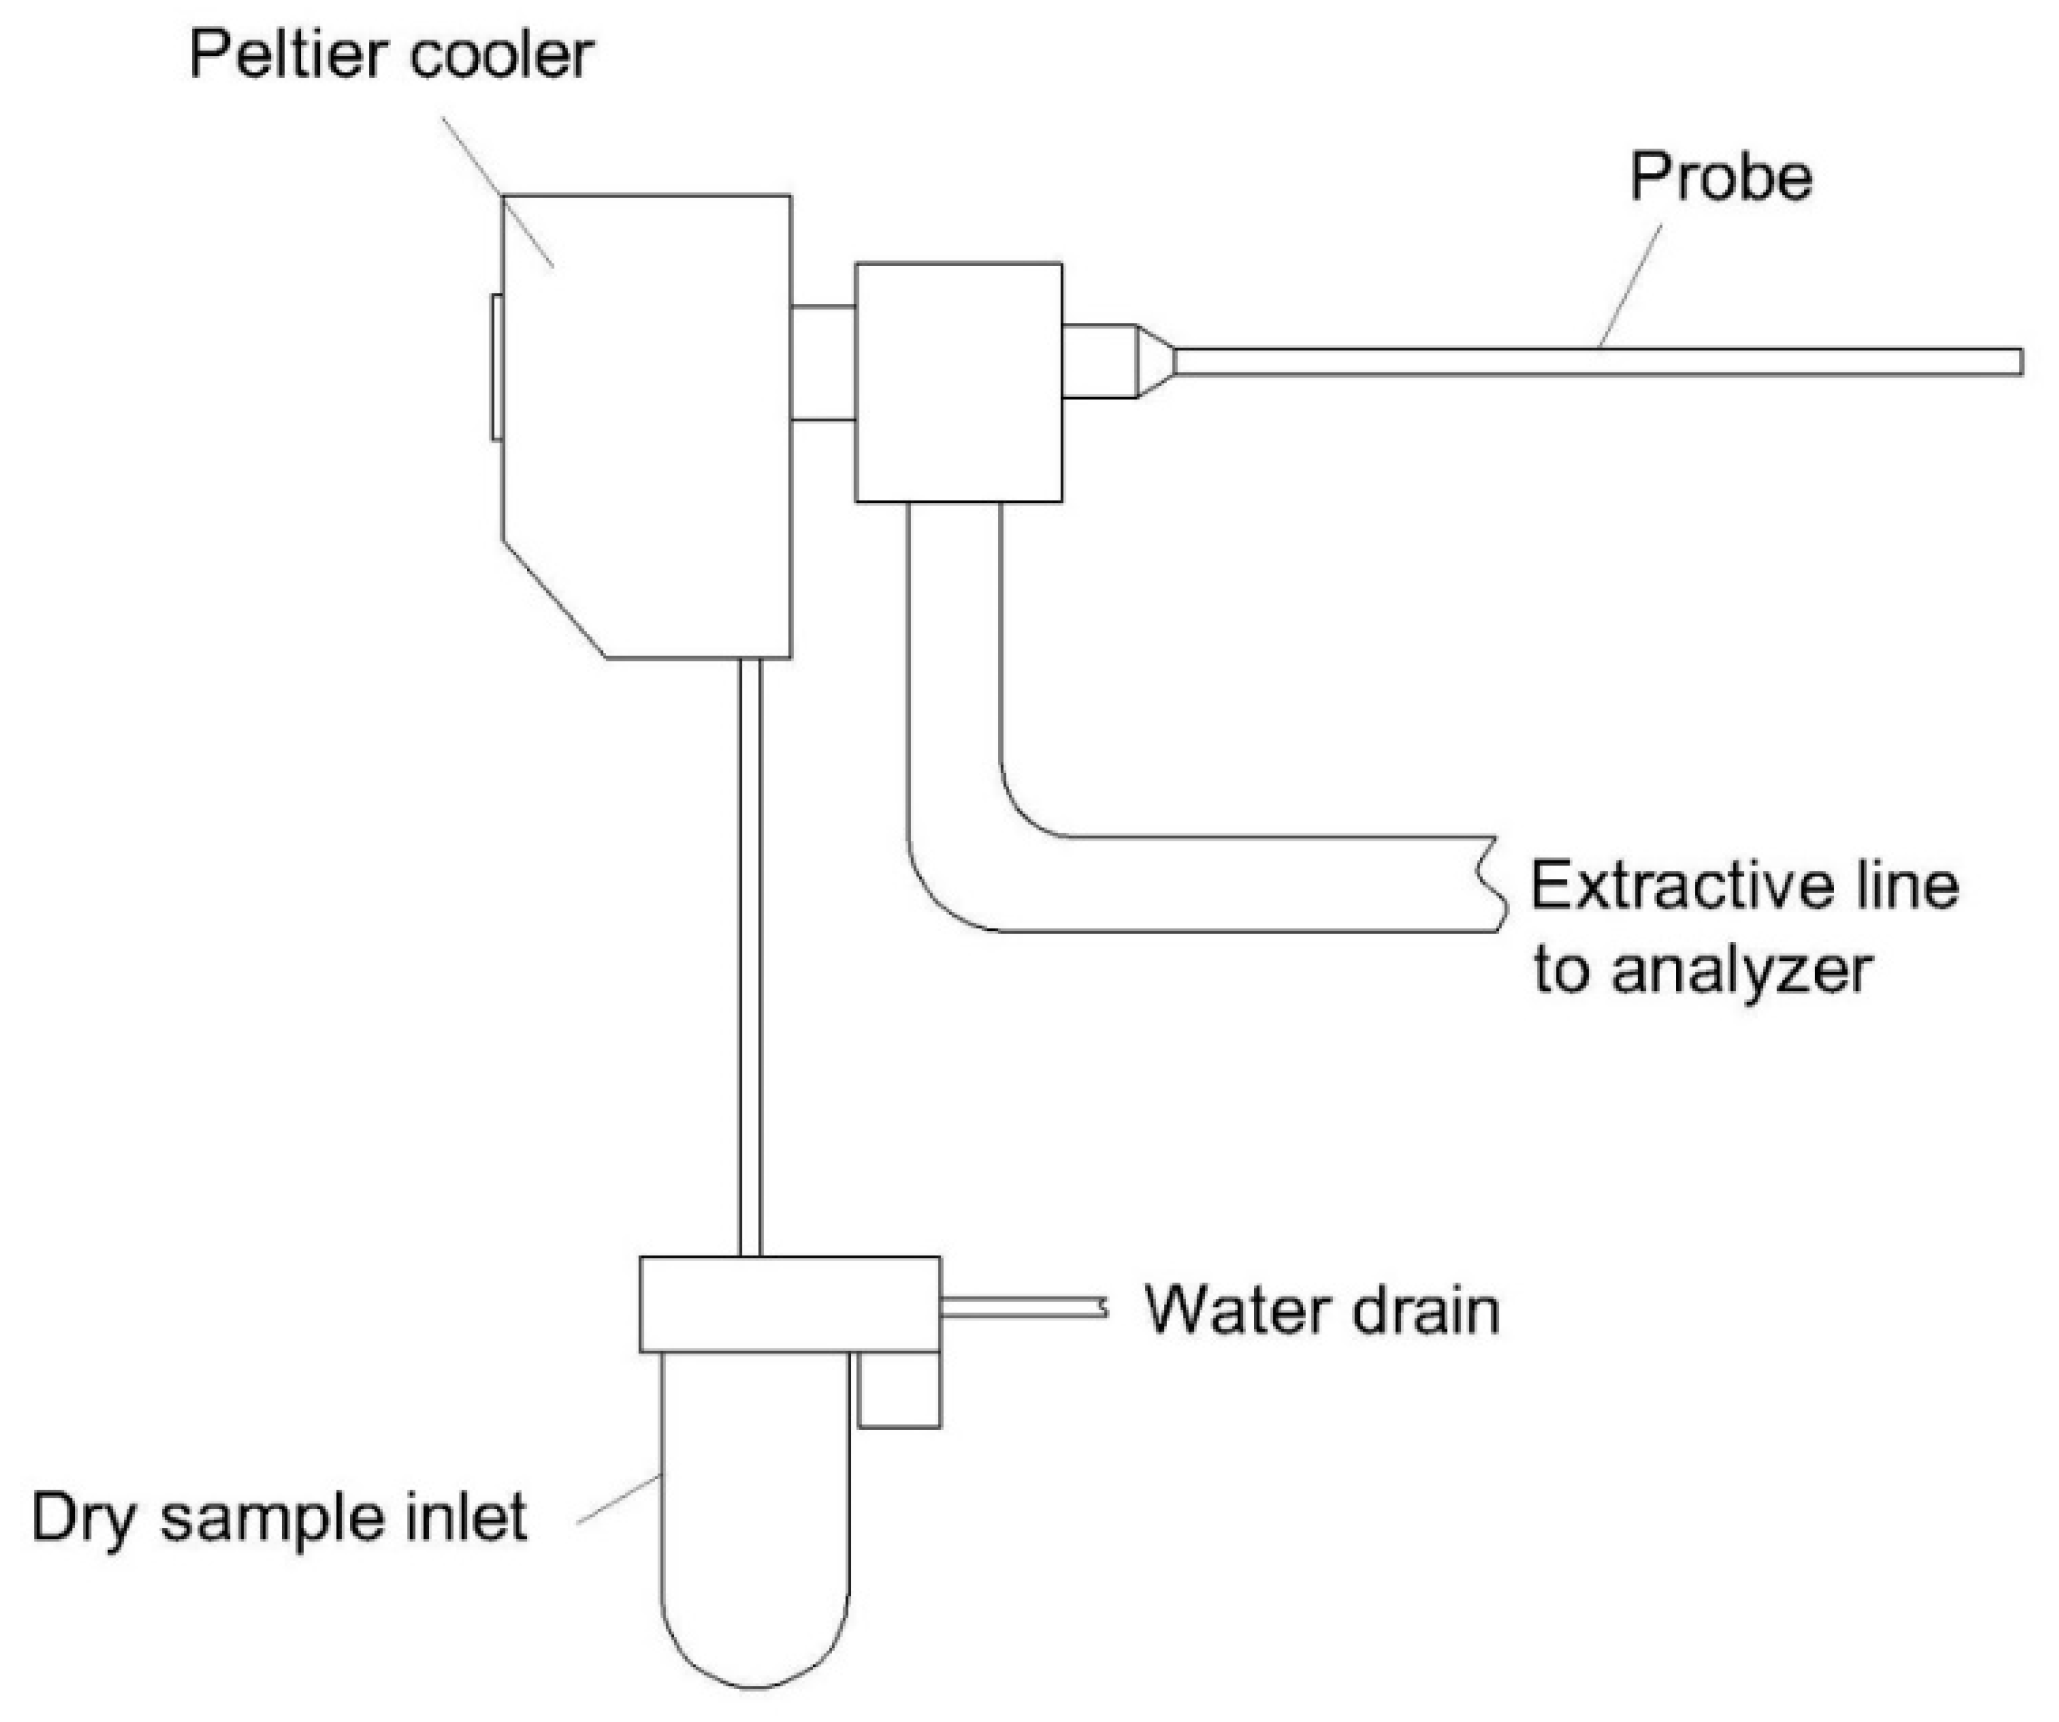
3.1. Condensation Method

On the basis of water physical properties, the temperature of the flue gas in the extractive line was reduced below the dew point to condense the water vapor. The condensation system must be suitable for the flow rate and moisture concentration of the sample gas. Moreover, the structure of the system must avoid contact between the condensed water and the dried flue gas. To decrease the temperature of the gas stream, two technologies have generally been employed: refrigeration using a coolant and Peltier.
The typical structure of a refrigerated system is shown in Figure 1. On the basis of this principle, several apparatuses have been developed. Dowling (1980) invented a moisture removal system based on the refrigerated method with an improvement to the air-to-air and air-to-refrigerant heat exchanger [64]. The exchanger consists of a bundle of vertical tubing in a housing (Figure 2). Parallel sheet metal fins are used to hold the tubing. Moisture is condensed and deposited on the sheet and then drips down the bottom of the housing due to gravity. The advantage of this system is the absence of the water separator. Moreover, the fin sheets help to increase the turbulence of the air and liquid flow, which protects the surface of the sheet to stave off fouling [64]. Nanaumi and Baba (1980) also improved the heat exchanger for the refrigerated system [65]. The main novelty of this invention is the use of an extra heat exchanger to cover the heat exchanger of the refrigerated system to precool the inlet air [65]. These two inventions improved the cooling efficiency, which helped to remove more moisture with respect to a high loading capacity. The principle of both inventions is heterogeneous condensation. The moisture was removed under liquid phase, and most of the droplets were condensed on the cold surface of a device. Thus, the loss of highly water-soluble compounds would occur.
A two-stage moisture removal system was developed by Basseen et al. (1988) [66]. First, the inlet air was precooled to −40 °C using a refrigerator to reduce the air temperature and remove some of the moisture. The flue gas was continued, introducing it to the second stage, which consists of dual desiccant beds to adsorb the remaining moisture content. These beds are alternatively working and regenerating. The system can reduce the humidity from about 15% to 1% [66]. In this invention, the moisture is also condensed by way of a heterogeneous process. The phase of water is solid, which is suitable for highly water-soluble compounds. Due to the two stages of moisture removal, the device can operate at high moisture loading. Moreover, the moisture removal efficiency of the device is also high. However, a desiccant could adsorb certain compounds, which affected the selectivity of the device.
In particular, Tosi (2009) used a vortex tube to cool the flue gas to the dew point temperature [67]. In the tube, the vortical motion of air at high speed (i.e., a moving hot stream with a different direction to that of the cold stream) induced cold air, which was introduced to the heat exchanger to reduce the temperature of the inlet gas (Figure 3) [67]. The condensation of water vapor is a homogeneous process in this case. The advantage of this system is its low energy consumption compared to a refrigerated technology. However, due to the direct contact with condensed water in a heat exchanger, water-soluble gases can be absorbed in water, which might affect the accuracy of the analytical results.
The advantages of the refrigeration-based method are the high cooling efficiency, high working capacity (i.e., high air flow loading), and typical cooling technology. However, a refrigerator is a complex system (e.g., evaporator, pump, valves). Therefore, it leads to an increase in the dimension of the removal system and the maintenance cost. To overcome this problem, a Peltier chiller was used instead of a refrigerator. The moisture removal system based on refrigeration has more volume than the Peltier system. However, the large volume of the system causes the dilution of the target compounds due to a mixing effect. Consequently, the accuracy of the analytical data will decline [68]. For a moisture removal system with a small volume, a Peltier is a good choice of cooling device. A Peltier has been used to cool the flue gas instead of a refrigerator or vortex tube. Chapman et al. (1980) developed a moisture removal system using a Peltier block for the heat exchanger (Figure 4) [68]. Water vapor condensed under solid state and then settled to the bottom of the system by gravity. The diameter of the inlet embodiment was 1.58 to 4.76 mm, and that of the outlet embodiment was 3.17 to 6.35 mm [68]. The condensation of the moisture in this device is a heterogeneous process. The advantage of the device is that it is suitable for highly water-soluble compounds because moisture is removed in the solid phase. However, since the cooling efficiency of a Peltier is low, the device cannot be applied for high inlet temperature gas or high moisture loading. Groger (1988) combined a condensate coil using a Peltier cooling element with a fine membrane filter to remove the moisture from a sampling gas stream [69]. The flue gas entering the coil was cooled to about 4 °C. In the coil, the water vapor was condensed, 90% of which was removed by a drain pump. The distance between the outlet coil and the inlet pump was short. Hence, the condensate was continuously and immediately extracted to avoid the absorption of target gas in water. The remaining moisture in the form of aerosol (about 5%) continued to be filtered by the fine filter [69]. The condensation process of the moisture in this invention was heterogeneous. The advantage of this invention is the high removal efficiency of moisture. However, using a filter to get rid of water aerosol will also produce water droplets on the surface that can absorb target gases. Groger and Groger (1989) proposed an apparatus to remove moisture with a cooling tube designed as a conical taper [70]. The cone angle was 5°. The inlet gas entered the cooler at the bottom (above the condensate discharge socket) as the cross-section of the tube produced a countercurrent flow (i.e., the cyclone effect). The outlet of the gas was at the top of the tube. Due to this design, the retention time of the flue gas in the cooler was longer with a smaller surface area of the tube. This helped to simplify the manufacture and reduce the size of the moisture removal device [70]. In this invention, the phase of H2O was changed from a gas to a liquid by a heterogeneous condensation process. This invention only improved the contact surface in a cooling tube, which helped to improve the moisture removal efficiency. However, the device did not overcome the loss of target analytes due to an absorption effect. A probe assembly for sampling, coupled with a Peltier-based cooler, was manufactured by Bacharach, Inc., New Kensington, PA, USA. The device could work at a flow rate of 1.5 L/min (Figure 5) [71]. An advantage of this in situ cooler is the reduction in energy consumption for an extractive line because moisture is removed before entering the extractive line, which helps to reduce the heating temperature of the line. However, the loss of target compounds due to water droplets is a drawback of this invention. In general, the advantages of the Peltier-based heat exchanger are its low cost, simple construction, and reduced energy consumption. However, the cooling efficiency of the Peltier is lower than that of the refrigerator and of the vortex tube. Therefore, the Peltier tube could be applied for low-flow-rate sampling.
In our research (see Supplementary Materials), we found that the heat exchanger to remove moisture from a sampling gas under liquid phase reduced inlet SO2 by approximately 20% (i.e., the inlet concentration was 1000 ppmv) and that under solid phase it reduced inlet HCl by up to 50% (i.e., the inlet concentration was 50 ppmv). Therefore, a correction factor for each target gas should be applied to the final analytical results. However, the concentration of emission gas is varied, and the removal efficiency of the moisture removal system is not consistent. Hence, a more optimal measure should be taken. In the condensation method, water can be removed under solid or liquid phase. The advantage of the condensation method is its suitability for removing a high concentration of water from a high loading air volume. However, the condensate might affect the target gases. When the condensate is collected under the liquid phase, the absorption of soluble gases such as SOx, NOx, HCl, and NH3 can occur. It was reported that the loss of ozone was approximately 10% at 30% relative humidity and 40% at 80% relative humidity when the condensation method was applied to remove moisture for ozone measurement. Furthermore, SO2 was found to be lost at rates of 19.3%, 29.3%, and 61.5% at relative humidities of 30%, 50%, and 80%, respectively, when a cooler was used to remove the moisture [72]. Lee et al. (2019) investigated the effect of a cooler as a moisture pretreatment device in the analysis of methyl ethyl ketone (MEK), isobutyl alcohol (i-BuAl), methyl isobutyl ketone (MIBK), butyl acetate (BuAc), and styrene [73]. These are very highly water-soluble odorous compounds. It was reported that the losses of i-BuAL, MIBK, BuAc, and styrene were approximately 19%, 4%, 5%, and 10%, respectively, in association with 80% relative humidity. In addition, the reproducibility of their concentrations was approximately 8–31%. This indicated that the water liquid in the cooler kept absorbing and desorbing the analytes [73]. The U.S. EPA stated that HCl and NH3 are lost in the H2O condensate in a condenser [23,24]. Measurement bias of total hydrocarbon emitted from a hazardous waste incinerator was found when a refrigerant moisture removal device was used because VOCs and organic air pollutants might comprise highly, poorly, and non-water-soluble compounds [23]. On the other hand, if the condensate is removed under the solid phase, the absorption of soluble gases can be avoided. Several studies addressed a good recovery rate for highly water-soluble compounds when the moisture was removed under solid phase. It was found that the loss of SO2 at 150 ppmv was less than 2% when the moisture was removed at the solid phase (i.e., frost) [72]. Likewise, the losses of MEK, i-BuAl, MIBK, and BuAc at sub-ppbv level were 0%, 3.4%, 0.5%, and 2.1%, respectively [73]. Son et al. (2013) found that H2S (23 ppbv), CH3SH (16 ppbv), dimethyl sulfide (13 ppbv), and dimethyl disulfide (8 ppbv) had a recovery rate over 97% when the moisture in the sample was removed at the solid phase [52]. Nevertheless, these studies were not conducted with respect to air pollutants in the ambient air with low moisture content rather than emission gases from a stack. Moreover, HCl or NH3 at the atmospheric conditions could still be absorbed on the ice surface due to the hydrogen bond [74,75]. Thus, more investigations should be implemented. In general, the advantages of the condensation method are the low cost, simple structure, and easy operation and maintenance. However, the loss of target analytes is a serious issue with the method. Moreover, the treatment of drain water is another drawback of the condensation method. Consequently, the condensation method is recommended to be used for the CEMS of poorly water-soluble compounds such as CO, CO2, NO, and CH4 when the moisture is removed under a liquid phase. On the other hand, if moisture is removed under a solid phase, higher water-soluble gases such as SO2 or NO2 could be applied. More comprehensive studies should be carried out to investigate the influence of the solid phase. A conversion process of highly water-soluble analytes to poorly water-soluble analytes would be an alternative when the moisture is removed under liquid phase. For example, the U.S. EPA suggested that a catalytic converter could be applied to convert the NH3 in the sample gas to NOx [24]. Then the sample gas could penetrate a condenser to remove moisture before moving into a NOx analyzer [24]. The summary of condensation methods with respect to different inventions is shown in Table 2. The condensation process, advantages, disadvantages, and recommendations of applicable analyte are listed.

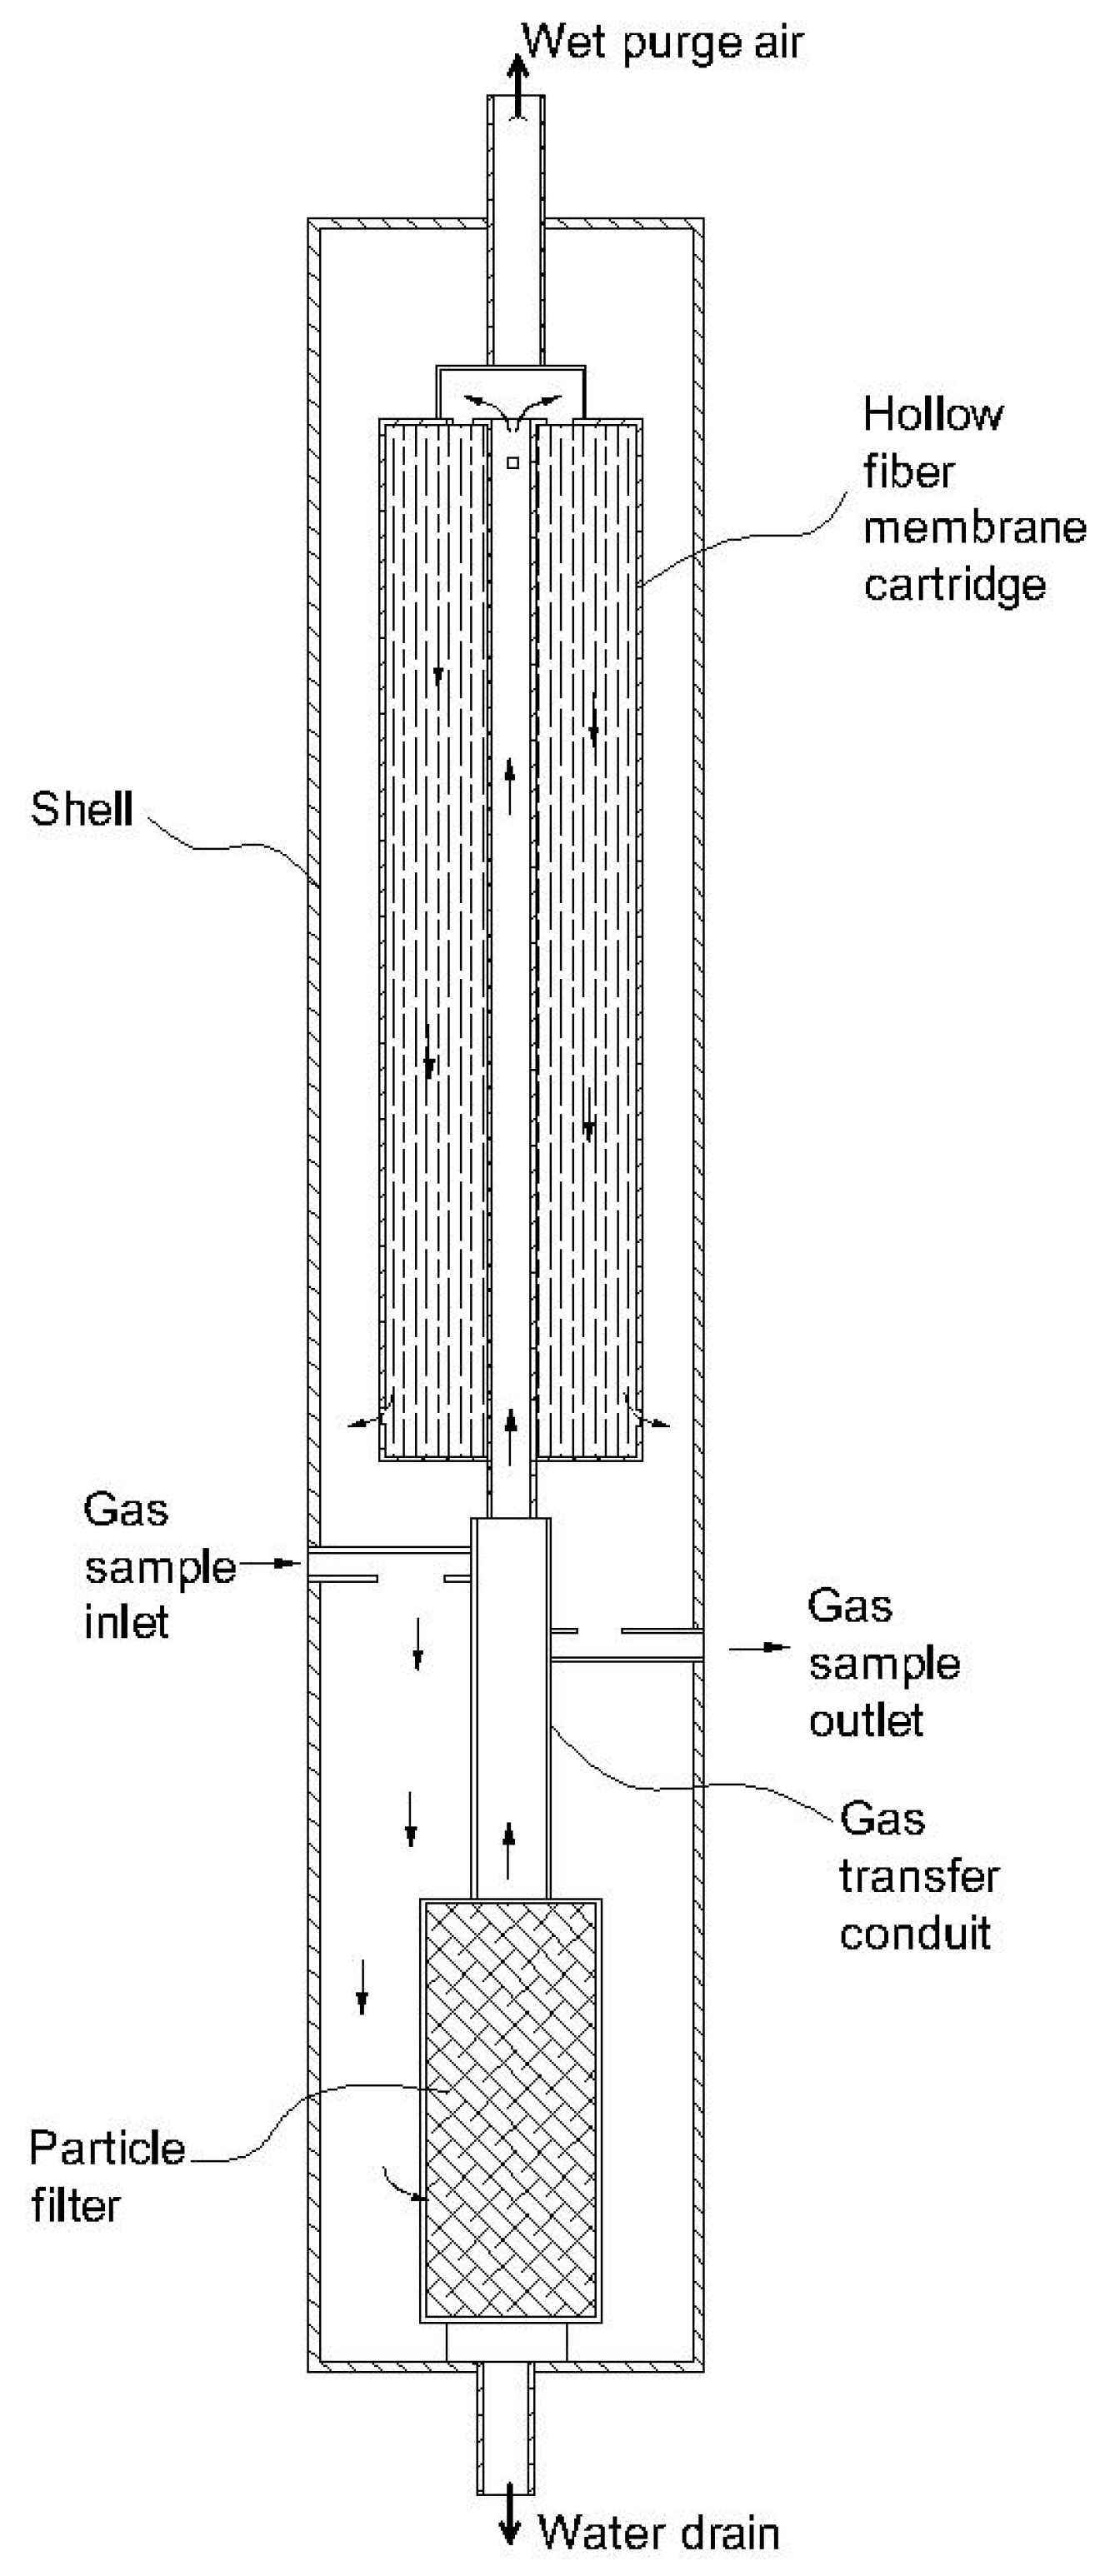
3.2. Permeation Method

The permeation method is based on the selective permeability of water through a membrane. The flue gas-contained moisture is fed to the feed side of the membrane while a dry gas (e.g., nitrogen) flows to the delivery side of the membrane with a counter-current flow direction in order to promote the permeation of water vapor through the membrane (Figure 6) [76,77]. There are four flow directions of the air in a membrane: perfect mixing, cross-plug flow, co-current flow, and counter-current flow [37]. It was concluded that the counter-current flow systematically had the best performance, followed by cross-plug, co-current, and perfect mixing [78]. Therefore, counter-current and cross-plug flow have been widely used for permeation devices [78]. For optimal operation, a membrane should have perfect radial mixing across the substrate porosity, which is calculated by Equation (1) [79]:
RM = (ymax − y)/(ymax − ybore),
where ymax is the concentration at the low pressure (computed by the cross-flow model of membrane performance); y is the actual concentration at the low-pressure side of the substrate; and ybore is the concentration in the fiber bore.
To evaluate the performance of a permeation membrane, the permeability and selectivity are key parameters [37,80]. The permeability of the membrane to water vapor (i.e., the permeation rate) should be ≥100, which can be calculated via Equation (2) [81]:
J = P[(p1 − p2)/L],
where J is the permeation rate (cm3/cm2·s); p1 and p2 are the pressures of upstream and downstream of the membrane (cmHg), respectively; L is the membrane thickness (mm); and P is the permeability. The common unit for the permeability is Barrer. Alternatively, the permeance is usually used when the membrane thickness is unknown [82]. The common unit for the permeance is the gas permeation unit (GPU).
The selectivity of the membrane is the ratio of the permeability of water vapor and the permeability of another compound through the membrane. The selectivity can be calculated via Equation (3) [37,82]:
αij = Pi/Pj,
where Pi is the permeability of water vapor and Pj is the permeability of another compound.
The mechanisms for the mass transfer of moisture in a permeation membrane are pore flow and solution–diffusion. In terms of the pore flow, H2O is only enough small to penetrate some of the pores in the membrane to the permeate side. In solution–diffusion, H2O dissolves in the membrane and then diffuses from the higher H2O concentration side to the lower concentration side due to the difference in diffusivity [37,80].
Four membrane materials have been used: polymer, zeolite, mixed matrix, and supported liquid [37,80]. Among these materials, the polymeric membranes are the most widely employed to remove moisture due to their reasonable cost, lack of defects, reproducibility, and strength [37,80]. The polymeric materials consist of cellulose acetate, ethyl cellulose, natural rubber, PBT/PEO block copolymer, PEBAX® 1074, polyacrylonitrile, polyamide 6, polycarbonate, polydimethylsiloxane, polyether sulfone, polyethylene, polyimide, polyphenylene oxide, polypropylene, polystyrene, polysulfone, polyvinyl alcohol, sulfonated polyether ether ketone, and sulfonated polyether sulfone [37,80]. PEBAX® 1074 shows the highest moisture permeability. However, the most selective polymer (i.e., between H2O and N2: H2O/N2) is sulfonated polyether ether ketone [37,80]. The zeolitic membrane is an inorganic one that is typically produced by the growing of zeolite on aluminum or stainless steel. The advantages of the zeolitic membranes are their thermal and chemical stability [37,80]. The combination of polymeric and zeolitic membranes is known as a mixed matric membrane. High thermal and chemical stability, easy and cheap fabrication process, high reproducibility, and high transportability are the main advantages of the mixed-matrix membranes [37]. Supported liquid membranes consist of a single laminate of a hygroscopic liquid (e.g., triethylene glycol, polyethylene glycol 400, ionic liquids) and a hydrophobic microporous membrane. The membrane reveals high moisture selectivity and permeability [37].
Membrane materials have continued to be developed. Hybridizing of polymeric materials has been widely carried out. Some representative studies are taken into account in this review. Makino and Nakagawa (1988) used an aromatic imide polymer generated from a tetracarboxylic acid and diamine component, exhibiting high solubility in an organic polar solvent [76]. The membrane could remove up to 10% of the water content from flue gas. The preferred dry gas flow rate was 0.5–8 m/s. The permeation rate was 0.1–10 (cm3/cm2·s) [76]. Keyser et al. (1990) developed a continuous membrane cartridge, coupled with an intermittent air compressor [83]. Some of the outlet dry air was reused to maintain the activity of the membrane. The membrane cartridge was also heated up to improve its efficiency [83]. The heating up of membranes to improve the moisture removal efficiency and prevent condensation on the surface is the advantage of this device. Using an air compressor to supply dry air instead of a gas tank is also a good aspect of this invention. However, a full permeation system would be bulky and consume a lot of energy. Norlien et al. (1991) developed a permeation moisture removal device using a perfluorinated polymer [77]. Lovelock (1992) invented a perfluorocarbon polymer with lithium sulfate group that could work as a membrane at 100 °C [84]. Bartholomew et al. (2002) compacted a permeation membrane, particle filter, and water droplet collector into an integral gas dryer and filtration device (Figure 7) [85]. Eckerbom (2009) reported the Nomoline™ technology to remove moisture in the gas sampling line [86]. Nomoline™ works based on the properties of a polyether block amide cover. Polyamide and polyether help to sweat water from the gas sample flow to the outer surface of the Nomoline™ cover [86]. Zhao et al. (2015) combined polyacrylonitrile with 1 wt% polydimethylsiloxane. The polyacrylonitrile has high H2O/N2 selectivity (i.e., 1,875,000) [87]. However, its H2O permeability is only 300 Barrers. In contrast, the polydimethylsiloxane shows high H2O permeability and low H2O/N2 selectivity of 40,000 and 143, respectively [37,80]. Thus, they were combined to complement each other’s disadvantages. The membrane’s permeance was reported as 12,827 GPU. Its H2O/N2 selectivity was 220 [87]. Likewise, the polyacrylonitrile was combined with 0.5 wt% polydimethylsiloxane to produce a thinner membrane. However, the permeance and selectivity for H2O were only 3700 GPU and 13 (H2O/N2) [88]. Baig et al. (2016) fabricated a thin-film nanocomposite using carboxylated TiO2 and polyamide [89]. The amount of carboxylated TiO2 was 0.2 wt%. It was reported that the H2O/N2 selectivity of the membrane was 486. Its H2O permeance was 1.340 GPU [89]. Interfacial polymerization using m-phenylene diamine and trimesoyl chloride was conducted on the inner surface of the polysulfone hollow fiber membrane to improve the water permeation. The optimal mass ratios of m-phenylene diamine and trimesoyl chloride were 2 wt% and 0.25 wt%, respectively. The H2O permeance of the membrane was found to be 1500 GPU. In addition, the H2O/N2 selectivity was 500 [90]. Engelhard titanosilicate-4 was polymerized with polysulfone and polyamide. The amount of Engelhard titanosilicate-4 was 4 wt%. The membrane was revealed as having 1377 GPU moisture permeance and 346 for the moisture selectivity [91]. Ingole et al. (2017) combined 0.1 wt% 1,3-benzenedithiol with polyethersulfone to produce a permeation membrane [92]. It was reported that the H2O permeance was 2050 GPU and the H2O/N2 ratio was 119. Moriyama et al. (2019) fabricated a 1,2-bis(triethoxysilyl)ethane (BTESE) membrane by coating SiO2–ZrO2-derived sols onto an α-alumina porous tube [93]. It was found that the H2O permeance was 14,925 GPU and that the H2O/N2 ratio was 160 [93]. Ahhtar et al. (2019) developed two kinds of membranes using a sulfonated penta block copolymer [94]. For the first membrane, 2 wt% of the sulfonated penta block copolymer was casted into a tetrahydrofuran solution. Its H2O/N2 selectivity and H2O permeability were found to be approximately 420,000 and 553,000 Barrers, respectively. For the second membrane, 2 wt% of the sulfonated penta block copolymer was also used to cast into a solution comprising 85 wt% toluene and 25 wt% isopropanol. It was reported that the H2O/N2 selectivity was 24,000 and that H2O permeability was 850,000 Barrers [94]. Phosphonic acid-based membranes supported by Nafion® 212 were developed by Leoga et al. (2020) [95]. The substrate was pretreated by 100 W of plasma discharge. It was reported that the H2O permeance was approximately 1400 GPU [95]. Zhang et al. (2020) modified a NaA Zeolite membrane on a hollow fiber using a WS2 nanosheet to improve the removal of moisture at a low level [96]. It was reported that the membrane could remove the moisture well at 0.5 wt% [96]. Deimede et al. (2020) casted a membrane made of a pyridinium-based polymeric ionic liquid film containing a MeSO4 counter anion [97]. It was reported that the membrane showed very high H2O permeability and H2O/N2 selectivity compared to typical polymeric membranes. The highest permeability was found to be about 184,000 Barrers. The highest selectivity was 1,840,000 [97]. The H2O permeance of the membrane was 5000 GPU. The rest of the development process of membrane materials can be found elsewhere [37,80].
Nafion® membrane has been widely applied as a permeation method to remove moisture in CEMS, most recently by [98,99,100]. Nafion® ionomers were first invented by Dr. Walther Grot and produced as a commercial product by the DuPont company in the 1960s [101]. Perfluorinated vinyl ether comonomer was copolymerized with tetrafluoroethylene to create Nafion® [101]. Jetter et al. (2002) developed a two-stage moisture removal device using a series of permeable tubes [100]. The difference between the two stages was the temperature of the tubes. In the first stage, permeable tubes were heated up to about 70 °C to increase the dew point of the gas stream. In contrast, the second stage was controlled at 0 °C to enhance the moisture removal efficiency of the device. The moisture level at the outlet of the device was reported as 700 ppmv with a 12 L/min purging rate. This low-moisture sample is suitable for the FTIR analyzer [100]. The advantages of this device are its high moisture removal efficiency and high moisture loading capacity. The device can be applied to a high-temperature gas stream due to a heater at the first stage. However, the energy consumption would be relatively high because of the temperature control process. Wang et al. (2013) wrapped the Nafion® tube in a winding cylinder to increase the length of the tube with a small-dimension device [99]. Nafion® tubes were combined with a cold trap to remove the high moisture content from the stack gas. Firstly, the sample gas was introduced into the Nafion® tubes, which were heated to the desired sample temperature. Then, the sample gas temperature was reduced to −25 °C in the cold trap to remove more moisture. The device could remove moisture up to 50% absolute humidity. The flow rate of sample gas was 50–1000 mL/min. That of dry gas should be 1–3 L/min. The device could operate with an inlet gas temperature of 25–65 °C. It was found that the outlet relative humidity could reach 15%. In addition, the device helped to improve the detection of NO down to 50 ppbv in a high-moisture sample gas using an ion transfer spectrograph [99]. The advantages of this device were its high moisture removal efficiency and high moisture loading capacity. Using a Nafion® membrane also resulted in high selectivity for many gases. The maximum inlet temperature was only 65 °C, which reveals the limitation of this device. Moreover, high energy consumption was another drawback of the device.
Compared to the condensation method, the permeation method does not require a condensate trap. In addition, the absorption of the target gas by the condensate is avoided. However, condensed droplets could appear due to the different pressures, and the membrane could be plugged by particles. Using a filter to remove the particles before the membrane could cause water to condense on the filter surface, which might also absorb target gases [1]. The large dry gas consumption is another disadvantage of the permeation method [76]. The selective property of the membrane is also important. Son et al. (2013) reported that using the permeation method for sulfur compound analysis resulted in somewhat lower water removal efficiency and higher loss of target compounds than using a Peltier-based cooling tube in certain conditions [52]. Lee et al. (2019) found that Nafion® caused the loss of methyl ethyl ketone and isobutyl alcohol (i.e., >40% at 20–100 ppbv of the analyte and 50–80% relative humidity) [102]. It was also found that artifact (such as benzene) formation occurred when the permeation method was applied to remove moisture in the measurement process of hazardous volatile organic compounds [103,104].
In general, the permeation method had a higher recovery rate for most of the analytes, a higher moisture removal efficiency, and no generation of by-products compared to the condensation method. However, there are still certain limitations to the method such as high cost, loss of certain compounds, and high consumption of dry air. Thus, the continuous development of a high-selectivity membrane is necessary. Until now, the Nafion® membrane has been widely applied to CEMS for highly water-soluble gases such as SO2, HCl, NH3, and H2S. Although the membrane itself sometimes caused the loss of certain chemical compounds, the amount lost was in the acceptable range. A summary of permeation devices is given in Table 3. The materials, advantages, disadvantages, and recommendations of applicable analytes are given. A summary of the development of membrane materials can be found in other review works [37,80].

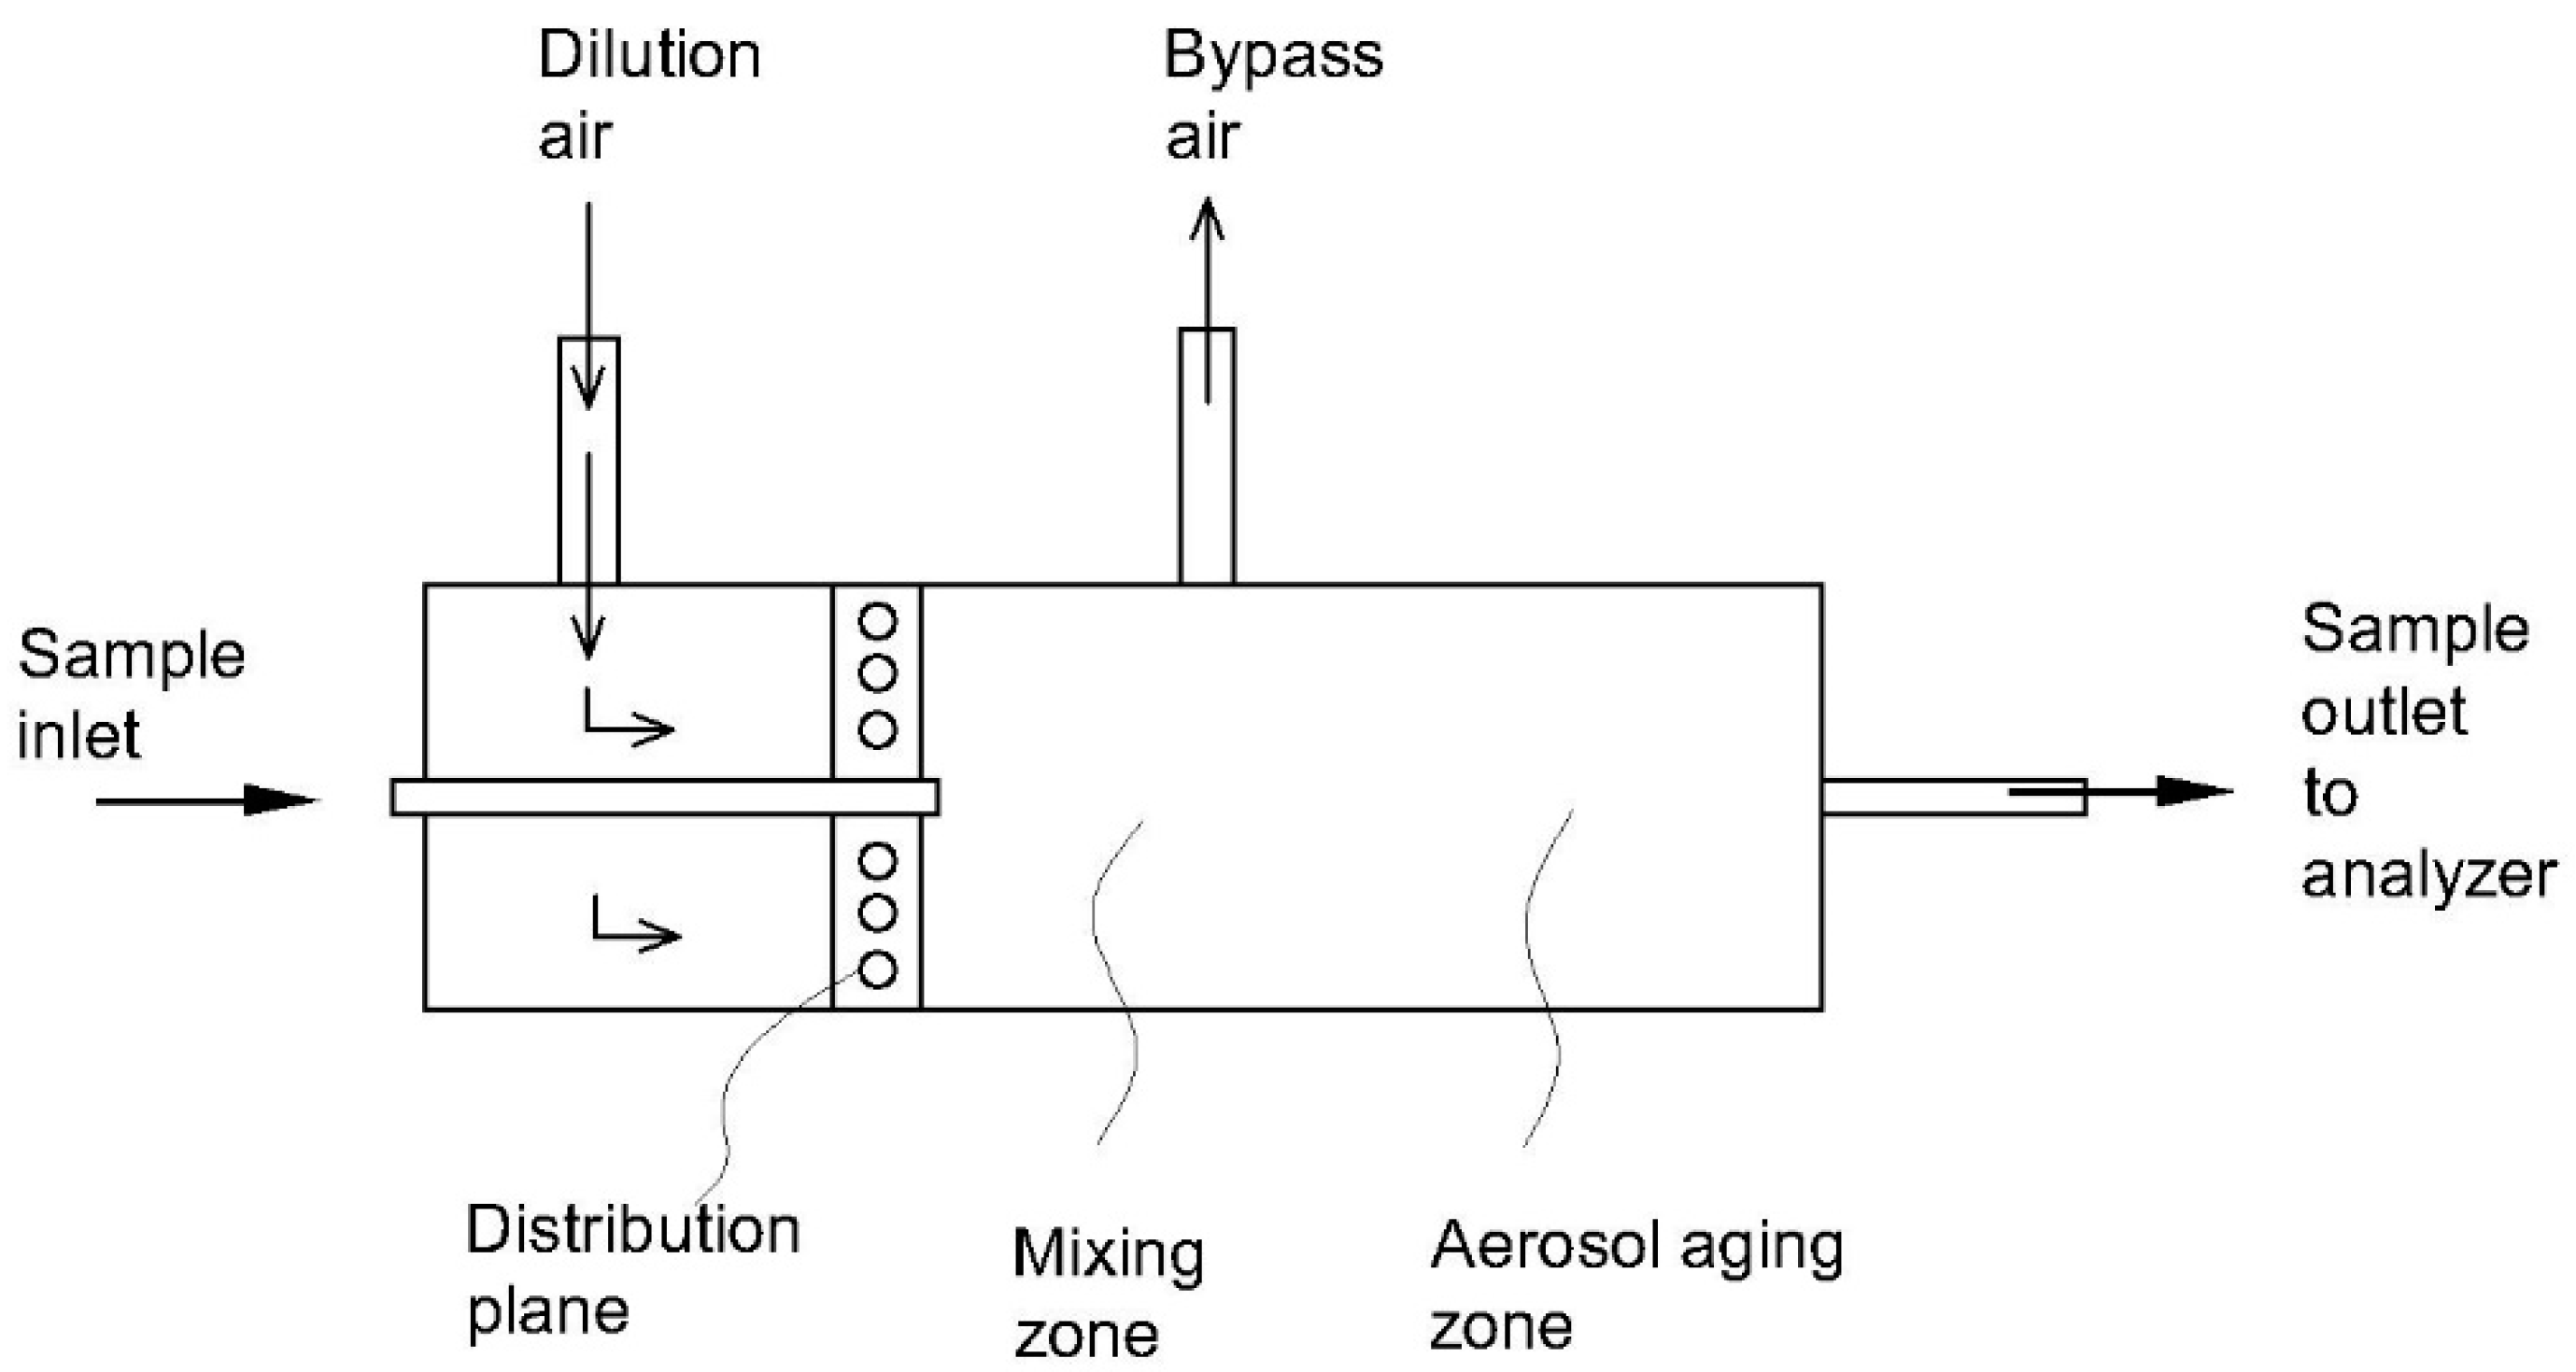
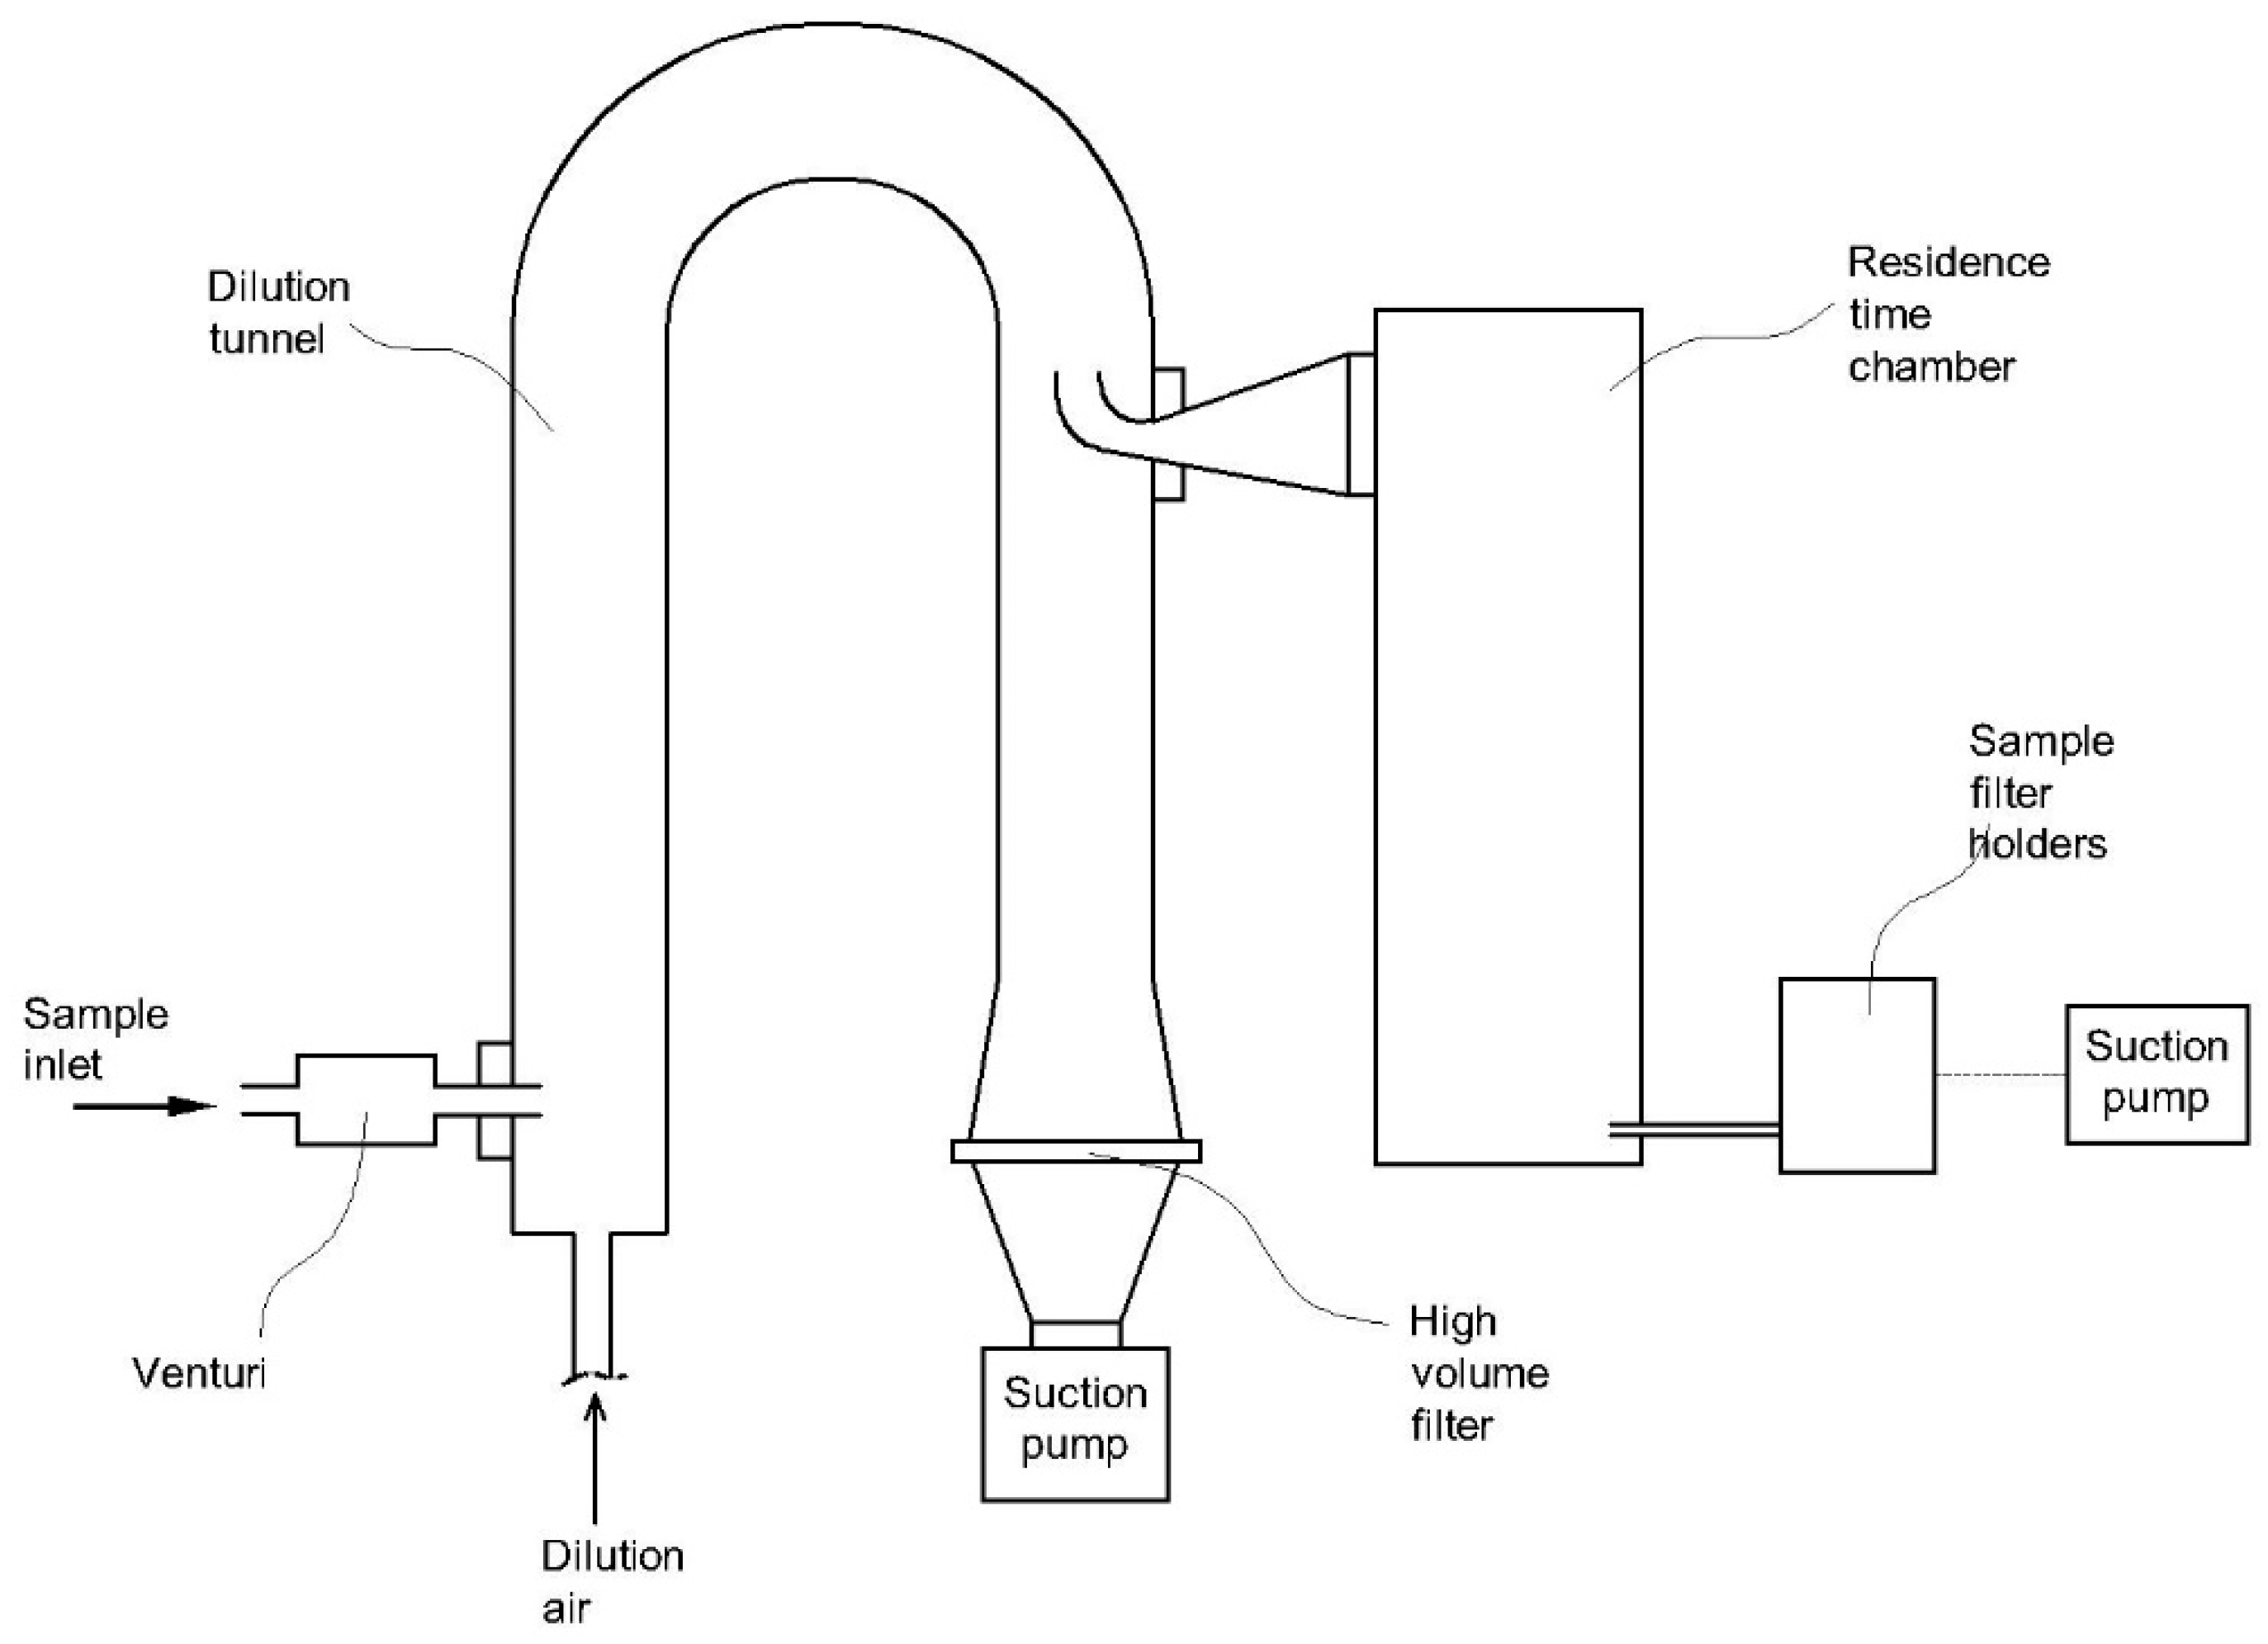
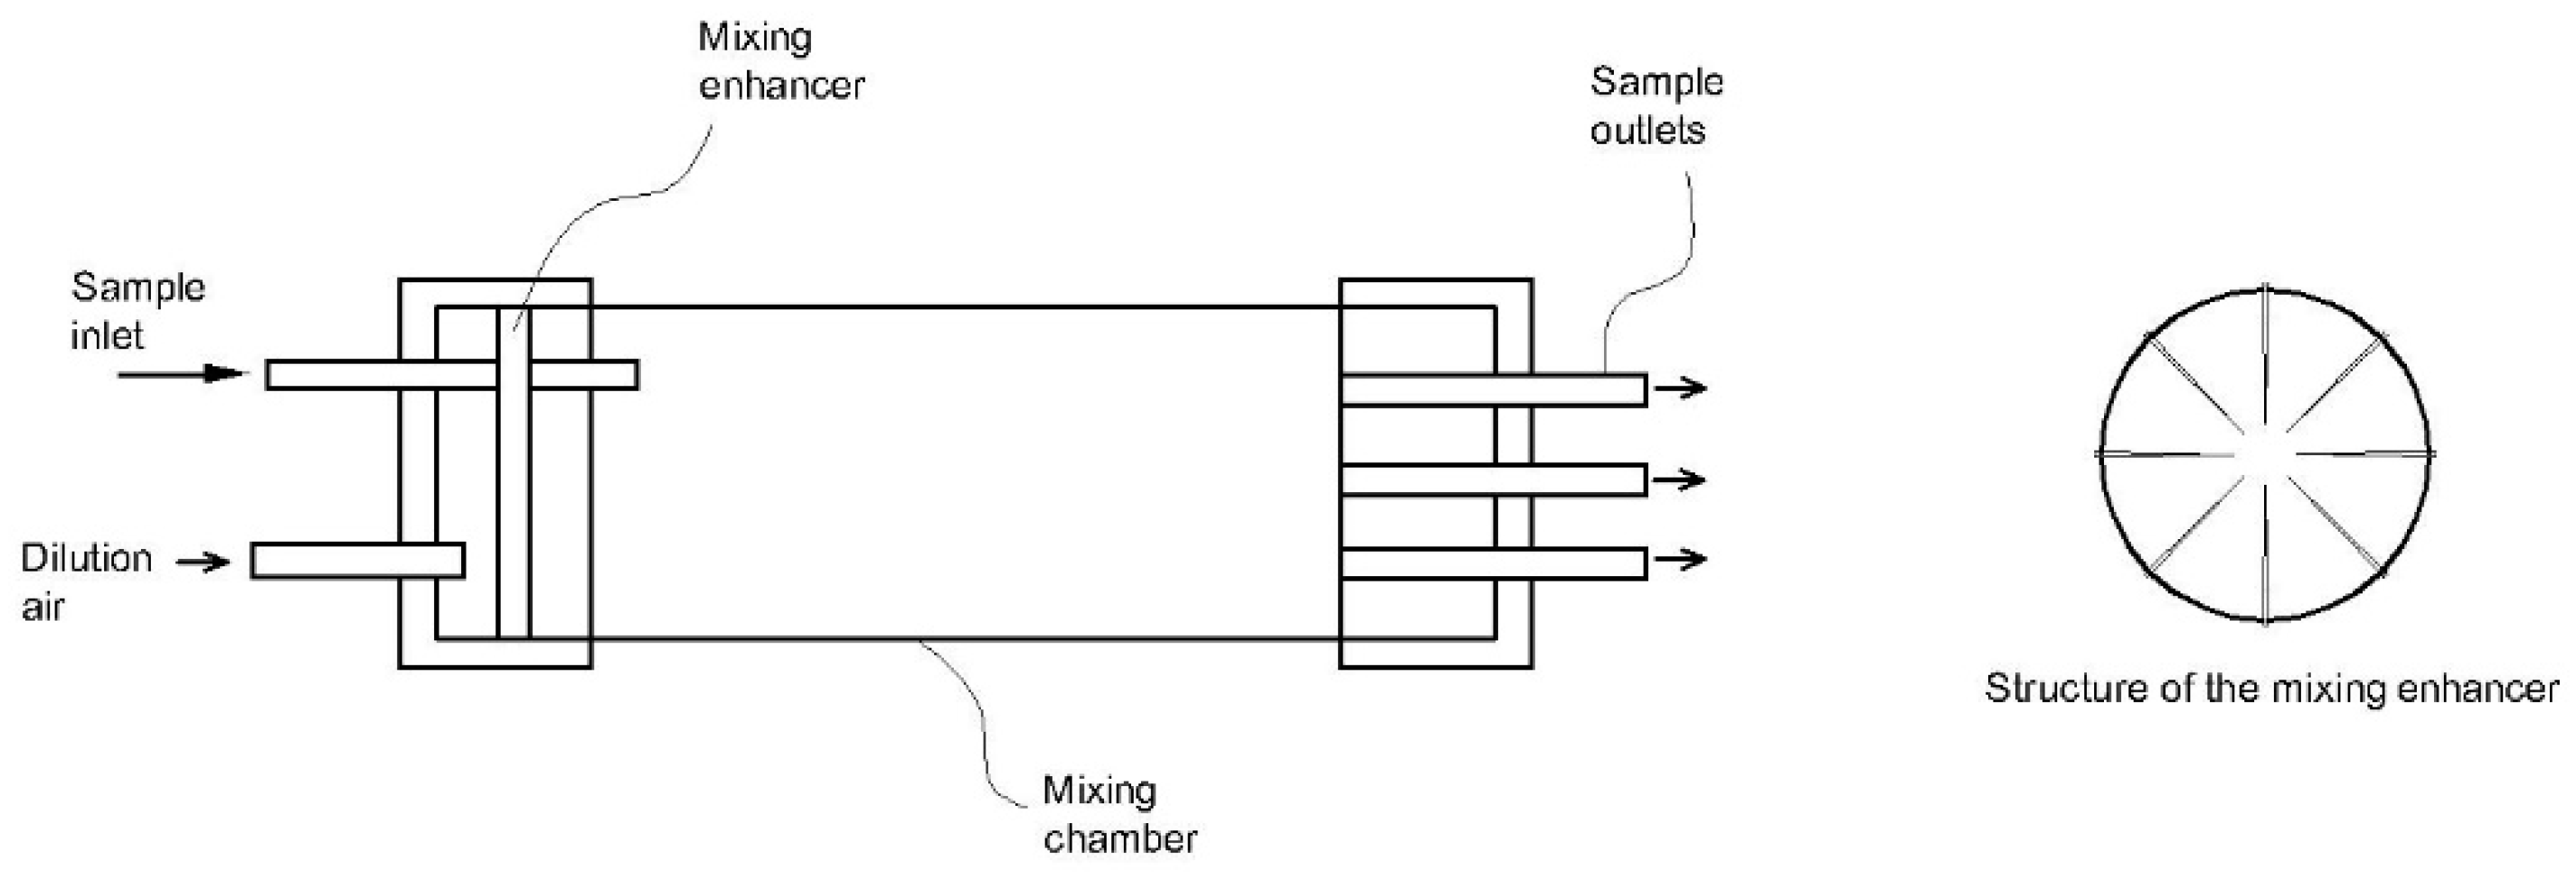
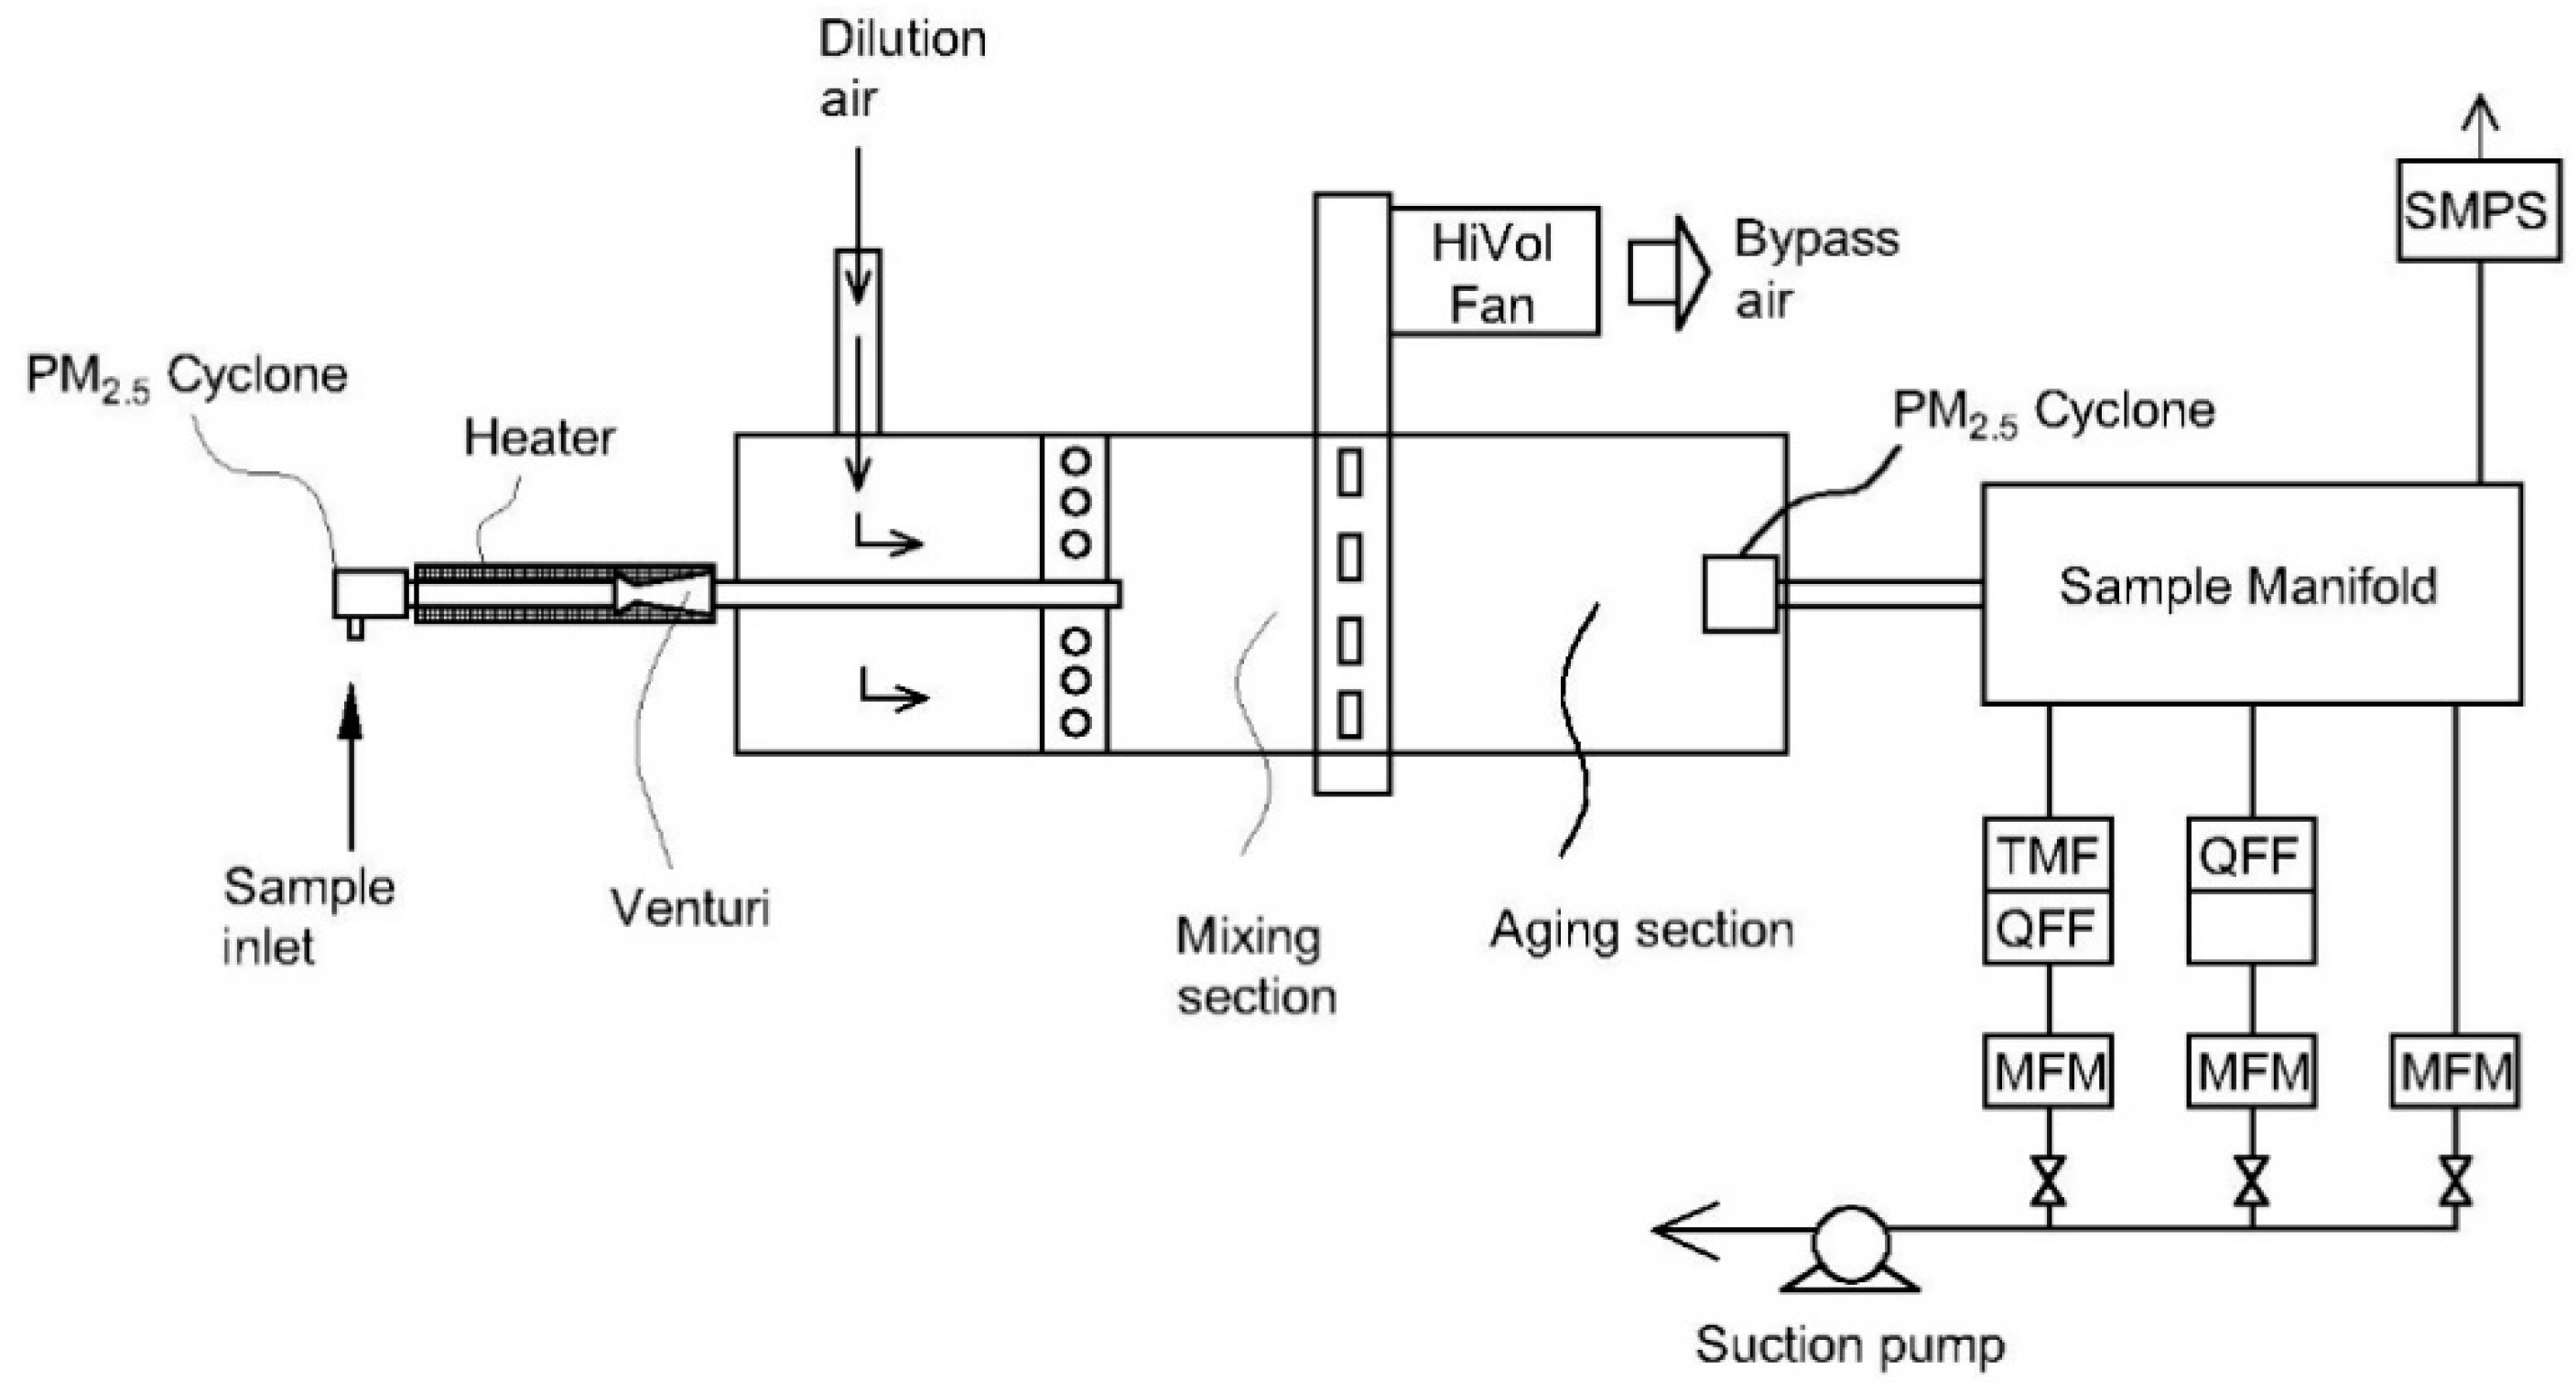
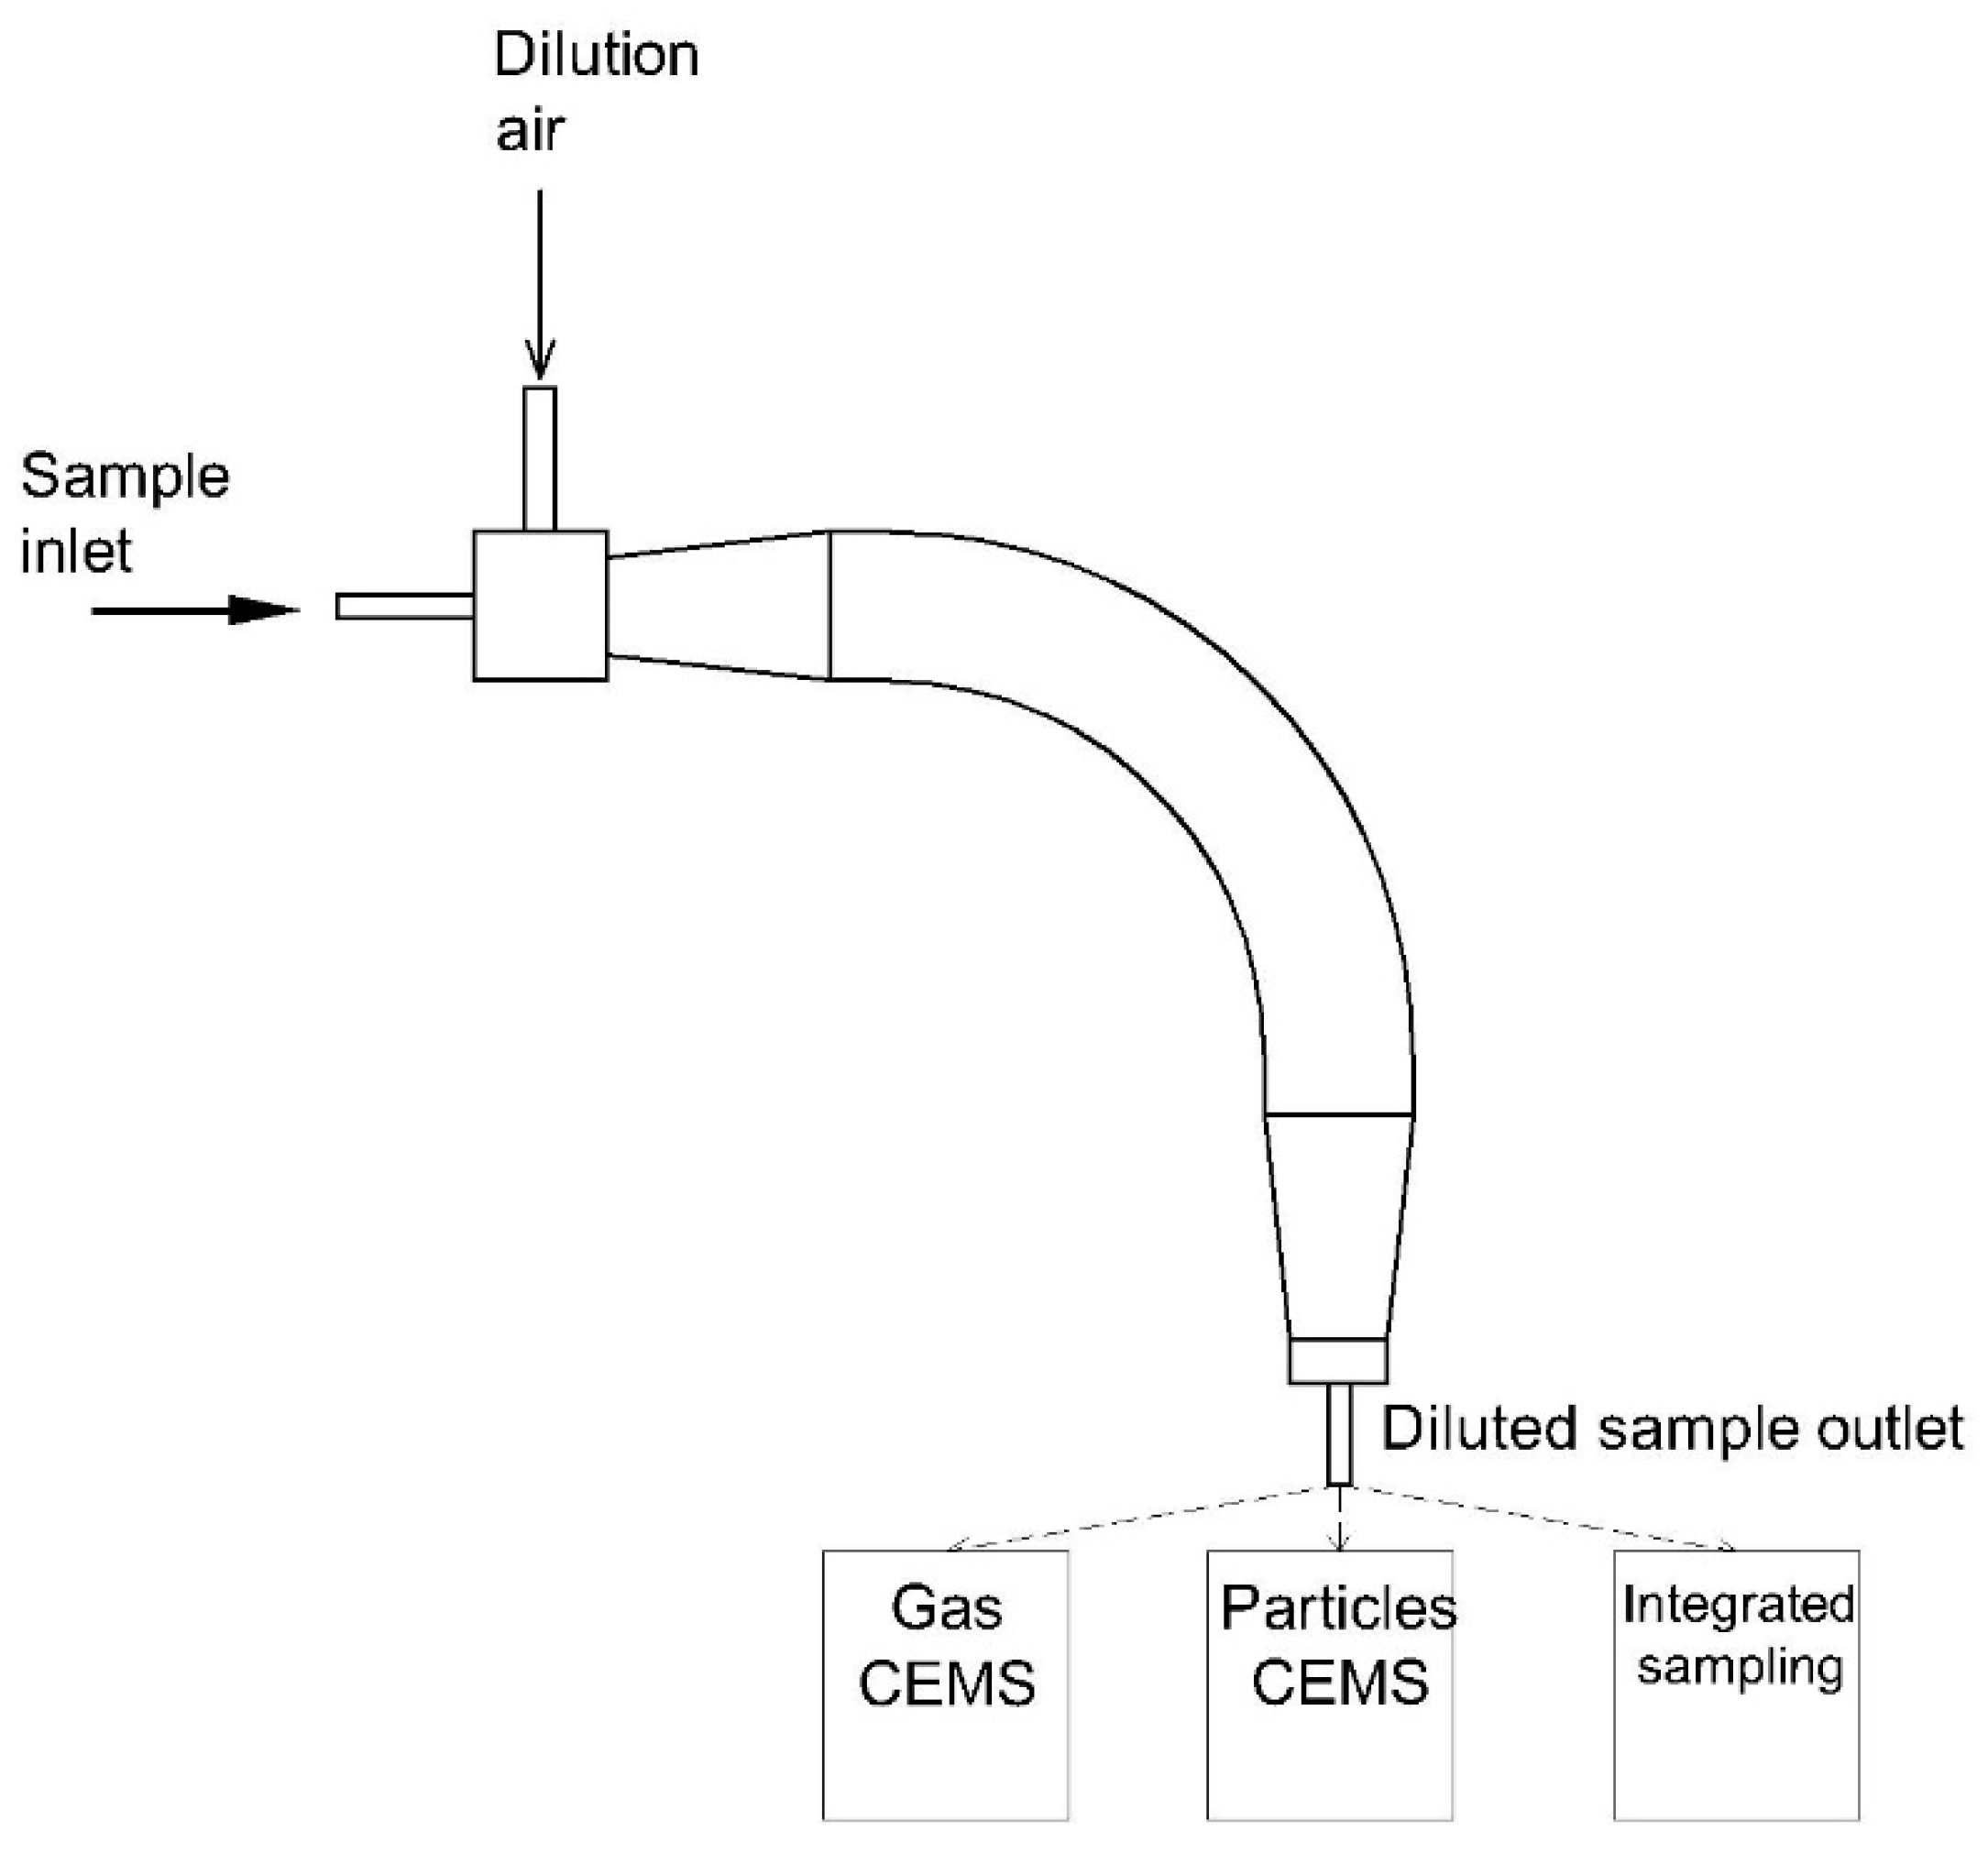
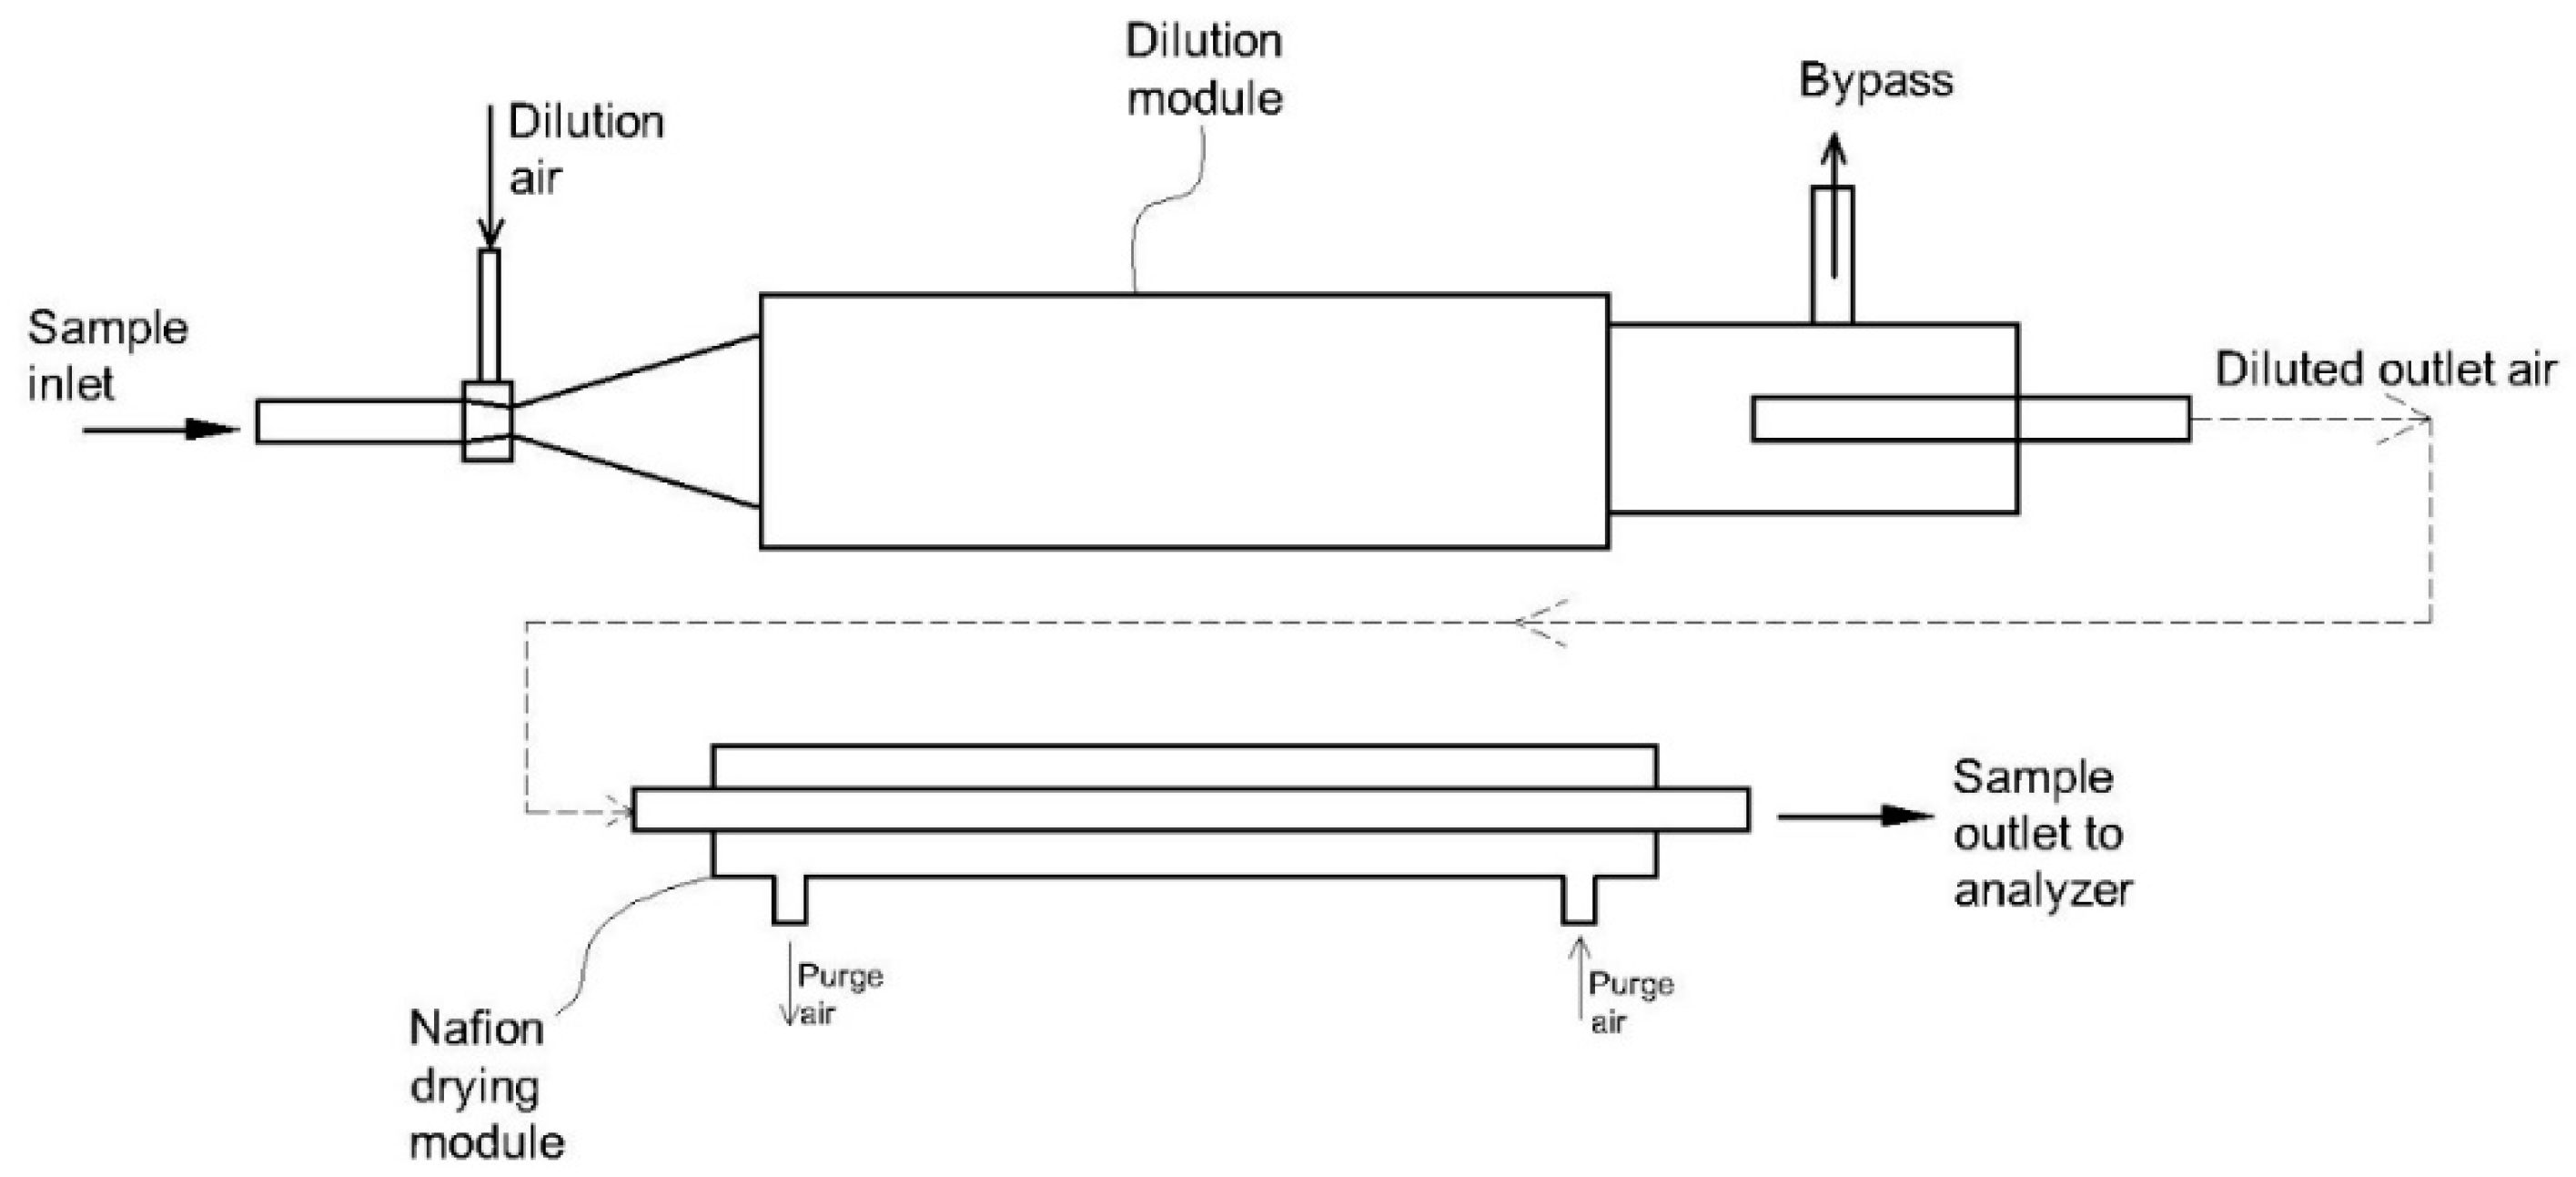
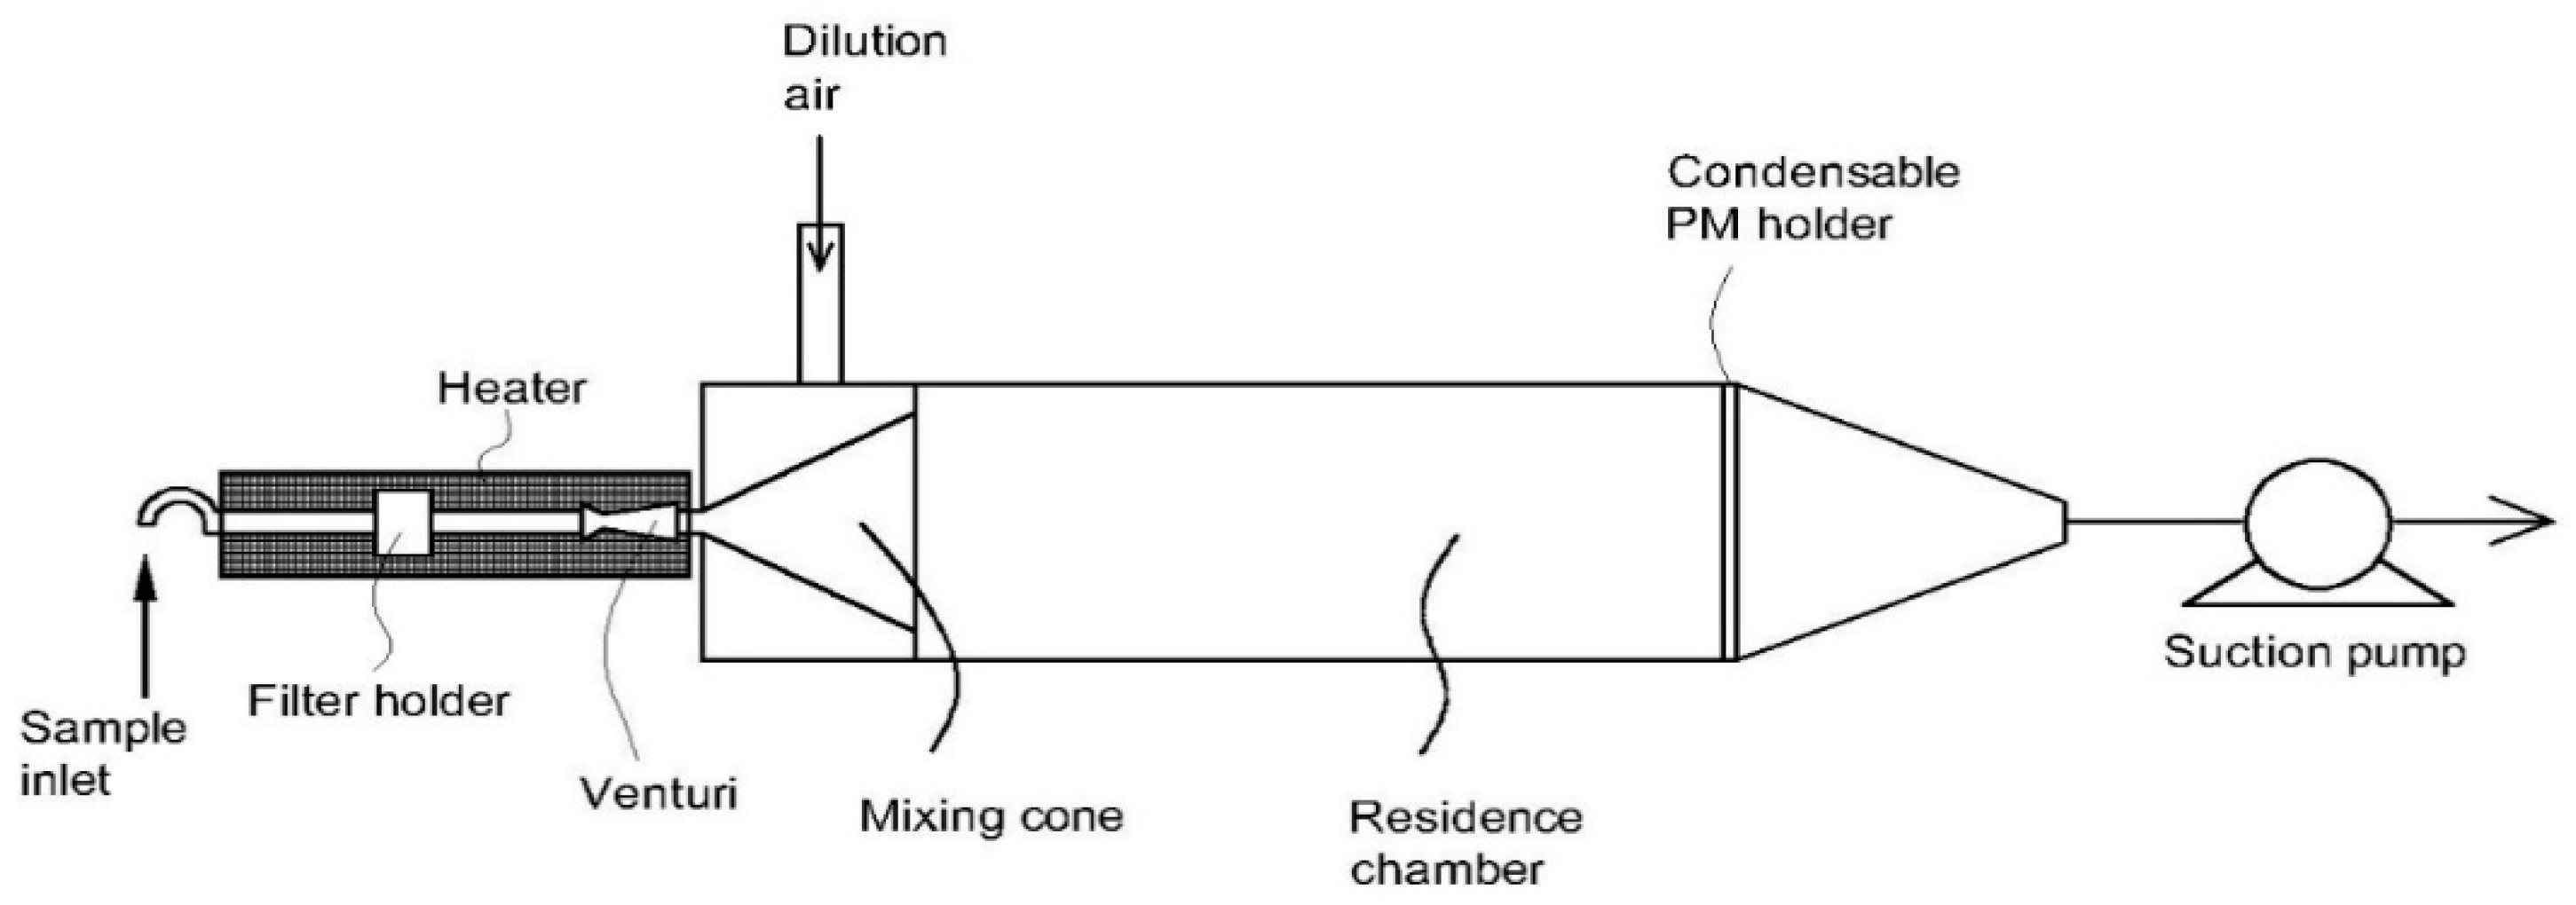
3.3. Dilution Method

Condensation and permeation methods are suitable for CEMS of gaseous compounds. For particulate matter, the two methods cannot be employed due to the physical characteristic of the particles. The U.S. EPA classified particulate matter into filterable and condensable particulate matter [105]. Filterable particulate matter refers to particles emitted directly by a source such as a solid or liquid at a stack or their release conditions and captured on the filter of a stack test train [105]. Condensable particulate matter includes materials that are in the vapor phase at stack conditions but condense and/or react upon cooling and dilution in the ambient air to form solid or liquid particulate matter immediately after discharge from the stack [105]. In terms of particle size, primary PM2.5 or PM2.5 is particulate matter with an aerodynamic diameter less than or equal to 2.5 μm [105]. PM2.5 consists of filterable PM2.5 and condensable particulate matter [105]. Primary PM10 or PM10 is particulate matter with an aerodynamic diameter less than or equal to 10 μm [105]. PM10 consists of filterable PM10 and condensable particulate matter [105]. Generally, particulate matter emitted from a stack is continuously measured by three main techniques, including direct extraction of high-temperature gasification coupled with laser scattering measurement, high-temperature extractive dilution coupled with laser scattering measurement, and alternating current coupled with charge induction, opacity meters, Beta attenuation meters, or electrification devices. The direct extraction and the extractive dilution methods are the most popular ones [17,106]. Furthermore, the dilution method is a standard method recommended by the International Organization for Standardization ISO 25597:2013 [107] as well as U.S. EPA CTM-039 [108] to measure primary PM2.5 and PM10. Only condensable particulate matter can be measured by the dry cooling impinger method [105,109] and the dilution method [109]. Therefore, the dilution method was also reviewed in this study, although it is not a direct moisture removal method. The simple principle of the dilution method is presented in Figure 8. The ratio of dilution air to sample air should be at least 20:1 to maintain a relative humidity of the diluted sample of less than 70%. The filter temperature should be maintained at approximately 42 °C by either a high dilution ratio or a heater [107].
The development of dilution systems has continued for decades. Hildemann et al. (1989) invented a U-shaped dilution system for the measurement of organic aerosols emitted from a stack [110]. The fundamental diagram of the invention is presented in Figure 9. The body of the dilution tunnel and the residence time chamber were made of stainless steel. The dilution ratio was 25–100-fold. The sampling flow rate was 30 L/min at 150 °C. It was reported that the loss of particles 1 µm and 2 µm in diameter was approximately 7% and 15%, respectively. In the application of a field test at an oil-fired industrial boiler, using the dilution system was found to collect 10 times more organic carbon than using U.S. EPA Method 5 [110]. Although this dilution system helped improve the particulate matter measurement, its limitation was bulk (i.e., >17 kg). Therefore, the dilution system has kept improving to become more compact. In addition, the significant loss of particles in the range of 1–2 µm was a drawback of this device.
Lipsky and Robinson (2005) developed a compact dilution system (Figure 10) [111]. The dilution system was made of stainless steel. The length and diameter of the mixing chamber were 0.9 m and 0.15 m, respectively. The total air flow through the chamber was 174 L/min. The inlet air temperature could be varied from 150 to 300 °C. The diluted outlet air was approximately 27 °C. The dilution ratio was 20–350-fold. It was found that the measurement errors were less than 10% with regard to a laboratory test using a diesel generator and a wood stove [111]. For a field test, measurement errors varied from 5% to 18%. The change in particle shape with respect to dilution ratios was also addressed. The densities of PM2.5 were 0.5 g/cm3 and 1.0 g/cm3 for on dilution ratios of 20- and 160-fold, respectively [111]. The advantages of this device were its compact size and fast retention time. However, the significant measurement bias and the dependency of the particle shape on the dilution ratio were disadvantages of the device.
England et al. (2007) improved the compact dilution system and conducted field tests on gas-fired and oil-fired boilers [107]. The schematic diagram of this dilution system was similar to that in [107]. The system consisted of a multiple parallel jet flow in order to quickly mix the stack sample with air at a dilution ratio of 20:1, a mixing chamber to well the sample mix with a retention time of 10 s; and a clean air generator to produce dilution air (Figure 11). The device was designed for inlet sample temperatures below 175 °C. The weight of the dilution system was about 9 kg. It was reported that the minimum detection limit of the system was 0.13–1.2 mg/m3 with respect to 1 h sampling at 113 L/min. The relative measurement error of the method was 27–34% [112]. The advantages of this invention were its compact size and low minimum detection limit. However, the device still led to significant measurement bias.
A multipollutant dilution sampling system was developed to measure not only particulate matter but also gaseous pollutants emitted from a stationary source such as carbon dioxide (CO2), carbon monoxide (CO), nitrogen oxides (NOx), sulfur dioxide (SO2), oxygen (O2), and total volatile organic compounds (TVOCs) [113,114,115]. A 90° elbow residence chamber made of stainless steel was used to increase the residence time up to 28 s (Figure 12). The air flow rate of the inlet sample was 5 L/min. That of the dilution air was 125 L/min. The inlet air temperature was 146–174 °C. The range of dilution ratios was 20–5-fold. It was found that the relative measurement error was less than 5.1% [113,114,115]. The invention showed advantages for multiple functions. Furthermore, the device also had a reasonable measurement error. However, maintenance was an issue due to its complicated nature.
For ultra-low particulate matter emitted from a power plant, an electrical low-pressure impactor has been widely applied to investigate the particle size distribution [116]. However, moisture in the flue gas caused a significant bias in the analytical process. An increase in humidity resulted in an increase in measurement error. It was reported that the measurement error varied from 1000% to 2500% with respect to different particle sizes and humidity [116]. Thus, a hybrid dilution system was developed to reduce the moisture level in the sample gas (Figure 13). The system consisted of a dilution module and a drying module. The dilution ratio was 8:1. The dilution module had the same structure as in [107]. The temperature of the inlet gas should not be over 50 °C. The drying module was a Nafion® tube. It was claimed that the relative measurement errors of PM0.2, PM1, PM2.5, and PM10 were within 10% at a relative humidity of 73.7% [116]. The advantage of this invention was its enhanced measurement accuracy for ultra-low particulate matter. However, using the Nafion® tube led to an increase in capital cost. Maintenance cost was also an issue for the system.
The methods mentioned above were developed to monitor only filterable particulate matter or a combination of filterable and condensable particulate matter. To monitor only condensable particulate matter, Cano et al. (2017) improved the dilution method CTM-039 of U.S. EPA (Figure 14) [117]. A filter module was employed instead of a PM2.5 cyclone. A quartz fiber filter was used to remove filterable particulate matter. Dilution ratios were 10–40-fold, and the inlet air temperature was in the range of 190–200 °C [117]. The advantage of this method is the high accuracy for the measurement of only condensable particulate matter. However, it is difficult to maintain the filter holder at the sampling probe. The selection of filter size might also affect the accuracy of the measurement.
In general, the dilution method is useful for the measurement of particulate matter because it can reduce the effect of the high moisture without causing a loss of particles. Another advantage of the dilution method is the minimization of the contamination of the system because the volume of sample gas extracted from the stack is small [23]. However, this method has some limitations. The dilution might bring about a decrease in the number of particles in the flue gas. If this number is lower than the detection limit of the analyzer, bias will occur. In addition, the method is not suitable for the high vacuum, high pressure, and high temperature (i.e., >260 °C) of the gas stream [107]. The condensation of certain organic and acid compounds could occur because of cooling by the dilution air [23]. Moreover, high variations in the concentration, velocity, and temperature of the flue gas can influence the measurement results [107]. Finally, the stratification of the emission gas also results in an increase in measurement error when the emission gas is not mixed well [107]. The dilution method is strongly affected by temperature, pressure, and sample gas molecular weight [22]. This is a limitation of the dilution method. Correction factors should be applied to counteract these effects.
Since the dilution method reduced a high-temperature sample gas down to an ambient level, the condensable particulate matter could be generated [111]. This condensation process could occur in the dilution system when the phase equilibrium of condensable compounds was less than their residence time in the dilution system [111]. This equilibration time can be estimated by Equation (4) [111]:
τ s = 1 4 π D A 0 n ( R P ) R P f ( K n , α ) d R P
where DA is the gas diffusivity (~0.06 cm2/s), n(RP) is the number of particles at radius RP, f(Kn, α) corrects the mass flux for non continuum effects and imperfect accommodation, and α is the accommodation coefficient. The Fuchs and Sutugin approach could be used to evaluate f(Kn, α) and α [111].
Based on Equation (4), a dilution chamber could be designed to measure only the filterable particulate matter or both filterable and condensable particulate matter. To date, unfortunately, there is no reliable dilution system that can measure filterable and condensable particulate matter independently. Using two dilution systems with different volumes or different sampling ports with respect to retention time could be a potential method to separate filterable and condensable particulate matter. Various dilution systems are shown in Table 4. The characteristics, advantages, disadvantages, and application of each device are given below.

4. Conclusions

Condensation and permeation are the two general techniques used to remove moisture from flue gas in a CEMS for gaseous compounds. In condensation techniques, the moisture is removed under liquid or solid phase due to the decrease in flue gas temperature to a dew point. The correction factors or optimal operation conditions should be determined when employing these technologies. In addition, the condensation methods should only be applied for very poorly water-soluble compounds to prevent the loss of analytes. The permeation method seems to be a better technology in terms of moisture removal efficiency and selectivity. Polymeric membranes were found to be the most widely used membrane to remove moisture in flue gas besides zeolite, mixed matrix, and supported liquid membranes [37]. For decades, 19 main kinds of polymeric materials have been developed in order to remove the moisture. Various fabrication methods have been conducted with different substrates to improve the moisture removal efficiency and the membrane selectivity. However, the large amount of dry gas and the lower amount of sample gas are significant drawbacks of the permeation method. In addition, the loss of some target compounds, artifact formation, and contamination in the membrane were found when the permeation method was employed to remove moisture.
In terms of particulate matter, the dilution method has been widely implemented. The dilution ratio should be carefully considered based on the detection limit of an analyzer to prevent measurement bias. The effect of dilution ratios on the shape of particulate matter should also be taken into account. The influence of the pressure, temperature, and molecular weight of target compounds should be corrected. These are also limitations of the method. Moreover, the measurement error of the particulate matter using the method is still significant.
Accordingly, studies to find the best technology for moisture removal should be carried out. As for the condensation method, the removal of moisture at super-cooling conditions under a solid phase might be a potential way. The relationship between the polarities of water and target gases at different phases should be taken into account in order to predict the extent of their loss. The development of an effective catalytic converter to convert highly water-soluble analytes to poorly or non-water-soluble ones might be a promising solution for the application of the condensation method. In terms of permeation techniques, the influence of strong oxidative compounds and fine particles on membranes should be carefully investigated. Their lifetime should be considered as well. On the other hand, the dilution method is not the best technique for particulate matter measurement. Other methods that can remove the moisture without damaging particles may be an alternative. Furthermore, the development of a dilution system that can independently measure filterable and condensable particulate matter should be considered.

Supplementary Materials

The following are available online at https://www.mdpi.com/2073-4433/12/1/61/s1: Table S1: Experimental results of water removal under solid phase (−20 °C) for HCl flue gas sample; Table S2: Experimental results of water removal for SO2 flue gas sample.

Author Contributions

J.-C.K. and T.-V.D. conceptualized the work. T.-V.D. wrote the original draft, and the review and editing were done by J.-C.K. All authors have read and agreed to the published version of the manuscript.

Institutional Review Board Statement

Not applicable.

Informed Consent Statement

Not applicable.

Data Availability Statement

No new data were created or analyzed in this study. Data sharing is not applicable to this article.

Acknowledgments

This paper was supported by Konkuk University Researcher Fund in 2019.

Conflicts of Interest

The authors declare no conflict of interest.

References

  1. Jahnke, J.A. Continuous Emission Monitoring, 2nd ed.; John Wiley & Sons, Inc.: Toronto, ON, Canada, 2000; ISBN 0-471-29227-3. [Google Scholar]
  2. Lillesand, T.; Kiefer, R.W.; Chipman, J. Remote Sensing and Image Interpretation; John Wiley and Sons: Hoboken, NJ, USA, 2015. [Google Scholar]
  3. Dinh, T.-V.; Choi, I.-Y.; Son, Y.-S.; Kim, J.-C. A review on non-dispersive infrared gas sensors: Improvement of sensor detection limit and interference correction. Sens. Actuators B Chem. 2016, 231, 529–538. [Google Scholar] [CrossRef]
  4. Sun, Y.; Liu, W.-Q.; Zeng, Y.; Wang, S.-M.; Huang, S.-H.; Xie, P.; Yu, X.-M. Water Vapor Interference Correction in a Non Dispersive Infrared Multi-Gas Analyzer. Chin. Phys. Lett. 2011, 28, 073302. [Google Scholar] [CrossRef]
  5. Giechaskiel, B.; Maricq, M.M.; Ntziachristos, L.; Dardiotis, C.; Wang, X.; Axmann, H.; Bergmann, A.; Schindler, W. Review of motor vehicle particulate emissions sampling and measurement: From smoke and filter mass to particle number. J. Aerosol. Sci. 2014, 67, 48–86. [Google Scholar] [CrossRef]
  6. Amaral, S.S., Jr.; De Carvalho, J.A.C.; Costa, M.A.M.; Pinheiro, C. An Overview of Particulate Matter Measurement Instruments. Atmosphere 2015, 6, 1327–1345. [Google Scholar] [CrossRef] [Green Version]
  7. Leskinen, J.; Tissari, J.; Uski, O.; Virén, A.; Torvela, T.; Kaivosoja, T.; Lamberg, H.; Nuutinen, I.; Kettunen, T.; Joutsensaari, J.; et al. Fine particle emissions in three different combustion conditions of a wood chip-fired appliance—Particulate physico-chemical properties and induced cell death. Atmos. Environ. 2014, 86, 129–139. [Google Scholar] [CrossRef]
  8. Jiang, R.; Bell, M.L. A Comparison of Particulate Matter from Biomass-Burning Rural and Non-Biomass-Burning Urban Households in Northeastern China. Environ. Health Perspect. 2008, 116, 907–914. [Google Scholar] [CrossRef]
  9. Torvela, T.; Tissari, J.; Sippula, O.; Kaivosoja, T.; Leskinen, J.; Virén, A.; Lahde, A.; Jokiniemi, J. Effect of wood combustion conditions on the morphology of freshly emitted fine particles. Atmos. Environ. 2014, 87, 65–76. [Google Scholar] [CrossRef]
  10. Krecl, P.; Ström, J.; Johansson, C. Carbon content of atmospheric aerosols in a residential area during the wood combustion season in Sweden. Atmos. Environ. 2007, 41, 6974–6985. [Google Scholar] [CrossRef]
  11. Mellon, D.; King, S.J.; Kim, J.; Reid, J.P.; Orr-Ewing, A.J. Measurements of Extinction by Aerosol Particles in the Near-Infrared Using Continuous Wave Cavity Ring-Down Spectroscopy. J. Phys. Chem. A 2011, 115, 774–783. [Google Scholar] [CrossRef]
  12. Pettersson, A.; Lovejoy, E.R.; Brock, C.A.; Brown, S.S.; Ravishankara, A. Measurement of aerosol optical extinction at with pulsed cavity ring down spectroscopy. J. Aerosol. Sci. 2004, 35, 995–1011. [Google Scholar] [CrossRef]
  13. Elsasser, M.; Crippa, M.; Orasche, J.; Decarlo, P.F.; Oster, M.; Pitz, M.; Cyrys, J.; Gustafson, T.L.; Pettersson, J.B.C.; Schnellekreis, J.; et al. Organic molecular markers and signature from wood combustion particles in winter ambient aerosols: Aerosol mass spectrometer (AMS) and high time-resolved GC-MS measurements in Augsburg, Germany. Atmos. Chem. Phys. Discuss. 2012, 12, 6113–6128. [Google Scholar] [CrossRef] [Green Version]
  14. Hosseini, S.; Li, Q.; Cocker, D.; Weise, D.; Miller, A.; Shrivastava, M.; Miller, J.W.; Mahalingam, S.; Princevac, M.; Jung, H. Particle size distributions from laboratory-scale biomass fires using fast response instruments. Atmos. Chem. Phys. Discuss. 2010, 10, 8065–8076. [Google Scholar] [CrossRef] [Green Version]
  15. Vincent, J.H. Aerosol Sampling; John Wiley & Sons, Ltd.: Chichester, UK, 2007; ISBN 9780470060230. [Google Scholar]
  16. Coudray, N.; Dieterlen, A.; Roth, E.; Trouvé, G. Density measurement of fine aerosol fractions from wood combustion sources using ELPI distributions and image processing techniques. Fuel 2009, 88, 947–954. [Google Scholar] [CrossRef] [Green Version]
  17. Castellani, B.; Morini, E.; Filipponi, M.; Nicolini, A.; Palombo, M.; Cotana, F.; Rossi, F. Comparative Analysis of Monitoring Devices for Particulate Content in Exhaust Gases. Sustainability 2014, 6, 4287–4307. [Google Scholar] [CrossRef] [Green Version]
  18. Lundgren, D.A.; Cooper, D.W. Effect of Humidify on Light-Scattering Methods of Measuring Particle Concentration. J. Air Pollut. Control. Assoc. 1969, 19, 243–247. [Google Scholar] [CrossRef] [Green Version]
  19. Zieger, P.; Fierz-Schmidhauser, R.; Weingartner, E.; Baltensperger, U. Effects of relative humidity on aerosol light scattering: Results from different European sites. Atmos. Chem. Phys. Discuss. 2013, 13, 10609–10631. [Google Scholar] [CrossRef] [Green Version]
  20. Jayaratne, R.; Liu, X.; Thai, P.; Dunbabin, M.; Morawska, L. The influence of humidity on the performance of a low-cost air particle mass sensor and the effect of atmospheric fog. Atmos. Meas. Tech. 2018, 11, 4883–4890. [Google Scholar] [CrossRef] [Green Version]
  21. Shao, W.; Zhang, H.; Zhou, H. Fine Particle Sensor Based on Multi-Angle Light Scattering and Data Fusion. Sensors 2017, 17, 1033. [Google Scholar] [CrossRef] [Green Version]
  22. US EPA. An Operator’s Guide to Eliminating Bias in CEM Systems; United States Environmental Protection Agency: Washington, DC, USA, 1994.
  23. US EPA. EPA Handbook–Continuous Emission. Monitoring Systems for Non-Criteria Pollutants; United States Environmental Protection Agency: Washington, DC, USA, 1997.
  24. US EPA. Ammonia CEMS Background; United States Environmental Protection Agency: Washington, DC, USA, 1993.
  25. Anglada, J.M.; Martins-Costa, M.T.C.; Francisco, J.S.; Ruiz-López, M.F. Triplet state promoted reaction of SO2 with H2O by competition between proton coupled electron transfer (pcet) and hydrogen atom transfer (hat) processes. Phys. Chem. Chem. Phys. 2019, 21, 9779–9784. [Google Scholar] [CrossRef] [Green Version]
  26. Li, K.; Yu, H.; Qi, G.; Feron, P.; Tade, M.; Yu, J.; Wang, S. Rate-based modelling of combined SO2 removal and NH3 recycling integrated with an aqueous NH3 -based CO2 capture process. Appl. Energy 2015, 148, 66–77. [Google Scholar] [CrossRef]
  27. Seo, J.-B.; Jeon, S.-B.; Choi, W.-J.; Kim, J.-W.; Lee, G.-H.; Oh, K.-J. The absorption rate of CO2/SO2/NO2 into a blended aqueous AMP/ammonia solution. Korean J. Chem. Eng. 2010, 28, 170–177. [Google Scholar] [CrossRef]
  28. Zhao, Y.; Hao, R.; Wang, T.; Yang, C. Follow-up research for integrative process of pre-oxidation and post-absorption cleaning flue gas: Absorption of NO2, NO and SO2. Chem. Eng. J. 2015, 273, 55–65. [Google Scholar] [CrossRef]
  29. Susianto; Pétrissans, M.; Pétrissans, A.; Zoulalian, A. Experimental study and modelling of mass transfer during simultaneous absorption of SO2 and NO2 with chemical reaction. Chem. Eng. Process. Process. Intensif. 2005, 44, 1075–1081. [Google Scholar] [CrossRef]
  30. Kong, S.; Shi, J.; Lu, B.; Qiu, W.; Zhang, B.; Peng, Y.; Zhang, B.; Bai, Z. Characterization of PAHs within PM10 fraction for ashes from coke production, iron smelt, heating station and power plant stacks in Liaoning Province, China. Atmos. Environ. 2011, 45, 3777–3785. [Google Scholar] [CrossRef]
  31. Yang, H.-H.; Lee, W.-J.; Chen, S.-J.; Lai, S.-O. PAH emission from various industrial stacks. J. Hazard. Mater. 1998, 60, 159–174. [Google Scholar] [CrossRef]
  32. Shi, J.; Deng, H.; Bai, Z.-P.; Kong, S.; Wang, X.; Hao, J.; Han, X.; Ning, P. Emission and profile characteristic of volatile organic compounds emitted from coke production, iron smelt, heating station and power plant in Liaoning Province, China. Sci. Total Environ. 2015, 515–516, 101–108. [Google Scholar] [CrossRef] [PubMed]
  33. Pawelec, A.; Chmielewski, A.; Licki, J.; Han, B.; Kim, J.; Kunnummal, N.; Fageeha, O.I. Pilot plant for electron beam treatment of flue gases from heavy fuel oil fired boiler. Fuel Process. Technol. 2016, 145, 123–129. [Google Scholar] [CrossRef]
  34. Kim, J.-C.; Kim, K.-H.; Armendariz, A.; Al-Sheikhly, M. Electron Beam Irradiation for Mercury Oxidation and Mercury Emissions Control. J. Environ. Eng. 2010, 136, 554–559. [Google Scholar] [CrossRef]
  35. Malik, A.U.; Al-Muaili, F.; Al-Ayashi, M.; Meroufel, A. An investigation on the corrosion of flue gas sensor in boiler stack. Case Stud. Eng. Fail. Anal. 2013, 1, 200–208. [Google Scholar] [CrossRef] [Green Version]
  36. Faghri, A.; Zhang, Y. Transport Phenomena in Multiphase Systems; Academic Press: Cambridge, MA, USA, 2006; ISBN 9780123706102. [Google Scholar]
  37. Qu, M.; Abdelaziz, O.; Gao, Z.; Yin, H. Isothermal membrane-based air dehumidification: A comprehensive review. Renew. Sustain. Energy Rev. 2018, 82, 4060–4069. [Google Scholar] [CrossRef]
  38. Cromer, C.J. Cooling System. U.S. Patent 623,735,4B1, 2001. Available online: https://patents.google.com/patent/US6237354B1/en (accessed on 30 January 2020).
  39. Curtis, M. Air Conditioning System with Moisture Control. U.S. Patent 719,160,7B2, 2007. Available online: https://patents.google.com/patent/US7191607B2/en (accessed on 30 January 2020).
  40. Endo, T.; Terada, H.; Katsumata, N.; Yagi, K.; Kawashima, K. Air Conditioner and Moisture Removing Device for Use with the Air Conditioner. European Patent EP0816779A4, 1998. Available online: https://patents.google.com/patent/EP0816779A4/en (accessed on 30 January 2020).
  41. La, D.; Dai, Y.; Li, Y.; Wang, R.; Ge, T. Technical development of rotary desiccant dehumidification and air conditioning: A review. Renew. Sustain. Energy Rev. 2010, 14, 130–147. [Google Scholar] [CrossRef]
  42. Mazzei, P.; Minichiello, F.; Palma, D. HVAC dehumidification systems for thermal comfort: A critical review. Appl. Therm. Eng. 2005, 25, 677–707. [Google Scholar] [CrossRef]
  43. Mei, L.; Dai, Y. A technical review on use of liquid-desiccant dehumidification for air-conditioning application. Renew. Sustain. Energy Rev. 2008, 12, 662–689. [Google Scholar] [CrossRef]
  44. Wu, G.; Cur, N.O. Squeezable Moisture Removal Device. U.S. Patent US20090158928A1, 2009. Available online: https://patents.google.com/patent/US20090158928A1/en (accessed on 30 January 2020).
  45. Aine, H.E. Infrared Optoacoustic Gas Analyzer Having an Improved Gas Inlet System. U.S. Patent 40,513,72A, 1977. Available online: https://patents.google.com/patent/US4051372A/en (accessed on 30 January 2020).
  46. Baccanti, M.; Magni, P. Process and Apparatus for Determining Total Nitrogen Content by Elemental Analysis. European Patent EP0586969A2, 1994. Available online: https://patents.google.com/patent/EP0586969A2/en (accessed on 30 January 2020).
  47. Jahn, M.D.; Griffin, M.T.; Popkie, N. Apparatus and Method for Water Vapor Removal in an Ion Mobility Spectrometer. U.S. Patent 7,361,206, 2008. Available online: https://patents.google.com/patent/US7361206B1/en (accessed on 30 January 2020).
  48. Karbiwnyk, C.M.; Mills, C.S.; Helmig, D.; Birks, J.W. Minimization of water vapor interference in the analysis of non-methane volatile organic compounds by solid adsorbent sampling. J. Chromatogr. A 2002, 958, 219–229. [Google Scholar] [CrossRef]
  49. Kolb, B.; Zwick, G.; Auer, M. A water trap for static cryo-headspace gas chromatography. J. High Resolut. Chromatogr. 1996, 19, 37–42. [Google Scholar] [CrossRef]
  50. Legendre, M.G.; Fisher, G.S. Inlet System for Direct Gas Chromatographic and Combined Gas Chromatographic/Mass Spectrometric Analysis of Food Volatiles. U.S. Patent 42,454,94A, 1981. Available online: https://patents.google.com/patent/US4245494A/en (accessed on 30 January 2020).
  51. Namieśnik, J.; Wardencki, W. Water Vapour Removal from Gaseous Samples Used for Analytical Purposes. A Review. Int. J. Environ. Anal. Chem. 1999, 73, 269–280. [Google Scholar] [CrossRef]
  52. Son, Y.-S.; Lee, G.; Kim, J.-C.; Han, J.-S. Development of a Pretreatment System for the Analysis of Atmospheric Reduced Sulfur Compounds. Anal. Chem. 2013, 85, 10134–10141. [Google Scholar] [CrossRef]
  53. Ahn, S.; Moon, J.; Kim, D.; Baek, S.; Ryoo, B. Clothes Dryer with a Dehumidifier. U.S. Patent 20060117593A1, 2006. Available online: https://patents.google.com/patent/US20060117593A1/en (accessed on 30 January 2020).
  54. Cromer, C.J. Heat Pump Dryer with Desciccant Enhanced Moisture Removal. U.S. Patent 60,948,35A, 2000. Available online: https://patents.google.com/patent/US6094835A/en (accessed on 30 January 2020).
  55. Lentz, L.E. Dehumidifier Clothes Dryer Apparatus. U.S. Patent 745,817,1B1, 2008. Available online: https://patents.google.com/patent/US7458171B1/en (accessed on 30 January 2020).
  56. Naboulsi, Z.A. System to Reduce Moisture Within a Clothes Dryer. U.S. Patent 20150059201A1, 2015. Available online: https://patents.google.com/patent/US20150059201A1/en (accessed on 30 January 2020).
  57. Sieben, F.; Volkel, T. Air Dehumidifier for Use in a Dryer. U.S. Patent 20120137535A1, 2012. Available online: https://patents.google.com/patent/US20120137535A1/en (accessed on 30 January 2020).
  58. Araki, H.; Shibata, T.; Hatamiya, S.; Tsukamoto, M. Cooling Apparatus, Gas Turbine System Using Cooling Apparatus, Heat Pump System Using Cooling System, Cooling Method, and Method for Operating Cooling Apparatus. U.S. Patent 840,273,5B2, 2013. Available online: https://patents.google.com/patent/US8402735B2/en (accessed on 30 January 2020).
  59. Baudat, N.; Richardson, F. Direct Turbine Air Chiller/Scrubber System. U.S. Patent 20010054354A1, 2001. Available online: https://patents.google.com/patent/US20010054354A1/en (accessed on 30 January 2020).
  60. Kulkarni, A.M.; Ashley Mass, R.M.; Davies, J.C. Mist/Moisture Removal Using Fixed Bed Trickle Columns. U.S. Patent 841,984,4B1, 2013. Available online: https://patents.google.com/patent/US8419844B1/en (accessed on 30 January 2020).
  61. Balinski, B.A.; Jackson, F.G.; McAllister, K.D. Controlled Moisture Removal in a Laundry Treating Appliance. U.S. Patent 1,063,377,6B2, 2020. Available online: https://patents.google.com/patent/US10633776B2/en (accessed on 30 May 2020).
  62. Kim, Y.-J. Washing Machine Having Dehumidifying Apparatus and Dehumidifying Method Thereof. U.S. Patent 20080295696A1, 2008. Available online: https://patents.google.com/patent/US20080295696A1/en (accessed on 30 January 2020).
  63. Saukahanian, G.; Kruger, M. Dehumidifier for Air Utilized in Laundry Drying. U.S. Patent 38,663,33A, 1975. Available online: https://patents.google.com/patent/US3866333A/en (accessed on 30 January 2020).
  64. Downling, R.O. Compressed Air Dryer. U.S. Patent 42,350,81A, 1980. Available online: https://patents.google.com/patent/US4235081A/en (accessed on 30 January 2020).
  65. Nanaumi, K.; Baba, K. Heat Exchanger for Cooling System Compressed Air Dehumidifiers. U.S. Patent 41,934,43A, 1980. Available online: https://patents.google.com/patent/US4193443A/en (accessed on 30 January 2020).
  66. Basseen, S.K.; Harlan, R.A. High Efficiency Air Drying System. U.S. Patent 47,619,68A, 1988. Available online: https://patents.google.com/patent/US4761968A/en (accessed on 30 January 2020).
  67. Tosi, S. Gas Analyzer with Cooling Apparatus. European Patent EP2124049A1, 2009. Available online: https://patents.google.com/patent/EP2124049A1/en (accessed on 30 January 2020).
  68. Chapman, R.L.; Harman, J.N. Thermoelectric Gas Dryer. U.S. Patent 42,312,56A, 1980. Available online: https://patents.google.com/patent/US4231256A/en (accessed on 1 January 2021).
  69. Groeger, H. Process and Apparatus for Pretreatment of a Gas to Be Analysed. European Patent EP0291630A3, 1988. Available online: https://patents.google.com/patent/EP0291630A3/en (accessed on 30 January 2020).
  70. Groeger, C.-M.; Groeger, H. Apparatus for Separating Vaporous Compounds from a Gas Stream. European Patent EP0361068A3, 1989. Available online: https://patents.google.com/patent/EP0361068A3/en (accessed on 30 January 2020).
  71. Bacharach, Inc. Technical Note: Flue Gas Sample Conditioning System (P/N 0024-7224). 2010. Available online: http://www.mybacharach.com/wp-content/uploads/2015/08/Flue-Gas-Conditioner-Manual.pdf (accessed on 11 November 2019).
  72. Kim, D.-J.; Dinh, T.-V.; Lee, J.-Y.; Choi, I.-Y.; Son, D.-J.; Kim, I.-Y.; Sunwoo, Y.; Kim, J.-C. Effects of Water Removal Devices on Ambient Inorganic Air Pollutant Measurements. Int. J. Environ. Res. Public Health 2019, 16, 3446. [Google Scholar] [CrossRef] [Green Version]
  73. Lee, J.-Y.; Dinh, T.-V.; Kim, D.-J.; Choi, I.-Y.; Ahn, J.-W.; Park, S.-Y.; Jung, Y.-J.; Kim, J.-C. Comparison of Water Pretreatment Devices for the Measurement of Polar Odorous Compounds. Appl. Sci. 2019, 9, 4045. [Google Scholar] [CrossRef] [Green Version]
  74. Kondo, M.; Kawanowa, H.; Gotoh, Y.; Souda, R. Hydration of the HCl and NH3 molecules adsorbed on amorphous water–ice surface. Appl. Surf. Sci. 2004, 237, 510–514. [Google Scholar] [CrossRef]
  75. Woittequand, S.; Toubin, C.; Monnerville, M.; Pouilly, B.; Briquez, S.; Picaud, S. Photodissociation of a HCl molecule adsorbed on ice at T=210K. Surf. Sci. 2007, 601, 3034–3041. [Google Scholar] [CrossRef]
  76. Makino, H.; Nakagawa, K. Method for Removing Water Vapor from Water Vapor-Containing Gas. U.S. Patent 47,189,21A, 1988. Available online: https://patents.google.com/patent/US4718921A/en (accessed on 30 January 2020).
  77. Norlien, J.A.; Michler, K.J.; Crawford, A.G. Drying Sample Line. U.S. Patent 50,425,00A, 1991. Available online: https://patents.google.com/patent/US5042500A/en (accessed on 30 January 2020).
  78. Favre, E. Polymeric Membranes for Gas Separation. In Comprehensive Membrane Science and Engineering; Elsevier BV: Amsterdam, The Netherlands, 2010; pp. 155–212. [Google Scholar]
  79. Prasad, R. Membrane Drying Process and System. U.S. Patent 50,840,73A, 1992. Available online: https://patents.google.com/patent/US5084073A/en (accessed on 30 January 2020).
  80. Bolto, B.; Hoang, M.; Xie, Z. A review of water recovery by vapour permeation through membranes. Water Res. 2012, 46, 259–266. [Google Scholar] [CrossRef] [PubMed]
  81. Li, N.N. Membrane Separation. U.S. Patent 3,566,580, 1971. Available online: https://patents.google.com/patent/US3566580A/en (accessed on 30 January 2020).
  82. Baker, R.W.; Wijmans, J.G.; Huang, Y. Permeability, permeance and selectivity: A preferred way of reporting pervaporation performance data. J. Membr. Sci. 2010, 348, 346–352. [Google Scholar] [CrossRef]
  83. Keyser, L.A.; Nelson, D.A.; Thornton, D.C. Dehumidifier for Waveguide System. U.S. Patent 4,944,776, 1990. Available online: https://patents.google.com/patent/US4944776A/en (accessed on 30 January 2020).
  84. Lovelock, J.E. Water-Vapour Permeable Material. U.S. Patent 51,605,11A, 1992. Available online: https://patents.google.com/patent/US5160511A/en (accessed on 30 January 2020).
  85. Bartholomew, S.A.; Bikson, B.; Giglia, S.; Johnson, B.Q. Integral Hollow Fiber Membrane Gas Dryer and Filtration Device. European Patent EP1275432A1, 2003. Available online: https://patents.google.com/patent/EP1275432A1/en (accessed on 30 January 2020).
  86. Eckerbom, A. Trouble-Free Sidestream Gas Analysis; Masimo Sweden AB: Danderyd, Sweden, 2009; Available online: https://www.masimo.com/siteassets/us/documents/pdf/nomoline-trouble-free-sidestream-gas-analysis.pdf (accessed on 11 November 2019).
  87. Zhao, B.; Peng, N.; Liang, C.; Yong, W.F.; Chung, T.-S. Hollow Fiber Membrane Dehumidification Device for Air Conditioning System. Membranes 2015, 5, 722–738. [Google Scholar] [CrossRef] [PubMed] [Green Version]
  88. Liang, C.Z.; Chung, T.-S. Robust thin film composite PDMS/PAN hollow fiber membranes for water vapor removal from humid air and gases. Sep. Purif. Technol. 2018, 202, 345–356. [Google Scholar] [CrossRef]
  89. Baig, M.I.; Ingole, P.G.; Kil Choi, W.; Park, S.R.; Kang, E.C.; Lee, H.K. Development of carboxylated TiO2 incorporated thin film nanocomposite hollow fiber membranes for flue gas dehydration. J. Membr. Sci. 2016, 514, 622–635. [Google Scholar] [CrossRef]
  90. Baig, M.I.; Ingole, P.G.; Kil Choi, W.; Park, S.R.; Kang, E.C.; Lee, H.-K. Water vapor permeation behavior of interfacially polymerized polyamide thin film on hollow fiber membrane substrate. J. Taiwan Inst. Chem. Eng. 2016, 60, 623–635. [Google Scholar] [CrossRef]
  91. An, X.; Ingole, P.G.; Choi, W.-K.; Lee, H.-K.; Hong, S.U.; Jeon, J.-D. Enhancement of water vapor separation using ETS-4 incorporated thin film nanocomposite membranes prepared by interfacial polymerization. J. Membr. Sci. 2017, 531, 77–85. [Google Scholar] [CrossRef]
  92. Ingole, P.G.; Choi, W.K.; Lee, G.B.; Lee, H.K. Thin-film-composite hollow-fiber membranes for water vapor separation. Desalination 2017, 403, 12–23. [Google Scholar] [CrossRef]
  93. Moriyama, N.; Nagasawa, H.; Kanezashi, M.; Tsuru, T. Selective water vapor permeation from steam/non-condensable gas mixtures via organosilica membranes at moderate-to-high temperatures. J. Membr. Sci. 2019, 589, 117254. [Google Scholar] [CrossRef]
  94. Akhtar, F.H.; Vovushua, H.; Villalobos, L.F.; Shevate, R.; Kumar, M.; Nunes, S.P.; Schwingenschlögl, U.; Peinemann, K.-V. Highways for water molecules: Interplay between nanostructure and water vapor transport in block copolymer membranes. J. Membr. Sci. 2019, 572, 641–649. [Google Scholar] [CrossRef]
  95. Leoga, A.J.K.; Roualdès, S.; Rouessac, V.; Follain, N.; Marais, S. Sorption and permeation of water through Plasma Enhanced Chemical Vapour Deposited phosphonic acid-based membranes. Thin Solid Films 2020, 700, 137918. [Google Scholar] [CrossRef]
  96. Zhang, Y.; Du, P.; Shi, R.; Hong, Z.; Zhu, X.; Gao, B.; Gu, X. Blocking defects of zeolite membranes with WS2 nanosheets for vapor permeation dehydration of low water content isopropanol. J. Membr. Sci. 2020, 597, 117625. [Google Scholar] [CrossRef]
  97. Deimede, V.; Vroulias, D.; Kallitsis, J.; Ioannides, T. Pyridinium based Poly(Ionic Liquids) membranes with exceptional high water vapor permeability and selectivity. Sep. Purif. Technol. 2020, 251, 117412. [Google Scholar] [CrossRef]
  98. Perma Pure LLC GASSTM-2040 Gas Sampling System. Available online: https://www.permapure.com/scientific-emissions/products/gas-drying-systems/nafion-based-sample-conditioning-systems/gass-2040-sampling-system/ (accessed on 8 February 2020).
  99. Wang, X.; Peng, L.; Li, J.; Qu, T.; Wang, A.; Li, H. Gas Dewatering Device and Using Method Thereof. Chinese Patent CN104707448A, 2013. Available online: https://patents.google.com/patent/CN104707448A/en (accessed on 30 January 2020).
  100. Jetter, J.J.; Maeshiro, S.; Yamazaki, K. System for Removing Water from a Gaseous Sample. US Patent US6346142B1, 2002. Available online: https://patents.google.com/patent/US6346142B1/en (accessed on 30 January 2020).
  101. Mauritz, K.A.; Moore, R.B. State of Understanding of Nafion. Chem. Rev. 2004, 104, 4535–4586. [Google Scholar] [CrossRef] [PubMed]
  102. Lee, J.-Y.; Dinh, T.-V.; Kim, D.-J.; Choi, I.-Y.; Ahn, J.-W.; Park, S.-Y.; Jung, Y.-J.; Kim, J.-C. Effect of Conventional Water Pretreatment Devices on Polar Compound Analysis. Asian J. Atmos. Environ. 2019, 13, 249–258. [Google Scholar] [CrossRef] [Green Version]
  103. Seo, Y.-K.; Chung, S.-H.; Baek, S.-O. Current Status and Prospective of Hazardous VOC in Ambient Air. J. Korean Soc. Atmos. Environ. 2011, 27, 734–745. [Google Scholar] [CrossRef] [Green Version]
  104. Son, E.-S.; Seo, Y.-K.; Lee, N.-H.; Lee, M.-D.; Han, J.-S.; Baek, S.-O. A Study on the Performance Optimization of a Continuous Monitoring Method for Hazardous VOCs in the Ambient Atmosphere. J. Korean Soc. Atmos. Environ. 2009, 25, 523–538. [Google Scholar] [CrossRef] [Green Version]
  105. US EPA. Dry Impinger Method for Determining Condensable Particulate Emissions from Stationary Sources; United States Environmental Protection Agency: Washington, DC, USA, 2017.
  106. Chen, Y.; Li, G.; Sun, Z.; Guo, H.; Liu, H.; Chen, H.; Du, S.; Yang, Y. Review of Monitoring Methods for Submicronsized Particulates Emission in Coal-fired Power Plants. In Proceedings of the 2016 International Conference on Engineering Science and Management, Zhengzhou, China, 13–14 August 2016. [Google Scholar] [CrossRef] [Green Version]
  107. ISO Stationary Source Emissions. Test Method for Determining PM2.5 and PM10 Mass in Stack Gases Using Cyclone Samplers and Sample Dilution; ISO Stationary Source Emissions: Geneva, Switzerland, 2013; p. 75. [Google Scholar]
  108. US EPA. Measurement of PM2.5 and PM10 Emissions by Dilution Sampling (Constant Sampling Rate Procedures); United States Environmental Protection Agency: Washington, DC, USA, 2004; p. 77.
  109. Feng, Y.; Li, Y.; Cui, L. Critical review of condensable particulate matter. Fuel 2018, 224, 801–813. [Google Scholar] [CrossRef]
  110. Hildemann, L.M.; Cass, G.R.; Markowski, G.R. A Dilution Stack Sampler for Collection of Organic Aerosol Emissions: Design, Characterization and Field Tests. Aerosol Sci. Technol. 1989, 10, 193–204. [Google Scholar] [CrossRef]
  111. Lipsky, E.M.; Robinson, A.L. Design and Evaluation of a Portable Dilution Sampling System for Measuring Fine Particle Emissions. Aerosol Sci. Technol. 2005, 39, 542–553. [Google Scholar] [CrossRef] [Green Version]
  112. England, G.C.; Watson, J.G.; Chow, J.C.; Zielinska, B.; Chang, M.-C.O.; Loos, K.R.; Hidy, G.M. Dilution-Based Emissions Sampling from Stationary Sources: Part 2—Gas-Fired Combustors Compared with Other Fuel-Fired Systems. J. Air Waste Manag. Assoc. 2007, 57, 65–78. [Google Scholar] [CrossRef]
  113. Wang, X.; Watson, J.G.; Chow, J.; Kohl, S.; Chen, L.A.; Sodeman, D.; Legge, A.; Percy, K. Measurement of Real-World Stack Emissions with a Dilution Sampling System. Dev. Environ. Sci. 2012, 11, 171–192. [Google Scholar] [CrossRef]
  114. Wang, X.; Watson, J.G.; Chow, J.C.; Gronstal, S.; Kohl, S.D. An Efficient Multipollutant System for Measuring Real-World Emissions from Stationary and Mobile Sources. Aerosol Air Qual. Res. 2012, 12, 145–160. [Google Scholar] [CrossRef]
  115. Pei, B.; Wang, X.; Zhang, Y.; Hu, M.; Sun, Y.; Deng, J.; Dong, L.; Fu, Q.; Yan, N. Emissions and source profiles of PM2.5 for coal-fired boilers in the Shanghai megacity, China. Atmos. Pollut. Res. 2016, 7, 577–584. [Google Scholar] [CrossRef]
  116. Peng, Y.; Sui, Z.; Zhang, Y.; Wang, T.; Norris, P.; Pan, W.-P. The effect of moisture on particulate matter measurements in an ultra-low emission power plant. Fuel 2019, 238, 430–439. [Google Scholar] [CrossRef]
  117. Cano, M.; Vega, F.; Navarrete, B.; Plumed, A.; Camino, J.A.; Mercedes, M. Characterization of Emissions of Condensable Particulate Matter in Clinker Kilns Using a Dilution Sampling System. Energy Fuels 2017, 31, 7831–7838. [Google Scholar] [CrossRef]
Figure 1. Typical structure of a refrigerated moisture removal device [1].
Atmosphere 12 00061 g001
Figure 2. Structure of an air-to-air heat exchanger [64].
Atmosphere 12 00061 g002
Figure 3. Fundamental flow diagram of a vortex tube [67].
Atmosphere 12 00061 g003
Figure 4. The embodiment of a heat exchanger using a Peltier [68].
Atmosphere 12 00061 g004
Figure 5. Schematic diagram of a sampling probe coupled with a Peltier cooler [71].
Atmosphere 12 00061 g005
Figure 6. Schematic of a permeation membrane tube [76].
Atmosphere 12 00061 g006
Figure 7. Schematic diagram using a gas dryer coupled with a filtration device [85].
Atmosphere 12 00061 g007
Figure 8. Schematic diagram of a dilution module [107].
Atmosphere 12 00061 g008
Figure 9. Dilution system invented by Hildemann et al. [110].
Atmosphere 12 00061 g009
Figure 10. A compact dilution system invented by Lipsky and Robinson [111].
Atmosphere 12 00061 g010
Figure 11. Schematic diagram of a compact dilution system invented by England et al. [112]. (TMF: Teflon membrane filter, QFF: quartz fiber filters, SMPS: scanning mobility particle sizer, MFM: mass flow meter).
Atmosphere 12 00061 g011
Figure 12. A Schematic of the multipollutant dilution system [113,114,115].
Atmosphere 12 00061 g012
Figure 13. Schematic diagram of the hybrid dilution system for measuring low particulate matter emitted from a power plant [116].
Atmosphere 12 00061 g013
Figure 14. General schematic diagram of a dilution system for measuring condensable particulate matter [117].
Atmosphere 12 00061 g014
Table 1. Humidity in the flue gas of some industrial stacks.
Emission SourceTemperature (°C)Humidity (vol%)
Blast furnace (coal fuel) [30,31]725.6–10
Heating station [32]1500.9
Basic oxygen furnace [31]545.7
Coke oven [31,32]79–1500.7–5.1
Electric arc furnace [31]86.74.2
Heavy oil plant [31]2477.3
Cement (drying) [31]10319.4
Cement (pryo-processing) [31]1423.5
Boiler (heavy oil fuel) [33]31010
Power plant (coal fuel) [30,31,32,34,35]100–1770.9–8.7
Hazardous waste incinerator [23]50
Portland cement kiln [23]10–35
Table 2. Development of condensation devices to remove moisture in the flue gas.
No.MethodCondensation TypeAdvantagesDisadvantagesRecommendation of Applicable Analytes
1Refrigerated moisture removal device with improvement of heat exchanger [64]Heterogeneous- Reduced dimension of the device due to the absence of a water separator
- High cooling efficiency
- Less foiling
- Allowable for high loading of moisture.
- Complicated structure
- Potential loss of highly water-soluble compounds
- Poorly water-soluble gases such as CO, NO, CO2, and CH4 due to water droplets absorbing highly water-soluble compounds
2Refrigerated moisture removal device with an extra heat exchanger [65]Heterogeneous- High cooling efficiency
- Allowable for high temperature of the inlet gas
- Allowable for high loading of moisture.
- Bulky
device
- Potential loss of highly water-soluble compounds
- Poorly water-soluble gases such as CO, NO, CO2, and CH4 due to water droplets absorbing highly water-soluble compounds
3Two stages: refrigeration at −40 °C and desiccant bed [66]Heterogeneous-High cooling efficiency
- Allowable for high loading of moisture
- Suitable for highly water-soluble compounds.
- Complex and bulky structure
- Potential loss of certain compounds due to the adsorption of desiccants.
- Highly water-soluble gases such as SO2 or NO2 under a solid phase
4Vortex tube [67]Homogeneous- Low energy consumption
- Less maintenance required
- Potential loss of highly water-soluble compounds- Poorly water-soluble gases such as CO, NO, CO2, and CH4 due to water droplets absorbing highly water-soluble compounds.
5Peltier moisture removal device [68]Heterogeneous- Compact size
- Low energy consumption
- Suitable for highly water-soluble compounds
- Not operatable with a high loading amount of moisture
- Unsuitable for a high temperature of the inlet gas
- Highly water-soluble gases such as SO2 or NO2 under a solid phase.
6Two stages: Peltier and membrane [69]Heterogeneous- Allowable for high loading of moisture.- Potential loss of certain compounds due to the selectivity of the membrane
- Potential loss of highly water-soluble compounds due to water droplets.
- Poorly water-soluble gases such as CO, NO, CO2, CH4 due to water droplets absorbing highly water-soluble compounds.
7Conical cooling tube using a Peltier [70]Heterogeneous- Compact size
- Large contact surface
- Easy manufacturing due to its simple structure.
- Potential loss of highly water-soluble compounds due to water droplets.Poorly water-soluble gases such as CO, NO, CO2, and CH4 due to water droplets absorbing highly water-soluble compounds
8Peltier probe [71]Heterogeneous- Easy reduction in the temperature of an extractive line
- Saving energy for a CEMS.
- Hard to maintain due to in situ location
- Potential loss of highly water-soluble compounds due to water droplets.
Poorly water-soluble gases such as CO, NO, CO2, and CH4 due to water droplets absorbing highly water-soluble compounds.
Table 3. Development of permeation devices to remove moisture in the flue gas.
No.DeviceMembrane TypeMaterialsAdvantagesDisadvantagesRecommendation of Applicable Analytes
1Heater cartridge [83]Any commercial membraneAny commercial membrane- A dry gas tank is unnecessary.
- The condensation does not occur on the membrane surface.
- The device is bulky
- It consumes a lot of energy due to the compressor and heater.
Target gases depended on membrane’s specification.
2Integral moisture membrane and particle filter [85]PolymerAny commercial product- The effect of particles on the membrane is reduced.
- The particle filter helps to enhance the lifetime of the membrane.
-Maintaining the filters is costly.Target gases depended on membrane’s specification.
3Two-stage permeable tubes [100]PolymerPerfluorinated polymer plastic- The device has a high moisture removal efficiency.
- Condensation cannot occur on the membrane surface.
- It shows a high loading amount of moisture.
- The device may consume a lot of energy
- Particles may damage the membrane surface due to the absence of a filter.
The authors recommend the device be used for an FTIR analyzer.
4Two-stage winding cylinder device [99]PolymerNafion®- The device has a high moisture removal efficiency.
- Condensation cannot occur on the membrane surface.
- It has high loading of moisture.
- It shows a high selectivity.
- The device may consume a lot of energy
- Nafion® membrane is sensitive to particles.
- Nafion® membrane has been widely applied for CO, CO2, NO, NO2, HCl, NH3, H2S, and SO2 measurements.
Table 4. Development of dilution systems for particulate matter measurement.
No.MethodCharacteristicsAdvantagesDisadvantagesApplication
1U-shaped dilution system [110]- Flow rate: 30 L/min
- Gas temperature: 150 °C
- Dilution ratio: 25–100-fold
Able to improve the collection of organic carbon- Bulky system
- Significant loss of particle in the size range of 1–2 µm
Condensable plus filterable particulate matter
2Compact dilution system [111]- Flow rate: 174 L/min
- Gas temperature: 150–300 °C
- Dilution ratio: 20–350-fold
- Compact size due to absence of residence time tank
- Retention time of sample
gas < 1 s
- Able to operate at a high and wide temperature range of inlet gas
- Potential change of particle shape according to dilution ratio
- Potential for significant bias
Filterable particulate matter
3Compact dilution system [112]- Flow rate: 113 L/min
- Gas temperature: <175 °C
- Dilution ratio: 20:1
- Small dimensions of the system
- Low minimum detection limit of particles compared to a standard method
- Potential for significant bias (27–34%)Condensable plus filterable particulate matter
490° elbow dilution chamber [113,114,115]- Flow rate: 125 L/min
- Gas temperature: 146–174 °C
- Dilution ratio: 20–50-fold
- Compact size
- Various functions for particulate and gaseous measurements- Low measurement bias
- Complicated structure
- Hard to maintain
Condensable plus filterable particulate matter
5Hybrid dilution system coupled with Nafion® dryer [116]- Gas temperature: 50 °C
- Dilution ratio: 8:1
- Suitable for a wide range of particles, especially ultra-low particulate matter
- Low measurement bias caused by humidity
- Costly due to Nafion® dryer
- Hard to maintain
Filterable particulate matter
6Dilution system with a filter for filterable particulate matter [117]- Gas temperature: 190–200 °C
- Dilution ratio: 10–40-fold
- Highly accurate for condensable particulate matter- Hard to maintain
- Potential bias due to pore filter size
Condensable particulate matter
Publisher’s Note: MDPI stays neutral with regard to jurisdictional claims in published maps and institutional affiliations.

