Abstract
Ambient exposure to particulate matter (PM) air pollution is known to have an adverse effect on public health worldwide. Rapid increase rates of economic and urbanization, industrial development, and environmental change in China have exacerbated the occurrence of air pollution. This study examines the temporal and spatial distribution of PM on national, regional and local scales in China during 2014–2016. The relationships between the PM2.5 concentration rising rate (PMRR) and meteorological parameters (wind speed and wind direction) are discussed. The dataset of Air Quality Index (AQI), PM10 (PM diameter < 10 ) and PM2.5 (PM diameter < 2.5 ) were collected in 169, 369, and 367 cities in 2014, 2015, and 2016 over China, respectively. The results show that the air quality has been generally improved on the national scale, but deteriorated locally in areas such as the Feiwei Plain. The northwest China (NW) and Beijing-Tianjin-Hebei (BTH) regions are the worst areas of PM pollution, which are mainly manifested by the excessive PM10 caused by blowing dust in spring in NW and the intensive emissions of PM2.5 in winter in BTH. With the classified seven geographic regions, we demonstrate the significant spatial difference and seasonal variation of PM concentration and PM2.5/PM10 ratio, which indicate different emission sources. Furthermore, the dynamic analysis of the PM2.5 pollution process in 11 large urban cities shows dramatic effects of wind speed and wind direction on the PM2.5 loadings.
1. Introduction
Rapid increasing rates of economic and urban growth, industrial development, and environmental change in China have increased the occurrence of air pollution. In recent years, frequent heavy pollution incidents caused by particulate matter have become an urgent problem in China. Severe and sustained air pollution threatens the sustainable development of the economy and society, and also seriously affects human health [1]. Because of the severe situation and adverse effects of ambient air pollution, the State Council of China issued the “Three-Year Action Plan to Win the Blue Sky Defense War” (the “Plan”) in 2018, aiming for a three-year effort to mitigate air pollution. Therefore, to determine the spatiotemporal distribution of particulate matter (PM) concentrations and to analyze the dynamic process of them will help achieve the “Plan” on time.
Over the last decade, a series of crucial measures have been taken to prevent further deterioration of air pollution in China. The sulfur removal from coal-fired power plants, installation of selective catalytic reduction systems, promotion of new energy sources for automobiles, and prohibition of old and polluting vehicles have been successively implemented [2,3,4]. The “Air Pollution Prevention and Control Action Plan” was enacted by the Chinese government in 2013. Afterward, a new stringent law on environmental protection was implemented in 2015 [5]. The latest studies reported that ambient air quality in China has shown signs of improvement in recent years, mainly due to the implementation of national policies. For example, Wang et al. [6] indicated that annual-averaged PM concentrations were lower in 2014 than that in 2013 at most stations in China, owing to the responses of local governments and public to the national policies. van der A et al. [3] demonstrated that the concentration of SO2 and NO2 would be 2.5 times and 1.25 times higher than the actual values in 2017 without the air quality regulations, respectively. Yang et al. [7] pointed out that the PM2.5 and PM10 concentrations showed a decreasing trend in China in recent years, which was due to the plan and law enacted in 2013 and 2015. Although the air quality has been improved in China, the PM concentrations are still much higher than those in developed countries [7]. Because of a lack of long-term and large-scale ground-based PM monitoring data in China, previous studies mainly focused on air pollution in a local city, several cities, or a region. Nonetheless, these researches indeed helped to obtain a deep understanding on the spatiotemporal characteristics of ambient air pollution and its impact on atmospheric visibility, climate change, human health, and socio-economic development. Zheng et al. [8] used 24-h PM2.5 samples simultaneously collected at five sites with 6-day intervals in January, April, July, and October 2000 to reveal seasonal trends of PM2.5 source contributions in Beijing, China. Wu et al. [9] analyzed ambient air pollution levels in the cities of Guangzhou, Chongqing, Lanzhou and Wuhan of China from 1993 to 1996 by continuous observations. Based on the observation data of total suspended particles and PM10 during 1999–2001, Chu et al. [10] pointed out the urgency of controlling air pollution in Lanzhou, China. Zhao et al. [11] studied the spatiotemporal variations of PM2.5 and its chemical compositions in the region of Beijing-Tianjin-Hebei (BTH) via observations from 2009 to 2010. In addition, some researchers attempted to reveal the large-scale distribution characteristics of aerosol optical depth (AOD) based on satellite observations. Although the correlation between PM2.5 and AOD has been established, it may be significantly different in a specific time and space range [12,13,14,15,16,17]. The satellite retrieved PM2.5 has its advantage to make up the sparse ground-based observation, but the AOD-based retrieve method is quite limited in describing the large-scale PM2.5 distributions [18,19].
Fortunately, the real-time hourly average air quality index (AQI) and concentrations of six pollutants, i.e., PM2.5, PM10, ozone (O3), carbon monoxide (CO), nitrogen dioxide (NO2), and sulfur dioxide (SO2), have been collected at the national air quality monitoring sites (NAQMS) in major Chinese cities and released to the public since January 2013 (http://113.108.142.147:20035/). This event directly provides an excellent opportunity for us to analyze nationwide air pollution characteristics via ground-based data. Wang et al. [20] reported the spatial and temporal variations of air pollutants in 31 Chinese cities from March 2013 to February 2014 using hourly data collected at NAQMS for the first time. Hu et al. [21] introduced the characteristics of PM2.5 and PM10 in the North China Plain (NCP) and the Yangtze River Delta (YRD) in China during the summertime in 2013. Xie et al. [22] discussed the relationships between six pollutants from March 2013 to March 2014 in 31 Chinese provincial capital cities. Zhang and Cao [23] presented the seasonal and diurnal variations, as well as the spatial distribution of PM2.5 between 2014 and 2015 in China. Zhao et al. [24] analyzed the annual and diurnal variations of gaseous and particulate pollutants in 31 Chinese provincial capital cities using one-year (2014–2015) data. He et al. [5] studied the characteristics of air pollutants and their relationship with meteorological conditions from 2014 to 2015. Song et al. [2] investigated the spatial and temporal variations of air pollutants, the major pollutants, the temporal evolution of polluted days, the inter-correlation of air pollutants, and the population exposure in recent years. The studies above discussed pollution levels, air quality trends, and spatial patterns from a static point of view, rather than describing dynamic pollution processes nationwide. Importantly, the dynamic changes in PM2.5 concentrations can better illustrate the impacts of regional transport, meteorological conditions, and secondary reactions [25].
There still exists incomprehensive analysis of PM pollution over China from multiple scales and perspectives in the previous studies. The aim of this study is to obtain the spatiotemporal variations of pollutants on different scales and to analyze the pollution process of fine particles from a dynamic perspective. In this paper, we present the study of PM pollution characteristics on the national, regional (classified seven geographic areas) and local (11 large urban cities) scales in China by using the data of AQI, PM2.5, PM10, wind speed and wind direction in 2014–2016. The spatial and temporal (annual, seasonal and hourly) variations of PM are characterized. It is recognized that inhalation of fine aerosols, especially ultrafine particles, is detrimental to human health [26]. Therefore, the ratio of PM2.5 to PM10 and its variations are investigated, which indicates different emission sources of the PM. In particular, to understand the PM2.5 pollution formation mechanisms, we analyze the PM2.5 concentration rising rate (PMRR) and demonstrate its correlation with the wind. The layout of the paper is as follows. Section 2 presents the study areas, the data, and the main methodologies. In Section 3, the national and regional characteristics of air pollution are discussed and the dynamic PM2.5 pollution processes in 11 cities are analyzed. A short summary is shown in Section 4.
2. Data and Methods
To illustrate the characteristics of ambient air quality and the dynamic processes of PM2.5, we used the ground-based air quality and meteorological data from 2014 to 2016, covering 11 large cities (typical cities with the population greater than 6 million and the gross domestic product over 400 billion RMB except for Lhasa and Urumqi) and seven geographic regions in China. In addition, the spatial interpolation method of AQI and PM concentrations and the method for the identification of PM2.5 pollution processes were used in this study. More details are provided in the subsections below.
2.1. Study Areas
The air pollution data were collected in 169, 369, and 367 cities in 2014, 2015, and 2016 in China, respectively. The data cover 31 provinces and municipalities, as well as seven geographic regions (Table 1). When the dynamic processes of PM2.5 concentrations were studied, we selected 11 typical cities (Table 1) from the seven geographic regions.

Table 1.
Seven geographic regions and 11 typical cities.
2.2. Air Quality and Ground-Based Meteorological Data
The hourly-averaged mass concentrations of PM2.5 and PM10, as well as AQI, were obtained in 169, 369, and 367 cities in 2014, 2015, and 2016, respectively, by the China National Environmental Monitoring Center, Environmental Monitoring of China (http://datacenter.mep.gov.cn/). The layout of sampling sites followed the criterion of “Technical regulation for selection of ambient air quality monitoring stations (on trial)” (HJ 664-2013), and these sites were in accordance with the five principles of representativeness, comparability, integrity, foresight and stability. According to the “Ambient air quality standard” (GB3095-2012), at each site a tapered element oscillating microbalance [27] and the β-ray method [28] were used to measure the mass concentrations of PM. The detection and treatment of outliers conformed to the “Statistical interpretation of data—Detection and treatment of outliers in the normal sample” (GB/T 4883—2008). In addition, AQI is calculated based on the level of six pollutants (PM2.5, PM10, O3, CO, NO2, and SO2) for the quantitative description of air quality. The AQI is divided into six levels according to the technical regulation on ambient air quality index (HJ 633–2012, on trial) of China—excellent (0 < AQI ≤ 50), good (50 < AQI ≤ 100), light pollution (100 < AQI ≤ 150), moderate pollution (150 < AQI ≤ 200), severe pollution (200 < AQI ≤ 300), and very severe pollution (AQI > 300), respectively.
In order to explore the characteristics of PM2.5 dynamic pollution processes, the meteorological data including wind speed and wind direction with a time resolution of three hours during the study period in the 11 selected cities were used. The data were obtained from the China Meteorological Data Network (http://data.cma.cn).
2.3. The Spatial Interpolation Method of AQI and PM Concentrations
The Cressman objective analysis method [29] was used in this study to obtain the spatial distributions of AQI and PM concentrations on a nationwide scale. It is a successive correction interpolation scheme that minimizes the error caused by the interpolation of discrete points into grid points. It has been widely used in the objective analysis of various diagnostic analysis and numerical prediction schemes in the meteorological field [30,31,32]. A non-zero weighting function within a prescribed radius of influence is applied in this scheme, and the radius of influence decreases with each successive scan. The grid values converge to the observations after several scans. In this way, the grid values reflect the observations in areas of high observation density, while they are closer to the background field in areas of low observation density. The Cressman weighting function [29] is described briefly as follows:
where is the radius of influence, is the number of observation sites within , is the distance from the grid point to the observation sites, and is the weighting factor of the observation site j.
It is somewhat empirical to select the appropriate value of , which depends on the observation site density and desired level of smoothing. Generally, a larger value of results in higher smoothing. Empirically, twice the average distance of the observation sites may be an effective trade-off between over-smoothing and under-smoothing [33]. Therefore, the data are interpolated in space to a 0.5° × 0.5° grid, and the values of are 10, 5, 2.5, and 1 (unit: grid, about 500 km, 250 km, 125 km, and 50 km), respectively, in descending order. Such settings of can take into account the sparse sites in Western China and the dense sites in Eastern China.
2.4. The Method for the Identification of PM Pollution Processes
The PM2.5 pollution process is defined in a dynamic way as consistent and steady accumulations of PM2.5 pollutants, with the assumption of PM2.5 concentrations increase linearly during a given PM2.5 pollution process [25]. Following the description above, the increase of PM2.5 concentration in a PM2.5 pollution process lasting for T hours can be expressed as the following equation:
where represents the PM2.5 concentration at time , and the range of is from the first hour to the last hour of a PM2.5 pollution process. and are the slope and intercept of the linear fit of a PM2.5 pollution process, respectively. The slope denotes the rising rate of PM2.5 concentration (PMRR), which is the indicator of the strength of a PM2.5 pollution process. In this study, a specific PM2.5 pollution process is indicated by the following two stringent requirements at the same time to indicate a specific PM2.5 pollution process well: 18, and the R2 of the linear regression must be 0.8. The standard of time span ensures that the whole PM2.5 pollution process is not within diurnal variation. The limit of R2 guarantees that the whole PM2.5 pollution process is under relatively stagnant meteorological conditions, rather than short-time dramatic changes of PM2.5 concentration caused by unstable weather or pollution transport.
3. Results and Discussion
3.1. Spatiotemporal Variations of AQI and PM in China
The monthly variations of AQI, PM10, and PM2.5 in China during the study period are presented in Figure 1. In terms of inter-annual variability, the air quality in China from 2014 to 2016 shows a trend of obvious improvement; AQI, PM10 concentration, and PM2.5 concentration decline at rates of 7.97, 10.96 µg/m3, and 7.88 µg/m3 per year, respectively. In line with this trend, the annual average PM2.5 concentration in China will reach the National Ambient Air Quality Standard of the U.S. (12 µg/m3) in 2021, but the closer the air quality approaches the designed standard value, the more difficult it will be to improve. In each year, the air quality shows a remarkable seasonal variability with the best air quality in summer and the worst in winter. In addition, the amplitude of variation of air quality in summer is smaller than that in winter. Therefore, the study of air quality in winter becomes very important in China. Serious air pollution in winter is associated with increased anthropogenic emissions from fossil fuel combustion and biomass burning, and adverse weather conditions for pollutants dispersion [5,34]. In addition to the accumulation of primary emissions, the formation of new particles and secondary production of both organic and inorganic aerosols may further increase PM concentrations [23,35,36].
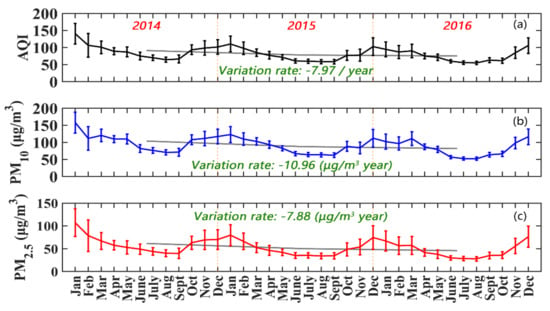
Figure 1.
The time series of the monthly average of (a) air quality index (AQI), (b) particulate matter (PM)10 concentration, and (c) PM2.5 concentration in China during 2014–2016. The error bars indicate standard deviations. The grey lines represent the variation trends of the AQI and the concentrations of the particulate matter, and the variation rates are computed by the annual average values.
Figure 2 shows the spatial properties of the seasonal average AQI, PM2.5 and PM10 concentration during the study period. We should note that the AQI values are more likely representative of PM2.5 in winter and PM10 in spring. Generally, NW and BTH are the two major areas of air pollution, mainly due to the high concentration of PM10 during springtime in NW and the high concentration of PM2.5 during wintertime in BTH (see Figure 3 for the geolocation of the three major metropolitan agglomerations).
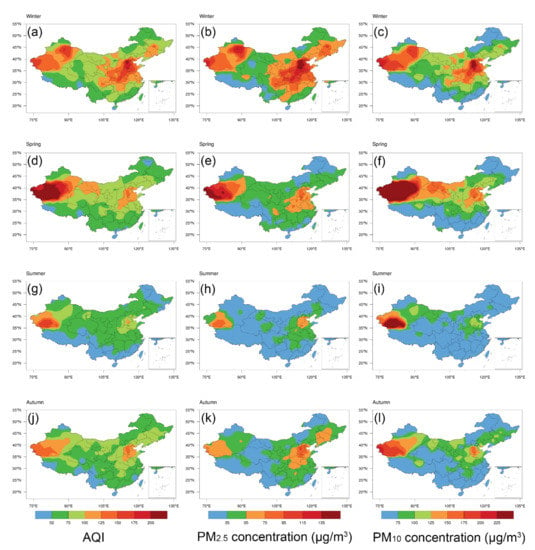
Figure 2.
The spatial distributions of seasonal average AQI, PM2.5 concentration, and PM10 concentration during (a–c) winter, (d–f) spring, (g–i) summer, and (j–l) autumn.
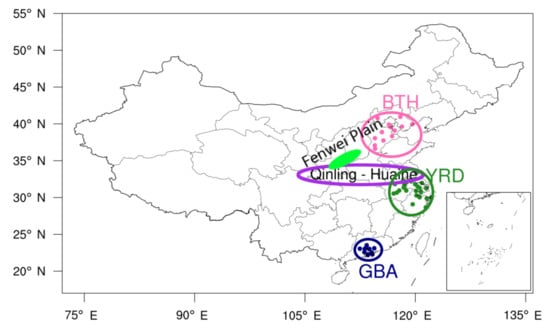
Figure 3.
Map of the three major metropolitan agglomerations, the Fenwei Plain, and the Qinling Mountains-Huaihe River. The red, green and blue dots denote Beijing-Tianjin-Hebei (BTH), Yangtze River Delta (YRD) and Greater Bay Area (GBA) metropolitan agglomerations, respectively. The green filled area represents the approximate location of Fenwei Plain. The region within the purple ellipse indicates the general location of Qinling Mountains-Huaihe River.
The transport and deposition of wind-blown dust in NW China (Taklimakan desert and Gobi desert) may cause the PM10 concentration peaks in spring, while the concentration of PM2.5 also increases at the same time in NW. As shown in Figure 2f, more dust aerosols are blown up by strong winds from more exposed land surfaces in NW during springtime, and the dust particles move along a certain route: Taklimakan Desert, Hexi Corridor, Loess Plateau, North China Plain, which makes PM10 pollution in the area along the transmission route high.
A number of heavy industries (e.g., cement plants and steel mills) are located in BTH, leading to a large amount of perennial coal aerosol emissions [23]. In addition, the stagnant weather conditions with relatively low planetary boundary layer height (PBLH), weak wind, and stable atmospheric stratification often occur in BTH, especially during wintertime, favoring the formation and accumulation of pollutants [37,38,39]. Moreover, previous studies have pointed out that the severe air pollution in BTH is not only caused by local sources but also by the regional transport and secondary production of aerosols [40,41,42]. In summary, multiple factors such as local emissions, regional transport and adverse meteorological conditions have contributed to the high PM2.5 pollution in the BTH region throughout the year. In winter, not only the BTH region, but also vast areas around it, are affected by severe fine particulate pollution. Therefore, the joint prevention and control of PM2.5 pollution in the BTH region and surrounding areas is extremely urgent.
In contrast to the two seriously polluted areas, the agriculture and light industry dominate the economic development of SW and SC, which consume less fuel and produce lower emissions. In addition, under favorable meteorological conditions such as abundant precipitation, which could scavenge the aerosol pollutants [43]. Therefore, the air quality of these two regions ranks best in the country.
The three major metropolitan agglomerations in China as shown in Figure 3, in descending order of the air quality from the best, are the Greater Bay Area (GBA: Guangdong–Hong Kong–Macau), the Yangtze River Delta (YRD), and the BTH.
The concentrations of PM10 and PM2.5 can be used to describe the intensity of PM pollution, while the ratio of PM2.5 to PM10 concentration (PM2.5/PM10) can be used to gauge the contribution of fine particles [44]. In addition, the ratio of PM2.5/PM10 can explain the types of pollution and possible sources of pollutants; generally, the wind-blown dust and soil particles are coarse-mode dominant while the industrial and urban aerosols are fine-mode dominant. Figure 4 depicts the spatial distributions of the monthly average of PM2.5/PM10 during 2014–2016. In general, the southern areas of Qinling Mountains-Huaihe River (the detailed geographical information is shown in Figure 3) suffer from fine PM pollution all year round, while in the arid and semi-arid areas of NW with sparse vegetation coverage, the aerodynamic diameter between 2.5 µm and 10 µm (PM2.5–10) dominates the air quality. Indeed, the spatial difference of PM2.5/PM10 ratio, to a great degree, depends on the regional differences of population and economy in China. The seasonal PM2.5/PM10 ratio is slightly higher in winter (DJF) than that in the other seasons. During winter, the fine particulate pollution affects most areas of China, especially the densely populated regions, indicating a large amount of anthropogenic emissions and unfavorable atmospheric diffusion conditions. This result is consistent with other researches in China [6,45,46]. Only in the arid and semi-arid areas of NW, due to natural sources such as dust particles, is the ratio of PM2.5/PM10 below 0.5. During spring (MAM), in the whole regions of NW and NC even most of NE over China, the PM2.5/PM10 ratio is smaller than or near 0.5, which indicates significant contributions from local aeolian dust emission and regional dust transport [47]. During summer (JJA) and autumn (SON), the PM2.5/PM10 ratio is generally large in southeast China and small in northwest China, but not as exaggerated as the high value in winter and the low value in spring, which represents lower anthropogenic emissions, better atmospheric diffusion conditions, and less wind-driven dust emissions in summer and autumn.
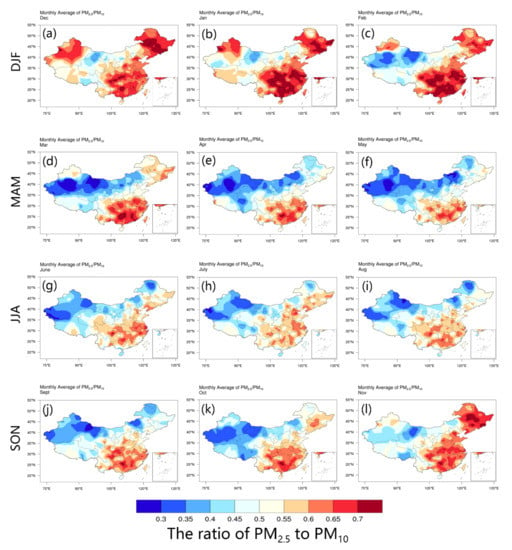
Figure 4.
The spatial distributions of PM2.5/PM10 in (a–c) winter (DJF), (d–f) spring (MAM), (g–i) summer (JJA), and (j–l) autumn (SON) during 2014–2016.
Figure 5 demonstrates the relative annual change rate of AQI, PM10 concentration, and PM2.5 concentration in China. The annual change rate represents the variation in air quality compared with the previous year, which is dimensionless. The changes in these three variables show excellent spatial and temporal consistency. Admittedly, the air quality was improving in most of the regions during the study period in China. Nevertheless, the southwest Xinjiang, the northeast Tibet and the southern Yunnan in 2015, and the most areas of Xinjiang and Tibet, as well as the Fenwei Plain (see Figure 3 for the geolocation), in 2016 all have heavier pollution in varying degrees compared with that in the previous year. Therefore, it is particularly significant to separate different regions for air pollution research, as shown in the next section.
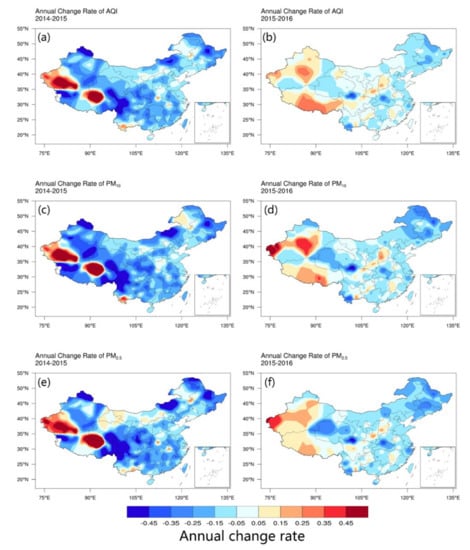
Figure 5.
The annual change rate of (a–b) AQI, (c–d) PM10 concentration, and (e–f) PM2.5 concentration from 2014 to 2015, and from 2015 to 2016.
3.2. Comparisons of Air Pollution in Seven Geographic Regions
Regional differences in air pollution are particularly obvious in China due to complex topography, climate and economic/industrial structures. Figure 6 illustrates the cumulative distribution functions (CDF) of daily regional averaged AQI, PM10 concentration, PM2.5 concentration, and PM2.5/PM10 ratio during 2014–2016. From the perspective of AQI, about half of the days in SC the air quality reaches excellent, which is the best among the seven regions, followed by the SW as the second-best air quality region, but the percentage of days with excellent air quality in SW is less than 30%. Next, the descending order of air quality is NE, EC and NW, and the moderate as well as above polluted days account for about 5% in these three regions simultaneously. Finally, the air quality in NC and CC is worst, with 10% of the days reaching moderate pollution level or above. However, the NW region has the least number of days with AQI less than 70, and it hardly reaches excellent air quality conditions all year round, which indicates that there are few chances of wet deposition of PM in the arid NW. There are similar regional differences in PM concentrations as in AQI, except in NW, NC and CC. From the view of PM10, air pollution concentrations in these three regions are roughly at the same level, whereas we notice the PM2.5 air quality levels in NW and NC are better than that in CC, especially in NW with its PM2.5 pollution level even lower than that in EC. The value of PM2.5/PM10 ranges from 0.2 to 0.8 in the seven regions, but they vary significantly in CDF. About three-quarters of the days in NW have a low PM2.5/PM10 ratio which less than 0.5, but this phenomenon in SC occurs fewer than 5% of the days. The other five regions are somewhere in between that of NW and SC, with the PM2.5/PM10 less than 0.5 for less than half of all days.
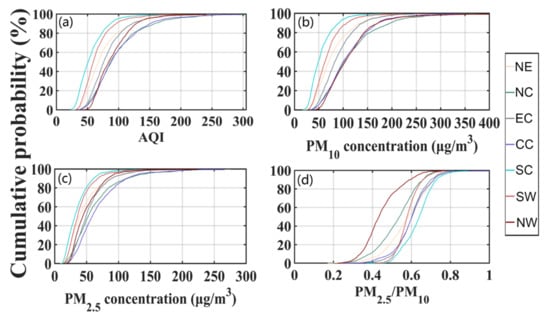
Figure 6.
The cumulative distributions of daily regional averaged (a) AQI, (b) PM10 concentration, (c) PM2.5 concentration, and (d) PM2.5/PM10 in seven geographic regions (classified in Table 1) during 2014–2016.
Figure 7 depicts the diurnal variations of AQI and PM concentrations in the seven regions in each season in China. Generally, except the PM10 concentration in NW area caused by wind-blown dust emissions in spring, PM pollution in CC and NC area is among the highest in the whole country. Specifically, it appears that in NC, AQI and PM10 concentration are higher than those in CC from spring to autumn, and then lower in winter. The PM2.5 concentration in CC is higher or close to that in NC year around, indicative of the dominance of anthropogenic sources in CC. The PM10 concentration in NW area ranks first to third in four seasons among the seven regions, while the PM2.5 concentration only ranks fourth to fifth. The seasonal rankings of PM pollution in EC, NE, SC and SW areas are not significantly different, which is basically consistent with the conclusion shown in Figure 6. Only in autumn are the PM pollution rankings of NE and SC relatively higher than in other seasons, which are equal to that in EC and SW area, respectively. Crop residue burning in the NE area is the most active among the seven regions in autumn for the harvesting time of crops [48], and the biomass burning contributions to PM in SC are also underscored in autumn [23,49]. In addition, the fact that the residential heating in the NE area begins in autumn is another possible reason.
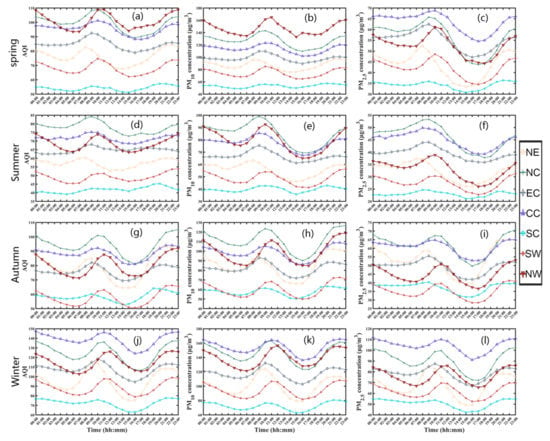
Figure 7.
The diurnal variations of AQI, PM10 concentration and PM2.5 concentration in the seven regions in (a–c) spring, (d–f) summer, (g–i) autumn, and (j–l) winter.
As shown in Figure 7, the bimodal and dual valley patterns of diurnal AQI, PM10 and PM2.5 concentrations are observed in most of the seven regions, and the peaks are located at noontime and midnight while the lowest values or troughs are in the morning and afternoon. However, the troughs in the morning are not obvious or absent in NC, EC, CC and SC in certain seasons of the four seasons, especially in summer. China is a vast country covering five time zones, but the time of the data is Beijing time. Therefore, the troughs and peaks of AQI and PMs are obviously ahead in NE, while lagging behind in NW and SW of China. In the early morning, because of the temperature inversion, the planetary boundary layer (PBL) is stable and relatively low [50]. The PMs, especially PM10, are removed by gravitational settling and create the first trough at around sunrise. After sunrise, increased PM emissions lead to persistent increases in PM concentrations (e.g., traffic emissions). In addition, the solar radiation, ambient temperature and wind speed with sunrise cause the formation of the convectively mixed boundary layer (CBL) [45,51], and promote the generation of secondary particles (nitrate, sulfate and organic carbon) [52]. Hence, the first peak occurs around noon. In the afternoon, the diffusion conditions of PBL becomes much better due to the higher PBL-height (PBLH) caused by strong solar heating and higher surface temperature. The AQI and PM concentrations continue to decrease until sunset and then reach their second trough at sunset. After that, the PBLH decreases as the surface temperature falls, at the same time, anthropogenic aerosol emissions increase owning to the evening traffic-rush hour and domestic heating in winter, and the primary aerosols in the PBL accumulate continuously, which eventually cause the second peak at midnight [23,53].
3.3. PM2.5 Pollution Processes in the 11 Typical Cities
The results we discussed above are based on static conditions to understand the level of air pollution in China. To our best knowledge, the long-term PM2.5 observations have rarely been studied from a dynamic view. In this study, we analyzed PM2.5 pollution processes using three-year data of hourly PM2.5 concentration from January 2014 to December 2016 in 11 Chinese cities.
As shown in Figure 8, the distributions of the duration time of the PM2.5 pollution processes are similar in the 11 cities. When the duration time increases, the occurrence frequency of the dynamic pollution processes decreases. In general, the processes occur more frequently in the cities in NC, CC and EC. Zhengzhou shows the highest frequency of PM2.5 pollution process, ranking first with 414 events, while the probability in Lhasa is the lowest, with only 28 events due to less anthropogenic emissions in Tibet Plateau. Beijing is the city with the most frequent occurrences of the process lasting 72 h (3 days) or more, with a total of 14 times, while the processes in Lhasa last no more than 54 h.
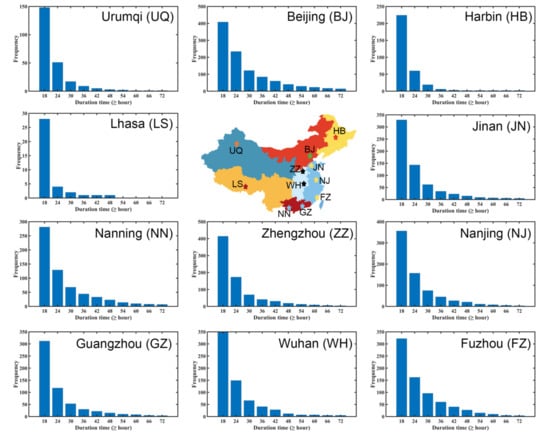
Figure 8.
The distributions of duration time of PM2.5 pollution processes in the 11 typical cities.
As shown in Figure 9a, the monthly variations of PMRR are remarkable, showing high values in autumn and winter and low values in spring and summer in the 11 cities. In the meantime, the variation trends of PMRR are somewhat similar to the variations of its corresponding averaged PM2.5 concentration in each process, which is consistent with the previous study [25]. Furthermore, based on the data of each process in all the cities, we found that there is a clear positive correlation between the PMRR and the PM2.5 concentration (R = 0.73, p < 0.05) (Figure 9b), which indicates that the PMRR can simultaneously characterize the level and intensity of a PM2.5 pollution process.
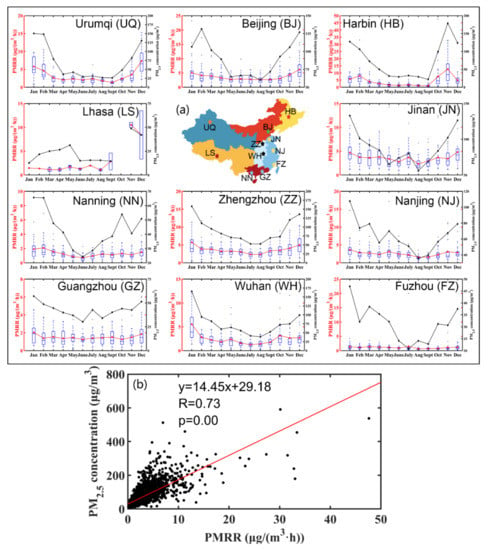
Figure 9.
(a) The boxplots of the rising rate of PM2.5 concentration (PMRR) (blue boxes), monthly average PMRR (red lines), and monthly average PM2.5 concentration during the pollution processes (black lines) in the 11 cities, and (b) the relationship between PMRR and PM2.5 concentration.
Wind speed and direction are key parameters for both the dispersion of local PM2.5 emissions and the regional transport of PM2.5 [54,55,56]. Table 2 describes the changes in wind speed during PM2.5 pollution processes in detail. Each city has a 6–19% decline of wind speed during PM2.5 pollution processes except Lhasa, where the wind speed rose, but with few data available. At the same time, Figure 10 shows the relationships between the PMRR and its corresponding wind speed in the 11 cities. The relationship between the two variables is negative in most cities except Wuhan, indicating strong winds have positive effects on the dispersion of PM2.5. More than half of the 11 cities had p-values less than 0.05, suggesting wind speed has a significant influence on the dispersion of PM2.5 pollution. However, the cities with relatively high p-values (e.g., Nanjing, Wuhan and Jinan) are both affected by the dispersion of pollutants and the transportation of PM2.5 from windward areas when the wind speed increases. When the diffusion and transport of PM2.5 act simultaneously, the contribution of wind speed to PMRR will become insignificant, so the p-values slopes are both large (the slope is negative). Therefore, the regression slopes and p-values in Figure 10 are clear indicators of whether the influence of regional PM2.5 transport is obvious in each city. PM2.5 in Lhasa is mainly emitted from local sources [57], so the slope is the smallest among all the 11 cities. It is worth noting that the p-value in Lhasa is 0.06, which is due to the few data available. Wuhan is a city suffering from strong regional PM2.5 transport [58]; therefore, the slope is the largest among all the 11 cities and even becomes positive. In general, the PM2.5 in Urumqi, Lhasa, Beijing, Zhengzhou, Nanning and Guangzhou are more likely to disperse with the increase of wind speed than in other cities. On the contrary, in other cities, such as Wuhan, the increase in wind speed would sometimes lead to the accumulation of PM2.5 due to regional transport.

Table 2.
The three-year average wind speed, the average wind speed during PM2.5 pollution processes, and its change rate in the 11 cities.
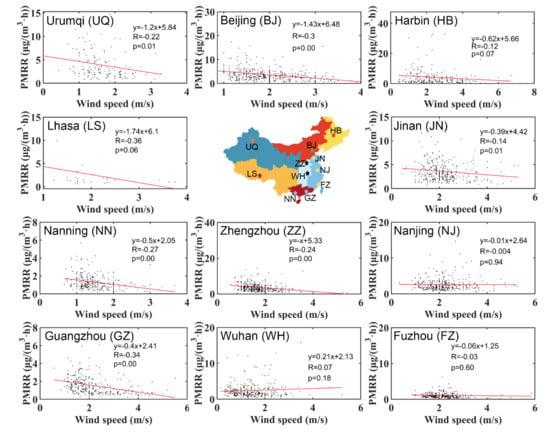
Figure 10.
The correlations between PMRR and wind speed in the 11 cities.
The wind speed of the south wind is less than that of the north wind. Therefore, as is demonstrated in Figure 11, PM2.5 pollution processes are normally formed under the south wind in the cities (e.g., Urumqi, Lhasa, Beijing and Zhengzhou) where PM2.5 tends to disperse with the increase of wind speed. In accord with the previous studies [47,59,60,61,62,63,64,65], we found that the other cities are more likely to form PM2.5 pollution processes attributed to the upwind regional transport of PM2.5.
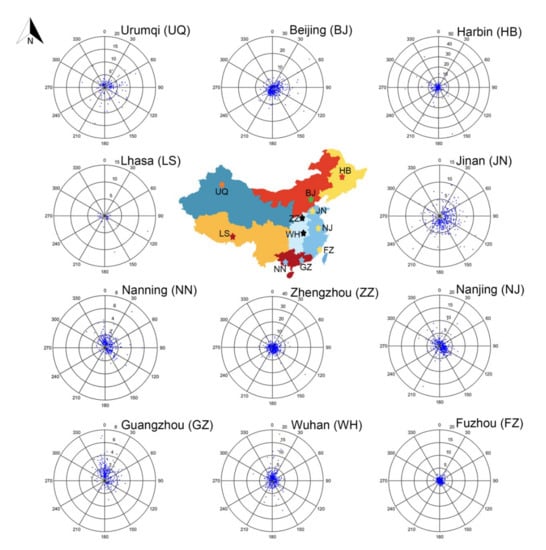
Figure 11.
Scatter-plots of wind direction (degree, °) and PMRR in the 11 cities, and the inserted numbers between 0 and 30 degree are the scale values of PMRR.
4. Conclusions and Summary
In this study, we analyzed three years of air pollution data in China during 2014–2016 from the perspective of static level and dynamic process. The Cressman objective analysis method was used to describe Chinese air pollution on a nationwide scale and seven geographic regions. Eleven large urban cities were selected to analyze the regional difference and PM2.5 pollution process in a dynamic way. The conclusions are as follows.
The air quality and PM in China from 2014 to 2016 generally show a trend of improvement, with the AQI, PM10 concentration and PM2.5 concentration decreasing by 7.97, 10.96 µg/m3, and 7.88 µg/m3 per year, respectively. In terms of spatial distribution, NW and BTHs areas are the worst regions of PM pollution in China, illustrating the high concentration of PM10 during springtime in NW and the high concentration of PM2.5 during wintertime in BTH. There are remarkable regional differences of particle size in China, e.g., fine PM dominant in the southern areas of Qinling Mountains-Huaihe River, but coarse mode (PM2.5–10) principal in the arid and semi-arid areas of NW with sparse vegetation coverage.
Overall, the air quality in China improved during the study period, but not in all regions. The air pollution in some local areas such as Fenwei Plain became worse. Therefore, it is particularly important to separate different regions for air pollution research. The AQI, PM10 and PM2.5 concentrations and PM2.5/PM10 ratio in the seven industrial regions indicate dramatic differences. In general, the air quality of SC ranks the best in China, and the worst in NC and CC regions.
The rising phase of PM2.5 concentration and its evolution indicate that the value of PMRR is higher in autumn and winter while it is lower in spring and summer in the 11 urban cities. The PMRR is positively correlated with PM2.5 concentrations, indicating that the PMRR can simultaneously characterize the level and intensity of a PM2.5 pollution process. The occurrence of the PM pollution processes is usually accompanied by a decrease in wind speed. The p-value and regression slope between PMRR and wind speed indicate whether the city is sensitive to the regional PM2.5 transport or local dispersion. The higher the slope and the p-value, the more vulnerable it is to the regional PM2.5 transport and the less susceptible it is to local diffusion. The PM2.5 in Urumqi, Lhasa, Beijing, Zhengzhou, Nanning and Guangzhou are more likely to disperse with increasing wind speed than in other cities. Instead, in other cities, represented by Wuhan, the increasing wind speed would sometimes cause the accumulation of PM2.5 due to regional transport. South wind dominates in Urumqi, Lhasa, Beijing and Zhengzhou during the PM2.5 pollution processes, due to it being weaker than north wind. To a certain extent, other cities are somewhat affected by the upwind direction of regional PM2.5 transport during the PM2.5 pollution processes.
The results presented in this study are useful for environmental governance in China. In addition, the importance of comparing regional air pollution differences is emphasized. Only the influence of wind is taken into account when studying the PM2.5 dynamic process caused by meteorological elements, and more meteorological factors (e.g., temperature, humidity and pressure) need to be considered in the near future.
Author Contributions
Conceptualization, H.L. and Y.H.; methodology, H.L.; validation, H.L., Y.H., C.L. and Y.W.; formal analysis, H.L. and Y.H.; writing—original draft preparation, H.L.; writing—review and editing, H.L., Y.H., X.C., C.L. and Y.W.; supervision, Y.H. and C.L. All authors have read and agreed to the published version of the manuscript.
Funding
This research was funded by the National Science Foundation of China (Grant Nos. 42027804, 41775026, 40805006 and 41822504), the National Science and Technology Major Project (Grant No. 2016YFC0203303), and the Natural Science Foundation of Jiangsu Province (Grant Nos. BE2015151).
Data Availability Statement
Data set available on request to corresponding authors.
Acknowledgments
We thank the anonymous reviewers for their constructive comments that have helped us to improve the manuscript.
Conflicts of Interest
The authors declare no conflict of interest.
References
- Guan, W.J.; Zheng, X.Y.; Chung, K.F.; Zhong, N.S. Impact of air pollution on the burden of chronic respiratory diseases in China: Time for urgent action. Lancet 2016, 388, 1939–1951. [Google Scholar] [CrossRef]
- Song, C.; Wu, L.; Xie, Y.; He, J.; Chen, X.; Wang, T.; Lin, Y.; Jin, T.; Wang, A.; Liu, Y. Air pollution in China: Status and spatiotemporal variations. Environ. Pollut. 2017, 227, 334–347. [Google Scholar] [CrossRef]
- Van der A, R.J.; Mijling, B.; Ding, J.; Koukouli, M.E.; Liu, F.; Li, Q.; Mao, H.; Theys, N. Cleaning up the air: Effectiveness of air quality policy for SO2 and NOx emissions in China. Atmos. Chem. Phys. 2017, 17, 1775–1789. [Google Scholar] [CrossRef]
- Wu, Y.; Zhang, S.; Hao, J.; Liu, H.; Wu, X.; Hu, J.; Walsh, M.P.; Wallington, T.J.; Zhang, K.M.; Stevanovic, S. On-road vehicle emissions and their control in China: A review and outlook. Sci. Total Environ. 2017, 574, 332–349. [Google Scholar] [CrossRef]
- He, J.; Gong, S.; Yu, Y.; Yu, L.; Wu, L.; Mao, H.; Song, C.; Zhao, S.; Liu, H.; Li, X. Air pollution characteristics and their relation to meteorological conditions during 2014–2015 in major Chinese cities. Environ. Pollut. 2017, 223, 484–496. [Google Scholar] [CrossRef]
- Wang, Y.Q.; Zhang, X.Y.; Sun, J.Y.; Zhang, X.C.; Che, H.Z.; Li, Y. Spatial and temporal variations of the concentrations of PM10, PM2.5 and PM1 in China. Atmos. Chem. Phys. 2015, 15, 13585–13598. [Google Scholar] [CrossRef]
- Yang, X.; Jiang, L.; Zhao, W.; Xiong, Q.; Zhao, W.; Yan, X. Comparison of Ground-Based PM2.5 and PM10 Concentrations in China, India, and the U.S. Int. J. Environ. Res. Public Health 2018, 15, 1382. [Google Scholar] [CrossRef] [PubMed]
- Zheng, M.; Salmon, L.; Schauer, J.; Zeng, L.; Kiang, C.; Zhang, Y.; Cass, G. Seasonal trends in PM2.5 source contributions in Beijing, China. Atmos. Environ. 2005, 39, 3967–3976. [Google Scholar] [CrossRef]
- Wu, G.; Hu, W.; Teng, E.; Wi, F. PM2.5 and PM10 pollution level in the four cities in China. China Environ. 1999, 19, 133–137. [Google Scholar]
- Chu, P.C.; Chen, Y.; Lu, S.; Li, Z.; Lu, Y. Particulate air pollution in Lanzhou China. Environ. Int. 2008, 34, 698–713. [Google Scholar] [CrossRef] [PubMed]
- Zhao, P.S.; Dong, F.; He, D.; Zhao, X.J.; Zhang, X.L.; Zhang, W.Z.; Yao, Q.; Liu, H.Y. Characteristics of concentrations and chemical compositions for PM2.5 in the region of Beijing, Tianjin, and Hebei, China. Atmos. Chem. Phys. 2013, 13, 4631–4644. [Google Scholar] [CrossRef]
- Aaron, V.D.; Randall, V.M.; Michael, B.; Ralph, K.; Robert, L.; Carolyn, V.; Paul, J.V. Global estimates of ambient fine particulate matter concentrations from satellite-based aerosol optical depth: Development and application. Environ. Health Perspect. 2010, 118, 847–855. [Google Scholar]
- Han, Y.; Wu, Y.; Wang, T.; Zhuang, B.; Li, S.; Zhao, K. Impacts of elevated-aerosol-layer and aerosol type on the correlation of AOD and particulate matter with ground-based and satellite measurements in Nanjing, southeast China. Sci. Total Environ. 2015, 532, 195–207. [Google Scholar] [CrossRef] [PubMed]
- Li, S.; Joseph, E.; Min, Q. Remote sensing of ground-level PM2.5 combining AOD and backscattering profile. Remote Sens. Environ. 2016, 183, 120–128. [Google Scholar] [CrossRef]
- Ma, Z.; Hu, X.; Huang, L.; Bi, J.; Liu, Y. Estimating ground-level PM2.5 in China using satellite remote sensing. Environ. Sci. Technol. 2014, 48, 7436. [Google Scholar] [CrossRef]
- Ma, Z.; Hu, X.; Sayer, A.M.; Levy, R.; Zhang, Q.; Xue, Y.; Tong, S.; Bi, J.; Huang, L.; Liu, Y. Satellite-Based Spatiotemporal Trends in PM2.5 Concentrations: China, 2004–2013. Environ. Health Perspect. 2016, 124, 184–192. [Google Scholar] [CrossRef]
- Xin, J.; Gong, C.; Liu, Z.; Cong, Z.; Gao, W.; Song, T.; Pan, Y.; Sun, Y.; Ji, D.; Wang, L. The observation-based relationships between PM2.5 and AOD over China. J. Geophys. Res. Atmos. 2018, 121, 10–701. [Google Scholar]
- Hoff, R.M.; Christopher, S.A. Remote sensing of particulate pollution from space: Have we reached the promised land? J. Air Waste Manag. Assoc. 2009, 59, 642–644. [Google Scholar] [CrossRef]
- Ma, X.; Wang, J.; Yu, F.; Jia, H.; Hu, Y. Can MODIS AOD be employed to derive PM2.5 in Beijing-Tianjin-Hebei over China? Atmos. Res. 2016, 181, 250–256. [Google Scholar] [CrossRef]
- Wang, H.; Sun, F.; Liu, W. Spatial and temporal patterns as well as major influencing factors of global and diffuse Horizontal Irradiance over China: 1960–2014. Sol. Energy 2018, 159, 601–615. [Google Scholar] [CrossRef]
- Hu, J.; Wang, Y.; Ying, Q.; Zhang, H. Spatial and temporal variability of PM2.5 and PM10 over the North China Plain and the Yangtze River Delta, China. Atmos. Environ. 2014, 95, 598–609. [Google Scholar] [CrossRef]
- Xie, Y.; Zhao, B.; Zhang, L.; Luo, R. Spatiotemporal variations of PM2.5 and PM10 concentrations between 31 Chinese cities and their relationships with SO2, NO2, CO and O3. Particuology 2015, 20, 141–149. [Google Scholar] [CrossRef]
- Zhang, Y.; Cao, F. Fine particulate matter (PM2.5) in China at a city level. Sci. Rep. 2015, 5, 14884. [Google Scholar] [CrossRef] [PubMed]
- Zhao, S.; Yu, Y.; Yin, D.; He, J.; Liu, N.; Qu, J.; Xiao, J. Annual and diurnal variations of gaseous and particulate pollutants in 31 provincial capital cities based on in situ air quality monitoring data from China National Environmental Monitoring Center. Environ. Int. 2016, 86, 92–106. [Google Scholar] [CrossRef] [PubMed]
- Lv, B.; Cai, J.; Xu, B.; Bai, Y. Understanding the Rising Phase of the PM2.5 Concentration Evolution in Large China Cities. Sci. Rep. 2017, 7, 46456. [Google Scholar] [CrossRef] [PubMed]
- Albuquerque, P.; Gomes, J.; Bordado, J. Assessment of exposure to airborne ultrafine particles in the urban environment of Lisbon, Portugal. J. Air Waste Manag. Assoc. 2012, 62, 373–380. [Google Scholar] [CrossRef] [PubMed]
- Ruppecht, E.; Meyer, M.; Patashnick, H. The tapered element oscillating microbalance as a tool for measuring ambient particulate concentrations in real time. J. Aerosol Sci. 1992, 23, 635–638. [Google Scholar] [CrossRef]
- Macias, E.S.; Husar, R.B. Atmospheric particulate mass measurement with beta attenuation mass monitor. Environ. Sci. Technol. 1976, 10, 904–907. [Google Scholar] [CrossRef]
- Cressman, G.P. An Operational Objective Analysis System. Mon. Weather Rev. 1959, 87, 367–374. [Google Scholar] [CrossRef]
- Carmen Casas, M.; Herrero, M.; Ninyerola, M.; Pons, X.; Rodríguez, R.; Rius, A.; Redaño, A. Analysis and objective mapping of extreme daily rainfall in Catalonia. Int. J. Climatol. 2007, 27, 399–409. [Google Scholar] [CrossRef]
- Syrakov, D.; Georgieva, E.; Prodanova, M.; Hristova, E.; Gospodinov, I.; Slavov, K.; Veleva, B. Application of WRF-CMAQ Model System for Analysis of Sulfur and Nitrogen Deposition over Bulgaria; Springer: Cham, Switzerland, 2018; pp. 474–482. [Google Scholar]
- Xu, Q.; Qiu, C.J.; Yu, J.X. Adjoint-Method Retrievals of Low-Altitude Wind Fields from Single-Doppler Wind Data. J. Atmos. Ocean. Technol. 1994, 11, 579–585. [Google Scholar] [CrossRef]
- Ray, P.S. Mesoscale Meteorology and Forecasting; American Meteorological Society: Boston, MA, USA, 1986. [Google Scholar]
- Li, H.; Zhang, Q.; Zhang, Q.; Chen, C.; Wang, L.; Wei, Z.; Zhou, S.; Parworth, C.; Zheng, B.; Canonaco, F.; et al. Wintertime aerosol chemistry and haze evolution in an extremely polluted city of the North China Plain: Significant contribution from coal and biomass combustion. Atmos. Chem. Phys. 2017, 17, 4751–4768. [Google Scholar] [CrossRef]
- Guo, S.; Hu, M.; Zamora, M.L.; Peng, J.; Shang, D.; Zheng, J.; Du, Z.; Wu, Z.; Shao, M.; Zeng, L. Elucidating severe urban haze formation in China. Proc. Natl. Acad. Sci. USA 2014, 111, 17373. [Google Scholar] [CrossRef] [PubMed]
- Huang, R.-J.; Zhang, Y.; Bozzetti, C.; Ho, K.-F.; Cao, J.-J.; Han, Y.; Daellenbach, K.R.; Slowik, J.G.; Platt, S.M.; Canonaco, F.; et al. High secondary aerosol contribution to particulate pollution during haze events in China. Nature 2014, 514, 218. [Google Scholar] [CrossRef]
- Sun, B.; Wang, H. A Trend towards a Stable Warm and Windless State of the Surface Weather Conditions in Northern and Northeastern China during 1961–2014. Adv. Atmos. Sci. 2017, 34, 713–726. [Google Scholar] [CrossRef]
- Wang, H.; Shi, G.Y.; Zhang, X.Y.; Gong, S.L.; Tan, S.C.; Chen, B.; Che, H.Z.; Li, T. Mesoscale modelling study of the interactions between aerosols and PBL meteorology during a haze episode in China Jing-Jin-Ji and its near surrounding region—Part 2: Aerosols’ radiative feedback effects. Atmos. Chem. Phys. 2015, 15, 3277–3287. [Google Scholar] [CrossRef][Green Version]
- Zhang, Z.; Zhang, X.; Zhang, Y.; Wang, Y.; Zhou, H.; Shen, X.; Che, H.; Sun, J.; Lu, Z. Characteristics of chemical composition and role of meteorological factors during heavy aerosol pollution episodes in northern Beijing area in autumn and winter of 2015. Tellus B Chem. Phys. Meteorol. 2017, 69, 1347484. [Google Scholar] [CrossRef]
- Chen, D.; Liu, X.; Lang, J.; Zhou, Y.; Wei, L.; Wang, X.; Guo, X. Estimating the contribution of regional transport to PM 2.5 air pollution in a rural area on the North China Plain. Sci. Total Environ. 2017, 583, 280–291. [Google Scholar] [CrossRef]
- Su, X.; Cao, J.; Li, Z. Regional transport of anthropogenic pollution and dust aerosols in spring to Tianjin—A coastal megacity in China. Sci. Total Environ. 2017, 584, 381–392. [Google Scholar] [CrossRef]
- Xu, W.; Han, T.; Du, W.; Wang, Q.; Chen, C.; Zhao, J.; Zhang, Y.; Li, J.; Fu, P.; Wang, Z. Effects of aqueous-phase and photochemical processing on secondary organic aerosol formation and evolution in Beijing, China. Environ. Sci. Technol. 2017, 51, 762. [Google Scholar] [CrossRef]
- Xu, L.; Batterman, S.; Chen, F.; Li, J.; Zhong, X.; Feng, Y.; Rao, Q.; Chen, F. Spatiotemporal characteristics of PM2.5 and PM10 at urban and corresponding background sites in 23 cities in China. Sci. Total Environ. 2017, 599–600, 2074–2084. [Google Scholar] [CrossRef] [PubMed]
- Luo, H.; Han, Y.; Lu, C.; Yang, J.; Wu, Y. Characteristics of Surface Solar Radiation under Different Air Pollution Conditions over Nanjing, China: Observation and Simulation. Adv. Atmos. Sci. 2019, 36, 1047–1059. [Google Scholar] [CrossRef]
- Li, X.; Song, H.; Zhai, S.; Lu, S.; Kong, Y.; Xia, H.; Zhao, H. Particulate matter pollution in Chinese cities: Areal-temporal variations and their relationships with meteorological conditions (2015–2017). Environ. Pollut. 2019, 246, 11–18. [Google Scholar] [CrossRef] [PubMed]
- Pui, D.Y.H.; Chen, S.C.; Zuo, Z. PM2.5 in China: Measurements, sources, visibility and health effects, and mitigation. Particuology 2014, 13, 1–26. [Google Scholar] [CrossRef]
- Han, Y.; Wu, Y.; Wang, T.; Xie, C.; Zhao, K.; Zhuang, B.; Li, S. Characterizing a persistent Asian dust transport event: Optical properties and impact on air quality through the ground-based and satellite measurements over Nanjing, China. Atmos. Environ. 2015, 115, 304–316. [Google Scholar] [CrossRef]
- Zhuang, Y.; Li, R.; Yang, H.; Chen, D.; Chen, Z.; Gao, B.; He, B. Understanding Temporal and Spatial Distribution of Crop Residue Burning in China from 2003 to 2017 Using MODIS Data. Remote Sens. 2018, 10, 390. [Google Scholar] [CrossRef]
- Zhang, Z.; Jian, G.; Engling, G.; Tao, J.; Chai, F.; Zhang, L.; Zhang, R.; Sang, X.; Chan, C.Y.; Lin, Z. Characteristics and applications of size-segregated biomass burning tracers in China’s Pearl River Delta region. Atmos. Environ. 2015, 102, 290–301. [Google Scholar] [CrossRef]
- Qu, Y.; Han, Y.; Wu, Y.; Gao, P.; Wang, T. Study of PBLH and its correlation with particulate matter from one-year observation over Nanjing, Southeast China. Remote Sens. 2017, 9, 668. [Google Scholar] [CrossRef]
- Mike, P.; Otmar, S.; Joachim, H.; Wolfram, B.; Jüurgen, M.; Ralf, Z.H.; Erich, W.; Annette, P.; Josef, C. Seasonal and diurnal variation of PM2.5 apparent particle density in urban air in Augsburg, Germany. Environ. Sci. Technol. 2008, 42, 5087–5093. [Google Scholar]
- Zhang, R.; Wang, G.; Guo, S.; Zamora, M.L.; Ying, Q.; Lin, Y.; Wang, W.; Hu, M.; Wang, Y. Formation of urban fine particulate matter. Chem. Rev. 2015, 115, 3803–3855. [Google Scholar] [CrossRef]
- Wang, L.; Li, W.; Sun, Y.; Tao, M.; Xin, J.; Song, T.; Li, X.; Zhang, N.; Ying, K.; Wang, Y. PM2.5 Characteristics and Regional Transport Contribution in Five Cities in Southern North China Plain, During 2013–2015. Atmosphere 2018, 9, 157. [Google Scholar] [CrossRef]
- Wang, F.; Chen, D.S.; Cheng, S.Y.; Li, J.B.; Li, M.J.; Ren, Z.H. Identification of regional atmospheric PM transport pathways using HYSPLIT, MM5-CMAQ and synoptic pressure pattern analysis. Environ. Model. Softw. 2010, 25, 927–934. [Google Scholar] [CrossRef]
- Wu, Y.; Han, Y.; Voulgarakis, A.; Wang, T.; Li, M.; Wang, Y.; Xie, M.; Zhuang, B.; Li, S. An agricultural biomass burning episode in eastern China: Transport, optical properties and impacts on regional air quality: An agricultural biomass burning episode. J. Geophys. Res. Atmos. 2017, 122, 2304–2324. [Google Scholar] [CrossRef]
- Zheng, G.J.; Duan, F.K.; Su, H.; Ma, Y.L.; Cheng, Y.; Zheng, B.; Zhang, Q.; Huang, T.; Kimoto, T.; Chang, D.; et al. Exploring the severe winter haze in Beijing: The impact of synoptic weather, regional transport and heterogeneous reactions. Atmos. Chem. Phys. 2015, 15, 2969–2983. [Google Scholar] [CrossRef]
- Li, C.; Han, X.; Kang, S.; Yan, F.; Chen, P.; Hu, Z.; Yang, J.; Ciren, D.; Gao, S.; Sillanpää, M. Heavy near-surface PM2.5 pollution in Lhasa, China during a relatively static winter period. Chemosphere 2019, 214, 314–318. [Google Scholar] [CrossRef]
- Jia, M.W.; Zhao, T.L.; Zhang, X.Z.; Xiang-Hua, W.U.; Tang, L.L.; Wang, L.M.; Chen, Y.S. Seasonal variations in major air pollutants in Nanjing and their meteorological correlation analyses. China Environ. Sci. 2016, 36, 2567–2577. [Google Scholar]
- Cheng, F.; Zha, Y.; Zhang, J.; Junliang, H.; Yan, S. A Study on Distance Transport of PM2.5 to Xianlin in Nanjing, China and its Source Areas. Aerosol Air Qual. Res. 2017, 17, 1672–1683. [Google Scholar] [CrossRef]
- Cui, H.; Chen, W.; Dai, W.; Liu, H.; Wang, X.; He, K. Source apportionment of PM2.5 in Guangzhou combining observation data analysis and chemical transport model simulation. Atmos. Environ. 2015, 116, 262–271. [Google Scholar] [CrossRef]
- Gong, J.; Hu, Y.; Liu, M.; Bu, R.; Chang, Y.; Li, C.; Wu, W. Characterization of Air Pollution Index and Its Affecting Factors in Industrial Urban Areas in Northeastern China. Pol. J. Environ. Stud. 2015, 24, 1579–1592. [Google Scholar] [CrossRef]
- Liu, B.; Na, S.; Dai, Q.; Mei, R.; Sui, B.; Bi, X.; Feng, Y. Chemical composition and source apportionment of ambient PM2.5 during the non-heating period in Taian, China. Atmos. Res. 2016, 170, 23–33. [Google Scholar] [CrossRef]
- Xiong, Y.; Zhou, J.; Schauer, J.J.; Yu, W.; Hu, Y. Seasonal and spatial differences in source contributions to PM2.5 in Wuhan, China. Sci. Total Environ. 2017, 577, 155–165. [Google Scholar] [CrossRef] [PubMed]
- Xu, T.; Chen, H.; Lu, X.; Gross, D.S.; Yang, X.; Mo, Z.; Chen, Z.; Liu, H.; Mao, J.; Liang, G. Single-Particle Characterizations of Ambient Aerosols during a Wintertime Pollution Episode in Nanning: Local Emissions vs. Regional Transport. Aerosol Air Qual. Res. 2017, 17, 49–58. [Google Scholar] [CrossRef]
- Zhang, F.; Chen, J.; Qiu, T.; Yin, L.; Chen, X.; Yu, J. Pollution Characteristics of PM2.5 during a Typical Haze Episode in Xiamen, China. Atmos. Clim. Sci. 2013, 3, 427–439. [Google Scholar] [CrossRef]
Publisher’s Note: MDPI stays neutral with regard to jurisdictional claims in published maps and institutional affiliations. |
© 2020 by the authors. Licensee MDPI, Basel, Switzerland. This article is an open access article distributed under the terms and conditions of the Creative Commons Attribution (CC BY) license (http://creativecommons.org/licenses/by/4.0/).