Modeling the Impact of Atmospheric Warming on Staple Crop Growth in China in the 1960s and 2000s


Abstract
:1. Introduction
2. Methods
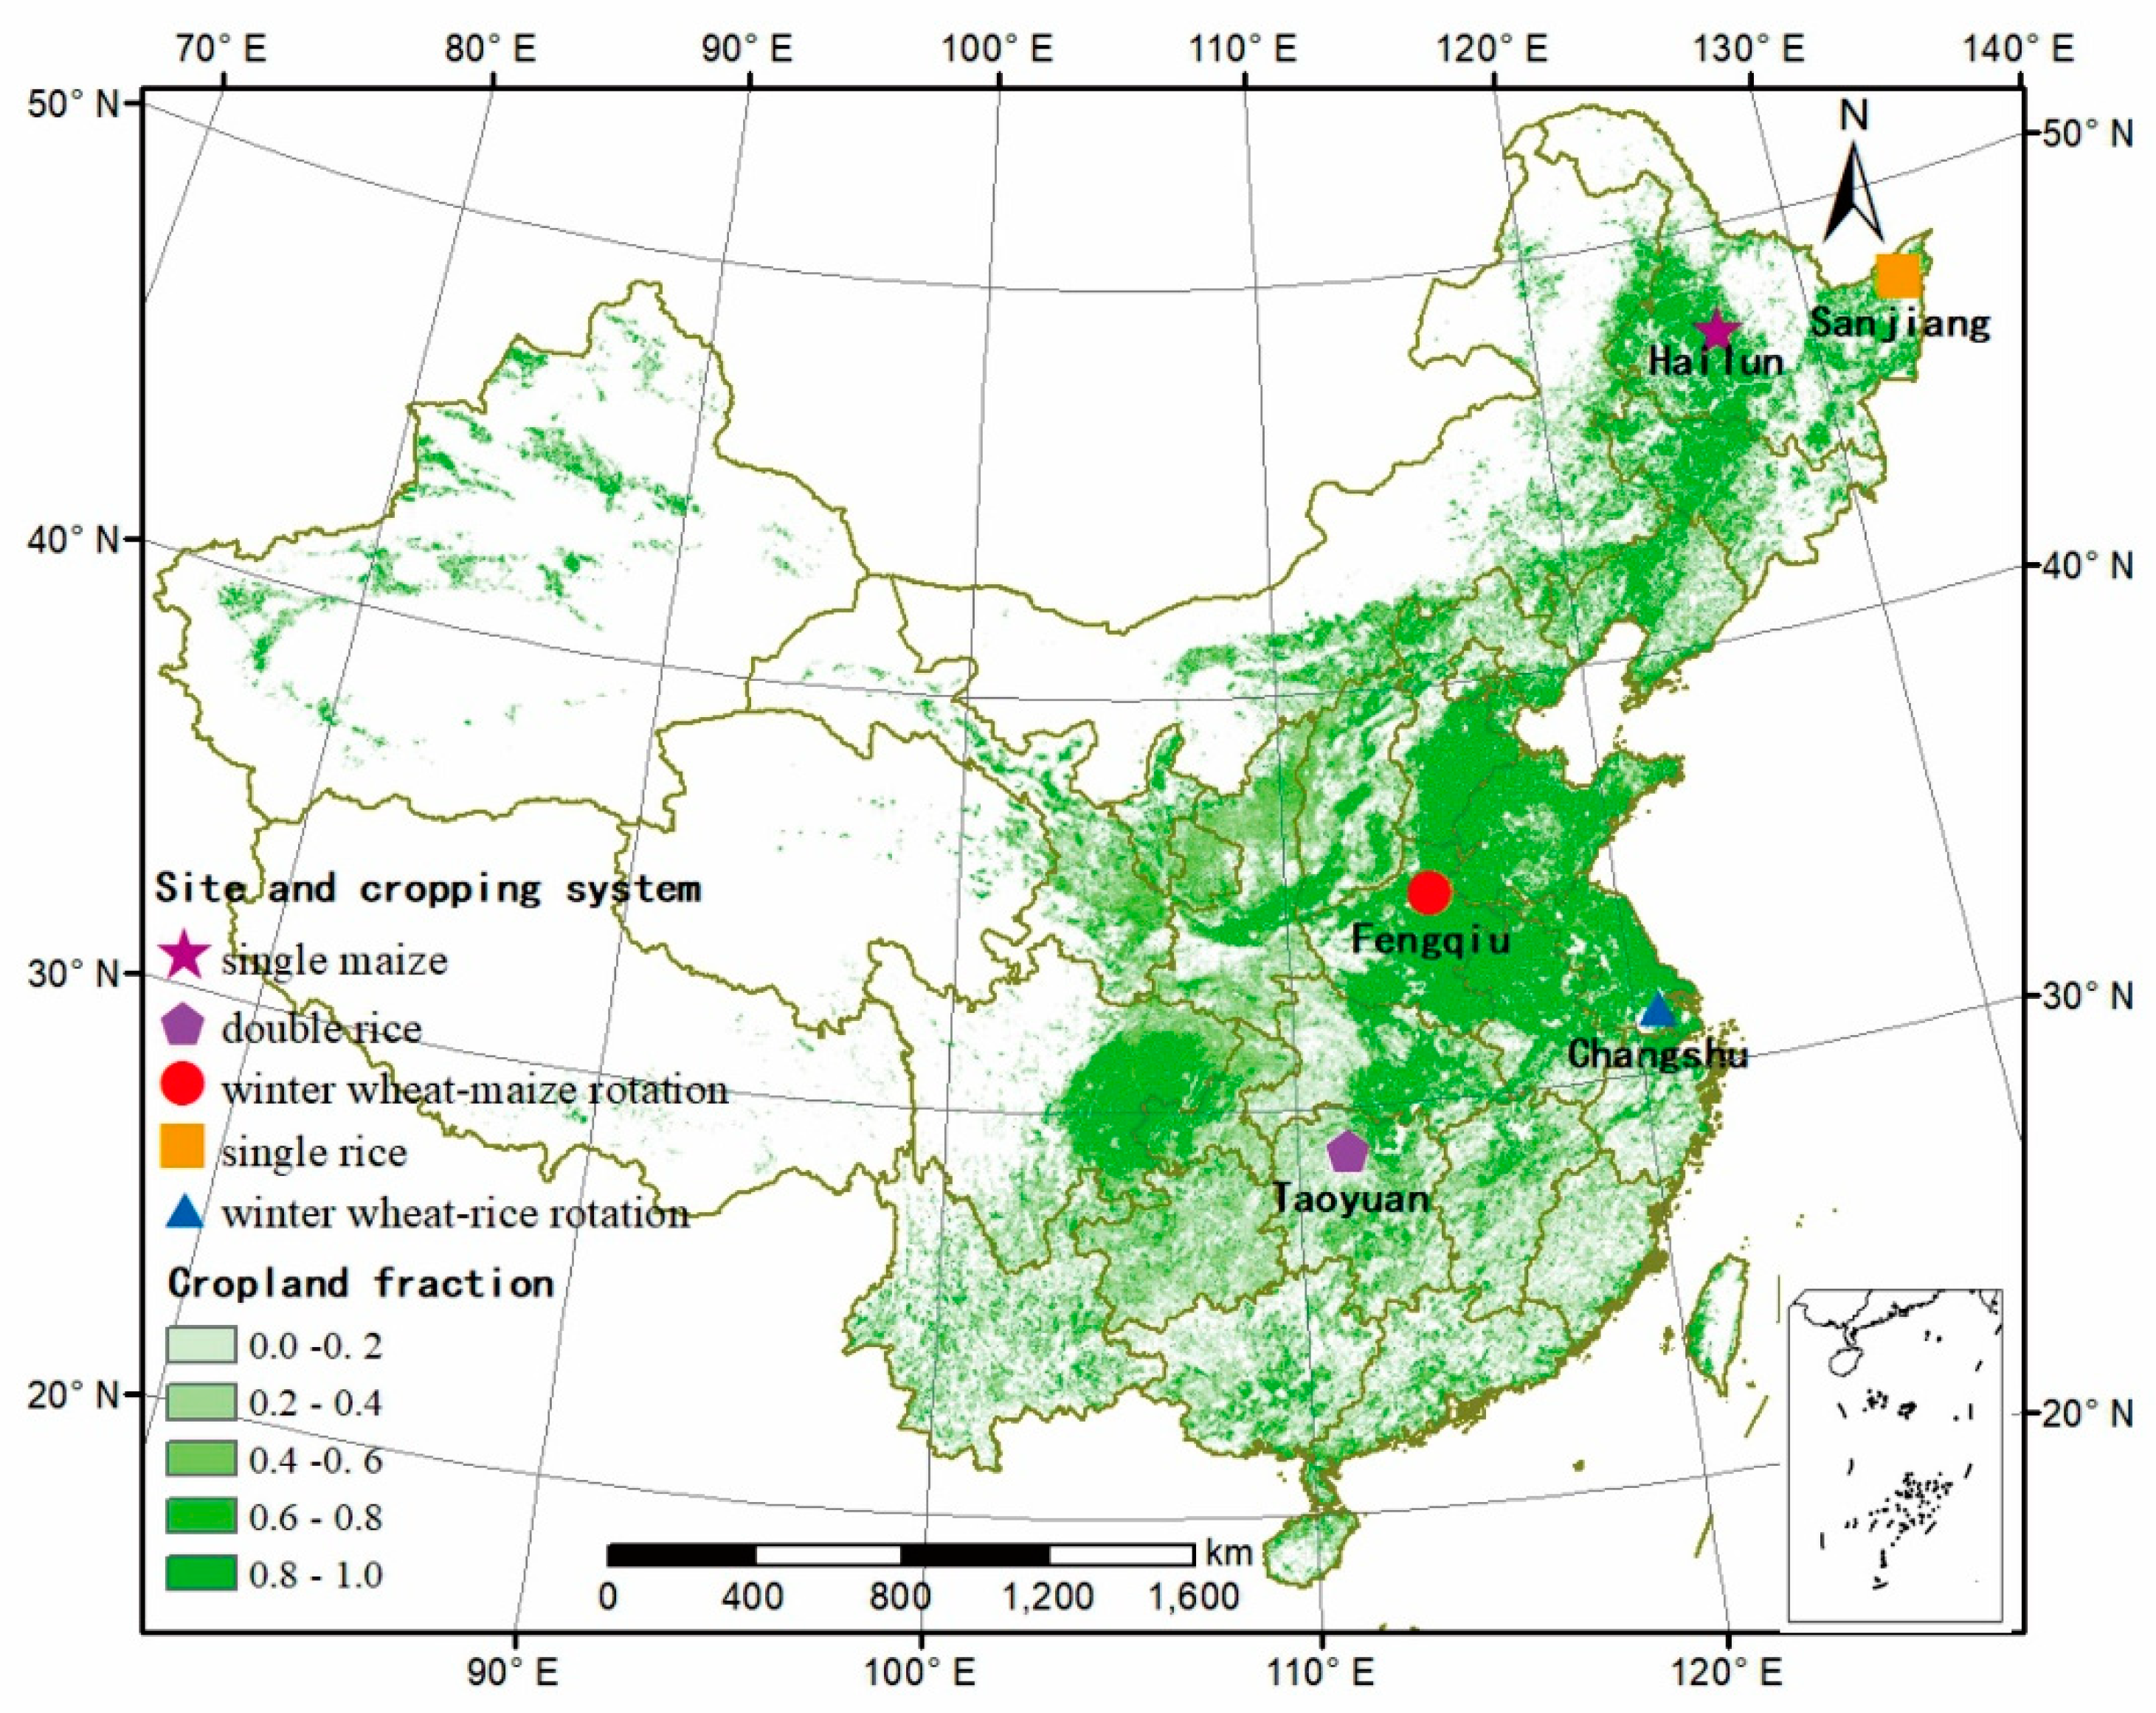
2.1. Research Area
2.2. The Modeling Approach
2.3. Data Sources
3. Results
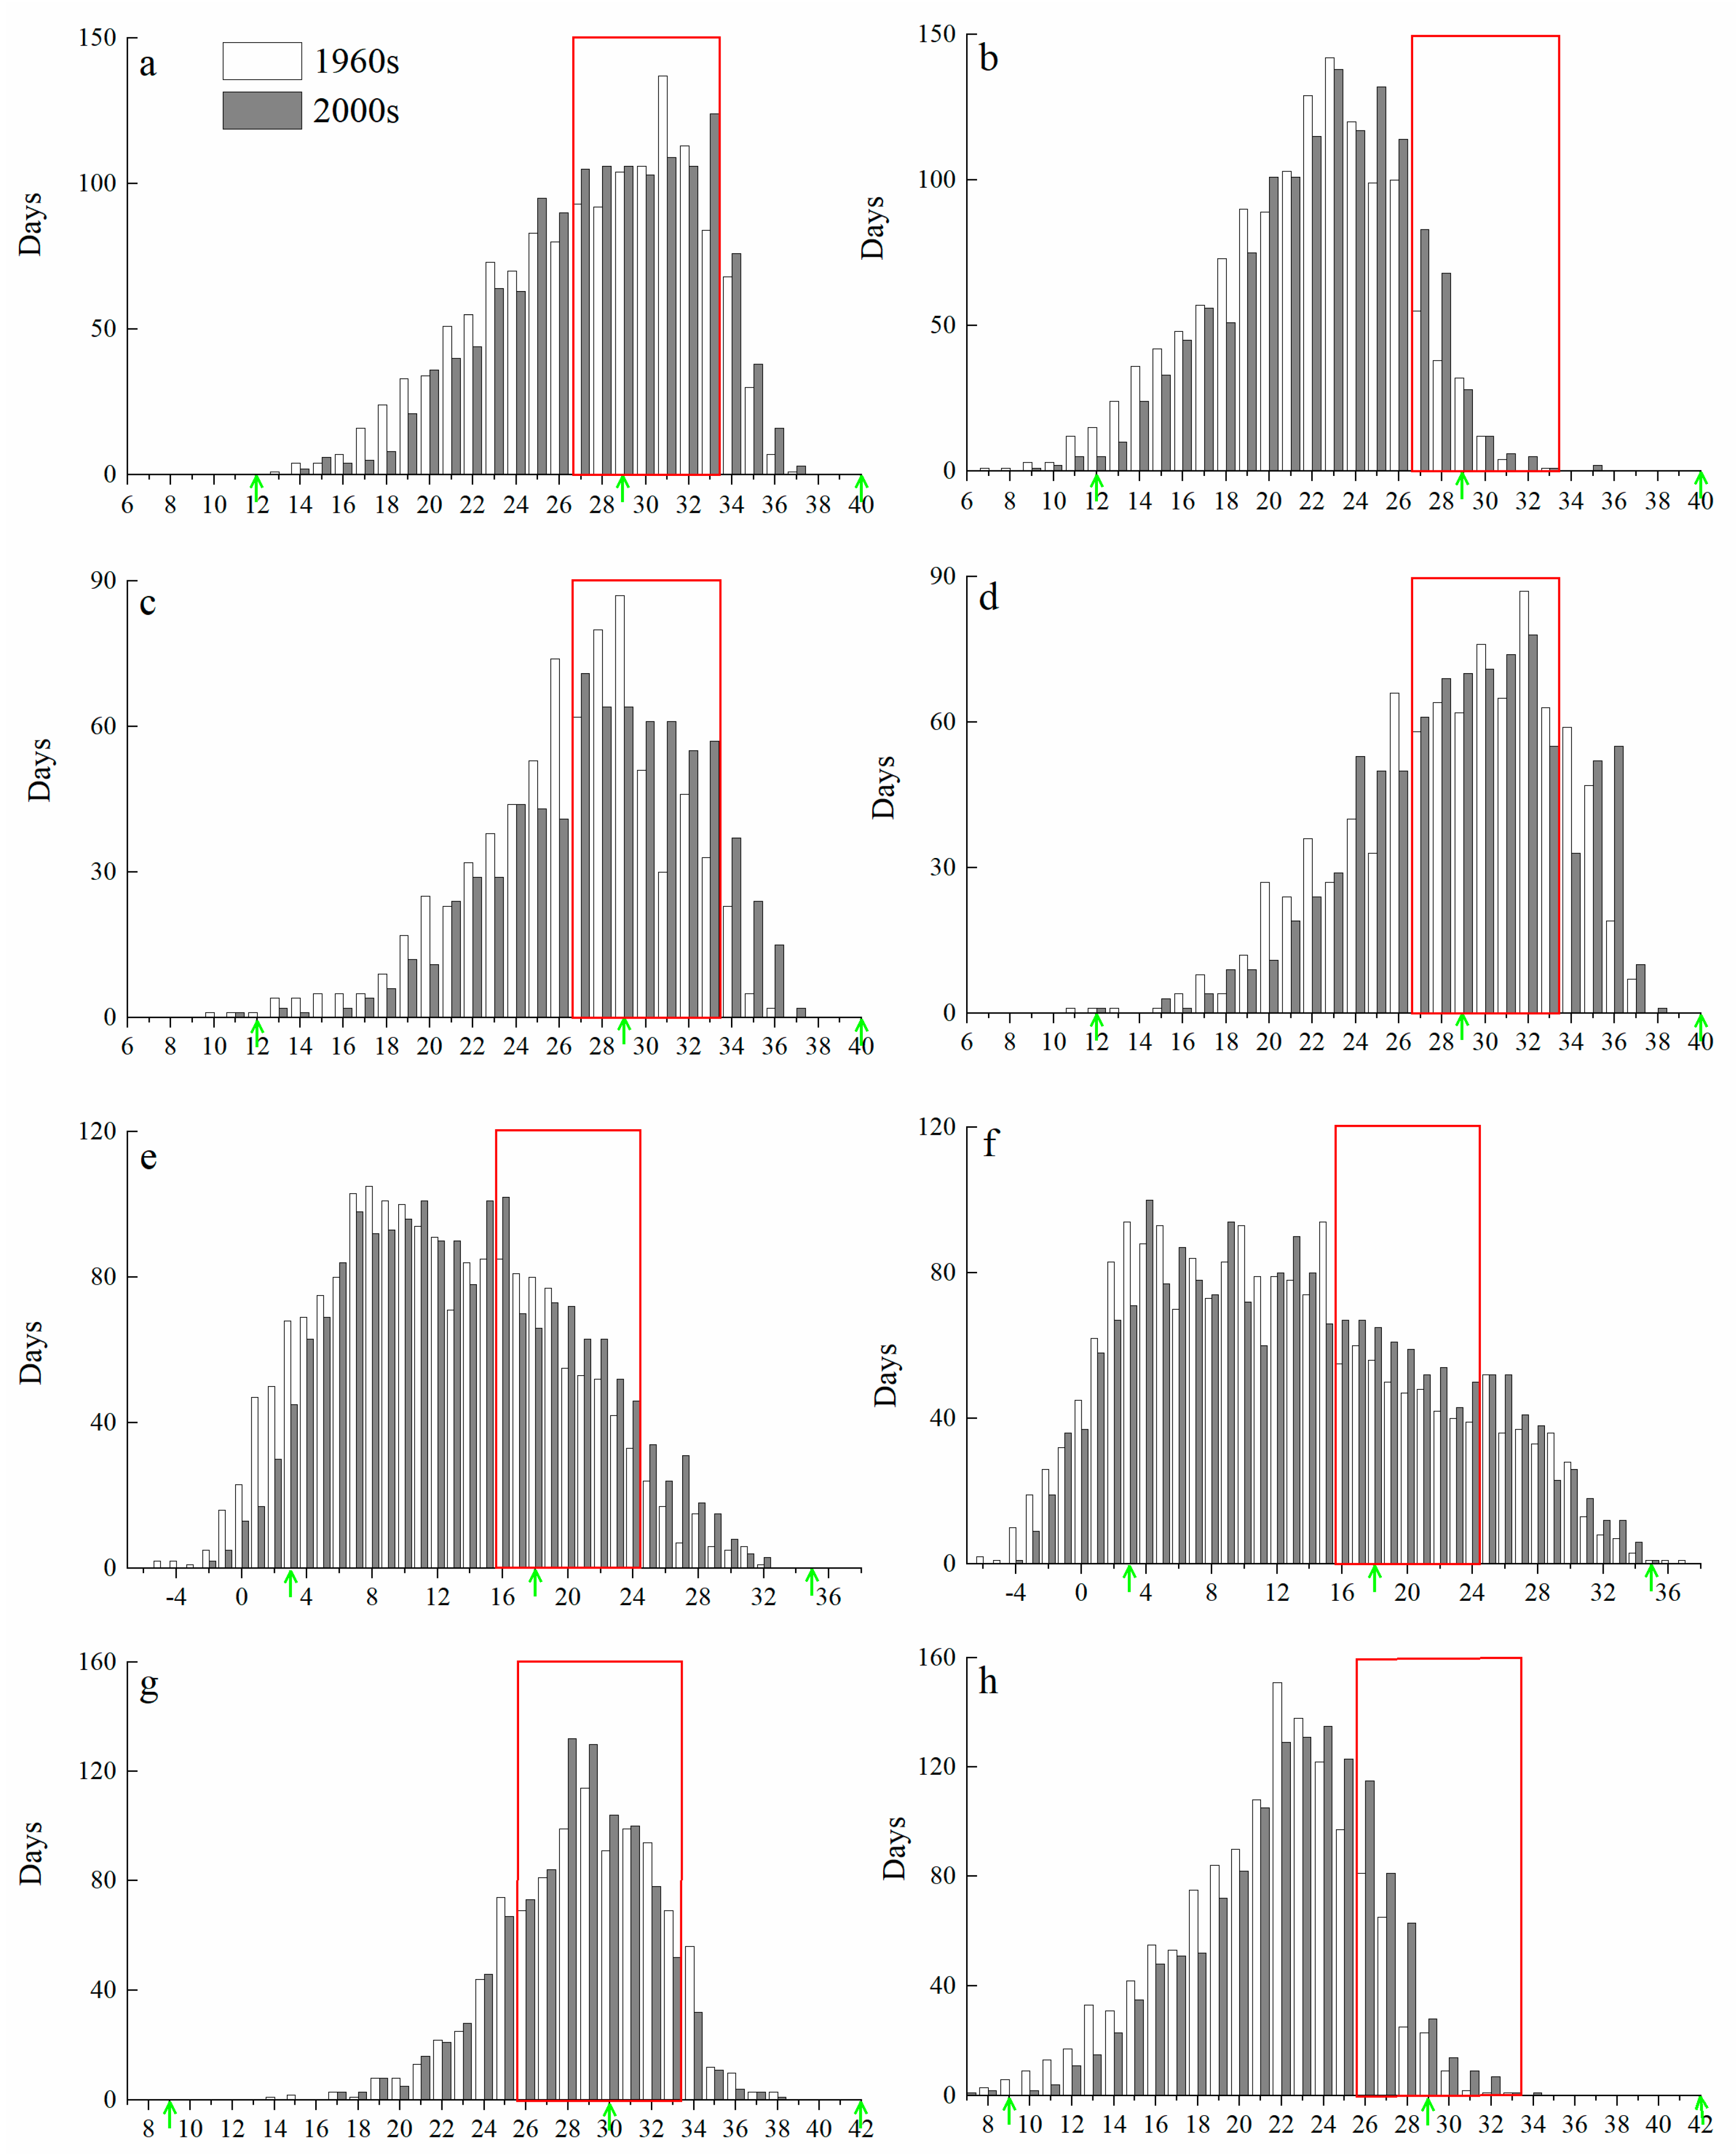
3.1. Temperature Changes during Crop Growth
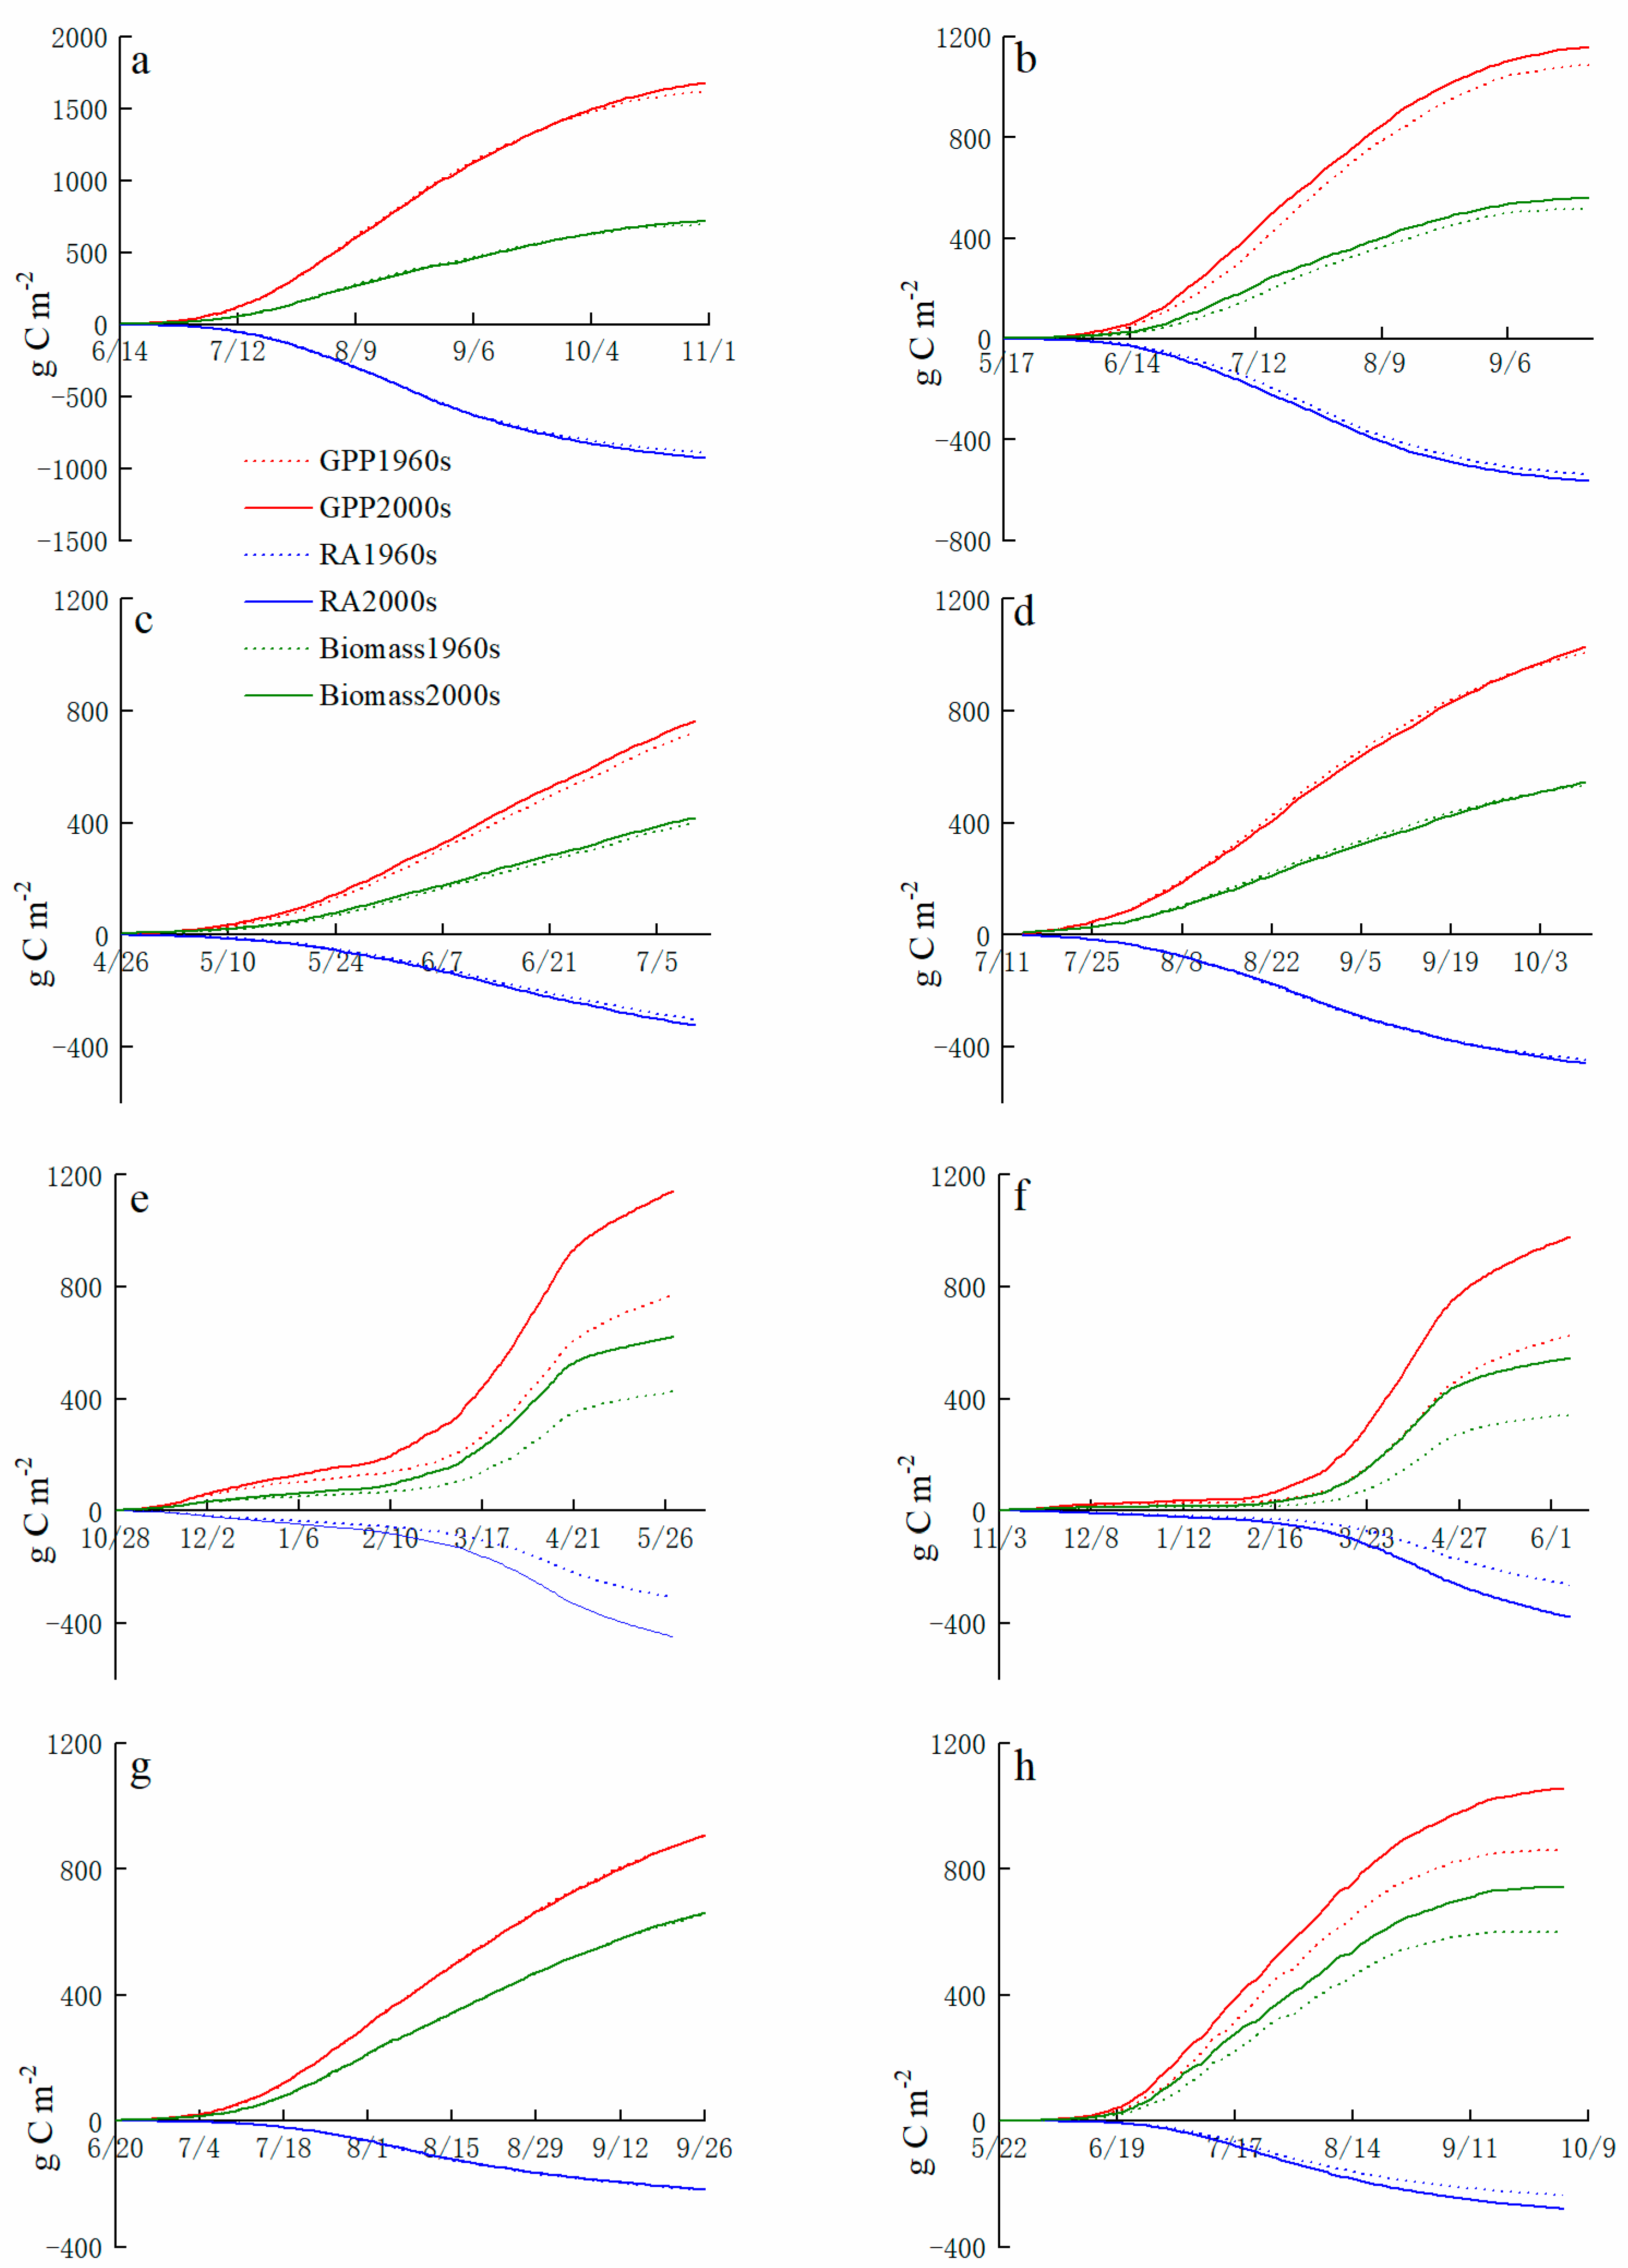
3.2. Effects of Warming on Crop Photosynthesis, Respiration and Net Primary Productivity
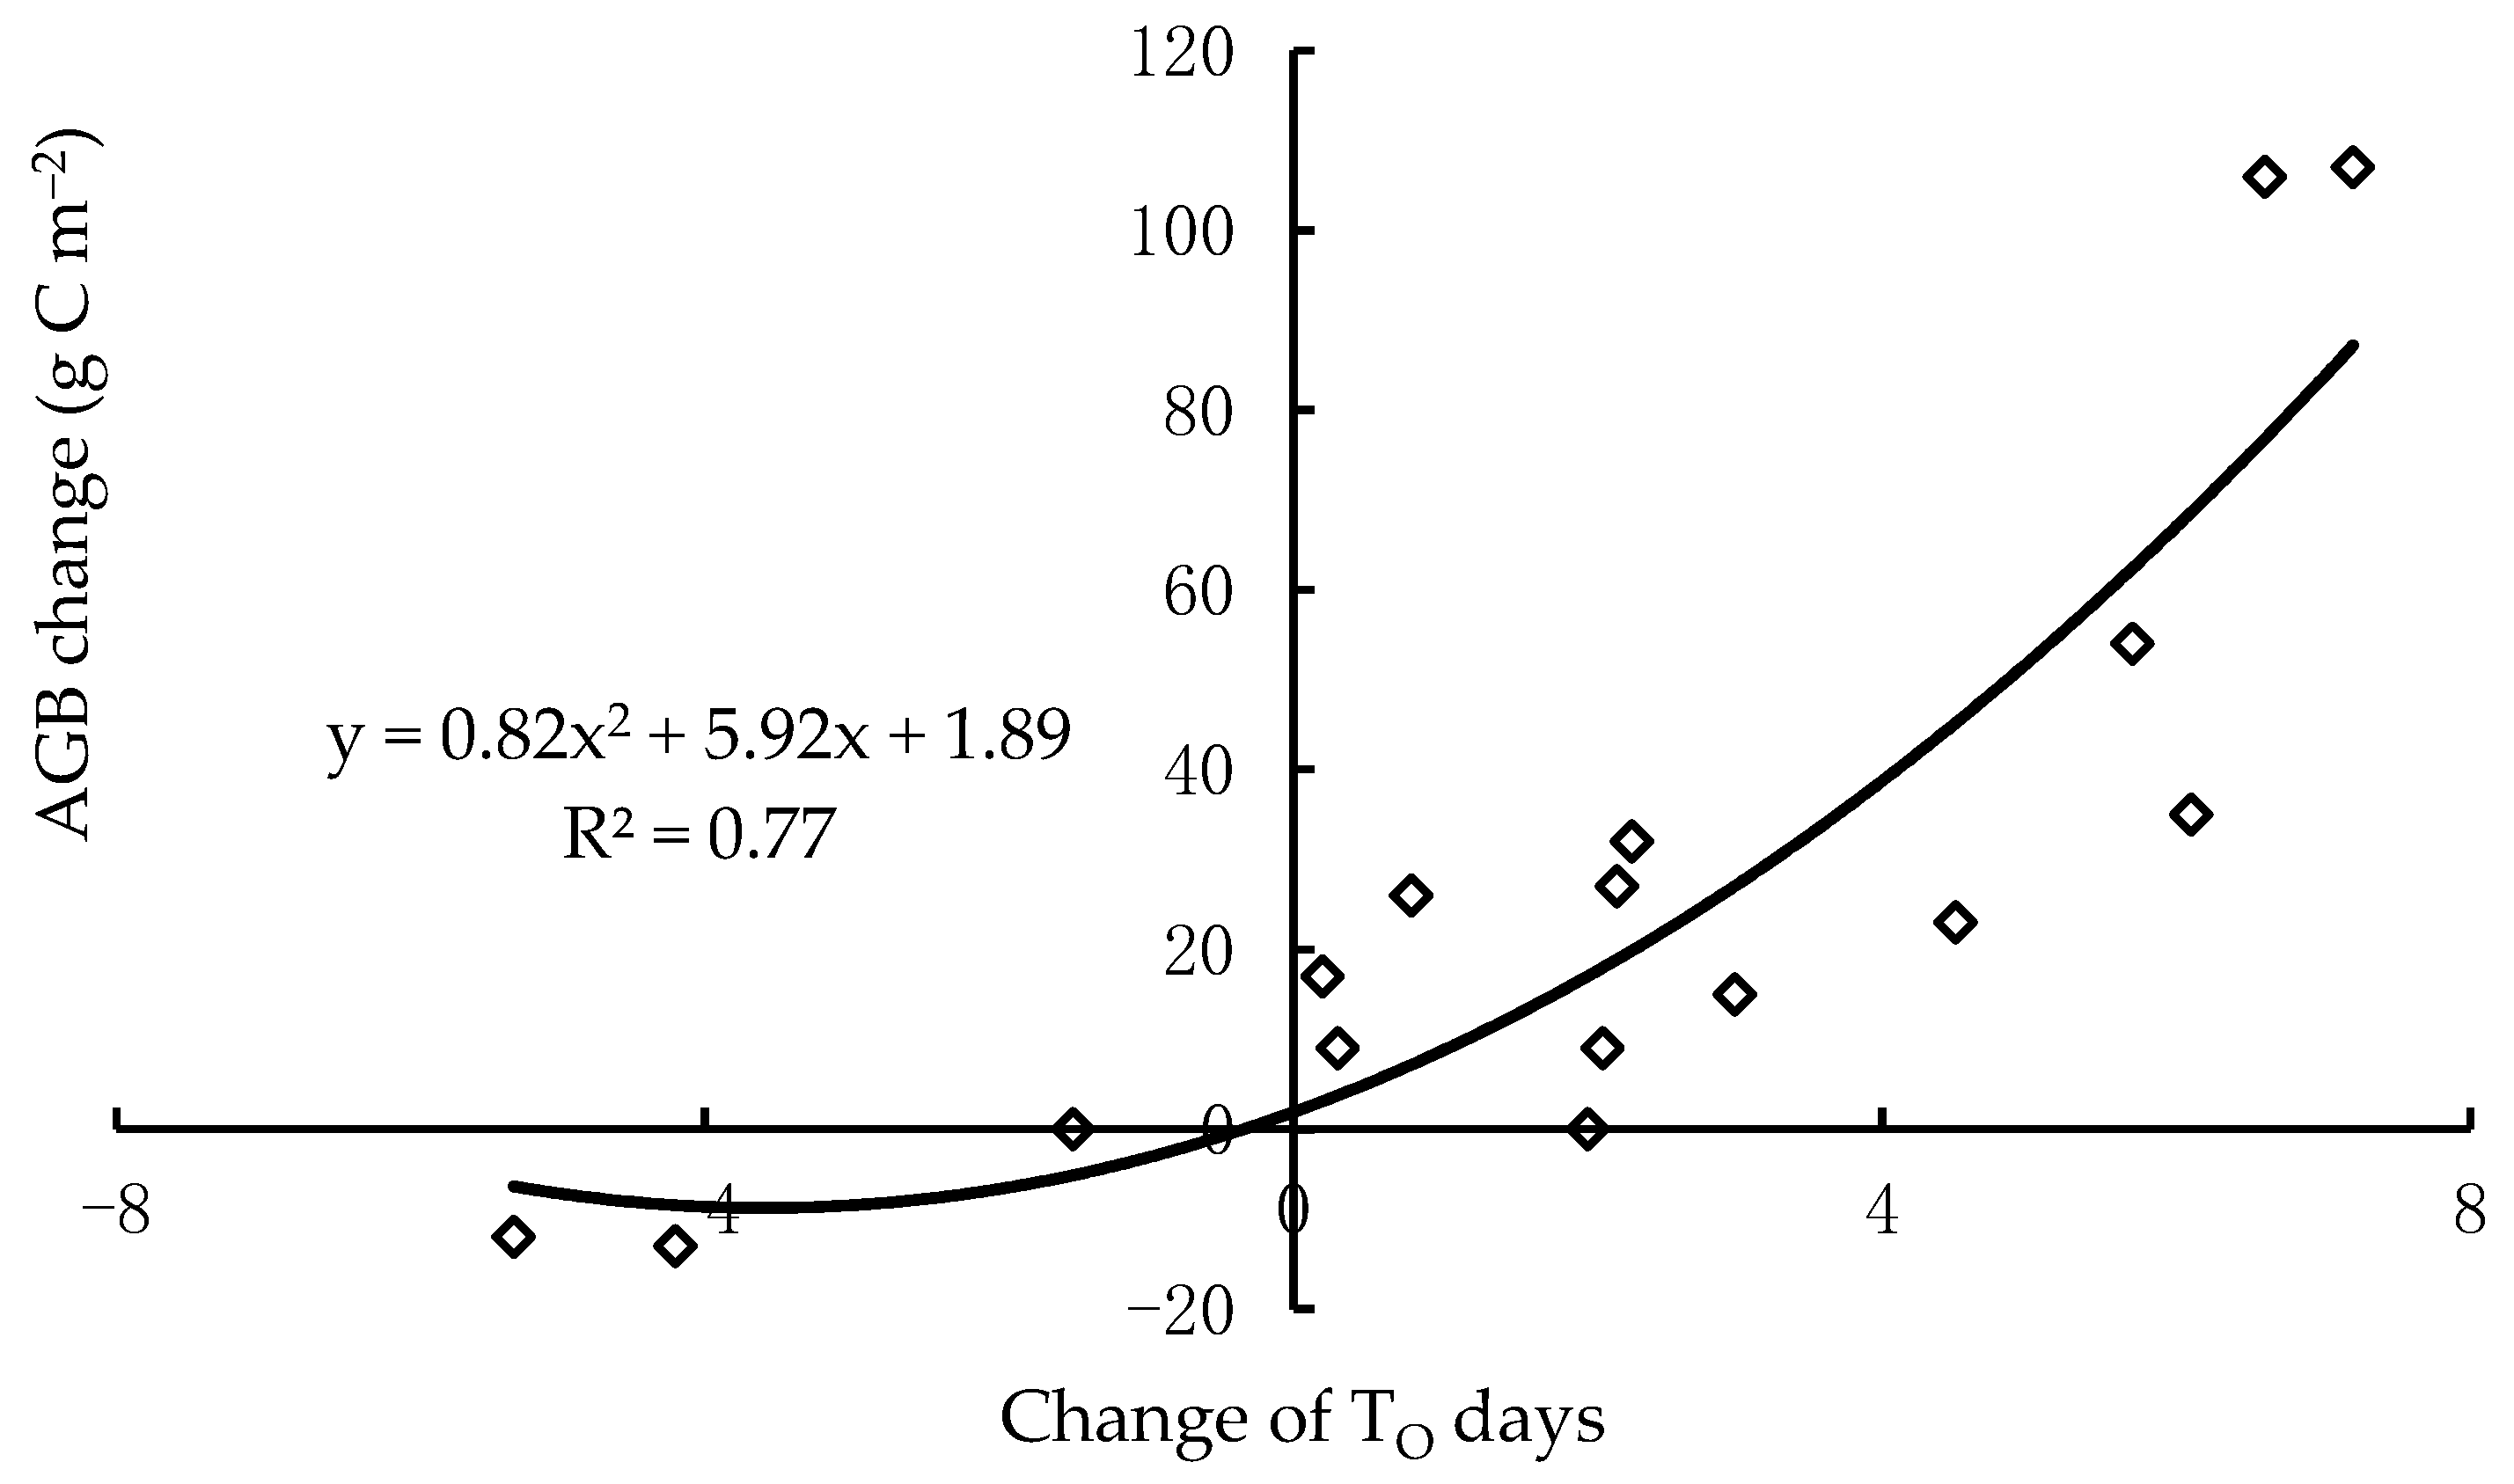
3.3. Temperature Change Effects on Crop Productivity in Key Growth Periods
4. Discussion
5. Conclusions
Author Contributions
Funding
Data Availability Statement
Acknowledgments
Conflicts of Interest
References
- ZhaoC.PiaoS.HuangY.WangX.CiaisP.HuangM.ZengZ.PengS.Field warming experiments shed light on the wheat yield response to temperature in ChinaNat. Commun.201671353010.1038/ncomms13530
- WangX.ZhaoC.MüllerC.WangC.CiaisP.JanssensI.PeñuelasJ.AssengS.LiT.ElliottJ.Emergent constraint on crop yield response to warmer temperature from field experimentsNat. Sustain.2020390891610.1038/s41893-020-0569-7
- YuY.Q.HuangY.ZhangW.Changes in rice yields in China since 1980 associated with cultivar improvement, climate and crop managementField Crop Res.2012136657510.1016/j.fcr.2012.07.021
- ZhangT.Y.ZhuJ.A.WassmannR.Responses of rice yields to recent climate change in China: An empirical assessment based on long-term observations at different spatial scales (1981–2005)Agric. For. Meteorol.20101501128113710.1016/j.agrformet.2010.04.013
- TaoF.L.YokozawaM.LiuJ.Y.ZhangZ.Climate-crop yield relationships at provincial scales in China and the impacts of recent climate trendsClim. Res.200838839410.3354/cr00771
- TaoF.L.YokozawaM.XuY.L.HayashiY.ZhangZ.Climate changes and trends in phenology and yields of field crops in China, 1981–2000Agric. For. Meteorol.2006138829210.1016/j.agrformet.2006.03.014
- LiS.A.WheelerT.ChallinorA.LinE.JuH.XuY.L.The observed relationships between wheat and climate in ChinaAgric. For. Meteorol.20101501412141910.1016/j.agrformet.2010.07.003
- ZhangT.Y.HuangY.Impacts of climate change and inter-annual variability on cereal crops in China from 1980 to 2008J. Sci. Food Agric.2012921643165210.1002/jsfa.552322190019
- JiangX.J.TangL.LiuX.J.CaoW.X.ZhuY.Spatial and Temporal Characteristics of Rice Potential Productivity and Potential Yield Increment in Main Production Regions of ChinaJ. Integr. Agric.201312455610.1016/S2095-3119(13)60204-X
- LiuB.H.XuM.HendersonM.QiY.LiY.Q.Taking China’s temperature: Daily range, warming trends, and regional variations, 1955–2000J. Clim.2004174453446210.1175/3230.1
- PengS.B.KhushG.S.VirkP.TangQ.Y.ZouY.B.Progress in ideotype breeding to increase rice yield potentialField Crop Res.2008108323810.1016/j.fcr.2008.04.001
- ZhangT.Y.HuangY.YangX.G.Climate warming over the past three decades has shortened rice growth duration in China and cultivar shifts have further accelerated the process for late riceGlob. Chang. Biol.20131956357010.1111/gcb.1205723504793
- ZhangT.Y.YangX.G.WangH.S.LiY.YeQ.Climatic and technological ceilings for Chinese rice stagnation based on yield gaps and yield trend pattern analysisGlob. Chang. Biol.2014201289129810.1111/gcb.1242824130084
- AssengS.EwertF.MartreP.RotterR.P.LobellD.B.CammaranoD.KimballB.A.OttmanM.J.WallG.W.WhiteJ.W.Rising temperatuRes. reduce global wheat productionNat. Clim. Chang.2015514314710.1038/nclimate2470
- JiangY.YinX.WangX.ZhangL.LuZ.LeiY.ChuQ.ChenF.Impacts of global warming on the cropping systems of China under technical improvements from 1961 to 2016Agron. J.202010.1002/agj2.20497
- EitzingerJ.ZaludZ.AlexandrovV.Van DiepenC.A.TrnkaM.DubrovskyM.SemeradovaD.OberforsterM.A local simulation study on the impact of climate change on winter wheat production in north-eastern AustriaBoden-kultur200152279292
- TaoF.L.HayashiY.ZhangZ.SakamotoT.YokozawaM.Global warming, rice production, and water use in Chi-na: Developing a probabilistic assessmentAgric. For. Meteorol.20081489411010.1016/j.agrformet.2007.09.012
- LiuZ.J.HubbardK.G.LinX.M.YangX.G.Negative effects of climate warming on maize yield are reversed by the changing of sowing date and cultivar selection in Northeast ChinaGlob. Chang. Biol.2013193481349210.1111/gcb.12324
- LiuZ.J.YangX.G.HubbardK.G.LinX.M.Maize potential yields and yield gaps in the changing climate of northeast ChinaGlob. Chang. Biol.2012183441345410.1111/j.1365-2486.2012.02774.x
- WangJ.WangE.L.YangX.G.ZhangF.S.YinH.Increased yield potential of wheat-maize cropping system in the North China Plain by climate change adaptationClim. Chang.201211382584010.1007/s10584-011-0385-1
- LvZ.F.LiuX.J.CaoW.X.ZhuY.Climate change impacts on regional winter wheat production in main wheat production regions of ChinaAgric. For. Meteorol.201317123424810.1016/j.agrformet.2012.12.008
- SchlenkerW.RobertsM.J.Nonlinear temperature effects indicate severe damages to US crop yields under climate changeProc. Natl. Acad. Sci. USA2009106155941559810.1073/pnas.090686510619717432
- WelchJ.R.VincentJ.R.AuffhammerM.MoyaP.F.DobermannA.DaweD.Rice yields in tropical/subtropical Asia exhibit large but opposing sensitivities to minimum and maximum temperaturesProc. Natl. Acad. Sci. USA2010107145621456710.1073/pnas.100122210720696908
- DeryngD.SacksW.J.BarfordC.C.RamankuttyN.Simulating the effects of climate and agricultural management practices on global crop yieldGlob. Biogeochem. Cycles20112510.1029/2009GB003765
- LiuY.J.LinE.D.Effects of Climate Change on Agriculture in Different Regions of ChinaAdv. Clim. Chang. Res.20073229233
- XiaoG.J.ZhangQ.WangJ.Impact of global climate change on agro-ecosystem: A reviewChin. J. Appl. Ecol.20071818771885
- XiongW.ConwayD.LinE.D.HolmanI.Potential impacts of climate change and climate variability on China’s rice yield and productionClim. Res.200940233510.3354/cr00802
- ChavasD.R.IzaurraldeR.C.ThomsonA.M.GaoX.J.Long-term climate change impacts on agricultural productivity in eastern ChinaAgric. For. Meteorol.20091491118112810.1016/j.agrformet.2009.02.001
- LinE.D.XiongW.JuH.XuY.L.LiY.BaiL.P.XieL.Y.Climate change impacts on crop yield and quality with CO2 fertilization in ChinaPhilos. Trans. R. Soc. B20053602149215410.1098/rstb.2005.1743
- ZhangQ.ZhangW.LiT.T.SunW.J.YuY.Q.WangG.Projective analysis of staple food crop productivity in adaptation to future climate change in ChinaInt. J. Biometeorol.2017811610.1007/s00484-017-1322-428247124
- HuangY.YuY.Q.ZhangW.SunW.J.LiuS.L.JiangJ.WuJ.S.YuW.T.WangY.YangZ.F.Agro-C: A biogeophysical model for simulating the carbon budget of agroecosystemsAgric. For. Meteorol.200914910612910.1016/j.agrformet.2008.07.013
- TaoF.L.ZhangZ.Climate change, wheat productivity and water use in the North China Plain: A new super-ensemble-based probabilistic projectionAgric. For. Meteorol.201317025527110.1016/j.agrformet.2011.10.003
- TaoF.L.ZhangZ.Impacts of climate change as a function of global mean temperature: Maize productivity and water use in ChinaClim. Chang.201110540943210.1007/s10584-010-9883-9
- Editorial BoardAgricultural Statistics of New China in Sixty YearsChina Agricultrue PressBeijing, China2009(In Chinese)
- PorterJ.R.GawithM.TemperatuRes. and the growth and development of wheat: A reviewEur. J. Agron.199910233610.1016/S1161-0301(98)00047-1
- SanchezB.RasmussenA.PorterJ.R.TemperatuRes. and the growth and development of maize and rice: A reviewGlob. Chang. Biol.20142040841710.1111/gcb.12389
- ThorntonP.HasenauerH.WhiteM.Simultaneous estimation of daily solar radiation and humidity from observed temperature and precipitation: An application over complex terrain in AustriaAgric. For. Meteorol.200010425527110.1016/S0168-1923(00)00170-2
- ZhangW.HuangY.SunW.J.YuY.Q.Simulating crop net primary production in China from 2000 to 2050 by linking the crop-C model with a FGOALS’s model climate change scenarioAdv. Atmos. Sci.20072484585410.1007/s00376-007-0845-8
- FangX.Q.WangY.XuT.YunY.R.Contribution of Climate Warming to Rice Yield in Heilongjiang ProvinceActa Geogr. Sin.200459820828
- ChengL.LiuR.H.MaZ.H.Influence of global warming on winter wheat yield in Henan ProvinceChin. J. Eco-Agric.20111985485910.3724/SP.J.1011.2011.00854
- CaoY.Y.ChenY.H.ChenM.WangZ.Q.WuC.F.BianX.C.YangJ.C.ZhangJ.H.Growth characteristics and endosperm structure of superior and inferior spikelets of indica rice under high-temperature stressBiol. Plant20166053254210.1007/s10535-016-0606-6
- DingY.H.RenG.Y.ShiG.Y.GongP.ZhengX.H.ZhaiP.M.ZhangD.E.ZhaoZ.C.WangS.W.WangH.J.National Assessment Report of Climate Change (I): Climate change in China and its future trendAdv. Clim. Chang. Res.2006238
- ButlerE.E.HuybersP.J.Adaptation of US maize to temperature variationsNat. Clim. Chang.20133687210.1038/nclimate1585
- ZhouY.HeZ.SuiX.X.XiaX.ZhangX.K.ZhangG.S.Genetic improvement of grain yield and associated traits in the Northern China winter wheat region from 1960 to 2000Crop Sci.20074724525310.2135/cropsci2006.03.0175
- LiuY.WangE.YangX.WangJ.Contributions of climatic and crop varietal changes to crop production in the North China Plain, since 1980sGlob. Chang. Biol.2009162287229910.1111/j.1365-2486.2009.02077.x
- HuangY.ZhangW.SunW.ZhengX.Net primary Production of Chinese croplands from 1950 to 1999Ecol. Appl.20071769270110.1890/05-1792
- WangF.HeZ.SayreK.D.LiS.SiJ.FengB.KongL.Wheat cropping systems and technologies in ChinaField Crop Res.200911118118810.1016/j.fcr.2008.12.004
- MinoliS.MullerC.ElliottJ.RuaneA.C.JagermeyrJ.ZabelF.DuryM.FolberthC.FrancoisL.HankT.Global response patterns of major rainfed crops to adaptation by maintaining current growing periods and irrigationEarth’s Future201971464148010.1029/2018EF001130
- SongY.WangC.RenG.ZhaoY.LinderholmH.W.The relative contribution of climate and cultivar renewal to shaping rice yields in China since 1981Theor. Appl. Climatol.20151201910.1007/s00704-014-1089-z
- OttmanM.J.KimballB.A.WhiteJ.W.WallG.W.Wheat Growth Response to Increased Temperature from Varied Planting Dates and Supplemental Infrared HeatingAgron. J.201210471610.2134/agronj2011.0212


| Location | Site (Province) | Longitude | Latitude | Altitude (m) | Annual Mean Temperature (°C) | Annual Total Precipitation (mm) | Total N (%) | pH | Crop | Sown Area * (hectare) | Developmental Index (DVI) (Month/Date) (Rice: Transplanting–Heading–Maturity; Wheat: Emergence–Heading–Maturity; Maize: Emergence–Silking–Maturity) | ||
|---|---|---|---|---|---|---|---|---|---|---|---|---|---|
| Emergence (Transplanting) | Heading (Silking) | Maturity | |||||||||||
| East China | Changshu (Jiangsu) | 31°32′ N | 120°41′ E | 1.3 | 15.4 | 1095 | 2.33 | 6.90 | Rice | 1351 | 6/14 | 8/28 | 10/22 |
| Winter wheat | 1339 | 10/28 | 4/15 | 5/29 | |||||||||
| South China | Taoyuan (Hunan) | 28°55′ N | 111°27′ E | 77.5 | 16.5 | 1353 | 1.31 | 5.44 | Early rice | 3482 | 4/26 | 6/15 | 7/10 |
| Late rice | 4062 | 7/14 | 9/2 | 10/10 | |||||||||
| North China | Fengqiu (Henan) | 35°00′ N | 114°24′ E | 67.5 | 13.9 | 507 | 0.99 | 8.30 | Winter wheat | 3587 | 10/24 | 4/20 | 6/8 |
| Summer maize | 2049 | 6/12 | 8/7 | 9/25 | |||||||||
| Northeast China | Hailun (Heilongjiang) | 47°26′ N | 126°38′ E | 240 | 1.3 | 531 | 2.30 | 5.64 | Spring maize | 9399 | 5/22 | 7/24 | 10/3 |
| Sanjiang (Heilongjiang) | 47°35′ N | 133°31′ E | 56.2 | 3.6 | 448 | 5.80 | 2.50 | Single rice | 10222 | 5/17 | 7/29 | 9/25 | |
| Crop | TL (°C) | TO (°C) | TU (°C) | Range of TO (f(T) ≥ 0.95) (°C) |
|---|---|---|---|---|
| Rice | 12 | 29 | 40 | 27–33 |
| Winter wheat | 3 | 18 | 35 | 16–25 |
| Maize | 9 | 30 | 42 | 26–33 |
| Input Data | Detailed Description | Source |
|---|---|---|
| Meteorological data | daily maximum, minimum and mean air temperature (°C), precipitation (mm), solar radiation (MJ m−2 d−1) | http://cdc.cma.gov.cn/home.do |
| Soil data | concentrations of organic carbon and total nitrogen (g/kg), sand and clay fraction (%), pH, bulk density (g cm−3) | Chinese Ecosystem Research Network (CERN) |
| Developmental index (DVI) | dates of crop growth: Rice: Transplanting–Heading–Maturity; Wheat: Emergence–Heading–Maturity; Maize: Emergence–Silking–Maturity | Chinese Ecosystem Research Network (CERN) |
| Farming management | timing and rates of fertilizer application, manure inputs, crop residue management, irrigation | Chinese Ecosystem Research Network (CERN) |
| Atmospheric CO2 concentration | World Meteorological Organization (https://community.wmo.int/activity-areas/gaw) |
| Crop | DVI | GPP a (gC m−2) | RA a (gC m−2) | AGB a (gC m−2) | Number of days with To b | Tmean c (°C) | |||||
|---|---|---|---|---|---|---|---|---|---|---|---|
| 1960s | 2000s | 1960s | 2000s | 1960s | 2000s | 1960s | 2000s | 1960s | 2000s | ||
| Rice (Changshu) | 40 days before heading–heading | 762 (47.0%) | 745 (44.4%) | 422 (47.5%) | 422 (45.5%) | 317 (45.8%) | 305 (42.6%) | 333 | 280 | 28.4 | 28.6 |
| heading–maturity | 666 (41.1%) | 735 (43.8%) | 383 (43.1%) | 420 (45.2%) | 283 (40.9%) | 315 (44.0%) | 139 | 162 | 20.7 | 21.6 | |
| Single rice (Sanjiang) | 40 days before heading–heading | 560 (51.5%) | 588 (50.8%) | 271 (50.4%) | 282 (50.0%) | 265 (51.2%) | 282 (50.5%) | 74 | 76 | 21.1 | 21.8 |
| heading–maturity | 404 (37.2%) | 421 (36.4%) | 210 (39.0%) | 217 (38.5%) | 194 (37.6%) | 204 (36.6%) | 12 | 33 | 17.7 | 18.2 | |
| Early rice (Taoyuan) | 40 days before heading–heading | 398 (54.9%) | 423 (55.3%) | 166 (54.7%) | 175 (54.2%) | 210 (52.4%) | 225 (53.6%) | 168 | 198 | 23.2 | 24.2 |
| heading–maturity | 309 (42.6%) | 317 (41.5%) | 131 (43.1%) | 139 (43.1%) | 178 (44.3%) | 178 (42.5%) | 171 | 156 | 26.8 | 28.7 | |
| Late rice (Taoyuan) | 40 days before heading–heading | 584 (58.0%) | 565 (54.9%) | 267 (59.8%) | 262 (57.0%) | 294 (55.0%) | 281 (51.6%) | 281 | 239 | 28.0 | 28.1 |
| heading–maturity | 362 (36.0%) | 404 (39.2%) | 157 (35.2%) | 175 (38.2%) | 205 (38.4%) | 229 (41.9%) | 111 | 156 | 22.0 | 23.3 | |
| Winter wheat (Fengqiu) | 40 days before heading–heading | 339 (54.2%) | 503 (51.4%) | 111 (42.3%) | 160 (42.2%) | 211 (61.8%) | 317 (58.2%) | 124 | 190 | 11.2 | 13.4 |
| heading–maturity | 136 (21.8%) | 184 (18.8%) | 82 (31.1%) | 104 (27.5%) | 54 (15.9%) | 80 (14.7%) | 200 | 208 | 20.8 | 21.5 | |
| Winter wheat (Changshu) | 40 days before heading–heading | 351 (45.6%) | 531 (46.5%) | 115 (37.3%) | 176 (39.1%) | 217 (51.1%) | 324 (52.2%) | 90 | 162 | 10.8 | 13.0 |
| heading–maturity | 209 (27.2%) | 271 (23.7%) | 108 (35.0%) | 143 (32.0%) | 101 (23.8%) | 128 (20.5%) | 234 | 256 | 18.3 | 19.9 | |
| Summer maize (Fengqiu) | 40 days before silking–silking | 392 (43.1%) | 387 (42.3%) | 94 (42.7%) | 90 (41.3%) | 269 (40.8%) | 269 (40.3%) | 332 | 352 | 27.6 | 27.1 |
| silking–maturity | 505 (55.6%) | 515 (56.3%) | 125 (56.7%) | 127 (58.0%) | 380 (57.7%) | 388 (58.2%) | 276 | 279 | 23.3 | 23.5 | |
| Spring maize (Hailun) | 40 days before silking–silking | 348 (46.2%) | 386 (45.0%) | 83 (39.8%) | 92 (38.9%) | 250 (46.7%) | 285 (45.5%) | 149 | 210 | 20.6 | 21.9 |
| silking–maturity | 383 (50.9%) | 445 (52.0%) | 122 (58.2%) | 139 (59.2%) | 261 (49.0%) | 306 (48.8%) | 83 | 140 | 16.2 | 17.5 | |
- Publisher’s Note: MDPI stays neutral with regard to jurisdictional claims in published maps and institutional affiliations.
© 2020 by the authors.
Share and Cite
Zhang, Q.; Zhang, W.; Yu, Y.; Li, T.; Yu, L. Modeling the Impact of Atmospheric Warming on Staple Crop Growth in China in the 1960s and 2000s. Atmosphere 2021, 12, 36. https://doi.org/10.3390/atmos12010036
Zhang Q, Zhang W, Yu Y, Li T, Yu L. Modeling the Impact of Atmospheric Warming on Staple Crop Growth in China in the 1960s and 2000s. Atmosphere. 2021; 12(1):36. https://doi.org/10.3390/atmos12010036
Chicago/Turabian StyleZhang, Qing, Wen Zhang, Yongqiang Yu, Tingting Li, and Lijun Yu. 2021. "Modeling the Impact of Atmospheric Warming on Staple Crop Growth in China in the 1960s and 2000s" Atmosphere 12, no. 1: 36. https://doi.org/10.3390/atmos12010036
APA StyleZhang, Q., Zhang, W., Yu, Y., Li, T., & Yu, L. (2021). Modeling the Impact of Atmospheric Warming on Staple Crop Growth in China in the 1960s and 2000s. Atmosphere, 12(1), 36. https://doi.org/10.3390/atmos12010036