Abstract
This study focuses on the long-range chemical composition and pollution characteristics of precipitation components. Samples were collected from Jeju Island in 1997–2015, and their major ionic components were analyzed. Comparison of ion balance, electrical conductivity, and acid fraction of precipitation samples yielded correlation coefficients in the range of 0.937–0.980. The volume-weighted mean pH and electrical conductivity of the wet precipitation of the Jeju area were 4.81 and 21.7 μS/cm, respectively. Ionic strengths of the wet precipitation samples were within the range of 0.24 ± 0.26 mM, indicating that more than 30% of the total precipitation satisfied the pure precipitation criterion. Of the total precipitation in the Jeju area, 44% exhibited a pH in the range of 4.5–5.0, indicating weak acidity. The composition of sea salts and secondary pollutants in the precipitation were 56.8% and 28.7%, respectively, indicating that the precipitation in the Jeju area was affected by the surrounding coastal area. The acidity contributions by inorganic and organic acids were 92.3% and 7.7%, respectively, whereas, the neutralization factors for ammonia and calcium carbonate were 47.0% and 20.0%, respectively. Clustered back trajectory analysis indicates that the concentrations of most ionic components were higher in the airflow pathways to the Jeju area.
1. Introduction
Precipitation is known to cause considerable damage to ecosystems and to contaminate soils and lakes by transporting the pollutants in the atmosphere to the Earth’s surface [1]. The chemical composition of rainwater depends to a large extent on the chemical composition of the atmosphere. Several factors, such as the type and distribution of atmospheric aerosol sources, the local and remote transportation of gases, the removal of chemical species by rain, and micro–meteorological factors, control the concentration of chemical species in precipitation [2,3].
The study of the chemical composition of rainwater not only provides relevant information on the factors that govern rainwater chemistry but also elucidates local and regional dispersion of pollutants. Precipitation is a reliable indicator that reflects underlying factors of climate change and environmental pollutant characteristics [4,5].
The removal mechanisms of atmospheric pollutants caused by precipitation are classified as rainouts and washouts. A rainout is an in-cloud scavenging process that removes particulate or gaseous pollutants in the atmosphere as they start condensing to nuclei in clouds, and is related to the long-range transport of air pollutants. A washout is a below-cloud scavenging process by which atmospheric pollutants are absorbed and adsorbed by the generated raindrops as they fall to the ground; this is known to be mainly affected by local factors [6,7].
The acidification of precipitation can be caused by naturally occurring acidic substances resulting from volcanoes, lightning strikes, decomposition of organic matter, and oxidation of dimethyl sulfide in the oceans. Acidification of precipitation is recognized as an outcome of the industrial era, as the rapid increase in the intensity of acidification is caused by anthropogenic activities such as increased use of energy corresponding to the fast pace of industrialization and economic growth [8].
In the northeast Asian region, including Korea, the emission of pollutants such as sulfur dioxide (SO2), nitrogen oxides (NOX), carbon monoxide (CO), and volatile organic compounds (VOCs) has increased significantly over the past 20 years due to rapid economic growth and increased energy use [9,10,11]. Among the acidic gases, SO2 and NOX are the greatest contributors to acid rain, and can be easily transported from their emission sources to other areas due to their high diffusivity, thus transforming local pollution into wide-area pollution. Moreover, the emission of such transboundary pollutants is likely to become a disputable matter among neighboring countries. North America and northwest Europe have suffered severe damages from acid rain and faced disputes from neighboring countries on this issue. Efforts to establish policies and measures intended to combat acid rain are ongoing [9,10,11].
The severe problem of acid rain in Europe and North America has been systematically managed since the 1970s. In Europe, the Organization for Economic Cooperation and Development (OECD) launched a program for monitoring air pollutants in 1972, followed by the establishment of the European Monitoring and Evaluation Programme in 1977 to form a network covering all regions of Europe, to measure acid deposition. The United States established the National Acid Precipitation Assessment Program to continuously monitor and manage acid rain over a long period of time, at more than 200 measuring stations [9,12,13].
Research on precipitation chemistry in East Asia was initiated by European agricultural chemists in the second half of the 19th century [14]. The need for international joint research on acid rain monitoring in East Asia was raised through continuous discussions following the meeting of international experts on acid rain held in Japan in 1998 [15,16].
In Japan, surveys on “wet air pollutions” were conducted in the metropolitan areas during the latter half of the 1970s [17]. In 1983, acid deposition monitoring was introduced at 29 sites by the Environment Agency to collect fundamental data on the chemical composition of precipitation, and its effects on lakes and soils [18,19,20]. In Korea, chemical analysis of precipitation began in Seoul and Ulsan in 1978. In addition, monitoring using automatic samplers was introduced by the Environmental Agency at 45 sites in 1983 [21,22].
In 2001, the Acid Deposition Monitoring Network in East Asia, in which a total of 12 countries including Korea, China, and Japan have participated, commenced their official activities [15,16].
Jeju Island is a typical background site in Korea with few industrial facilities and low population density, resulting in low generation of pollution. It is also a geographically suitable area for the assessment of the long-range transport of air pollutants from neighboring areas, as it is located at the center of the northeastern area, including the Korean peninsula, Japan, and China (Figure 1). In this study, we analyzed the major ionic components in precipitation samples collected over almost two decades on Jeju Island. Based on the analytical results, the acidity and chemical composition of the precipitation were investigated to understand the pollution characteristics as well as the long-term variation trends of precipitation species in this region.
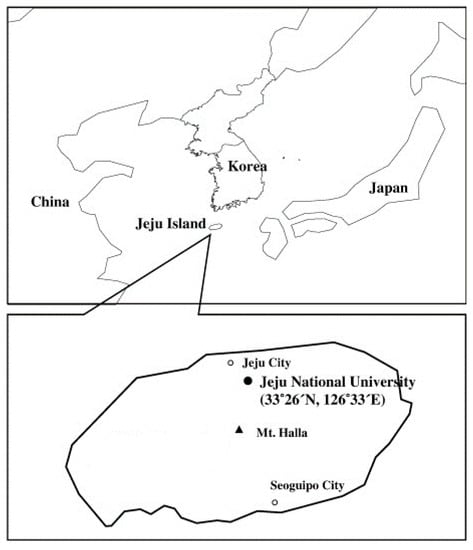
Figure 1.
Map of Jeju Island showing the sampling site.
2. Experimental Methodology
2.1. Sampling
Precipitation samples were collected for 19 years from 1997 to 2015 on the rooftop of the College of Natural Sciences building of Jeju National University (33°26’ N, 126°33’ E) (Figure 1). The collection was automatically carried out using a sensor attached to the sample collector (Shinil Science, SL-4-001, Cheonan, Korea) that had a sampling inlet diameter of 253 mm. The sampling inlet was made from stainless steel to prevent corrosion, and the inner wall of the collector was coated with Teflon to minimize contamination through the adsorption of impurities. The collected precipitation samples were transported to the laboratory and stored in a freezer at −20 ℃. A portion of each of these samples was tested for pH and electrical conductivity, and analyzed to identify the major ionic components of precipitation. Following the method of Kim et al., 1–2 drops of chloroform were added to the remaining portions of the samples and stored in a freezer at −20 °C, to be used for trace analysis such as organic acid analysis [12].
2.2. Analysis of the Samples
The pH of the precipitation samples was measured via a pH meter (ORION, 720A, 81-02 electrode, Espoo, Finland) using buffer solutions with pH levels of 4.10 and 6.97 at 25 ℃. To measure electrical conductivity, an electrical conductivity meter (Thermo Electron, ORION 3 STAR, 013005MD Electrode, Espoo, Finland) was used. A syringe filter (Whatman, PVDF syringe filter, 0.45 µm, 13 mm) was used to filter out insoluble particles from the samples, and the filtrate was used to analyze the cations, anions, and organic acids in the sample. Cations (Na+, NH4+, K+, Mg2+, Ca2+) and anions (Cl−, NO3−, SO42−) were analyzed using ion chromatography (Metrohm, Modula IC, Switzerland) while organic acids and trace anions (HCOO−, CH3COO−, F−, CH3SO3−) were analyzed using Dionex IC (Dionex, DX-500, USA) and Metrohm IC (Metrohm, Modula IC, Herisau, Switzerland) in this study. The instrumental detection limits (IDLs) and coefficients of variation (CVs) of the analyzed ions are presented in Table 1.

Table 1.
Instrument detection limit (IDL) and coefficient of variation (CV) for the ionic components (n = 7).
2.3. Back Trajectory Analysis
The Hybrid Single Particle Lagrangian Integrated Trajectory, Version 4.0 (HYSPLIT4.0) model of the National Oceanic and Atmospheric Administration/Air Resources Laboratory was used for back trajectory analysis to track the movement of airflow using meteorological data from the Global Data Assimilation System (GDAS) [23,24,25]. In this study, an altitude of 320 m was set as the benchmark, and the simulation time of the back trajectory analysis was set to 5 days (120 h), considering that air pollutants generated in China would reach the Korean Peninsula within approximately 4 days [26]. The coordinates of the measurement point were set to Jeju National University (33°26′ N, 126°33′ E) (Figure 1).
3. Results
3.1. Reliability Evaluation of The Analytical Data
Because precipitation component analysis requires the measurement of dissolved trace components, the results may vary significantly depending on the methods of collection and storage of samples, pretreatment procedures, and analysis techniques. In general, if a quantitative analysis of the major components of precipitation samples is carried out, the ion balance should exhibit good correlation. A strong correlation between the measured electrical conductivity of precipitation and the theoretical electrical conductivity calculated from the ion concentration of precipitation should also be present, allowing for the evaluation of the accuracy of the analytical data [27]. The accuracy can also be estimated by calculating the acid fraction (AF) using Equations (1) and (2) below, and comparing their results to examine the correlation between them [28,29].
Here, is the concentration-weighted mean equivalent conductivity of cations (excluding H+), is the concentration-weighted mean equivalent conductivity of anions, and is the equivalent conductivity of H+.
In this study, quality assurance or quality control of data was performed by comparing ion balance, electric conductivity, and acid fraction to evaluate the accuracy of the analytical data; the results are shown in Table 2. As shown in Table 2, the correlation coefficient between the total cation equivalent concentration and total anion equivalent concentration was 0.973. Moreover, the correlation coefficient between the measured electric conductivity and the theoretical electric conductivity was 0.980. The same measure for the acid fractions calculated using Equations (1) and (2) was 0.937, indicating quite high correlations. Thus, the correlation coefficient (r) obtained by all three methods exhibited a high correlation of 0.9 or higher, confirming the high reliability level of analytical data in this study.
Table 2.
Evaluation of analytical data using three accuracy parameters: ion balance, electric conductivity, and acid fraction (n = 924).
Furthermore, to determine the deviation between the sum of the concentrations of cations and the sum of the concentration of anions, the percentage imbalance (% imbalance) of the two values was investigated. To that end, the scattergram of the % imbalance ((∑[Cation] − ∑[Anion])/(∑[Cation] + ∑[Anion])) × 100 for the sum of ion concentrations (∑[Cation] + ∑[Anion]) was examined, and the results are shown in Figure 2. In general, if the scattergram of the data shows an imbalance of 25% or less in precipitation analysis, the analytical data is considered to exhibit relatively good results. This criterion varies depending on the purpose of the study, and can be somewhat eased if the proposed criterion is sufficient to understand the research objective [9]. In this study, the lower the ion concentration, the greater the percentage imbalance, and the higher the ion concentration, the lower the percentage imbalance. Moreover, most data points, that is, 924 pieces, excluding only 45 pieces, yielded a scattergram of imbalance that was less than 25%, indicating good reliability.
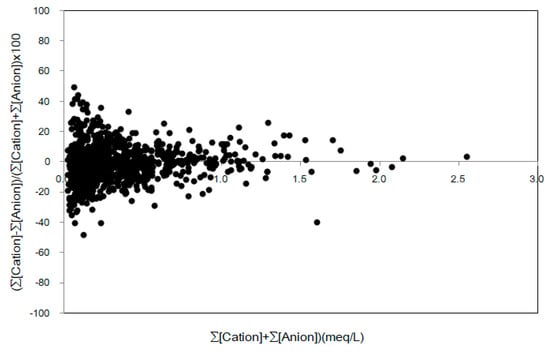
Figure 2.
Scattergram of ((∑Cation − ∑Anion)/(∑Cation + ∑Anion)) × 100 versus (∑Cation + ∑Anion).
3.2. Results of the Sample Analysis
3.2.1. Ion Concentration of Precipitation
The pH values during the study periods varied from 3.65 to 6.99, and the volume-weighted mean (VWM) pH was 4.81. The concentration of HCO3− was calculated as [HCO3−] = 10 (pH − 11.3) [30]. SO42− and Ca2+ concentrations were converted to non-sea salt concentrations because Jeju Island is near the coastal area. nss-SO42− is the equivalent non-sea salt SO42− concentration, calculated using the formula [nss-SO42−] = [SO42−] − 0.121 × [Na+], and nss-Ca2+ is the equivalent non-sea salt Ca2+ concentration calculated using the formula [nss-Ca2+] = [Ca2+] − 0.044 × [Na+] [31].
The VWM pH of the precipitation measured in Jeju area was 4.81, indicating that for the most part relatively weak acid rain fell during the measuring period, and the volume-weighted mean electrical conductivity was 21.7 µS/cm. The ionic strength of precipitation showed a value of 0.24 ± 0.26 mM, with approximately 32.6% of the total samples showing an ionic strength of less than 10−4 M, which is the criterion for pure precipitation.
Regarding the acidity of precipitation, according to the Report of the Global Atmosphere Watch (2016), the volume-weighted average pH of precipitation in Korea ranged from 4.59 to 4.74 between 2006 and 2015, showing no significant fluctuations among periods or regions [32]. The results of the study conducted in Jeju Island also indicated a tendency toward weak acidity, which is similar to the results of the Report of the Global Atmosphere Watch. The frequency distribution of the pH of precipitation and the distribution of major ionic components during the study periods are shown in Figure 3; precipitation with a pH level of 5.5 or less accounted for 90.9%, 44.0% of which exhibited a pH range of 4.5–5.0.
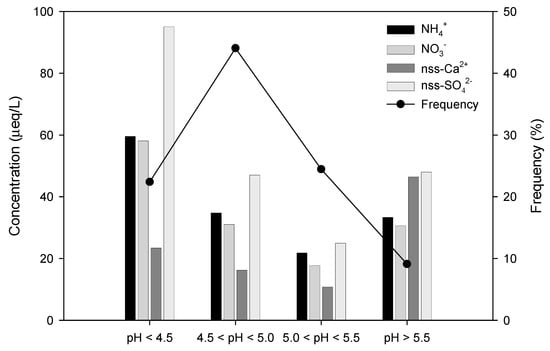
Figure 3.
Variation of ionic concentration (µeq/L) and frequency (%) corresponding to different pH ranges of precipitation.
In regard to the concentrations of ionic components corresponding to pH ranges, nss-SO42− and NO3− showed higher concentrations than NH4+ and nss-Ca2+ in the pH range of 4.5 or less, whereas the concentrations of NH4+ and nss-Ca2+ were relatively higher than those of nss-SO42− and NO3− in the pH range of 5.5 or above. As shown by the results, nss-SO42− and NO3−, which affect the acidification of precipitation, mainly had high concentrations when the acidity value of the samples was high, whereas the concentrations of nss-Ca2+ and NH4+ were high when the acidity value of the samples was low.
In terms of concentrations of ionic species during the study periods, Na+, Cl−, and Mg2+ originating from sea salt were significantly influenced by the ocean as they accounted for 56.8%. The secondary pollutants nss-SO42−, NO3−, and NH4+, accounted for 28.7%, and nss-Ca2+, the soil component, accounted for 3.4% (Figure 4).
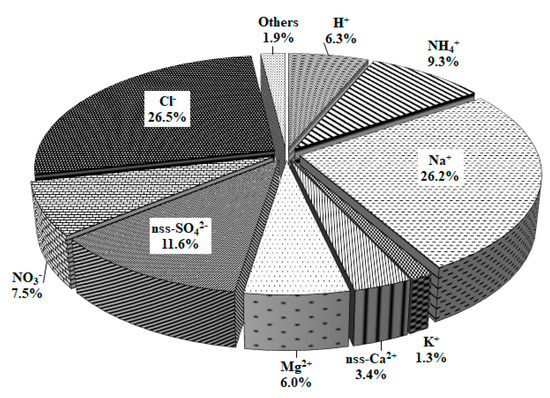
Figure 4.
Composition ratio of ionic species in precipitation during the study period.
The results of the precipitation analysis for the Jeju area were compared with those of background sites in Korea, such as Gosan and Anmyendo, and with those of urban areas in other countries, such as Shanghai and Shangdianzi in China, Tokyo in Japan, and southern Taiwan, as shown in Table 3 [7,33,34,35,36]. The concentrations of SO42− and NH4+, which are secondary pollutants, were 36.1 and 22.6 µeq/L in the Jeju area, respectively, and compared to Anmyeondo, these values were 1.4 to 1.8 times lower. On the other hand, compared to Shanghai and Shangdianzi in China, the concentrations of these ions were 3.6 to 9.4 times lower. The concentrations of Na+ and Cl−, which are sea salt components, were 1.1 to 6.0 times higher than those in urban areas in China and Japan and were similar or low compared with those in Gosan and Anmyeondo. As a result, the precipitation in the Jeju area is considered to be less polluted by secondary pollutants, and the concentrations of sea salt components increase owing to the influence of the adjacent sea [9].
Table 3.
Volume-weighted mean ionic concentration (µeq/L) of precipitation in the other sites.
3.2.2. Long-term Variations in Precipitation Components
The long-term variation during the study periods in the concentrations of nss-SO42− and NO3−, which are the ionic components that affect acidification, was investigated and are shown in Figure 5. Nss-SO42− showed an average concentration of 28.4 µeq/L for 19 years from 1997 to 2015, with the highest concentration in 2005 and the lowest concentration in 1999. The difference in concentrations occurs each year due to the difference in the amount of precipitation. Based on the variations in concentrations over the 19 years, the slope of the trend line was found to be 0.21, as shown in Figure 5.
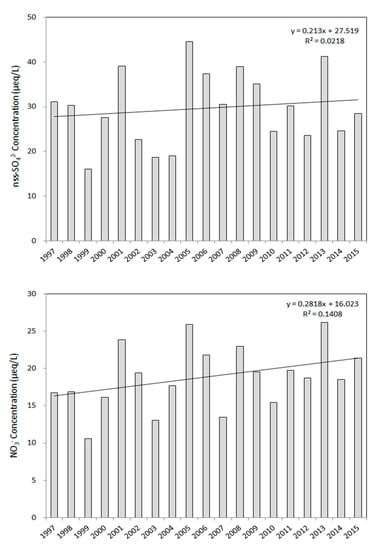
Figure 5.
Long-term variations of nss-SO42− and NO3− in precipitation between 1997 and 2015.
The average concentration of NO3− over the 19 years was 18.3 µeq/L, with the highest being in 2016 and the lowest in 1999, showing a trend that was similar to that of nss-SO42−. Examining the variations over 19 years, the slope of the trend line was calculated to be 0.28, which is a slightly larger increase than that of nss-SO42−. The concentrations of nss-SO42− and NO3− over a long time period showed tendencies toward continuous increase, which is expected to constantly affect the pollution of precipitation in the Jeju area.
The concentrations and ratios of formate (HCOO−) and acetate (CH3COO−) ions, the organic acids that affect acidification in addition to inorganic acids, are shown in Table 4 [37,38,39,40]. Less than 10% of the atmosphere comprises organic acids in the form of particles, 80% of which occur as fine particles of less than 1.0 μm [41]. The pollution characteristics of formic and acetic acids are determined by calculating the concentrations of HCOO− and CH3COO−; these are representative organic acid components. The ratio of the two components varies depending on the study area. In clean areas with relatively little pollution, the concentrations and ratio of organic acids in fall and winter increase during spring and summer near deciduous forests [42].
Table 4.
Measured HCOOHT and CH3COOHT concentrations (μmol/L) in precipitation on Jeju Island and other areas.
According to previous studies, if the ratio of formic to acetic acid (F/A) is less than 1, it can be inferred that the contamination stems from the direct emission of primary pollutants, and if the F/A value is greater than 1, the contamination is considered to be caused by the effect of secondary pollutants such as those coming from photochemical reactions [37]. The total organic acid concentration (HCOOHT and CH3COOHT) was calculated from the concentration of organic acid anions using the following equation:
The concentrations of HCOOHT and CH3COOHT were 2.25 and 2.88 μmol/L, respectively. The ratio (F/A) of these concentrations was 0.78, indicating that the organic acid component of precipitation in Jeju Island was influenced by the direct emission of primary pollutants.
The ionic composition in precipitation was also investigated annually through the analyzed ionic concentrations, as shown in Figure 6. As shown in Figure 6, sea salt components (Na+, Cl−, Mg2+) accounted for the highest composition, which ranged from 42.6 to 74.1% during the study periods. The nss-SO42−, NO3−, and NH4+ content (secondary pollutants) ranged from 16.5 to 40.7%. In particular, the composition of secondary pollutants is considered to increase under the influence of the measured concentrations of nss-SO42− and NO3−, which are related to industrial facilities and increased car usage.
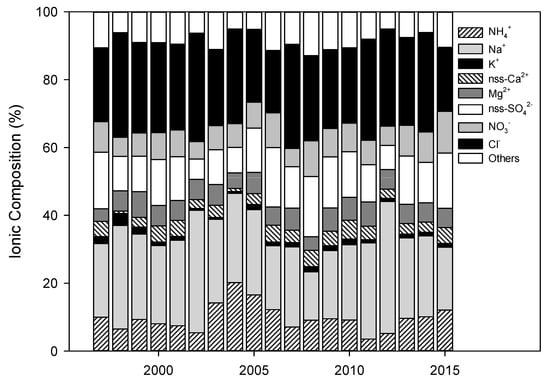
Figure 6.
Long-term variations in the ionic composition of precipitation between 1997 and 2015.
3.3. Acidification and Neutralization Characteristics of Precipitation
Acidification of precipitation is generally caused by H2SO4, HNO3, HCl, and carboxylic acids (RCOOH). Therefore, the contribution to the acidification of each ionic component can be estimated by measuring the concentrations of the conjugate bases (nss-SO42−, NO3−, Cl−, HCOO−, CH3COO−, etc.) of these acids. However, Cl− is known to mainly enter the background site through sea salts, and its effect on the pH of precipitation in these areas is considered to be insignificant. Most of the acid materials in precipitation are able to be neutralized by dissolved basic species from the ambient air, such as ammonia and calcium carbonate. The contribution of these basic species to the neutralization behavior can be evaluated by measuring their concentrations through the determination of ammonium and calcium ions [16,43].
In this study, the acidification contribution (AC) was investigated using Equation (3) to understand the effect of the major acidic components of the precipitation in the Jeju area. In the equation, [nss-SO42−] + [NO3−] + [HCOO−] + [CH3COO−] is the sum of the equivalent concentrations of the components, and [X] represents the equivalent concentration of each component [16].
The AC of inorganic (nss-SO42−, NO3−) and organic acids (HCOO−, CH3COO−) was calculated using Equation (3), and the results are shown in Table 5. During the study periods, the acidification contribution rate of inorganic acids was 92.3%, while that of inorganic acids was 7.7%, indicating that the acidification of the precipitation in the Jeju area was mainly caused by inorganic acids.
Table 5.
Acidification contributions (%) of acidic anions in precipitation.
The neutralization contribution can be evaluated by calculating the neutralization factor (NF) as shown in Equations (4) and (5), where nss-SO42−, NO3−, HCOO−, CH3COO−, NH4+, and nss-Ca2+ are equivalent concentrations of each component [16].
Table 6 shows the calculated neutralization factors for the precipitation in the Jeju area. The neutralization factors for NH3 and CaCO3 were 0.47 and 0.20, respectively, which demonstrates that most of the neutralization by NH3 occurs in the Jeju area. The precipitation in Jeju was mostly neutralized by ammonia and calcium carbonate and the sum of the neutralization rates of NH3 and CaCO3 was approximately 67%.
Table 6.
Neutralization factors (NF) by ammonia and calcium carbonate.
The correlation between the sum of major acidic anions (nss-SO42−, NO3−, HCOO−, CH3COO−) and the sum of basic cations (H+, NH4+, nss-Ca2+) was investigated, and the results are shown in Figure 7. The stronger the correlation between the sum of acidic anions, hydrogen ions, and basic cations, the more acidification and neutralization of precipitation occur, mainly by these components. In contrast, the weaker the correlation, the higher the contribution of other components to the acidification and neutralization of precipitation [9]. In this study, the correlation coefficient (r) between acidification and neutralization components of the precipitation in the Jeju area was 0.891, which is relatively high. Based on these results, the acidification and neutralization of precipitation in the Jeju area was inferred to be caused by these components, and the contribution of other acids and bases appears insignificant.
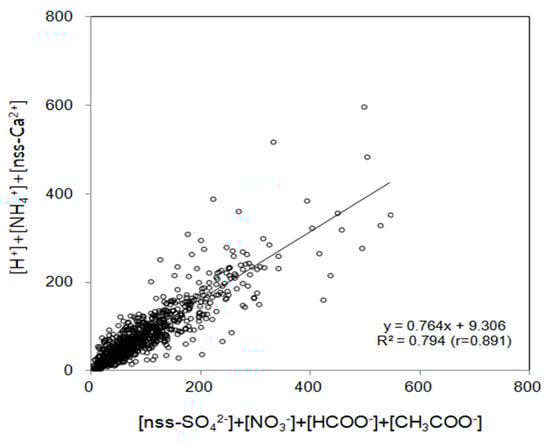
Figure 7.
Correlation between ∑([H+] + [NH4+] + [nss-Ca2+]) and ∑([nss-SO42−] + [NO3-] + [HCOO−] + [CH3COO−]).
3.4. Inflow Path of Precipitation Components
The transboundary problem caused by the long-range transport of air pollutants is a sensitive dispute between neighboring countries and has extensively been examined using back trajectory analysis [12]. In this study, the movement of air masses at the time of precipitation sampling was estimated using HYSPLIT4.0, based on back trajectory analysis, to establish the inflow path of pollutants to the precipitation. Air pollutants from China reach the Korean Peninsula within approximately 4 to 5 days, and the simulation time of the back trajectory analysis was set to 120 h [12]. As shown in Figure 8, a cluster analysis was performed based on the results of the back trajectory analysis to establish the inflow path of air masses. In the cluster analysis, 924 precipitation samples were categorized into 6 clusters. From the clustered back trajectory analysis, Cluster 1 (Central China) accounted for 19% (176 samples) of the inflow of air masses, Cluster 2 (China continent and Mongolia) 24% (226 samples), Cluster 3 (North China and Siberia) 9% (85 samples), Cluster 4 (North Pacific) 11% (99 samples), Cluster 5 (South China) 16% (151 samples), and Cluster 6 (Korean Peninsula and East Sea) 20% (187 samples), suggesting that the inflow of air masses from China occurs most frequently.
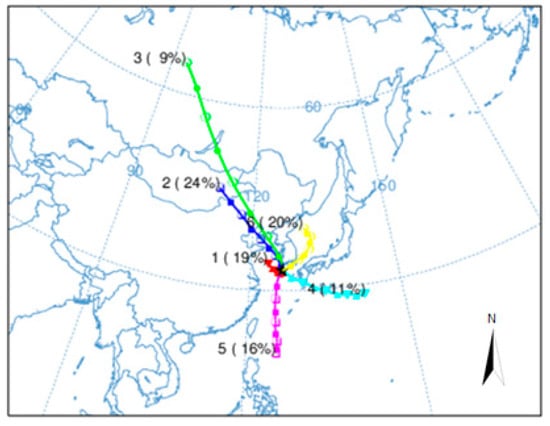
Figure 8.
Clustered 120 h back trajectories of air masses corresponding to precipitation sampling date.
Based on the back trajectory analysis, the concentrations of components affecting the acidification and neutralization of the precipitation of each inflow path of the air masses were compared, and the results are shown in Figure 9.
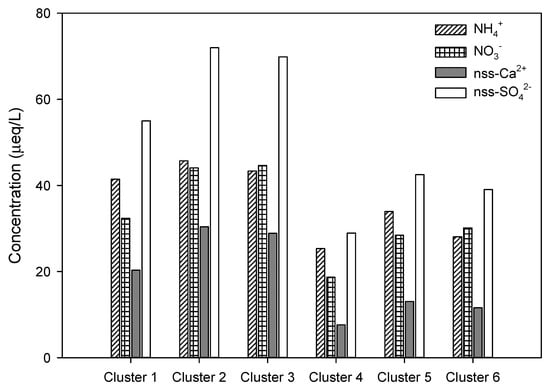
Figure 9.
Variations of nss-SO42−, NO3−, NH4+, and nss-Ca2+ concentrations in relation to six inflow sources of air masses by clustered back trajectory.
As shown in Table 7, the highest concentrations of NH4+ and nss-SO42− were 45.7 and 72.0 µeq/L, respectively, in Cluster 2, and the highest concentration of NO3− was 44.7 µeq/L in Cluster 3. The concentrations of these components increase as air masses flow into the Jeju area through northern and eastern China, where Chinese industrial facilities are concentrated. The concentration of nss-Ca2+, the soil component, was 30.4 µeq/L in Cluster 2 and 28.9 µeq/L in Cluster 3, where air masses moved from China and Mongolia to Jeju Island. The concentration of nss-Ca2+ appeared to be high because the air masses flowed through the desert regions of China and Mongolia as well as the industrial facilities in China. On the other hand, when the air masses moved from the ocean, such as the North Pacific or East Sea, there were relatively few pollutants. Therefore, the concentrations of components that affect acidification and neutralization were low. The concentrations of major ionic components affecting acidification and neutralization in precipitation in the Jeju area were observed to be high when air masses moved from China, and low when air masses moved from the North Pacific Ocean. Therefore, the air quality in the Jeju area is considered to be highly affected by long-range transport.
Table 7.
Ionic concentration (µeq/L) of precipitation in accordance with airflow transport pathways determined via cluster back trajectories.
4. Conclusions
Pollution characteristics of precipitation in Jeju Island were investigated by analyzing major ionic components in precipitation samples from the Jeju area. In addition, pollutant transport from the surrounding areas to Jeju Island and its effect on air quality was evaluated by comparing the ionic concentrations of precipitation with respect to the movement of air masses.
The volume-weighted mean pH of the precipitation in the Jeju area was determined to be 4.81, which is weakly acidic, and approximately 32.6% of the total precipitation satisfied the criterion for pure precipitation based on an electrical conductivity of 21.7 µS/cm and ionic strength of 0.24 ± 0.26 mM. Based on the acidity, the concentrations of nss-SO42− and NO3− were high when the pH value was 4.5 or less, whereas the concentrations of NH4+ and nss-Ca2+ showed a tendency to increase when the pH level was 5.5 or higher.
During the study periods, the concentrations of nss-SO42− and NO3−, the ionic components affecting acidification, increased continuously, and the proportion of secondary pollutants (nss-SO42−, NO3−, NH4+) also increased.
The contribution rate of inorganic acids (nss-SO42−, NO3−) to acidification was 92.3%, and that of organic acids (HCOO−, CH3COO−) was 7.7%, suggesting that acidification was mainly caused by inorganic acids in the Jeju area. On the contrary, the neutralization rates of NH3 and CaCO3 were 47% and 20%, respectively, indicating that neutralization mostly occurred through these two components. In addition, the correlation coefficient among the sum of the concentrations of these acid anions (nss-SO42−, NO3−, HCOO−, CH3COO−), hydrogen ions, and basic cations (H+, NH4+, nss-Ca2+) was relatively high, indicating the important role that these components played in the acidification and neutralization of precipitation.
Upon comparing the concentrations of major ionic components in precipitation corresponding to different inflow paths of air masses through investigations based on the clustered back trajectory analysis, the concentrations of nss-SO42−, NO3−, NH4+, and nss-Ca2+ were observed to be high when the air masses moved from China to Jeju Island. In contrast, when air masses moved from the North Pacific, the concentration was relatively lower, indicating that the precipitation components in the Jeju area are largely influenced by pollutants brought in via long-range transport.
Author Contributions
Conceptualization, J.-O.B. and J.-M.S.; Methodology, J.-O.B., H.-J.K. and C.-H.K.; software, H.-J.K.; validation, C.-H.K. and J.-M.S.; formal analysis, J.-O.B. and J.-M.S.; Investigation, C.-H.K. and W.-H.K.; Writing—original draft preparation, J.-O.B. and J.-M.S.; Writing—review and editing, J.-O.B., H.-J.K., C.-H.K., W.-H.K, and J.-M.S. All authors have read and agreed to the published version of the manuscript.
Funding
This research was supported by Basic Science Research Program through the National Research Foundation of Korea (NRF), funded by the Ministry of Education (NRF-2019R1I1A1A01064325).
Institutional Review Board Statement
Not applicable.
Informed Consent Statement
Not applicable.
Data Availability Statement
Not applicable.
Conflicts of Interest
The authors declare no conflict of interest.
References
- NADP. National Trends Network Site Operation Manual. NaDP Manual 1999~2001. Available online: http://nadp.slh.wisc.edu/lib/archive/NTN_Site_Operations_manual_v1999-01c.pdf. (accessed on 20 August 2020).
- Zhao, Y.; Feng, Q.; Lu, A. Variation of chemical characteristics of precipitation with respect to altitude gradient on the northern slope of Mt. Taibai, China. J. Atmos. Sol. Terr. Phys. 2020, 197, 105026. [Google Scholar] [CrossRef]
- Santos, P.S.; Otero, A.M.; Santos, E.B.H.; Duarte, A.C. Chemical composition of rainwater at a coastal town on the southwest of Europe: What changes in 20years? Sci. Total. Environ. 2011, 409, 3548–3553. [Google Scholar] [CrossRef] [PubMed]
- Zunckel, M.; Saizar, C.; Zarauz, J. Rainwater composition in northeast Uruguay. Atmos. Environ. 2003, 37, 1601–1611. [Google Scholar] [CrossRef]
- Zhang, M.; Wang, S.; Wu, F.; Yuan, X.; Zhang, Y. Chemical compositions of wet precipitation and anthropogenic influences at a developing urban site in southeastern China. Atmos. Res. 2007, 84, 311–322. [Google Scholar] [CrossRef]
- Kim, N.K.; Kim, Y.P.; Kang, C.H.; Moon, K.C. Characteristics of Nitrate Concentration Measured at Gosan: Measurement Data of PM2.5 and TSP between 1998 and 2002. J. Korean Soc. Atmos. Environ. 2004, 20, 119–128. [Google Scholar]
- Ko, H.J.; Jeong, J.; Kim, E.S.; Lee, S.S.; Ryoo, S.B. Composition and Neutralization Characteristics of Precipitation at the Anmyeon-do and Gosan GAW Station from 2008 to 2017. Atmosphere 2019, 29, 403–416. [Google Scholar]
- Zhang, G.S.; Zhang, J.; Liu, S.M. Chemical composition of atmospheric wet depositions from the Yellow Sea and East China Sea. Atmos. Res. 2007, 85, 84–97. [Google Scholar] [CrossRef]
- Larssen, T.; Lydersen, E.; Tang, D.; He, Y.; Gao, J.; Liu, H.; Duan, L.; Seip, H.M.; Vogt, R.D.; Mulder, J.; et al. Acid rain in China. Environ. Sci. Technol. 2006, 40, 418–425. [Google Scholar] [CrossRef]
- Kim, Y.J. A study on Characteristics of Long-Range Transport Aerosol by Transport Patterns in Northeast Asia. Ph.D. Dissertation, Konkuk University, Seoul, Korea, 2010. [Google Scholar]
- Niu, H.; He, Y.; Lu, X.X.; Shen, J.; Du, J.; Zhang, T.; Pu, T.; Xin, H.; Chang, L. Chemical composition of rainwater in the Yulong Snow Mountain region, Southwestern China. Atmos. Res. 2014, 144, 195–206. [Google Scholar] [CrossRef]
- Kim, K.-J.; Bu, J.-O.; Kim, W.-H.; Lee, Y.-S.; Hyeon, D.-R.; Kang, C.-H. Pollution Characteristics of Rainwater at Jeju Island during 2009~2010. J. Korean Soc. Atmospheric Environ. 2013, 29, 818–829. [Google Scholar] [CrossRef]
- Calvo, A.I.; Olmo, F.J.; Lyamani, H.; Alados-Arboledas, L.; Castro, A.; Fernández-Raga, M.; Fraile, R. Chemical composition of wet precipitation at the background EMEP station in Víznar (Granada, Spain) (2002-2006). Atmos. Res. 2010, 96, 408–420. [Google Scholar] [CrossRef]
- Fujita, S.; Takahashi, A.; Weng, J.H.; Huang, L.F.; Kim, H.K.; Li, C.K.; Huang, F.T.C.; Jeng, F.T. Precipitation chemistry in East Asia. Atmos. Environ. 2000, 34, 525–537. [Google Scholar] [CrossRef]
- EANET. Acid Deposition Monitoring Network in East Asia, Data Report on the Acid Deposition in the East Asian Region 2001-2011, Network Center for EANET, 2013. Available online: http://www.eanet.asia/product (accessed on 20 August 2020).
- Cheng, Y.; Liu, Y.; Huo, M.; Sun, Q.; Wang, H.; Chen, Z.; Bai, Y. Chemical characteristics of precipitation at Nanping Mangdang Mountain in eastern China during spring. J. Environ. Sci. 2011, 23, 1350–1358. [Google Scholar] [CrossRef]
- Okita, T. Acid precipitation and related phenomena in Japan. Water Qual. Bull. 1983, 8, 101–108. [Google Scholar]
- Hara, H.; Ito, E.; Katou, T.; Kitamura, Y.; Komeiji, T.; Oohara, M.; Okita, T.; Sekiguchi, K.; Taguchi, K.; Tamaki, M.; et al. Analysis of two-year results of acid precipitation survey within japan. Bull. Chem. Soc. Jpn. 1990, 63, 2691–2697. [Google Scholar] [CrossRef]
- Katoh, T.; Konno, T.; Koyama, I.; Tsuruta, H.; Makino, H. Acidic precipitation in Japan. In Acidic Precipitation; Bresser, A.H.M., Salomons, W., Eds.; Springer: Berlin, Germany, 1989; Volume 5, pp. 41–105. [Google Scholar]
- Hara, H. Acid deposition chemistry in Japan. Bull. Inst. Public Health. 1993, 42, 1–12. [Google Scholar]
- Lee, M.H. Situation of acid rain in Korea. In strategy for Air Pollution Control in East Asia; Hirai, E., Ed.; International symposium on the air pollution control policy and strategy: Chongqing, China, 1996; pp. 25–30. [Google Scholar]
- Kim, H.K. Air pollution research and monitoring of wet deposition in Korea. In Proceedings of the CRIEPI International Seminar on Transport and Effects of Acidic Substances, Tokyo, Japan, 28–29 November 1996; pp. 29–38. [Google Scholar]
- Rolph, G.; Stein, A.; Stunder, B. Real-time environmental applications and display system: Ready. Environ. Model. Slftware 2017, 95, 210–228. [Google Scholar] [CrossRef]
- Draxler, R.R.; Rolph, G.D. HYSPLIT (Hybrid Single-Particle Lagrangian Integrated Trajectory) Model Access via NOAA ARL READY Website. 2013. Available online: http://ready.arl.noaa.gov/HYSPLIT_traj.php (accessed on 20 August 2020).
- Draxler, R.R. HYSPLIT_4 User’ Guide, NOAA Technical Memorandum ERL ARL-230, pp. 35. 1999. Available online: http://ready.arl.noaa.gov/documents/reports/hysplit_user_guide.pdf (accessed on 20 August 2020).
- Wang, Y.; Wai, K.M.; Gao, J.; Liu, X.; Wang, T.; Wang, W. The impacts of anthropogenic emissions on the precipitation chemistry at an elevated site in North-eastern China. Atmos. Environ. 2008, 42, 2959–2970. [Google Scholar] [CrossRef]
- Sequeira, R.; Lung, F. Acritical data analysis and interpretation of the pH, ion loadings and electrical conductivity of rainwater from the Territory of Hong Kong. Atmos. Environ. 1995, 29, 2439–2447. [Google Scholar] [CrossRef]
- Krämer, M.; Schüle, M.; Schütz, L. A method to determine rainwater solutes from pH and conductivity measurements. Atmos. Environ. 1996, 30, 3291–3300. [Google Scholar] [CrossRef]
- Peters, K.; Klemm, O. Acid fraction: A simple and useful measure in rain scavenging studies. Atmos. Environ. 1989, 23, 1157–1162. [Google Scholar] [CrossRef]
- Avila, A. Time trends in the precipitation chemistry at a mountain site in northeastern Spain for the period 1983–1994. Atmos. Environ. 1996, 9, 1363–1365. [Google Scholar] [CrossRef]
- Seto, S.; Oohara, M.; Ikeda, Y. Analysis of precipitation chemistry at a rural site in Hiroshima Prefecture, Japan. Atmos. Environ. 2000, 34, 621–628. [Google Scholar] [CrossRef]
- Climate Change Information Center. Report of Global Atmosphere Watch 2016; National Institute of Meteorological Sciences: Jeju, Korea, 2016. [Google Scholar]
- Huang, K.; Zhuang, G.; Xu, C.; Wang, Y.; Tang, A. The chemistry of the severe acidic precipitation in Shanghai, China. Atmos. Res. 2008, 89, 149–160. [Google Scholar] [CrossRef]
- Pu, W.; Quan, W.; Ma, Z.; Shi, X.; Zhao, X.; Zhang, L.; Wang, Z.; Wang, W. Long-term trend of chemical composition of atmospheric precipitation at a regional background station in Northern China. Sci. Total Environ. 2017, 580, 1340–1350. [Google Scholar] [CrossRef] [PubMed]
- Okuda, T.; Iwase, T.; Ueda, H.; Suda, Y.; Tanaka, S.; Dokiya, Y.; Fushimi, K.; Hosoe, M. Long-term trend of chemical constituents in precipitation in Tokyo metropolitan area, Japan, from 1990 to 2002. Sci. Total Environ. 2005, 339, 127–141. [Google Scholar] [CrossRef]
- Tsai, Y.I.; Hsieh, L.Y.; Kuo, S.C.; Chen, C.L.; Wu, P.L. Seasonal and rainfall-type variations in inorganic ions and dicarboxylic acids and acidity of wet deposition samples collected from subtropical East Asia. Atmos. Environ. 2011, 45, 3535–3547. [Google Scholar] [CrossRef]
- Zhang, Y.L.; Lee, X.Q.; Cao, F. Chemical characteristics and source of organic acids in precipitation at a semi-urban site in Southwest China. Atmos. Environ. 2011, 45, 413–419. [Google Scholar] [CrossRef]
- Moschonas, N.; Glavas, S. Weak organic acidity in a wet-only precipitation study at a Mediterranean coastal site, Patras, Greece. Atmos. Res. 2002, 63, 147–157. [Google Scholar] [CrossRef]
- Peña, R.M.; García, S.; Herrero, C.; Losada, M.; Vázquez, A.; Lucas, T. Organic acids and aldehydes in rainwater in a northwest region of Spain. Atmos. Environ. 2002, 36, 5277–5288. [Google Scholar]
- Willey, J.D.; Glinski, D.A.; Southwell, M.; Long, M.S.; Brooks Avery, G.; Kieber, R.J. Decadal variations of rainwater formic and acetic acid concentrations in Wilmington, NC, USA. Atmos. Environ. 2011, 45, 1010–1014. [Google Scholar] [CrossRef]
- Khwaja, H.A. Atmospheric concentrations of carboxylic acids and related compounds at a semiurban site. Atmos. Environ. 1995, 29, 127–139. [Google Scholar] [CrossRef]
- Kieber, R.J.; Prake, B.; Willey, J.D.; Avery, G.B. Dissolved organic carbon and organic acids in coastal New Zealand rainwater. Atmos. Environ. 2002, 36, 3557–3563. [Google Scholar] [CrossRef]
- Kim, J.Y.; Chun, Y.S.; Cho, H.M.; Choi, J.C.; Nam, J.C.; Kim, S. Neutralization of Precipitation by Alkaline Ions in Urban and Rural Area. Asia-Pac. J. Atmos. Sci. 2000, 36, 15–24. [Google Scholar]
- Xiao, J. Chemical composition and source identification of rainwater constituents at an urban site in Xi’an. Environ. Earth Sci. 2016, 75, 209. [Google Scholar] [CrossRef]
- Wu, Q.; Han, G. Chemical composition of rainwater and anthropogenic influences in Chengdu, Southwest China. Atmos. Res. 2011, 99, 190–196. [Google Scholar]
Publisher’s Note: MDPI stays neutral with regard to jurisdictional claims in published maps and institutional affiliations. |
© 2020 by the authors. Licensee MDPI, Basel, Switzerland. This article is an open access article distributed under the terms and conditions of the Creative Commons Attribution (CC BY) license (http://creativecommons.org/licenses/by/4.0/).