Article

Comparison of the Causes of High-Frequency Heavy and Light Snowfall on Interannual Timescales over Northeast China

1
Nansen-Zhu International Research Centre, Institute of Atmospheric Physics, Chinese Academy of Sciences, Beijing 100029, China
2
University of the Chinese Academy of Sciences, Beijing 100049, China
3
Collaborative Innovation Center on Forecast and Evaluation of Meteorological Disasters, Nanjing University of Information Science & Technology, Nanjing 210044, China
4
Climate Change Research Center, Chinese Academy of Sciences, Beijing 100029, China
*
Author to whom correspondence should be addressed.
Atmosphere 2020, 11(9), 936; https://doi.org/10.3390/atmos11090936
Submission received: 31 July 2020 / Revised: 25 August 2020 / Accepted: 31 August 2020 / Published: 2 September 2020
(This article belongs to the Section Meteorology)

Abstract

:
This study investigates and compares the reasons for high-frequency heavy and light snowfall in winter on interannual timescales over northeast China (NEC) during 1961–2017. Results indicate that the frequency and its variability are strong over southeastern NEC for heavy snowfall but over northern NEC for light snowfall. Analysis of the annual cycle shows that the maximum frequency of heavy snowfall occurs in November and March due to more warm–wet air masses and increased atmospheric instability, and that of light snowfall occurs in December–January due to drier conditions and increased atmospheric stability. The frequency of heavy snowfall exhibits an increasing trend which partly results from the warming trend in NEC, while that of light snowfall shows a decreasing trend. High-frequency heavy snowfall is associated with a positive North Atlantic Oscillation (NAO), warmer regional air temperatures, an increased water vapor budget associated with an anomalous anticyclone occupying the Kuril Islands, and relatively unstable atmospheric layers. High-frequency light snowfall is associated with a strengthened East Asian winter monsoon, colder regional air temperatures, a decreased water vapor budget, and relatively stable atmospheric layers. High-frequency heavy and light snowfall are both related to eastward-propagating quasi-stationary waves over Eurasia, but with different features. The waves of the former are located in midlatitude Eurasia and related to the positive phase of the NAO. The waves of the latter exhibit two pathways, located in midlatitude and northern Eurasia, respectively. The northern one can be partially attributed to a weak polar vortex. In addition, higher sea surface temperatures of the Kuroshio Extension may contribute to high-frequency heavy snowfall.

1. Introduction

Snowfall is a major weather phenomenon in wintertime over northeast China (NEC). Snowfall greatly impacts the growth of grain seedlings, which ultimately determines the annual grain production in NEC. Abnormal snowfall can also cause severe damage to the sustainability of society and considerable economic losses. For example, 41,000 people were affected by extreme snowfall events that happened in April 2020 in NEC: the crop area affected was 4000 ha, of which nearly 300 ha were harvested; and the direct economic losses totaled 210 million yuan [1]. Snowfall prediction in NEC is ineffective but urgently needed for disaster prevention and mitigation. Hence, it is necessary to understand the variability and associated mechanisms of snowfall in NEC, which would provide a theoretical basis for improving the prediction skill.
There are a great number of works on the variations of different types of snowfall in NEC and the associated physical processes. Due to the limited availability of in situ observations in the early decades, snowfall research mainly focused on case studies [2,3,4,5,6,7]. However, as the spatial and temporal coverage of observations has increased in recent decades, many studies have investigated the long-term trends and interannual and decadal variations of different types of snowfall over NEC [8,9,10,11,12,13,14,15]. The percentage of snowstorm events to total snow events has the lowest value, followed by heavy snow events, and then the highest percentage is seen for light snow events, in the north of NEC [11]. The highest frequency of heavy snowfall in winter in northern China is mainly located in NEC [16]. The amount of snowfall over NEC was lower from the mid-1960s to mid-1970s, and higher after 2000 [17]. Zhou et al. revealed an increase in the frequency of heavy snowfall events, while light snowfall events in NEC decreased during 1961–2014 [14]. Furthermore, there has been other research associated with reconstruction of snowfall events in China and other regions of globe, which enhance our understanding of snowfall variability [18,19,20,21].
Recently, increasing attention has been given to addressing the physical mechanisms underlying the characteristics of snowfall over NEC. Sun and Wang suggested that the water vapor transport (WVT) from eastern China and the Sea of Japan are the origins of the water vapor for widespread snowfall in NEC [22]. Some studies have focused on interannual timescales. Snowstorm events in NEC can be affected by the Arctic Oscillation (AO), Antarctic Oscillation, Eurasian teleconnection pattern, and North Pacific Oscillation, which can stimulate the strong anomalous southerlies along the eastern coastal regions of China, thus raising the moisture content and air temperature there and providing appropriate warm and wet conditions [6]. Wang [23] revealed that, compared with light snowfall events, the atmospheric circulation anomalies at mid-high latitudes that are associated with more heavy snowfall events in northern China are similar but with larger meridional variation, and intense snowfall has a closer relationship with the North Atlantic Oscillation (NAO) and AO, although the mechanistic links remain unexplored. The reduction in autumn Arctic sea ice is linked to much broader meridional variations of atmospheric circulation in midlatitudes, resulting in increased cold surges, as well as accompanying meltwater discharge from the Arctic region over large parts of northern continents, supporting increased heavy snowfall in midlatitudes [24]. Autumn warming over the midlatitudes of the North Pacific Ocean can change the winter atmospheric conditions by evoking positive air pressure anomalies and an anomalous anticyclonic circulation over large parts of East Asia and the North Pacific, which can induce anomalous southeasterly winds over NEC, weaken the northerly winds, then warm the surface, increase the water vapor content, and intensify snowfall events [25].
Other studies have been concerned with interdecadal timescales. The weakening of the East Asian winter monsoon (EAWM) leads to increased air temperatures over NEC, concurrent with more local water vapor, as well as increasing sea surface temperatures along the coast associated with more water vapor transported into NEC, which is favorable for increasing snowfall [26]. The strengthening of winter Hadley circulation leads to an interdecadal increase of snowfall in NEC, which benefits the enhancement of convection in southeast Asia and triggers a circum-Pacific-like teleconnection pattern, and then influences mid- to high-latitude atmospheric circulations over the Asia-Pacific sector, consequently increasing snowfall intensity over northeastern China after the 1980s [27]. The warming sea surface temperature (SST) anomalies in the tropical Indian Ocean stimulate the Eurasian wave pattern via inducing significant anomalous upper-level convergence over northern Europe, contributing to enhanced winter precipitation in NEC [28]. The North Atlantic tripolar SST anomaly triggers a stationary Rossby wave that originates from the North Atlantic, then the waves propagate eastward to northeast Asia, favoring a positive winter precipitation anomaly in NEC [28].
Since the climate system is complex, the causes of heavy and light snowfall remain an open issue. Here, we provide a new perspective on the comparison between these two kinds of snowfall in NEC. After excluding their same years, we examine which large-scale atmospheric circulation patterns are favorable for high-frequency heavy and light snowfall, whether or not the associated physical mechanisms are similar, and what the cause of any differences might be.
Section 2 presents the data and analytical methods used in this study. Section 3 compares the frequency of heavy and light snowfall in terms of climatic features (Section 3.1), large-scale atmospheric circulation and WVT (Section 3.2), and the physical mechanisms (Section 3.3). The final section summarizes our research and discusses some remaining issues.

2. Data and Methods

The daily observational data for precipitation and temperature were derived from the China Meteorological Administration for over 840 stations in China. Due to a lack of data for most observation stations before 1960, this study focuses on the period from 1961 to 2017. The station data are quality controlled. In this study, any missing records were treated as follows: the wintertime (October to April) in a certain year with data with 20% or more missing days were omitted, and the stations with consecutive winters shorter than 30 years were removed. The stations with missing records for more than 3 days in a certain month were also excluded. Finally, a subset of 479 stations was selected. Among the 479 stations in China, 82 stations north of 40° N and east of 120° E were selected as the data sources for NEC. Based on previous research [9], a heavy snowfall (light snowfall) event for a station is defined based on three criteria:
  • The station’s daily snowfall is ≥5 mm (>0 mm, but ≤2.5 mm);
  • The station’s daily surface air temperature is <0 °C;
  • The station’s ground temperature is also <0 °C.
These criteria all based on daily mean parameters. Hereafter, we use the acronym ‘HSE’ to represent ‘heavy snowfall event’ and ‘LSE’ for ‘light snowfall event’.
The reanalysis data used in this study are monthly data derived from the National Centers for Environmental Prediction, which have a resolution of 2.5° × 2.5° [29]. The monthly mean SST data used in this study are derived from the Hadley Centre Global Sea Ice and SST, with a global resolution of 0.5° × 0.5° [30]. In this study, all the datasets are averaged over wintertime to represent means for 1961–2017. The vertically integrated WVT was computed based on the method developed by Sun et al. [31], using zonal and meridional winds and specific humidity for eight levels (1000, 925, 850, 700, 600, 500, 400, and 300 hPa). The wave activity flux was computed based on the method developed by Takaya and Nakamura [32]. Regression analysis, composite analysis, and correlation analysis are the main methods employed, and the Student’s t-test is used for testing statistical significance. The data have all been subjected to 9-year high-pass filtering in Section 3.2 and Section 3.3. Due to the edge effect of the filter, we used 1965–2013 as study period.
The K-index is a robust indicator of the stability of atmospheric layers. It is a measure of the thunderstorm potential based on vertical temperature lapse rate, moisture content of the lower atmosphere, and the vertical extent of the moist layer [33]:
K = T850 − T500 + Td500 + (T − Td)700
where T850 and T500 are the temperatures at 850 hPa and 500 hPa, respectively; Td500 is the 500-hPa dew point; and T and Td are temperature and dewpoint temperature, respectively.

3. Results

3.1. Climatic Features

We first compared the spatiotemporal features of snowfall frequency. Figure 1 shows the spatial features of HSE and LSE and their linear trends in NEC during wintertime for 1961–2017. It shows that the multi-year mean HSE is primarily distributed in the east and south of NEC (Figure 1a), while the LSE occurs more frequently over the northern part of NEC (Figure 1d). The distributions of the standard deviation of HSE and LSE are similar to their mean values, where large values of HSE standard deviation are located mainly over eastern and southern NEC (Figure 1b) and large values of LSE standard deviation are located mainly over northern NEC (Figure 1e), implying that these places have large variability. For HSE, there are increasing trends in most parts of the NEC with some stations passing the 90% confidence level (Figure 1c). On the contrary, for LSE, there are significant decreasing trends in the north and east of NEC during 1961–2017 (Figure 1f). Previous research states that the warming air temperature are associated with the strengthening intensity of near-surface water transportation for snowfall [34]. Zhou et al. also document that relatively higher specific humidity generally corresponds to an enhancement of snowfall intensity [14]. The warming in northeast China may lead to an increase trend in atmospheric moisture in north part of NEC and hence increased atmospheric layer instability, favoring the higher frequency of heavy snowfall (figure not shown).
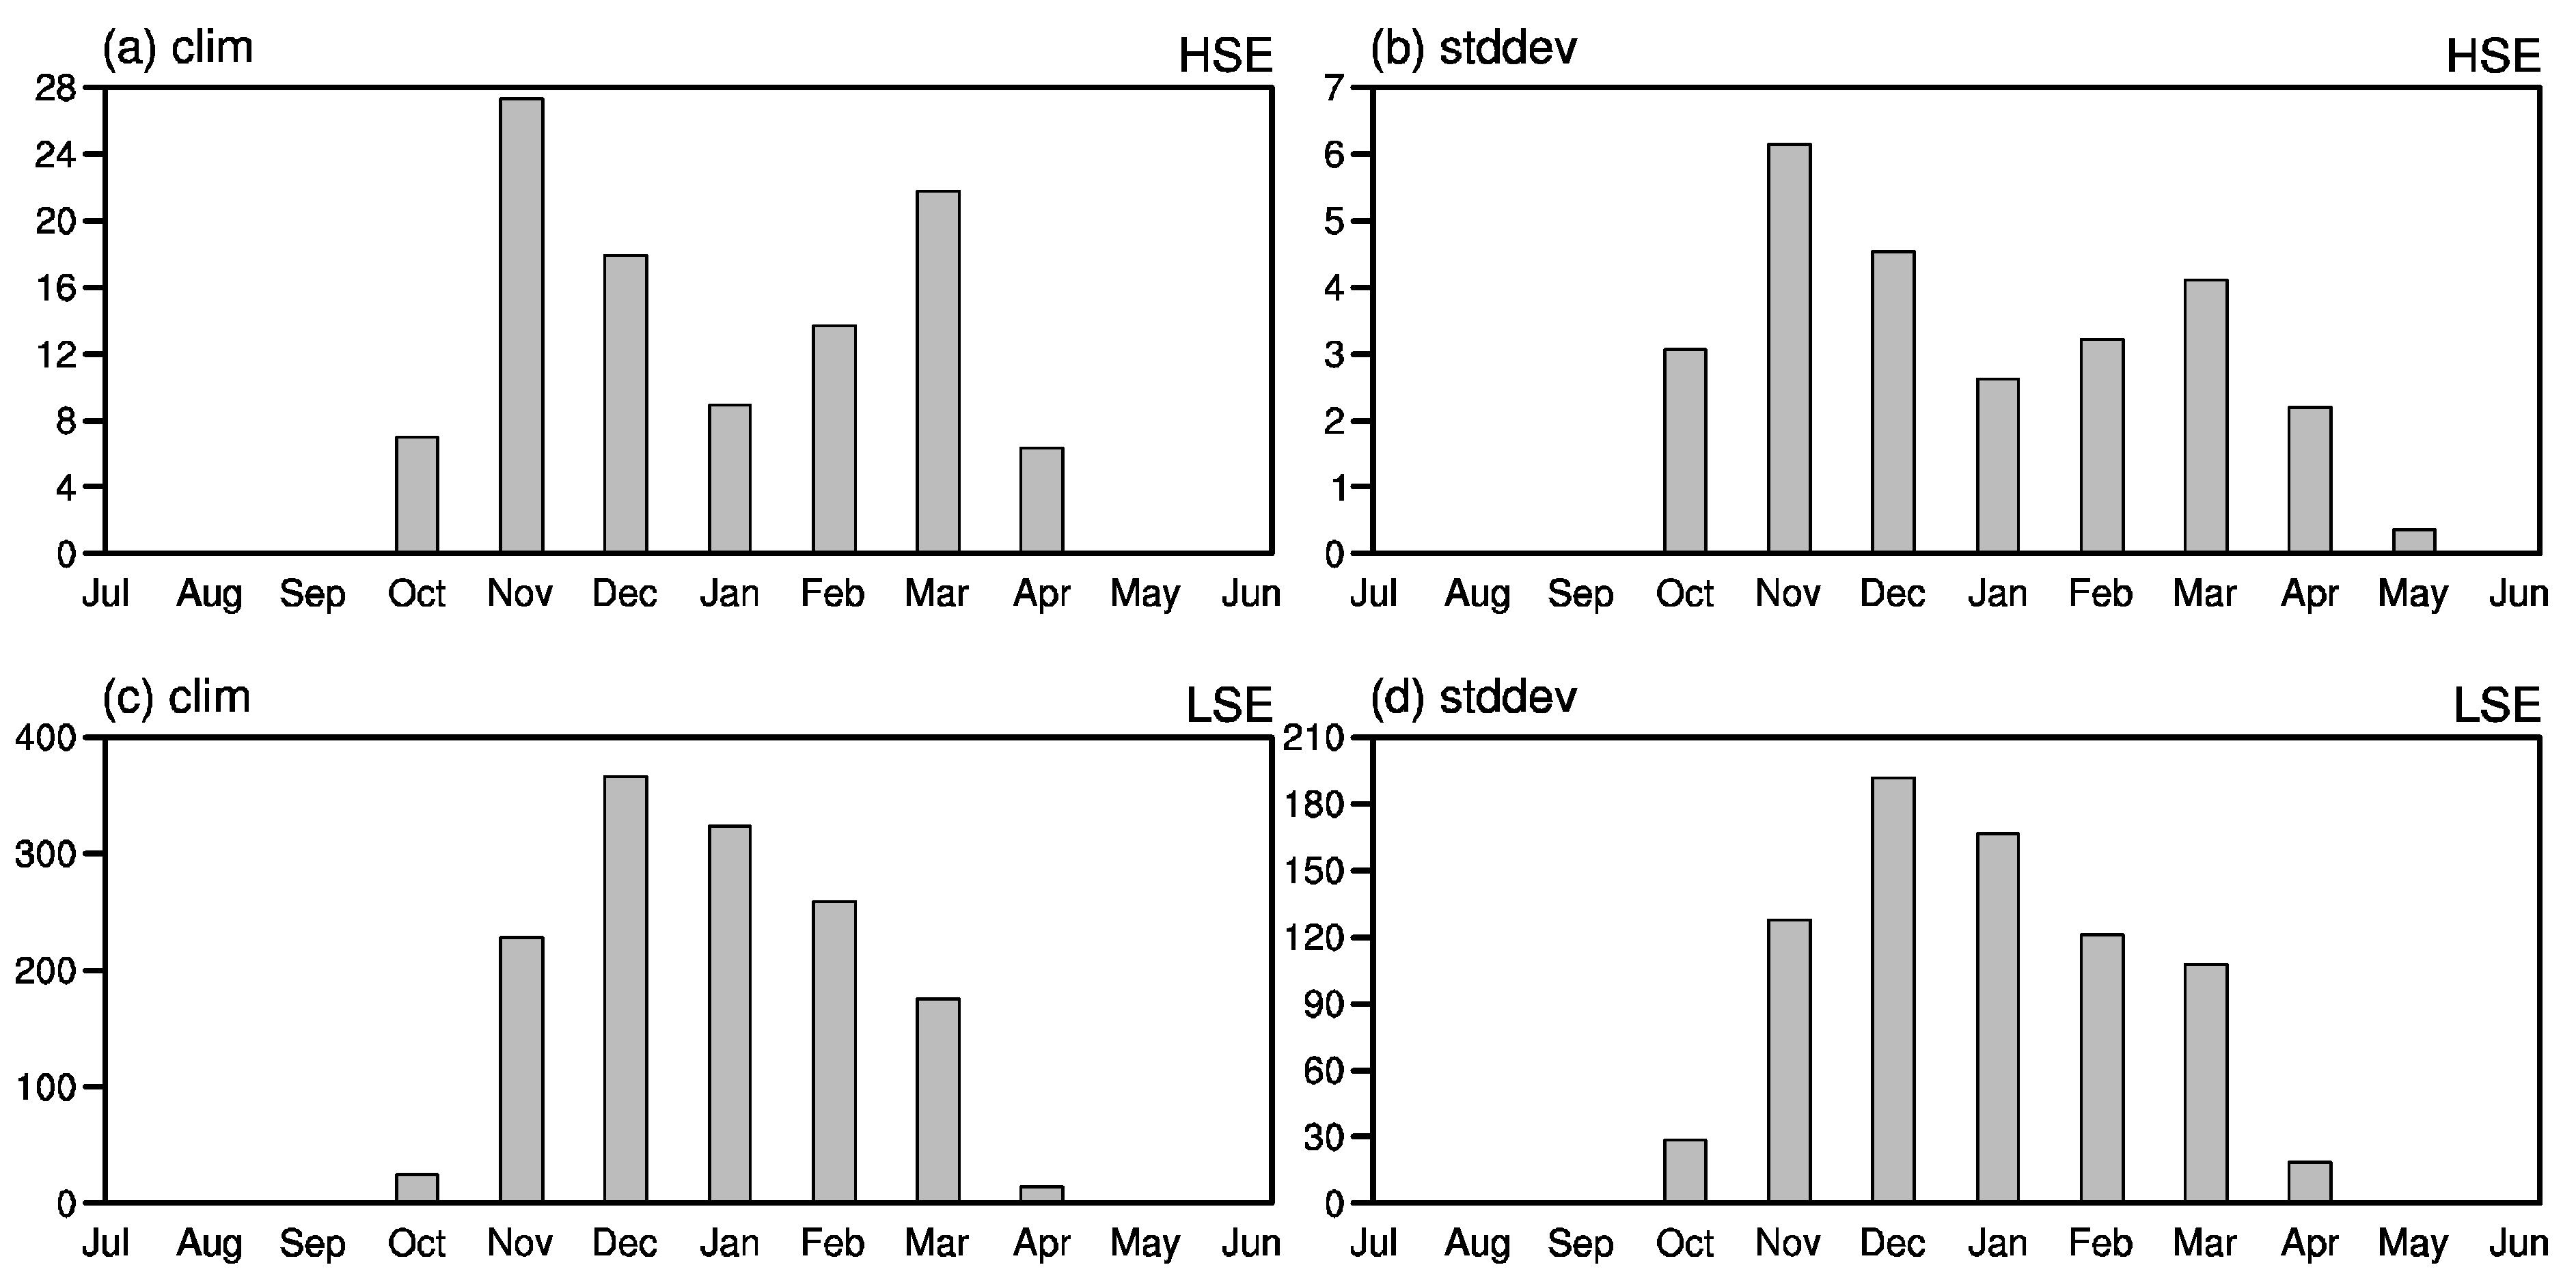
Based on the annual cycles (Figure 2), we find that HSE and LSE primarily occur from October to April. Hence, our analysis defines wintertime as October to April. The annual cycles of the climatology and the standard deviation are displayed in Figure 2. It is clear that HSEs exhibit bimodal distributions with a peak in November and March (Figure 2a). However, LSEs exhibit unimodal distributions with a single peak in December–January (Figure 1c). According to previous work, snowfall in NEC usually occurs during winter and early spring, from mid-October to late March, and strong snowfall rarely occurs in mid-spring [7], but the reason for these observations was not discussed.
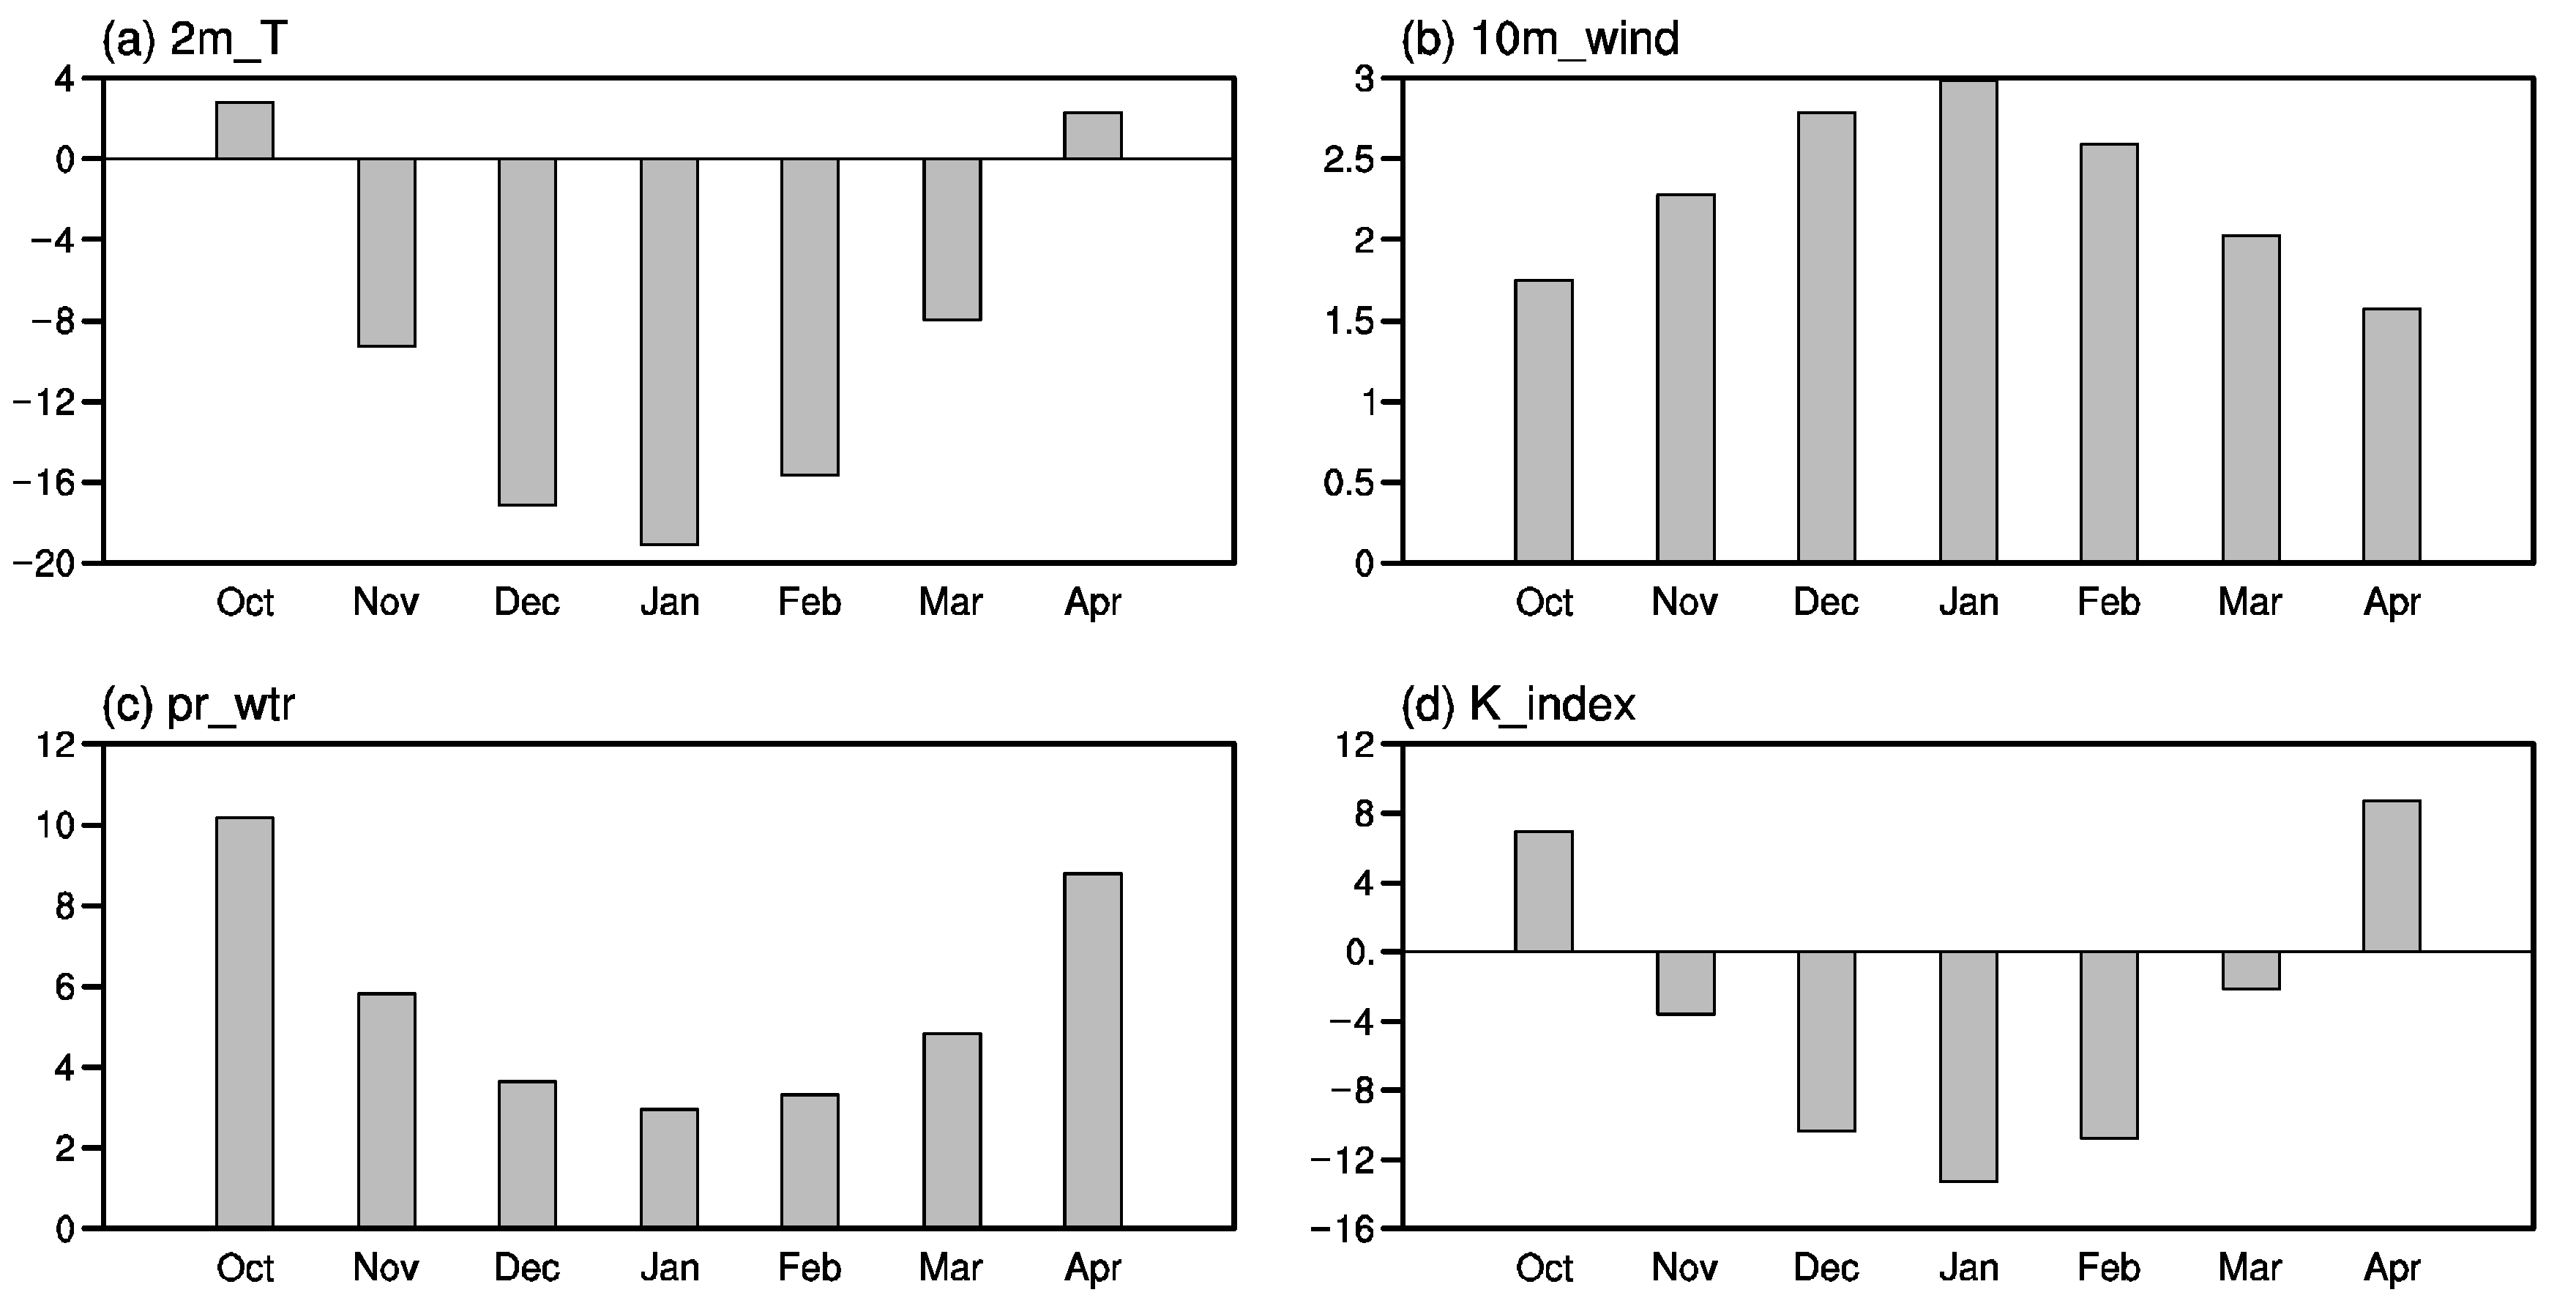
Snowfall usually occurs when cold–dry and warm–moist air masses meet. There are usually enough cold–dry air masses in NEC in wintertime because of its high latitude. The East Asian winter monsoon (EAWM) develops and retreats in November and March, respectively. Figure 3b demonstrates that the northwesterly winds are relatively weak in NEC in November and March, which helps warm–moist air masses to move northwards to provide water vapor to NEC. In addition, the higher surface temperature indicates more water vapor according to the Clapeyron–Clausius equation. Compared with December–January, the value of the K-index is larger in November and March, meaning convection is strong in these months. This warm–moist and convective weather condition in wintertime favors more HSEs.
Next, we address why LSEs are more frequent in midwinter. We calculated the regional mean climatology of the surface temperature, low-level wind, precipitable water, and K-index. It is clear that the coldest months occur in December–January (Figure 3a). Since the EAWM reaches its peak in December–January, the strongest northwesterly winds appear (Figure 3b), which prevent the warm–moist air masses from entering NEC. Additionally, the simultaneous lowest temperatures cause local water vapor to be relatively insufficient (Figure 3c). Finally, as expressed with a lower K-index in December–January (Figure 3d), convection is relatively weak. These weather conditions collectively imply that the drier, colder, and relatively static atmosphere in midwinter is unfavorable for HSE.

3.2. Large-Scale Atmospheric Circulation Patterns and WVT

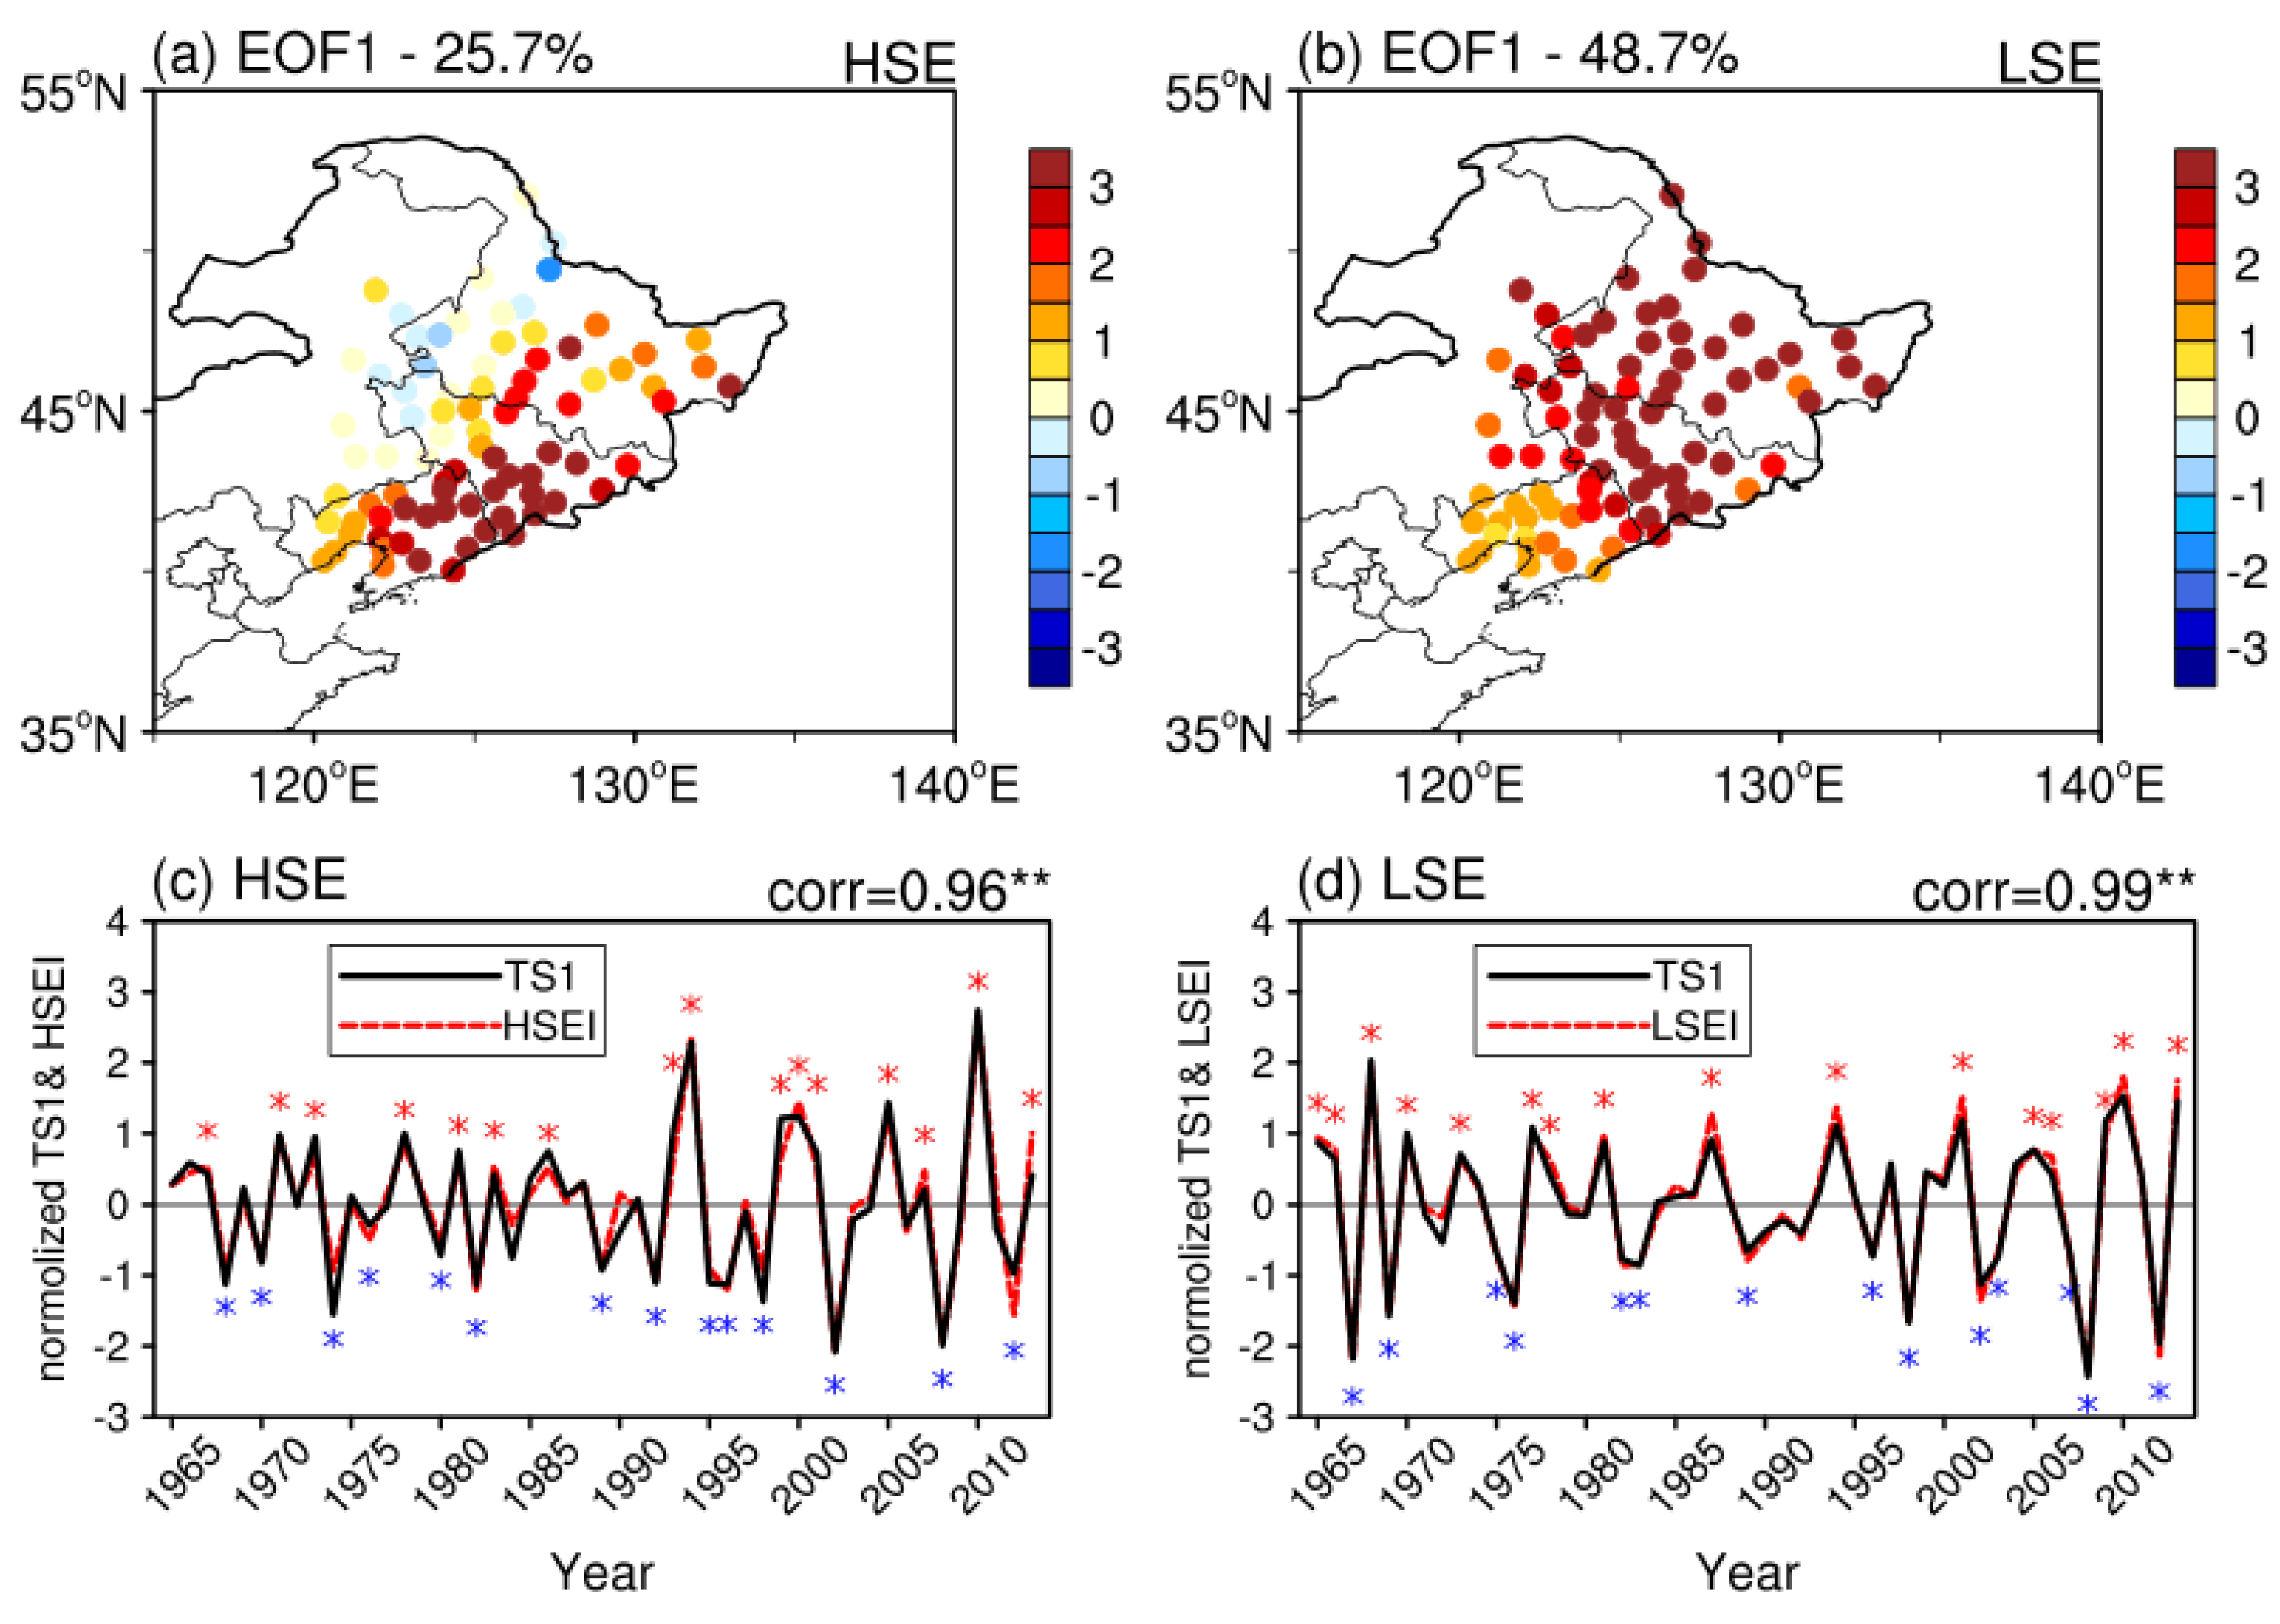
We used empirical orthogonal function (EOF) analysis [35] to extract the leading modes in these two kinds of snowfall. As we mainly compare the causes for high-frequency light and heavy snowfall in NEC on the interannual timescale in the following, the data have all been subjected to 9-year high-pass filtering. Figure 4a (Figure 4b) shows the leading EOF of HSE (LSE), explaining 28% (49%) of the total variance. According to North et al. [36], EOF1 is independent of other EOF modes. The spatial mode of EOF1 is a full-field uniform mode. We then calculated the regional average HSE (LSE) index in NEC, with a significant correlation of 0.96 (0.99) in time series of EOF1. The correlation coefficient between HSE index and LSE index is 0.59, above the 99% confidence level. Hence, HSE and LES are related but different on the interannual time scale. Next, we used 0.5 times the HSE (LSE) index as an anomaly index. When the standardized snowfall index in a year is >0.5 times standard deviations, the current year is considered as an anomalously high-frequency year. Accordingly, after removing the common years, eight anomalous positive HSE years and eight positive LSE years were identified.
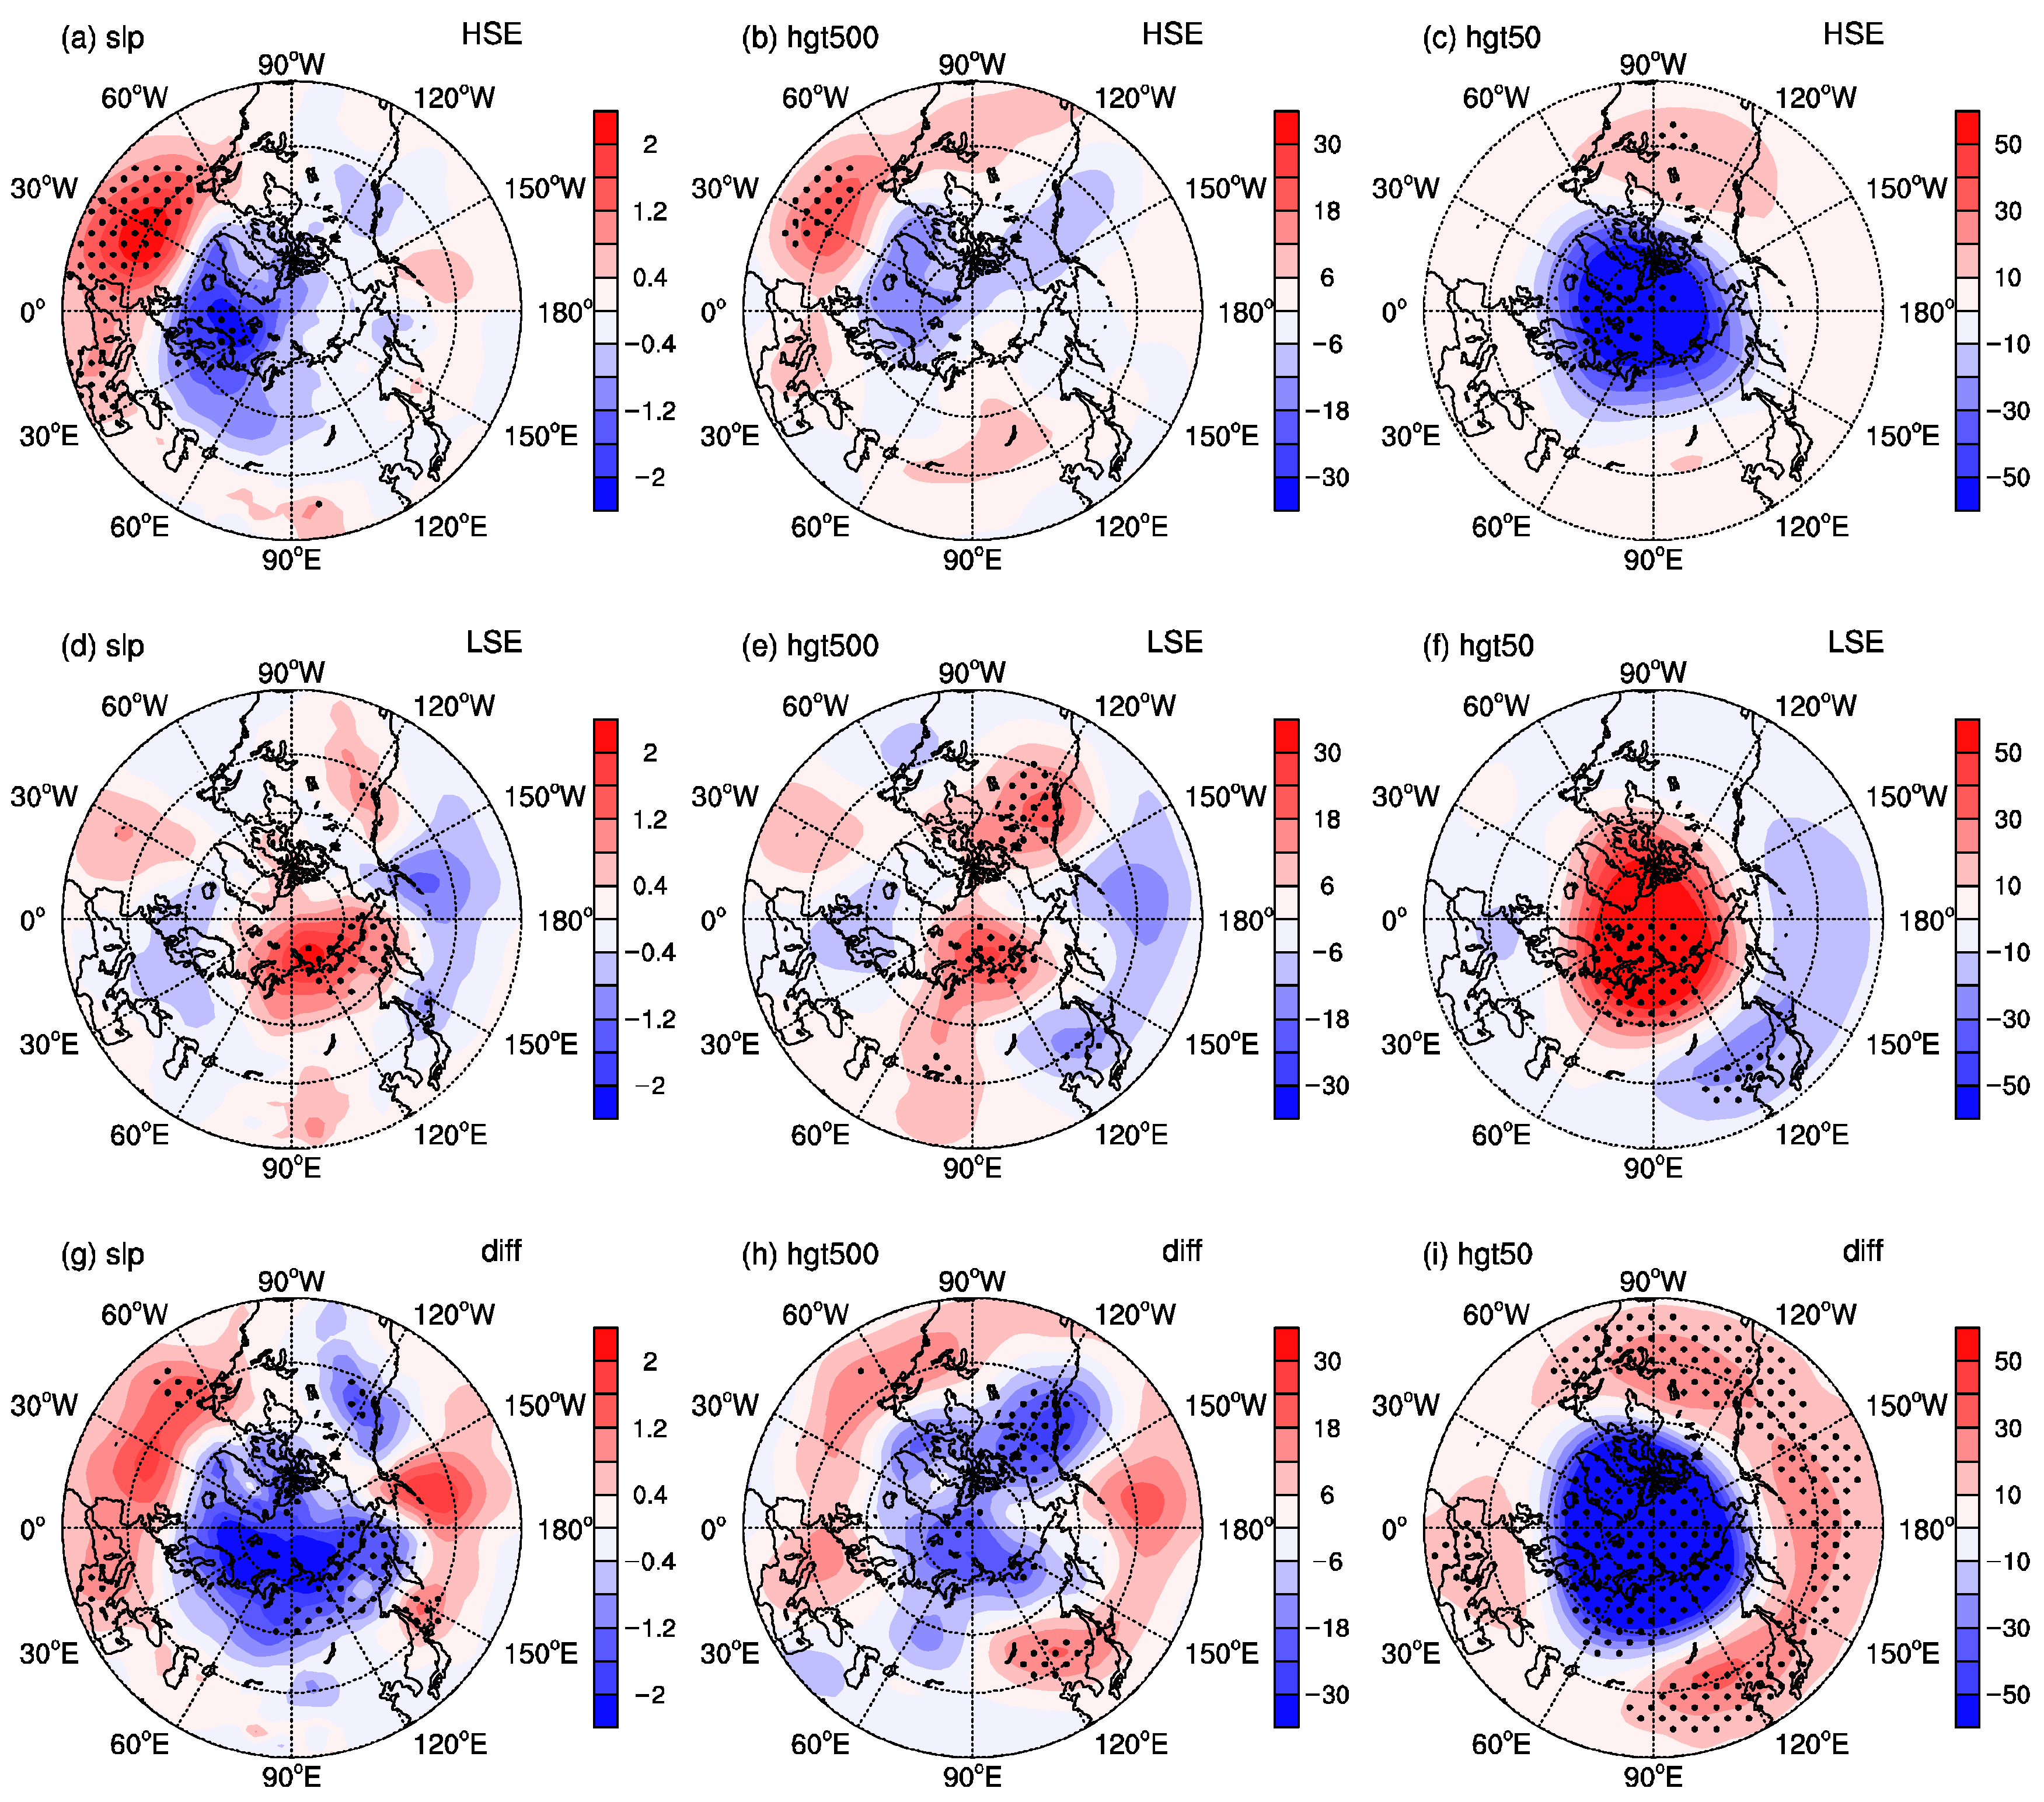
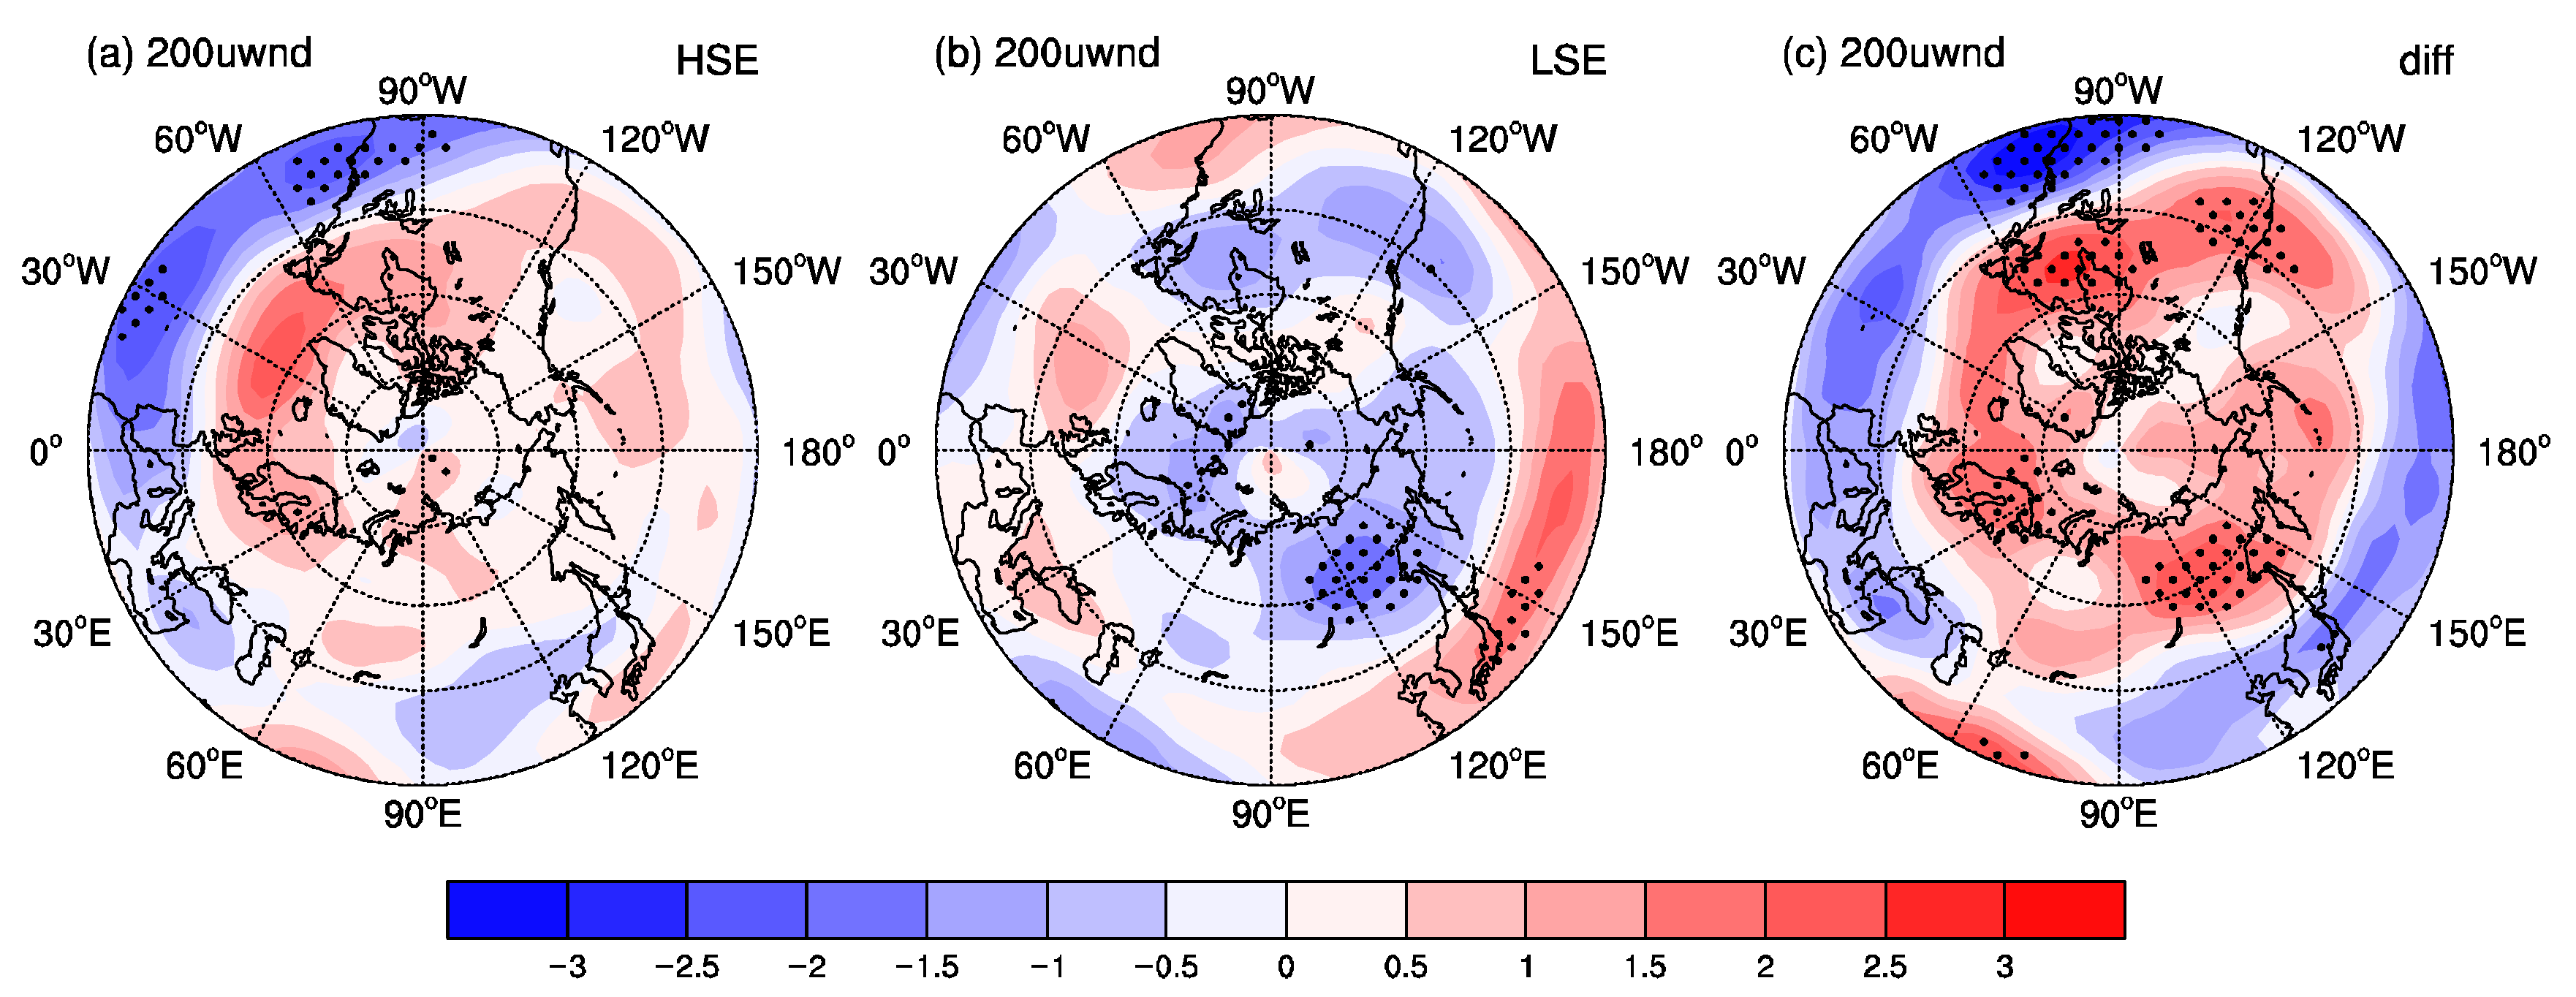
To understand the cause of similarities and differences between the two kinds of snowfall, the large-scale atmospheric circulation patterns during the processes of the two events are examined in this section. The high-frequency heavy snowfall is associated with negative sea level pressure (SLP) anomalies over high-latitude regions and positive SLP anomalies over midlatitude regions (Figure 5a)—a pattern that resembles the positive phase of the NAO. However, there is a contrary pattern in the composite of more LSE years, showing significant positive SLP anomalies over high latitudes in the Eurasian continent and negative SLP anomalies over Japan to the Aleutian Islands (Figure 5d). An equivalent barotropic structure both for more HSE years and more LSE years can be seen at the geopotential height of 500 hPa over the Northern Hemisphere (Figure 5b,c). Compared with the composite of more LSE years, a positive AO anomaly is noticeable, concurrent with a weak East Asian trough during the composite of more HSE years (Figure 5g). As revealed by previous research, a positive AO corresponds to a weak EAWM and widespread high temperatures in China [37]. In addition, there are significantly negative anomalies at the 50 hPa geopotential height in the composite of more HSE years over the Arctic, exhibiting a strengthened polar vortex (Figure 5c). This strengthened polar vortex is accompanied by stronger westerly winds (Figure 6d and Figure 7a) that can prevent cold air advection over continental Eurasia. When there are significant positive anomalies at the 50 hPa geopotential height in the composite of more LSE years (Figure 5f), it implies a weakened polar vortex. A weak polar vortex corresponds to a decrease in westerly winds (Figure 6h and Figure 7b), which is favorable for cold air masses invading NEC. Compared with the composite of more LSE years, under the composite of more HSE years, the upper-tropospheric zonal winds anomalies are characterized by strengthened westerly winds in high latitudes (Figure 7c), which can decrease the northerly winds. Thus, HSEs are associated with weakened cold air advection, whereas LSEs are related to strengthened cold air advection.
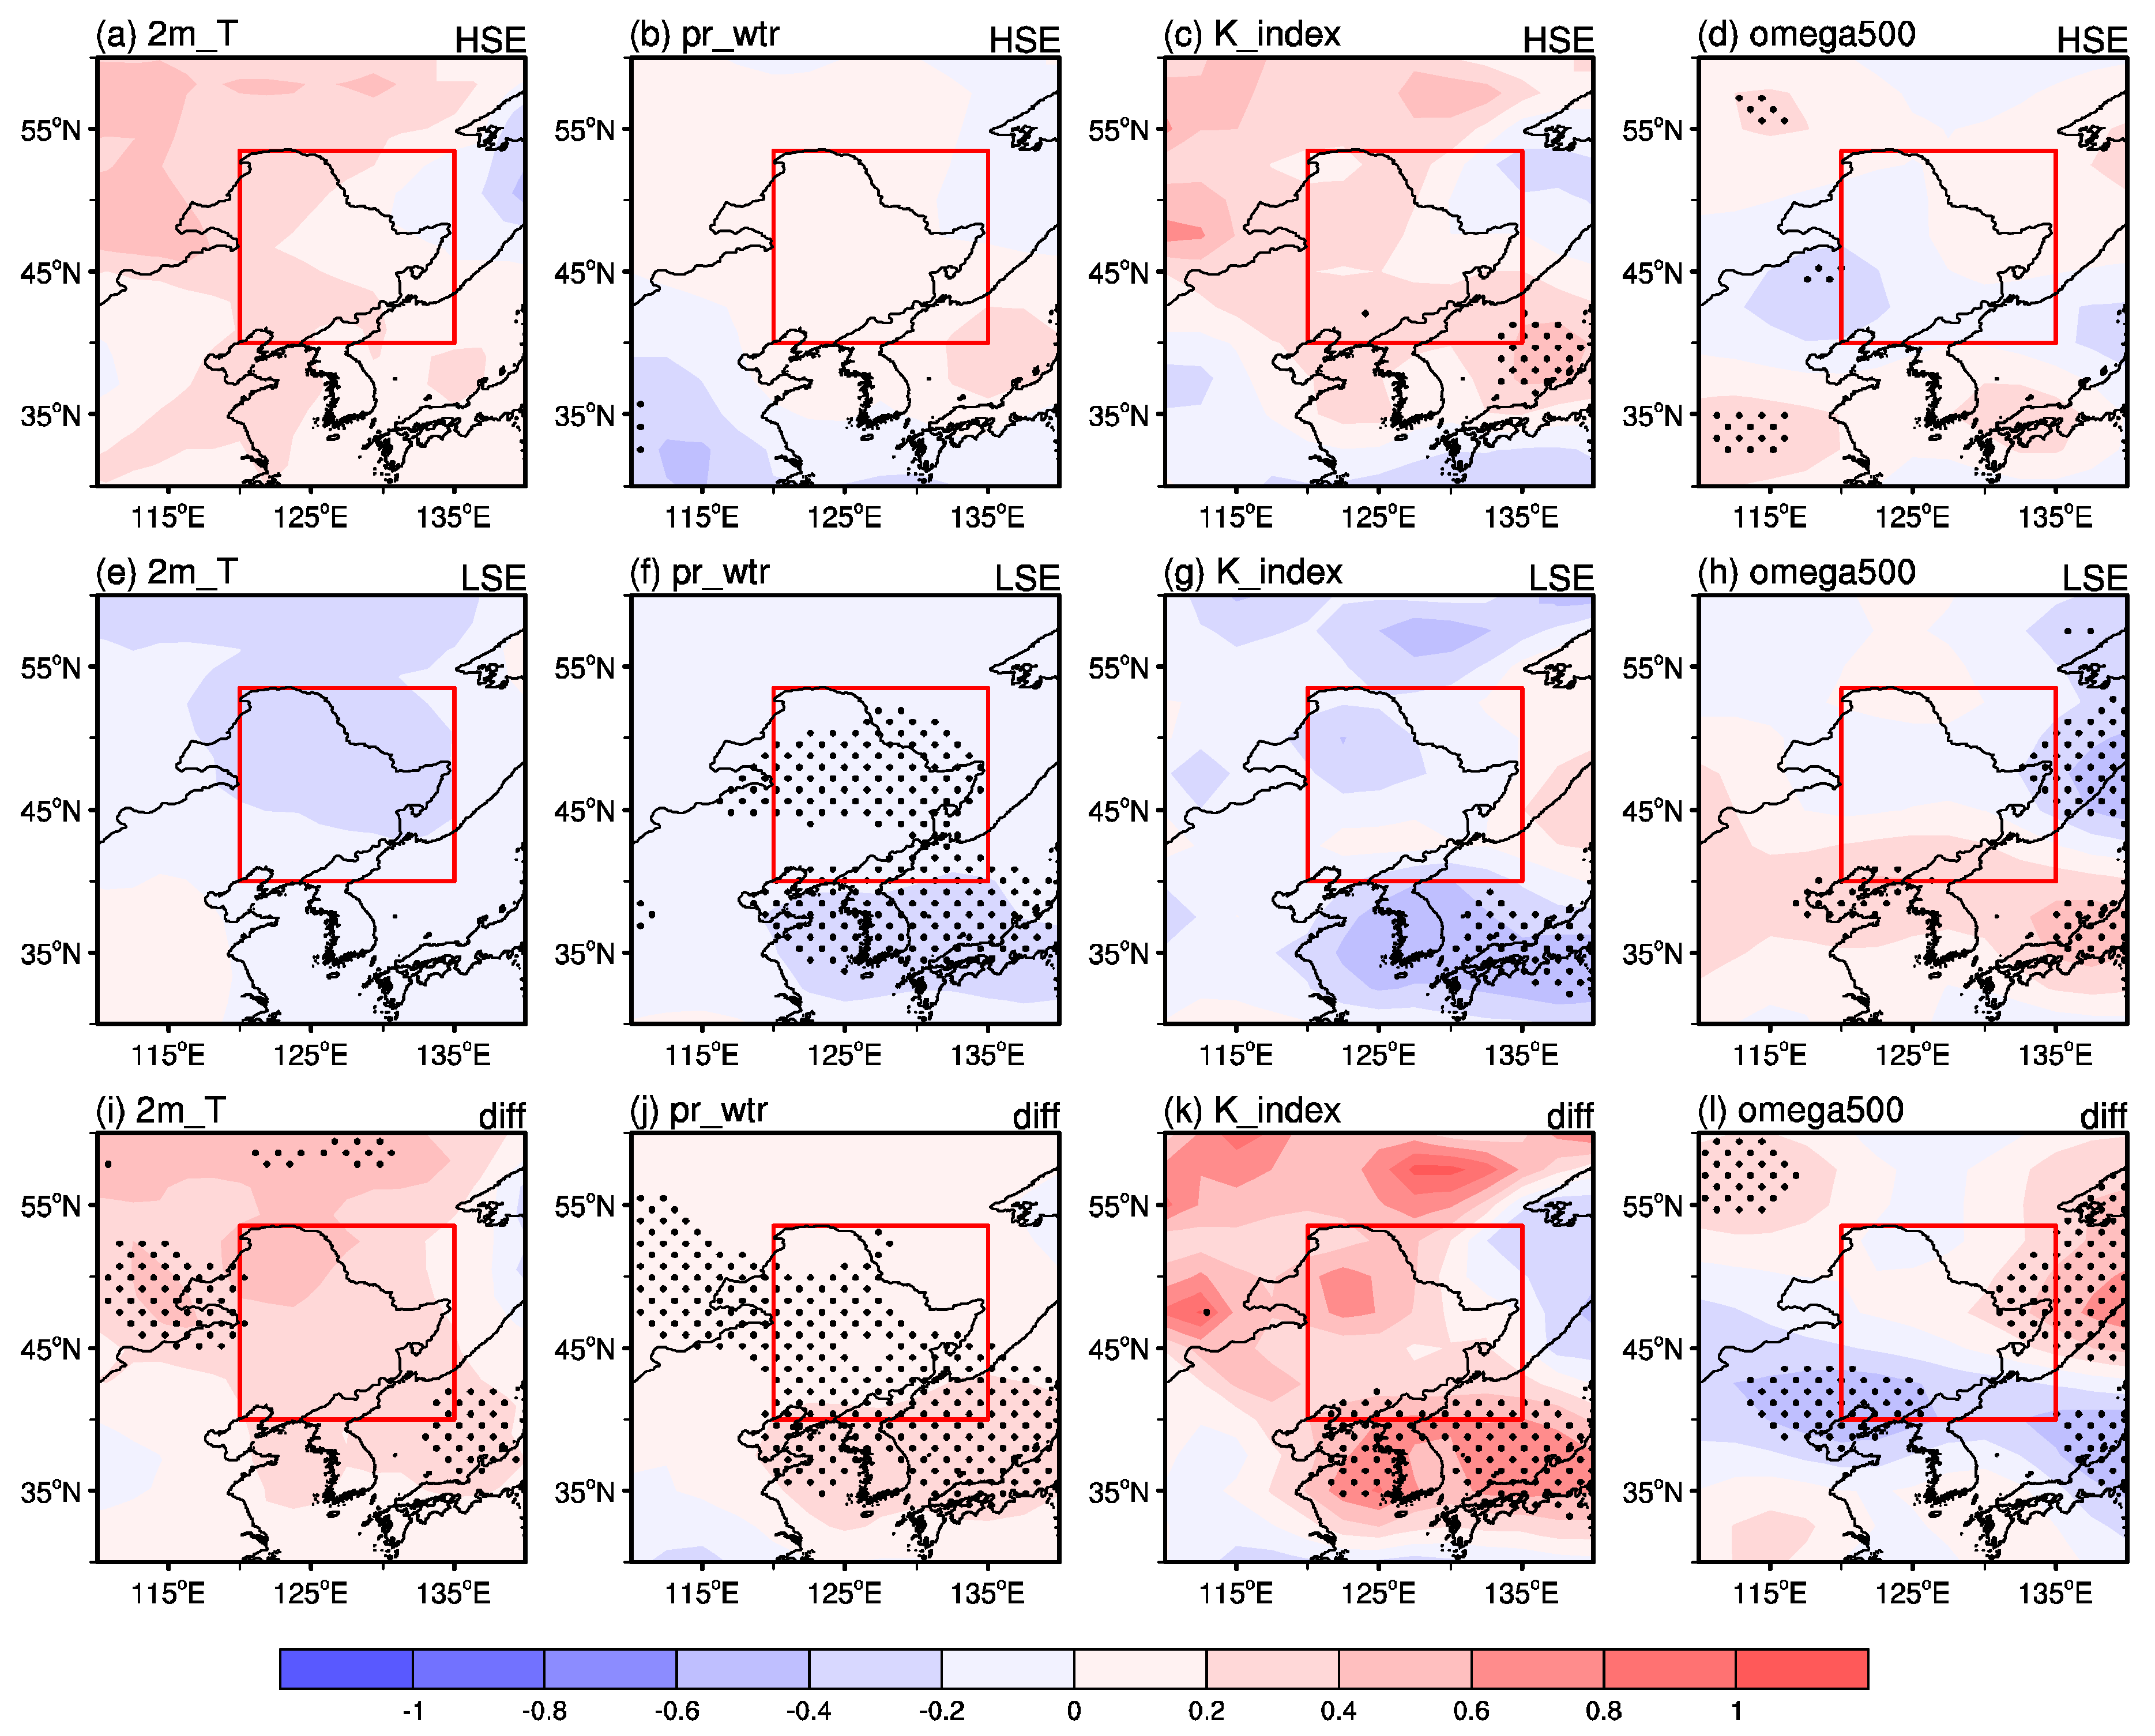
To summarize, HSEs are accompanied by positive NAO and a strengthening of the polar vortex and the accompanying prevalent westerly anomaly over the high latitudes of the Eurasian continent, which collectively prevent cold air masses from invading NEC. As a result, surface air temperature over NEC is warmed (Figure 8a), thereby promoting HSE. Such a warming in surface air temperature benefits local evaporation and then provides more moisture for precipitation (Figure 8b). Meanwhile, LSEs are accompanied by a weakening of the polar vortex, strengthening of the EAWM, and a deepening of the East Asian trough, which collectively promote cold air masses invading NEC. As a result, surface air temperature over NEC is cooled (Figure 8e), and the moisture content decreases (Figure 8f), thereby creating conditions amenable to LSEs.
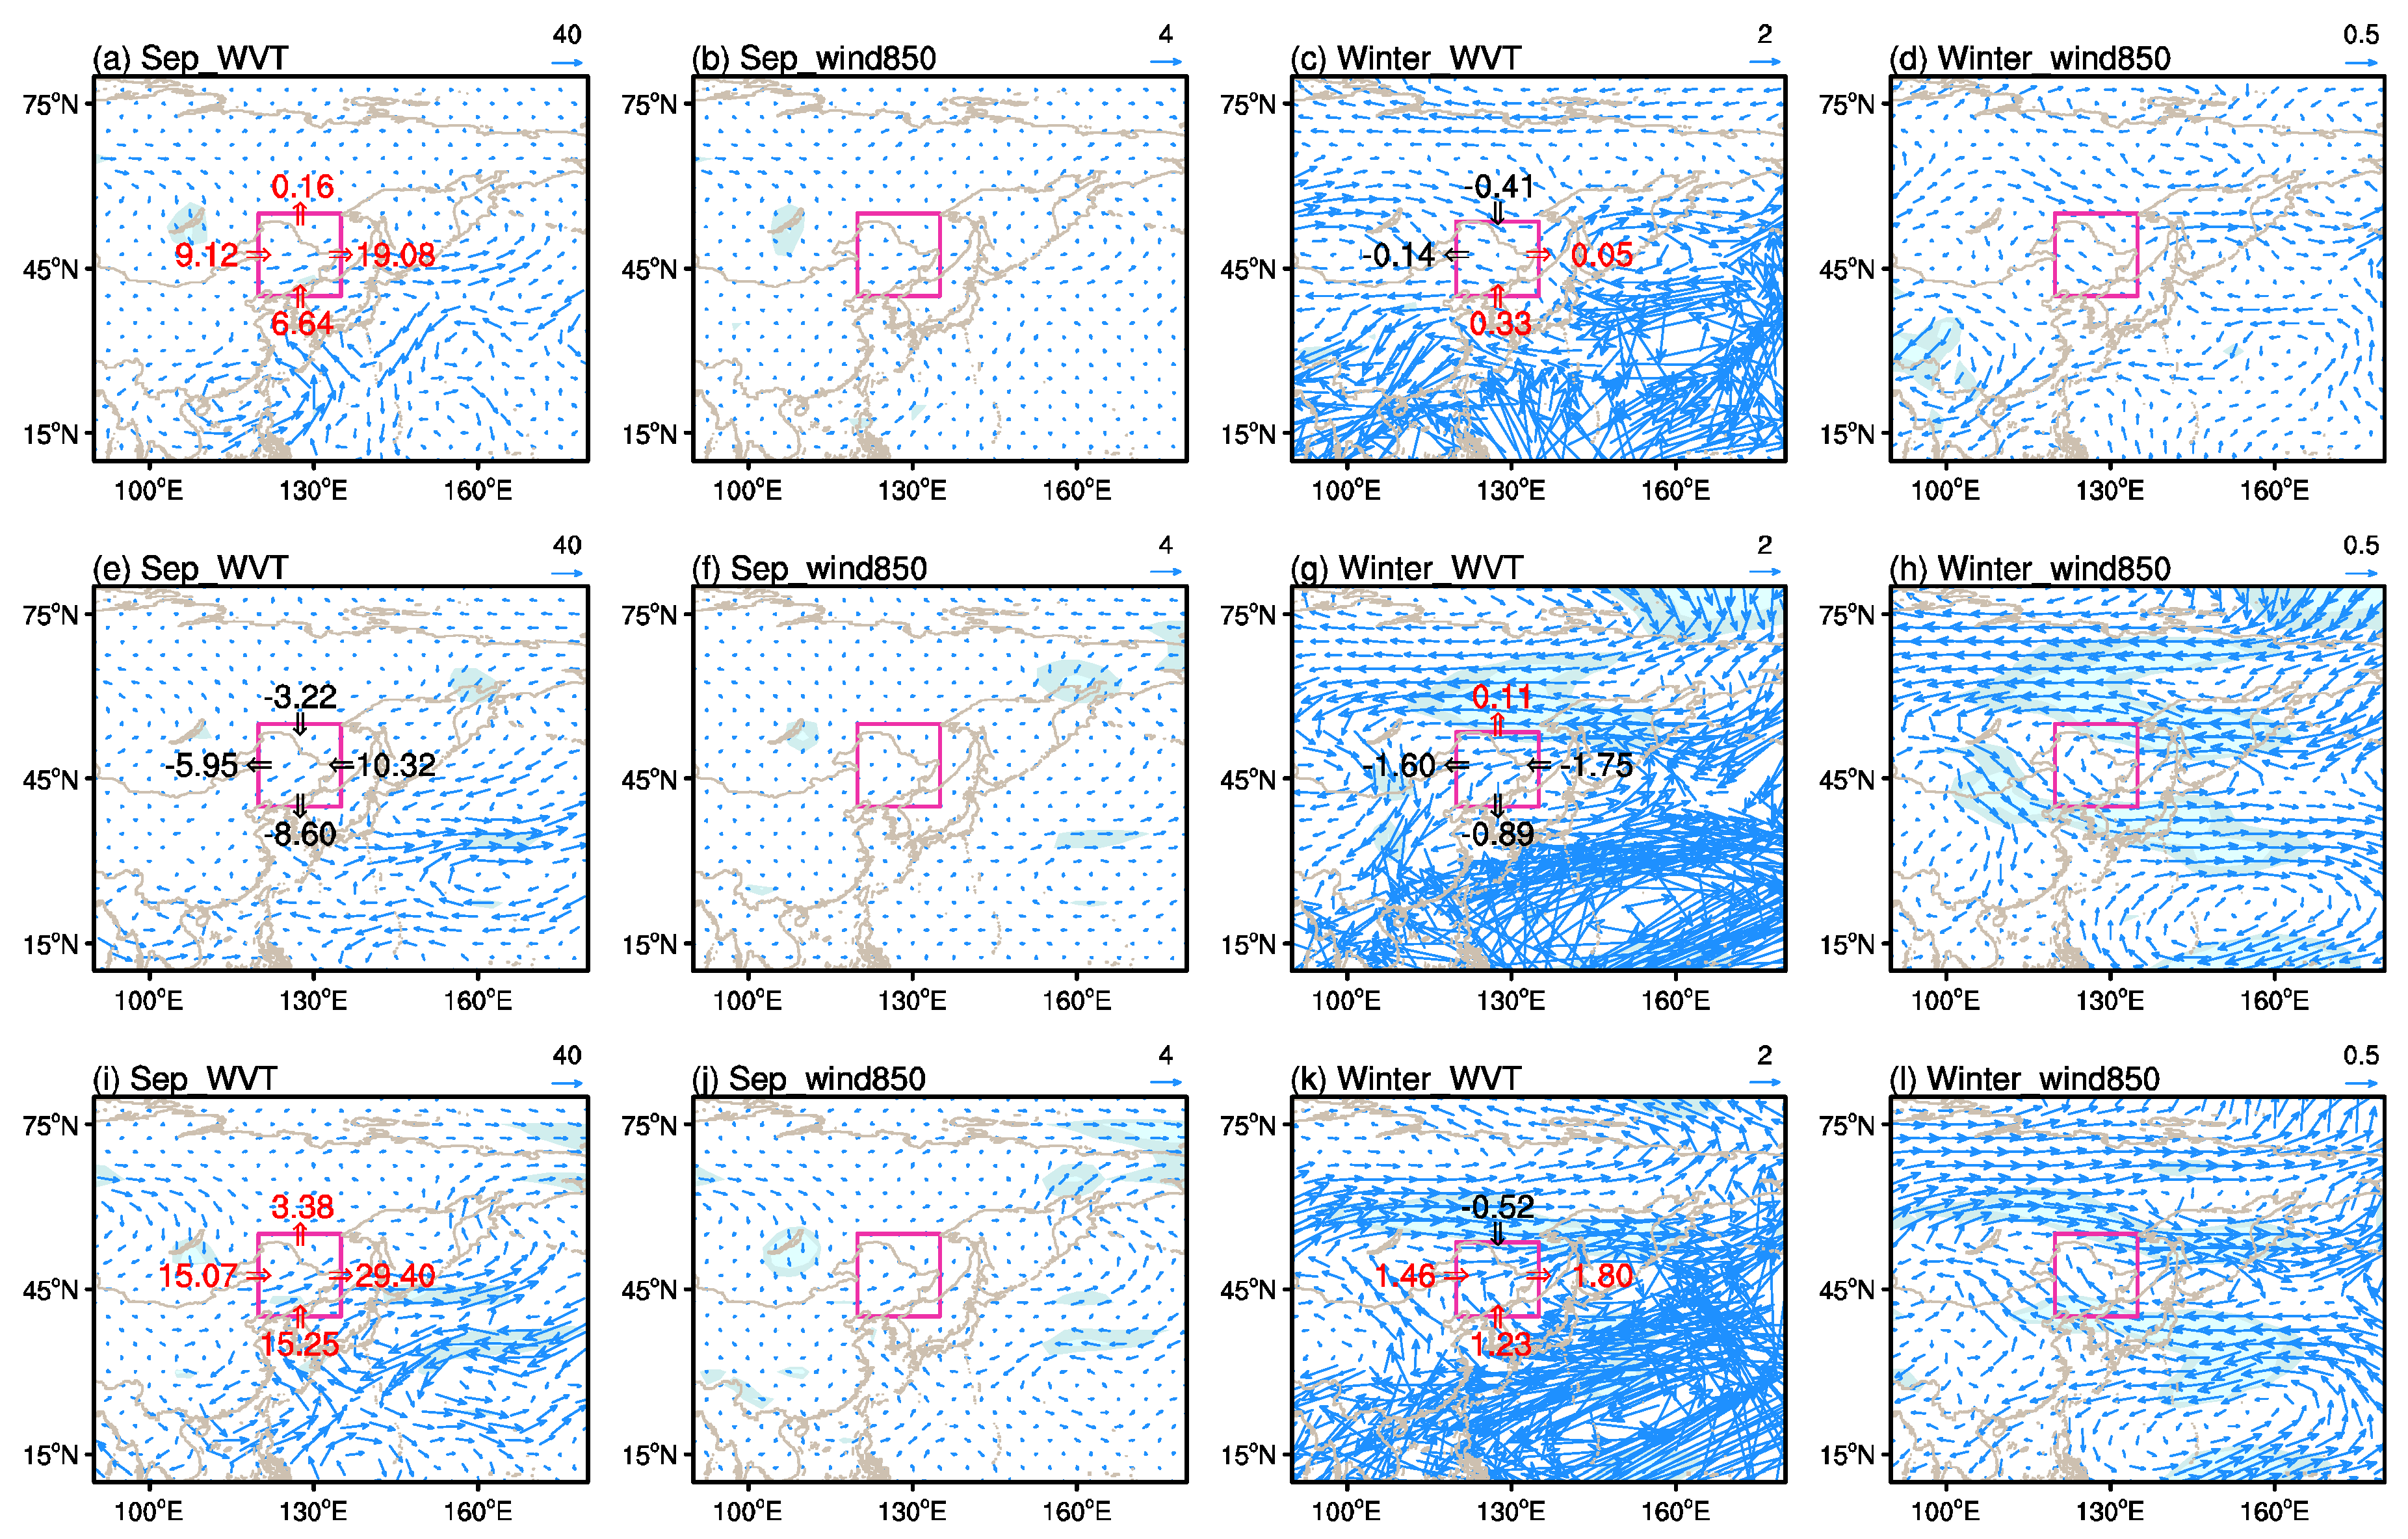
Moreover, in the composite of more HSE years, the vertically integrated WVT anomalies are characterized by an anomalous anticyclone occupying the Kuril Islands between 140° E and 160° E, with southerly WVT anomalies over NEC (Figure 6c,d). Under the guidance of the Kuril Islands anticyclonic anomaly, more water vapor is transported from the ocean to NEC, resulting in positive water vapor budget anomalies over NEC (Figure 6c). In contrast, the WVT anomalies are characterized by an anomalous cyclone over the island of Hokkaido, resulting in northerly WVT anomalies over NEC (Figure 6g,h). The corresponding effect on the net water vapor budget in the composite of more LSE years is a loss of −1.0 × 10⁶ kg s−1 (Figure 6g). Compared with the composite of more LSE years, the water vapor transported into the target region is enhanced in the composite of more HSE years, corresponding to a net water vapor budget gain of 0.6 × 10⁶ kg s−1 (Figure 6k).
Convective activity is the essential dynamical condition for the occurrence of snowfall. There are upward vertical motion anomalies in the composite of more HSE years, enhancing local convective activity, and thereby providing favorable dynamical conditions to increase the chances of HSE (Figure 8d). The K-index increases (decreases) in the composite of more HSE (LSE) years, indicating the contributory role played by the instability (stability) of the atmosphere in facilitating the convective activity in snowfall (Figure 8c,g).

3.3. Physical Mechanisms

To further explore the possible physical dynamics of the different interannual variabilities of HSE and LSE, we analyzed the associated wave activity fluxes and SSTs. As shown in Figure 9a, for the composite of more HSE years, there are active eastward-propagating quasi-stationary waves along a longitudinal path in midlatitude Eurasia via the North Atlantic–Scandinavia–Lake Baikal–NEC (NA–S–LB–NEC). These waves originate from the North Atlantic Ocean and are related to positive NAO. There are three possible dynamic processes that may influence the connection between the NAO and the path of the waves. Firstly, the NAO signal extends toward East Asia and the North Pacific, exhibiting a wave train along the Asian jet that is collocated with an anomalous vorticity source near the jet entrance. This wave train is interpreted as quasi-stationary Rossby waves trapped on the Asian jet waveguide, and thought to be effectively excited by the anomalous upper-level convergence over the Mediterranean Sea. In such cases, interannual variability of the NAO is tied to East Asian climate variability such that the positive NAO tends to bring a surface warming over East Asia [38]. Secondly, the NAO can modulate the activity of the storm track, and the storm track can lead to abnormal activities of transient waves, which makes a positive contribution to the maintenance and development of the atmospheric center of action in Europe and the Baikal area [39]. Thirdly, the NAO-like dipole in atmospheric circulation can result in changes in the local atmospheric circulation through diabatic heating, and then can exert an influence on the remote atmospheric circulation by energy dispersion of Rossby waves [40].
It is also worth noting that there is an additional longitudinal path to the north of the NA–S–LB–NEC path, via Novaya Zemlya–LB–NEC (N–Z–LB–NEC), implying that the high-latitude climate system is more important for LSE than for HSE. This may relate to the weak polar vortex in the stratosphere (Figure 5f). The possible mechanism by which the stratospheric polar vortex in midwinter stimulates the stationary Rossby wave in Eurasia can be described as follows: Initially, the stratospheric polar vortex downward-propagating wave activity fluxes into the troposphere via interaction with planetary waves [41], and then the Rossby wave propagates from high latitudes to midlatitudes.
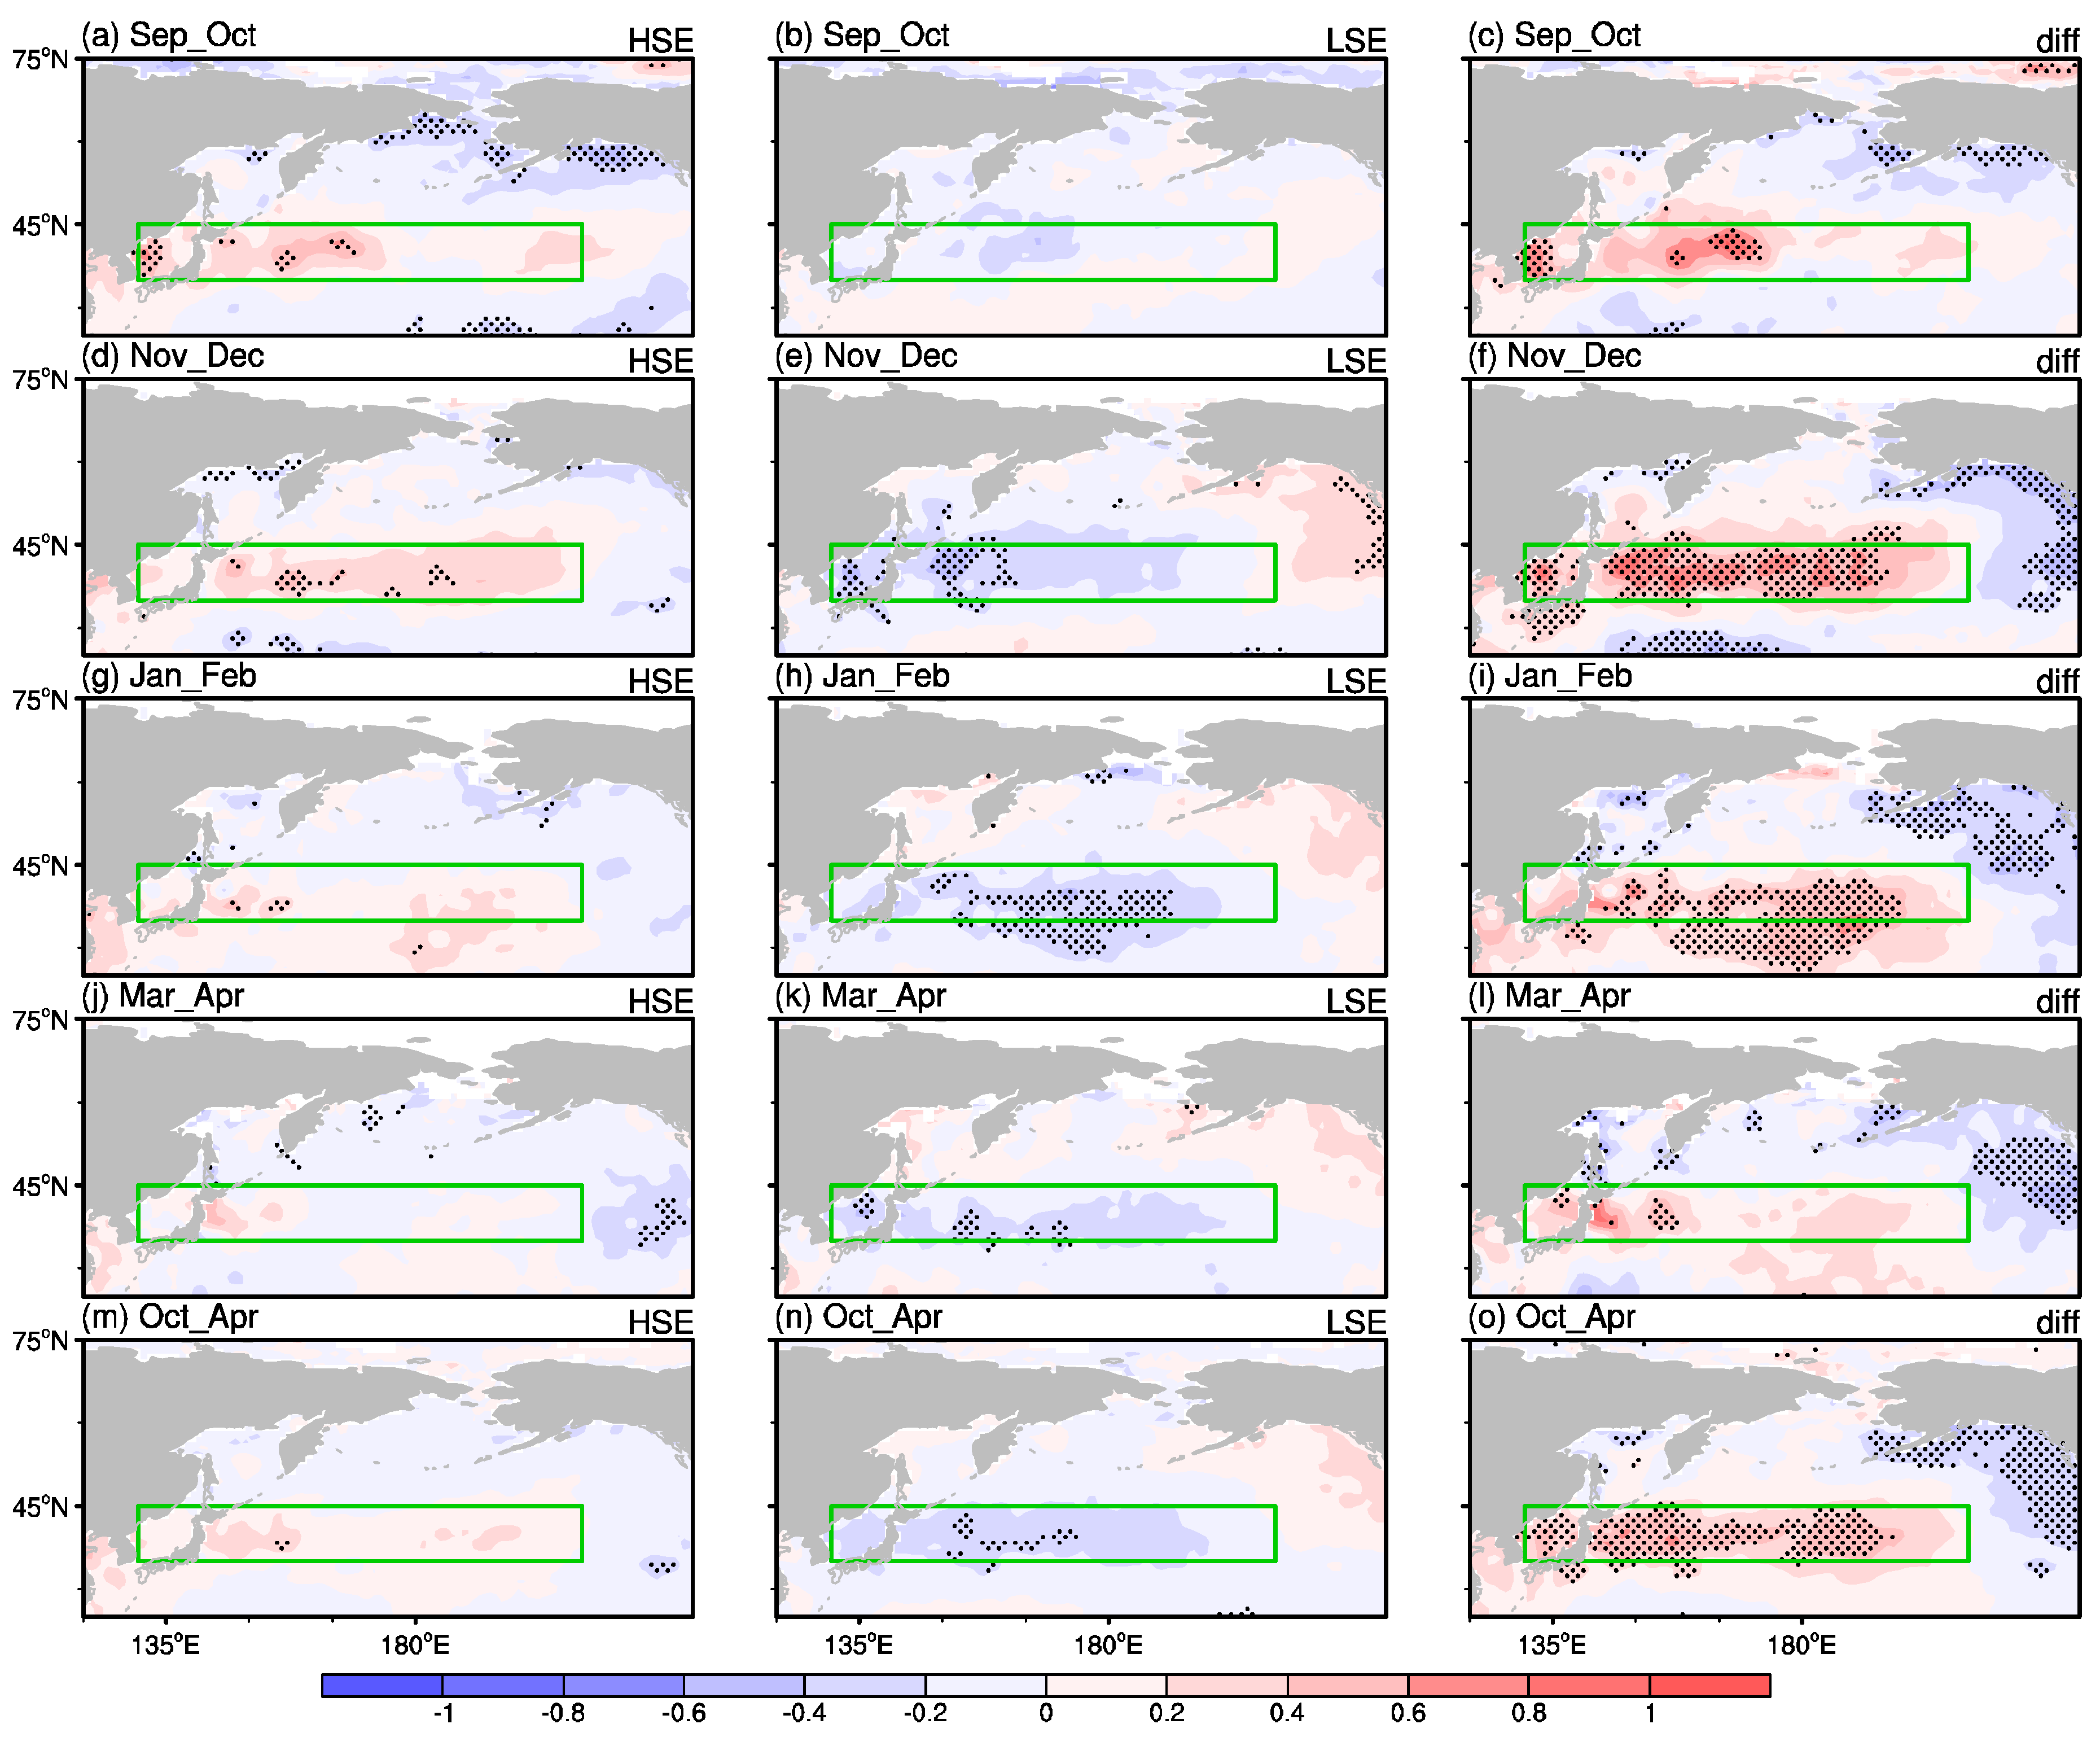
We also found that significant differences in SST exist over the Kuroshio Extension (KE) region. Compared with the composite of more LSE years, in that of more HSE years increasing SSTs are shown over the KE region starting in September that last for the whole wintertime (Figure 10). We computed the regional mean time series of the SST over the KE region as the KE index (KEI). We used this KEI to regress on climatic elements including surface temperature, precipitable water, K-index, and vertical motion (Figure 11). The results are quite consistent with the composite analysis (Figure 8). Warmer SST over the KE region provides a warm–wet and strongly convective atmospheric condition in NEC, collectively favoring HSE.
One of the interactions between extratropical SST anomalies and atmospheric circulations is the eddy-mediated process, in which a baroclinic response to thermal forcing induces and combines with changes in the position or strength of the storm tracks [42]. The atmospheric response to midlatitude SST anomalies is strongly dependent on the background climatological flow [43]. Based on this theory, a downstream anomalous ridge develops when the background meridional flow is relatively weak, and a positive AO response is favored.

4. Conclusions

This paper started by documenting the spatiotemporal features of HSE and LSE in NEC during 1961–2017. Climatologically, there are more HSEs over the east and south of NEC and more LSEs over the north of NEC. There are increasing trends for HSEs across NEC, but decreasing trends for LSEs in the east of NEC. Furthermore, HSEs occur with more frequency in November and March owing to the relatively weak northwesterly winds and increased atmospheric convection, which help warm–moist air masses to move northwards to deliver water vapor and provide dynamical conditions, respectively. LSEs, meanwhile, are more frequent in December–January when the strongest northwesterly winds appear. The stronger northwesterly winds bring cold–dry air masses, preventing warm–moist air masses from entering NEC; plus, the lowest annual temperatures cause the local water vapor to be relatively insufficient.
Next, we analyzed the background atmospheric circulation, water vapor, and the instability of atmospheric layers in composites of more HSE years and more LSE years. We found that there is a positive NAO pattern, a strengthened polar vortex, and an overall increased surface air temperature during the composite of more HSE years. This strengthened polar vortex is accompanied by stronger westerly winds that can prevent cold advections from invading continental Eurasia. Consequently, southwesterly winds anomaly exists in the lower troposphere over NEC. Under the guidance of the anticyclonic anomaly over the Kuril Islands, more water vapor is transported from the ocean to NEC. Favorable dynamical conditions for HSEs are ascending motion and enhanced local convective activity. Meanwhile, there is a strengthened EAWM, a weakened polar vortex, and an overall decreased surface air temperature in the composite of more LSE years. This strengthened EAWM is accompanied by stronger northerly and dry winds that can prevent warm air masses from invading continental Eurasia. Consequently, less precipitable water exists in the lower troposphere over NEC. Favorable dynamical conditions for LSE are such cold–dry air masses, descending motion, and insufficient local convective activity.
Additionally, we provide some discussion on the physical dynamics behind this atmospheric circulation pattern. Firstly, this study finds that the NAO is connected to high-frequency HSE in NEC. High-frequency HSE is related to eastward-propagating quasi-stationary waves along a longitudinal path over Eurasia via the North Atlantic–Scandinavia–Lake Baikal–NEC (or NA–S–LB–NEC path). According to previous research, we present three possible dynamical relationships between the NAO and the longitudinal path. The occurrences of anomalous upper-level convergence, abnormal activities of transient waves, and diabatic heating might excite this Rossby wave path. Secondly, we present that high-frequency LSE is related to high-latitude climate systems. We demonstrate that high-frequency LSE is related to an additional longitudinal path north of the NA–S–LB–NEC path, via Novaya Zemlya–LB–NEC. We consider whether this northernmost path may be connected to a weak stratospheric polar vortex. This weak polar vortex can transmit signals down to the troposphere through wave–flow interaction, and then the Rossby waves propagate longitudinally to the East Asian midlatitudes. This can promote LSE in NEC. In the future, diagnosis of dynamics (such as: Rossby wave source diagnose [44]) and numerical experiments using a linear barotropic model [38] should be carried out to conform the physical mechanisms between the high frequency of HSE and positive phase of NAO, as well as the high frequency of LSE and the weak polar vortex. Thirdly, this study addresses that higher SST over the KE region is connected to high-frequency HSE. We find that the positive SST anomaly brings warm–wet conditions and increased atmospheric instability to NEC. The positive SST anomalies over the KE region and atmospheric circulation may interact through eddy-mediated processes. Such environmental conditions arising from KE SST anomalies are favorable for high-frequency HSE in NEC. Analysis of thermal and transient eddy forcing related to the SST anomalies and numerical experiments will be performed to further identify the role of higher SST in the KE.
Due to global warming, the cryosphere has shrunk widely (such as: decreases in snow cover and Arctic sea ice extent and thickness) during the last decades [45]. Increased October snow cover in the Siberia leads to enhanced upward wave activity flux, and then a weakened stratospheric polar vortex in the late fall and early winter which further leads to negative Arctic Oscillation in January [46]. During December to April, sea ice in the North Atlantic is influenced by the NAO, and resultant sea ice anomalies exert negative feedback to the NAO [47]. Therefore, the role of snow cover and Arctic sea ice anomalies in the atmospheric circulation anomalies related to high-frequency HSE and LSE need further study.

Author Contributions

Conceptualization, K.F.; methodology, K.F., L.W., and Z.X.; software, L.W.; validation, L.W.; formal analysis, K.F., L.W., and Z.X.; investigation, L.W.; resources, K.F., L.W., and Z.X.; data curation, L.W. and Z.X.; writing—original draft preparation, L.W.; writing—review and editing, K.F., L.W., and Z.X.; visualization, L.W.; supervision, K.F.; project administration, K.F.; funding acquisition, K.F. All authors have read and agreed to the published version of the manuscript.

Funding

This research was funded by National Natural Science Foundation of China, grant number 41730964, 41421004, and National Key R&D Program of China, grant number 2017YFA0603802.

Acknowledgments

The authors are grateful to two anonymous reviewers for their insightful comments, which led to a significant improvement of the manuscript. This research was jointly supported by the National Natural Science Foundation of China (Grants 41730964, 41421004) and the National Key R&D Program of China (2017YFA0603802).

Conflicts of Interest

The authors declare no conflict of interest. The funders had no role in the design of the study; in the collection, analyses, or interpretation of data; in the writing of the manuscript, or in the decision to publish the results.

References

  1. Snow Disaster and Low Temperature Damage Occurred in Parts of Northeast China. Available online: http://www.ndrcc.org.cn/zxzq/22790.jhtml (accessed on 29 July 2020).
  2. Wang, J.; Ding, Y. Research on Moist Symmetric Instability in a Strong Snowfall in North China. Acta Meteorol. Sin. 1995, 9, 456–467. [Google Scholar]
  3. Sun, J.; Zhao, S. A Numerical Simulation of Snowfall in North China on 7 December 2001. Clim. Environ. Res. 2003, 387–401. [Google Scholar] [CrossRef]
  4. Lin, W.; Meng, J.; Sui, C.-H.; Meng, W.; Li, J. A study of the microphysical processes in a numerically simulated heavy snowfall event in North China: The sensitivity of different snow intercept parameters. Meteorol. Atmos. Phys. 2009, 104, 1–11. [Google Scholar] [CrossRef]
  5. Liu, N.; Qi, L.; Han, J. The Analyses of an Unusual Snowstorm Caused by the Northbound Vortex over Liaoning Province in China. Chin. J. Atmos. Sci. 2009, 33, 275–284. [Google Scholar]
  6. Sun, J.; Wang, H.; Yuan, W. A preliminary investigation on causes of the catastrophic snowstorm in March, 2007 in the northeastern parts of China. Acta Meteorol. Sin. 2009, 67, 469–477. [Google Scholar]
  7. Wang, H.; Yu, E.; Yang, S. An exceptionally heavy snowfall in Northeast china: Large-scale circulation anomalies and hindcast of the NCAR WRF model. Meteorol. Atmos. Phys. 2011, 113, 11–25. [Google Scholar] [CrossRef] [Green Version]
  8. Laternser, M.; Schneebeli, M. Long-term snow climate trends of the Swiss Alps (1931–99). Int. J. Climatol. 2003, 23, 733–750. [Google Scholar] [CrossRef]
  9. Sun, J.; Wang, H.; Yuan, W.; Chen, H. Spatial-temporal features of intense snowfall events in China and their possible change. J. Geophys. Res. Atmos. 2010, 115. [Google Scholar] [CrossRef]
  10. Li, D.; Xiao, Z.; Li, Z. The Spatial and Temporal Characteristics of Winter Snowfall in Northeast China and Its Relation with Global Sea Surface Temperature Anomaly. Meteorol. Mon. 2012, 38, 411–418. [Google Scholar]
  11. Liu, Y.; Ren, G.; Yu, H.M. Climatology of Snowfall in China. Sci. Geogr. Sin. 2012, 32, 1176–1185. [Google Scholar]
  12. Sui, Y.; Jiang, D.; Tian, Z. Latest update of the climatology and changes in the seasonal distribution of precipitation over China. Theor. Appl. Climatol. 2013, 113, 599–610. [Google Scholar] [CrossRef]
  13. Xu, W.; Ma, L.; Ma, M.; Zhang, H.; Yuan, W. Spatial–Temporal Variability of Snow Cover and Depth in the Qinghai–Tibetan Plateau. J. Clim. 2017, 30, 1521–1533. [Google Scholar] [CrossRef]
  14. Zhou, B.T.; Wang, Z.Y.; Shi, Y.; Xu, Y.; Han, Z.Y. Historical and Future Changes of Snowfall Events in China under a Warming Background. J. Clim. 2018, 31, 5873–5889. [Google Scholar] [CrossRef]
  15. Yang, T.; Li, Q.; Liu, W.; Liu, X.; Li, L.; De Maeyer, P. Spatiotemporal variability of snowfall and its concentration in northern Xinjiang, Northwest China. Theor. Appl. Climatol. 2020, 139, 1247–1259. [Google Scholar] [CrossRef]
  16. Chen, H.; Luo, J.; Han, F. Interdecadal variation of heavy snowfall in northern China and its linkages with atmospheric circulation and Arctic sea ice. Trans. Atmos. Sci. 2019, 42, 68–77. [Google Scholar]
  17. Zhao, C.; Wang, J.; Xiaoyu, Y.A.N.; Ying, W.; Yong, L.U.O. Climatic characteristics and regionalization of winter snowfall in Northeast China. J. Nat. Disasters 2009, 18, 29–35. [Google Scholar]
  18. Enzi, S.; Bertolin, C.; Diodato, N. Snowfall time-series reconstruction in Italy over the last 300 years. Holocene 2014, 24, 346–356. [Google Scholar] [CrossRef]
  19. Diodato, N.; Büntgen, U.; Bellocchi, G. Mediterranean winter snowfall variability over the past millennium. Int. J. Climatol. 2019, 39, 384–394. [Google Scholar] [CrossRef] [Green Version]
  20. Martínez-Ibarra, E.; Serrano-Montes, J.L.; Arias-García, J. Reconstruction and analysis of 1900–2017 snowfall events on the southeast coast of Spain. Clim. Res. 2019, 78, 41–50. [Google Scholar] [CrossRef]
  21. Hao, Z.; Yu, Y.; Ge, Q.; Zheng, J. Reconstruction of high-resolution climate data over China from rainfall and snowfall records in the Qing Dynasty. WIREs Clim. Chang. 2018, 9, e517. [Google Scholar] [CrossRef]
  22. Sun, B.; Wang, H. Water Vapor Transport Paths and Accumulation during Widespread Snowfall Events in Northeastern China. J. Clim. 2013, 26, 4550. [Google Scholar] [CrossRef]
  23. Wang, S.; Sun, B. The impacts of different land surface parameterization schemes on Northeast China snowfall simulation. Meteorol. Atmos. Phys. 2018, 130, 583. [Google Scholar] [CrossRef]
  24. Liu, J.; Curry, J.A.; Wang, H.; Song, M.; Horton, R.M. Impact of declining Arctic sea ice on winter snowfall. Proc. Natl. Acad. Sci. USA 2012, 109, 4074. [Google Scholar] [CrossRef] [PubMed] [Green Version]
  25. Feng, Y.; Chen, H. Warming over the North Pacific can intensify snow events in Northeast China. Atmos. Ocean. Sci. Lett. 2016, 9, 122–128. [Google Scholar] [CrossRef] [Green Version]
  26. Wang, H.; He, S. The increase of snowfall in Northeast China after the mid-1980s. Chin. Sci. Bull. 2013, 58, 1350. [Google Scholar] [CrossRef] [Green Version]
  27. Zhou, B.; Wang, Z.; Shi, Y. Possible Role of Hadley Circulation Strengthening in Interdecadal Intensification of Snowfalls Over Northeastern China Under Climate Change. J. Geophys. Res. 2017, 122, 638. [Google Scholar] [CrossRef]
  28. Han, T.; He, S.P.; Xin, H.; Huijun, W. Recent interdecadal shift in the relationship between Northeast China’s winter precipitation and the North Atlantic and Indian Oceans. Clim. Dyn. 2018, 50, 1413–1424. [Google Scholar] [CrossRef]
  29. Kalnay, E.; Kanamitsu, M.; Kistler, R.; Collins, W.; Deaven, D.; Gandin, L.; Iredell, M.; Saha, S.; White, G.; Woollen, J.; et al. The NCEP/NCAR 40-Year Reanalysis Project. Bull. Am. Meteorol. Soc. 1996, 77, 437. [Google Scholar] [CrossRef] [Green Version]
  30. Rayner, N.A. Global analyses of sea surface temperature, sea ice, and night marine air temperature since the late nineteenth century. J. Geophys. Res. 2003, 108. [Google Scholar] [CrossRef]
  31. Sun, B.; Zhu, Y.; Wang, H. The recent interdecadal and interannual variation of water vapor transport over eastern China. Adv. Atmos. Sci. 2011, 28, 1039. [Google Scholar] [CrossRef]
  32. Takaya, K.; Nakamura, H. A Formulation of a Phase-Independent Wave-Activity Flux for Stationary and Migratory Quasigeostrophic Eddies on a Zonally Varying Basic Flow. J. Atmos. Sci. 2001, 58, 608–627. [Google Scholar] [CrossRef]
  33. Zhang, G.; Jiao, M.; Li, Y. Techniques and Methods of Contemporary Weather Forecast; China Meteorological Press: Beijing, China, 2007; p. 117. [Google Scholar]
  34. Bai, L.; Shi, C.; Shi, Q.; Li, L.; Wu, J.; Yang, Y.; Sun, S.; Zhang, F.; Meng, J. Change in the spatiotemporal pattern of snowfall during the cold season under climate change in a snow-dominated region of China. Int. J. Climatol. 2019, 39, 5702–5719. [Google Scholar] [CrossRef]
  35. George, J. Weather Forecasting for Aeronautics; Academic Press: New York, NY, USA, 1960; Volume 87, p. 120. [Google Scholar]
  36. North, G.R.; Bell, T.L.; Cahalan, R.F.; Moeng, F.J. Sampling Errors in the Estimation of Empirical Orthogonal Functions. Mon. Weather. Rev. 1982, 110, 699–706. [Google Scholar] [CrossRef]
  37. Gong, D.-Y.; Wang, S.-W.; Zhu, J.-H. East Asian Winter Monsoon and Arctic Oscillation. Geophys. Res. Lett. 2001, 28, 2073–2076. [Google Scholar] [CrossRef]
  38. Watanabe, M. Asian Jet Waveguide and a Downstream Extension of the North Atlantic Oscillation. J. Clim. 2004, 17, 4674–4691. [Google Scholar] [CrossRef]
  39. Wei, W.; Wang, L.; Chen, Q.; Liu, Y.; Li, Z. Definition of Early and Late Winter and Associated Interannual Variations of Surface Air Temperature in China. Chin. J. Atmos. Sci. 2020, 44, 122–137. [Google Scholar]
  40. Zuo, J.; Li, W.; Sun, C.; Xu, L.; Ren, H.-L. Impact of the North Atlantic sea surface temperature tripole on the East Asian summer monsoon. Adv. Atmos. Sci. 2013, 30, 1173–1186. [Google Scholar] [CrossRef]
  41. Chen, W.; Wei, K. Anomalous Propagation of the Quasi-stationary Planetary Waves in the Atmosphere and Its Roles in the Impact of the Stratosphere on the East Asian winter Climate. Adv. Earth Sci. 2009. [Google Scholar] [CrossRef]
  42. Kushnir, Y.; Robinson, W.A.; Bladé, I.; Hall, N.M.J.; Peng, S.; Sutton, R. Atmospheric GCM Response to Extratropical SST Anomalies: Synthesis and Evaluation. J. Clim. 2002, 15, 2233–2256. [Google Scholar] [CrossRef] [Green Version]
  43. Peng, S.; Robinson, W.A.; Hoerling, M.P. The Modeled Atmospheric Response to Midlatitude SST Anomalies and Its Dependence on Background Circulation States. J. Clim. 1997, 10, 971–987. [Google Scholar] [CrossRef]
  44. Sardeshmukh, P.D.; Hoskins, B.J. The Generation of Global Rotational Flow by Steady Idealized Tropical Divergence. J. Atmos. Sci. 1988, 45, 1228–1251. [Google Scholar] [CrossRef] [Green Version]
  45. IPCC. Summary for Policymakers. In IPCC Special Report on the Ocean and Cryosphere in a Changing Climate; Pörtner, H.-O., Roberts, D., Masson-Delmotte, V., Zhai, P., Tignor, M., Poloczanska, E., Mintenbeck, K., Alegría, A., Nicolai, M., Okem, A., et al., Eds.; IPCC: Geneva, Switzerland, 2019. [Google Scholar]
  46. Cohen, J.; Barlow, M.; Kushner, P.J.; Saito, K. Stratosphere–Troposphere Coupling and Links with Eurasian Land Surface Variability. J. Clim. 2007, 20, 5335–5343. [Google Scholar] [CrossRef]
  47. Strong, C.; Magnusdottir, G.; Stern, H. Observed Feedback between Winter Sea Ice and the North Atlantic Oscillation. J. Clim. 2009, 22, 6021–6032. [Google Scholar] [CrossRef]
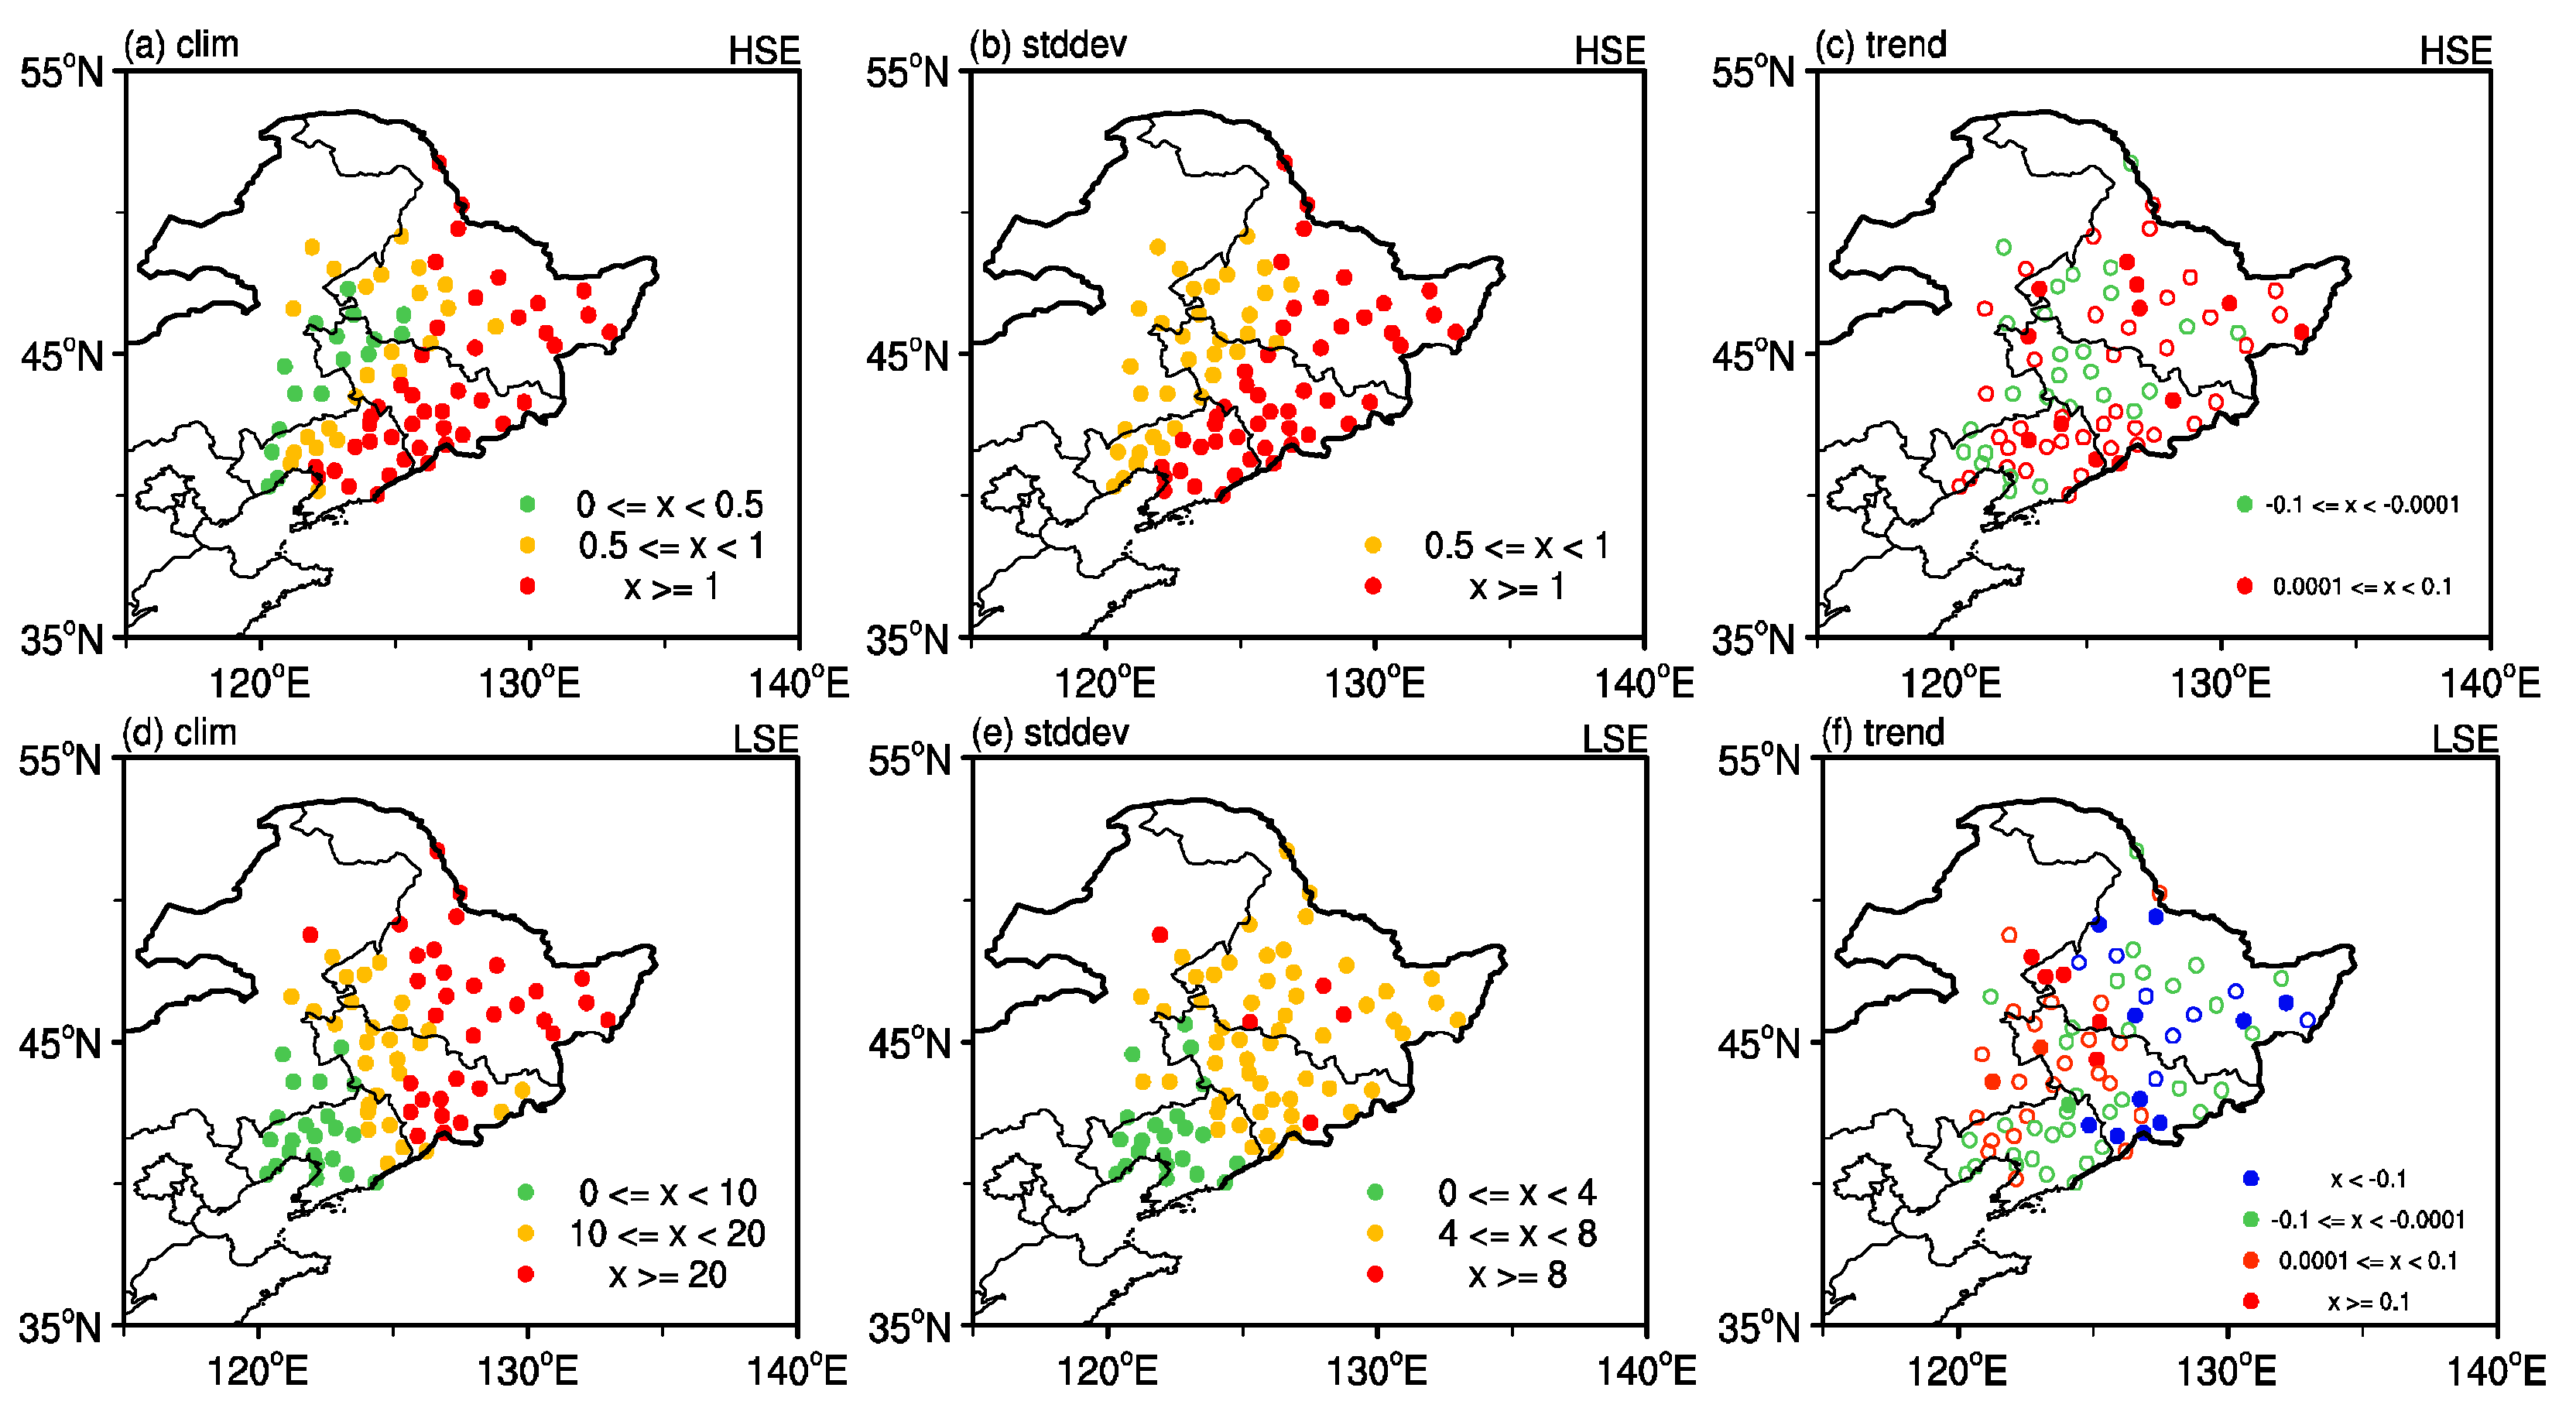
Figure 1. Climatological spatial distributions of wintertime heavy snowfall event (HSE) and light snowfall event (LSE) in northeast China (NEC) during 1961–2017: (ac) HSE climatology (units: day), standard deviation (units: day), and linear trend (units: day (10 a)−1), respectively; (df) as in (ac) but for LSE. In (c,f), filled dots are above the 90% confidence level.
Atmosphere 11 00936 g001
Figure 2. Annual cycles for the (a,c) climatology (units: day) and (b,d) standard deviation (units: day) of (a,b) HSE and (c,d) LSE in NEC during 1961–2017. First, we obtained the cumulative snowfall frequency of each station in NEC, and then computed the climatology and standard deviation of each month.
Atmosphere 11 00936 g002
Figure 3. Winter climatic elements over NEC during 1961–2017: (a) 2-m air temperature (units: °C); (b) 10-m wind speed (units: m s−1); (c) precipitable water (units: kg m−2); (d) K-index (units: K).
Atmosphere 11 00936 g003
Figure 4. Leading empirical orthogonal function (EOF) (EOF1) of wintertime HSE and LSE and snowfall (HSE or LSE) index in NEC during 1965–2013, with each station normalized by its deviation before the EOF analysis: (a) spatial structure of the EOF1 of HSE anomalies; (c) normalized time series of the EOF1 of HSE anomalies (solid black line) and HSE index series (dotted red line); (b,d) as in (a,c) but for LSE. The variation explained by the EOF1 of HSE and LSE is 25.7% and 48.7%, respectively. Snowfall (HSE or LSE) index is normalized by the regional average over NEC. In (c,d), red and blue asterisks correspond to years with snowfall index larger than 0.5 standard deviations and lower than −0.5 standard deviations, respectively, in which the correlation coefficient between the EOF1 time series and the snowfall index series is presented on the top-right side, and the two black asterisks indicate the correlation coefficient is above the 99% confidence level.
Atmosphere 11 00936 g004
Figure 5. Composite differences in the climatic elements field for the composites of more HSE years and more LSE years in wintertime over NEC: (ac) sea level pressure (units: hPa), 500-hPa geopotential height (units: gpm), and 50-hPa geopotential height (units: gpm) in the composite of more HSE years, respectively; (df) as in (ac) but for more LSE years; (gi) as in (ac) but for the differences between more HSE years and more LSE years. Stippling denotes where the anomalies are significant at the 90% confidence level.
Atmosphere 11 00936 g005
Figure 6. Composite differences in September and wintertime vertically integrated water vapor transport (WVT; units: kg m−1 s−1) and 850 hPa winds (units: m s−1) in the composite of more HSE years and more LSE years: the anomalies of vertically integrated WVT and 850-hPa winds in the composite of more HSE years in (a,b) September and (c,d) winter period; (eh) as in (ad) but for the composite of more LSE years; (il) as in (ad) but for the difference between more HSE years and more LSE years. Blue shading denotes where anomalies are significant at the 90% confidence level. Panels (a,c,e,g,i,k) show the anomaly values of water vapor transported over NEC.
Atmosphere 11 00936 g006
Figure 7. Composite differences in 200-hPa horizontal winds (units: m s−1) for the composite of more HSE years and more LSE years in wintertime over NEC: (a) anomalies in the composite of more HSE years; (b) anomalies in the composite of more LSE years; (c) differences between the composite of more HSE years and that of more LSE years. Stippling denotes where the anomalies are significant at the 90% confidence level.
Atmosphere 11 00936 g007
Figure 8. Composite differences in the climatic elements field for the composite of more HSE years and more LSE years in wintertime over NEC: (ad) 2-m air temperature (units: °C), precipitable water (units: kg m−2), K-index (units: K), and 500-hPa vertical velocity (units: 10−2 Pa s−1) in the composite of more HSE years, respectively; (eh) as in (ad) but for the composite of more LSE years; (il) as in (ad) but for the difference between the composite of more HSE years and that of more LSE years. Stippling denotes where the anomalies are significant at the 90% confidence level.
Atmosphere 11 00936 g008
Figure 9. The 200-hPa wave activity flux (vectors; units: m2 s−2) with geopotential height anomalies (contours; units: gpm): (a) anomalies in the composite of more HSE years; (b) anomalies in the composite of more LSE years. Shading denotes where the anomalies are significant at the 90% confidence level.
Atmosphere 11 00936 g009
Figure 10. Composite differences in sea surface temperature (SST) (units: °C) in the preceding September–April in the composites of more HSE years and more LSE years in wintertime over NEC: rows are for each bi-month; columns (from left to right) are the anomalies in the composite of more HSE years (a,d,g,j,m), anomalies in the composite of more LSE years (b,e,h,k,n), and anomalies in the difference between the composites of more HSE years and that of more LSE years (c,f,i,l,o). The SST index is defined based on the green box region (35°–45° N, 130°–210° E). Stippling denotes where anomalies are significant at the 90% confidence level.
Atmosphere 11 00936 g010
Figure 11. Regression coefficients of Kuroshio Extension SST index in wintertime from 1965 to 2013 by climatic element: (a) 2-m air temperature (units: °C); (b) precipitable water (units: kg m−2); (c) K-index (units: K); (d) 500 hPa vertical velocity (units: 10−2 Pa s−1). Stippling denotes where anomalies are significant at the 90% confidence level.
Atmosphere 11 00936 g011