Article

Rainfall Symmetry Related to Moisture, Storm Intensity, and Vertical Wind Shear for Tropical Cyclones Landfalling over the U.S. Gulf Coastline

Department of Geography, University of Florida, Gainesville, FL 32611, USA
*
Author to whom correspondence should be addressed.
Atmosphere 2020, 11(9), 895; https://doi.org/10.3390/atmos11090895
Submission received: 17 July 2020 / Revised: 14 August 2020 / Accepted: 19 August 2020 / Published: 24 August 2020
(This article belongs to the Section Meteorology)

Abstract

:
There continues to be a need to relate rainfall produced by tropical cyclones (TCs) to moisture in the near-storm environment. This research measured the distribution of volumetric rainfall around 43 TCs at the time of landfall over the U.S. Gulf Coast. The spatial patterns of rainfall were related to atmospheric moisture, storm intensity, vertical wind shear, and storm motion. We employed a geographic information system (GIS) to perform the spatial analysis of satellite-derived rain rates and total precipitable water (TPW), which was measured on the day before landfall. Mann–Whitney U tests revealed statistically significant differences in conditions when TCs were grouped by location. TCs moving over Texas entrained dry air from the continent to produce less rainfall to the left of their moving direction. As moisture was plentiful, rainfall symmetry during landfall over the central Gulf Coast was mainly determined by the vector of vertical wind shear and storm intensity. For landfalls over the Florida peninsula, interaction with a cooler and drier air mass left of center created an uplift boundary that corresponded with more rainfall on the TC’s left side when the moisture boundary represented by the 40 mm contour of TPW existed 275–350 km from the storm center.

1. Introduction

Tropical cyclones (TCs) can cause much destruction as they bring damaging winds, storm surges, and/or heavy rainfall when moving near and over land. From 1963 to 2012, water-related hazards from TCs were linked to ~90% of TC deaths, and 27% of the deaths were associated with freshwater floods caused by heavy rainfall from TCs [1]. By 2100, TC-related damage may increase in North America, causing ~USD 26 billion damage each year due to population and income growth within the coastal regions [2]. In 2017, Hurricanes Harvey, Irma, and Maria caused USD 220 billion in economic losses [3]. Although forecasts of TC trajectory have been improved significantly [4], it is still difficult to accurately forecast rainfall due to the complexity of precipitation formation in TCs [5,6], which can be affected by encountering strong vertical wind shear, changes in storm motion, variations in atmospheric moisture, and topographic barriers.
For TCs over the ocean, vertical wind shear and storm motion are known to be dominant factors that influence the symmetry of TC rainfall regions [7,8,9]. Rainfall area increases with increased shear and faster storm translation speed [10]. When vertical wind shear increases, the TC vortex tilts downshear as faster winds occur in the upper troposphere relative to the lower troposphere. As the vortex adjusts to the tilt, upward motion occurs on the downshear side, enhancing convection near the eyewall and propagating clouds and precipitation outward, while downward motion on the upshear side limits rainfall production. Thus, the rainfall regions develop on the downshear side and this is where more rainfall occurs [7,8,11,12,13,14]. Chen et al. [8] also found that if vertical wind shear exceeds 5 m s−1, TC rainfall patterns are most influenced by the vector of the vertical wind shear regardless of storm motion. When shear is weak, the rainfall patterns are determined by storm motion, with more rainfall occurring on the front to front-right side of the storm center due to stronger frictional convergence ahead of the storm [7,15]. In this manuscript, when we refer to the left and right sides of the TC, we are referring to the region to the left or right of the storm’s direction of motion.
TCs encounter strong vertical wind shear and accelerate when they undergo extratropical transition (ET). If a TC moves into the mid-latitudes, it can transform into an extratropical cyclone by interacting with an upper-level trough or a frontal boundary [16,17,18,19,20]. The interaction between the relatively cool and dry air mass from a mid-latitude trough and the warm and moist air mass around a TC produces a deep baroclinic zone to provide a mechanism for convergence and uplift of tropical moisture that promotes heavy rainfall ahead of and on the left side of the TC [21]. During transition, TCs move faster but decrease in tangential wind velocity, and the warm core is lost. Afterward, if a TC interacts with the upper-tropospheric divergence and positive vorticity advection, a cold core and frontogenesis develop with isentropic uplift in the broad area ahead of the storm. As a result, the rain field is more dispersed away from the storm center [22].
A sufficient supply of moisture in the atmosphere is required for TC formation and rainfall production. Although TC intensity is driven by gaining energy from the evaporation of surface moisture [23], there has been a limited amount of research examining the relationship between moisture throughout the troposphere and TC rainband configurations during and after landfall. Rainfall may be produced primarily on one side of a TC approaching land due to the influx of dry air [24,25]. When the drier continental air mass flows counterclockwise around the left side of a northern hemisphere TC and penetrates its core, atmospheric instability on the TC’s left side decreases, which should limit rainfall production on this side. However, TCs can gain large amounts of moisture over warm ocean waters on their equatorward side, and this moisture increases instability and rainfall production on its right side. Thus, TCs may produce less rain on the left and more rain on the right side when encountering a somewhat drier continental air mass ahead and/or left of its center. However, it is also important to consider storm intensity alongside moisture availability. Due to their faster winds, hurricanes may advect moisture farther around ahead of the storm center, enabling precipitation to occur in a more symmetrical pattern when compared to weaker tropical storms.
Previous studies have established that total precipitable water (TPW) is an important component of TC rainfall production. For example, Rogers and Pierce [26] revealed that the influx of moist (TPW greater than 50 mm) or dry air (TPW less than 50 mm) surrounding Typhoon Bobbie 1992 initiated or reduced convective rain bands in its outer-core region. Hernandez Ayala and Matyas [27] found 44 mm of TPW to distinguish between TCs that produced higher or lower amounts of rainfall over Puerto Rico. Jiang et al. [28,29] found that Isidore (2002) produced more precipitation than Lili (2002) because the environment for Isidore contained more moisture.
However, researchers have not studied the symmetry of TC rainfall in conjunction with TPW patterns for TCs making landfall over the U.S. The moisture content of air masses present over the southern U.S. becomes greater toward the east [30] and more moisture exists over the ocean than the land [31]. The amount of TPW available to enter a TC’s circulation should decrease as the system moves into a hot and dry continental air mass or encounters a relatively cool and dry air mass associated with a middle latitude trough or a frontal system. This unbalanced distribution of moisture should induce asymmetries in TC rainfall production, particularly when the dry air mass is near the storm center.
Topography can either enhance or inhibit rainfall as TCs approach and move over land. The change in roughness as a TC moves from over ocean to over land may cause more rainfall on the right side of a storm in the northern hemisphere [32]. Yu et al. [33] found that when vertical wind shear is <5 m s−1, both shear and land–sea contrasts can influence rainfall asymmetry. TCs can produce more rainfall on the upslope side as the moisture transported by the approaching TC is forced to rise [34,35]. When moisture influx from the Gulf of Mexico is blocked by topographic barriers such as North America Cordillera, moisture convergence can occur with the dry or cool air mass from the continent, causing heavy rainfall over the Great Plains in the U.S. [36]. However, the topographic barriers can inhibit low-level moisture transport from the west side of mountains to Texas or the east side of Mexico [36,37]. Therefore, moisture supply can be limited for the left side of a TC making landfall over Texas. Indeed, Matyas [38] suggested that topographic barriers in Texas may have influenced the symmetry and orientation of nearby TC rain fields.
Given the variability of moisture over the southern U.S. and the need for tropospheric moisture to maintain rainfall production, this research has two main goals. These goals are (1) to investigate the symmetry of rain rates with respect to the left and right side of the storm as TCs landfall over the Gulf Coast of the U.S., and (2) to ascertain whether these patterns coincide with the spatial distribution of TPW in conjunction with storm intensity as well as the vectors of vertical wind shear and storm motion. As motion vectors varied regionally in the Gulf of Mexico shifting from northwest to northeast direction from west to east, we placed the analyzed TCs into three groups based on the landfall location and the storm motion direction (Figure 1). The amount of volumetric rainfall at the time closest to landfall and distribution of TPW during the 24 h before landfall were analyzed to determine their variation on either side of the storm. We classify rain fields as symmetric or having asymmetry with more rainfall on the right or left side. We then explored whether the relationship between vertical wind shear and storm motion corresponded to rainfall symmetry along with or despite the spatial distribution of moisture.

2. Data

The International Best Track Archive for Climate Stewardship (IBTrACS) was used to determine the position and intensity of the 43 TCs every three hours and identify landfall times and locations [39]. Previous research has shown that there is a time lag of 12–24 h for the influence of environmental conditions on TC structure [5,40,41]. Therefore, this study examined environmental moisture at the time closest to landfall for which data were available and during the preceding 24 h. Time periods were designated as time nearest landfall 00 (t00), and 3 (t03), 6 (t06), 9 (t09), 12 (t12), 15 (t15), 18 (t18), 21 (t21), and 24 (t24) hours before the time nearest landfall. TCs that formed over the Gulf of Mexico less than 24 h prior to landfall were not examined.
We utilized three-hourly rain rates from the Tropical Rainfall Measuring Mission (TRMM) 3B42 product to determine if TC rainfall was distributed symmetrically or more on the left or right side relative to the TC’s center at the time closest to landfall. The 3B42 dataset is produced by combining both microwave and infrared precipitation estimates from the TRMM satellite [42] and is improved by incorporating data from other satellites and corrections from rain gauges [43]. The TRMM dataset provides complete coverage over our study region as it extends 50° N to 50° S and 180° W to 180° E, with 0.25° × 0.25° pixels. We utilized data spanning 1998–2013 as the TRMM satellite’s orbit began to decay in 2014. A main limitation of this dataset is that rain rates >s5 mm hr−1 are underestimated and rates ≤1 mm hr−1 are overestimated over the land and the ocean [44].
We obtained TPW data from the North American Regional Reanalysis (NARR) [45], derived from the National Oceanic and Atmospheric Administration’s (NOAA) National Centers for Environmental Prediction (NCEP) Eta Model with the Regional Data Assimilation System using historical observations across the North American region. Similar to the TRMM dataset, the spatial resolution approximates 0.25° latitude and longitude and the temporal resolution is 3-hourly. Zick and Matyas [46,47] showed that since 1998, this reanalysis dataset is competitive in TC research by comparing TC position and structure with another reanalysis dataset and by comparing TC precipitation with TRMM 3B42. As the IBTrACS, NARR and TRMM datasets are available every three hours beginning at 00:00 UTC, we analyzed data for the time closest to landfall. For most cases, the time offset was 1 h or less, and the average distance from the storm center to the coastline was 10 km. This distance should not pose a large problem in the analysis as the inner cores of all TCs were interacting with land at analysis time, and the distance between the storm center and land fell within one grid cell’s length in the TRMM and NARR datasets in all but four cases.
Vertical wind shear data were obtained from the Statistical Hurricane Intensity Scheme (SHIPS) database, which calculates variables from NCEP Global Forecast System model analysis [48]. The wind vectors 200–800 km from the storm center were averaged and the vector differences between 850 and 200 hPa were computed for wind speed and direction. As values are only available with 6-hourly resolution, the data were interpolated in a linear manner to match the 3-hourly TRMM and NARR data sets. As wind shear values were not available at the time closest to landfall for six storms, data from 3 to 6 h earlier were used for these storms as values were fairly consistent over the 12 h prior to the final observation.

3. Methods

We divided the 43 storms into three groups (Figure 1) based on landfall location and storm motion. Most storms crossed the coastline at a perpendicular angle. The western group contained 12 landfalls occurring over Texas (Table 1), where TCs moved towards the northwest before landfall. This group covered the same area as the western Gulf group in [49]. The 17 landfalls in the central group (Table 2) featured the strongest northward component to storm motion. Here, landfalls spanned Louisiana, Alabama, Mississippi, and northwestern Florida. We divided Florida along 86° W longitude due to its unique shape. West of 86° W, TCs with motion vectors between north-northwest and north-northeast directions were included in the central group. Farther east, most TCs exhibited stronger eastward motion. Therefore, the eastern group contained 14 landfalls (Table 3) occurring on the Gulf of Mexico side of Florida east of 86° W longitude.
Since a TC gathers moisture from a large radius [50] and moisture converges towards the TC center to generate its rain fields, there is a lag between changes of moisture in the TC’s surrounding environment and its effect on rainfall production (e.g., [5,41]). Thus, we employed a GIS to analyze data obtained from IBTrACS and NARR during the 24 h before t00, and TRMM data at t00. These data were transformed into an equal-area projection: North America Albers Equal Area Conic.
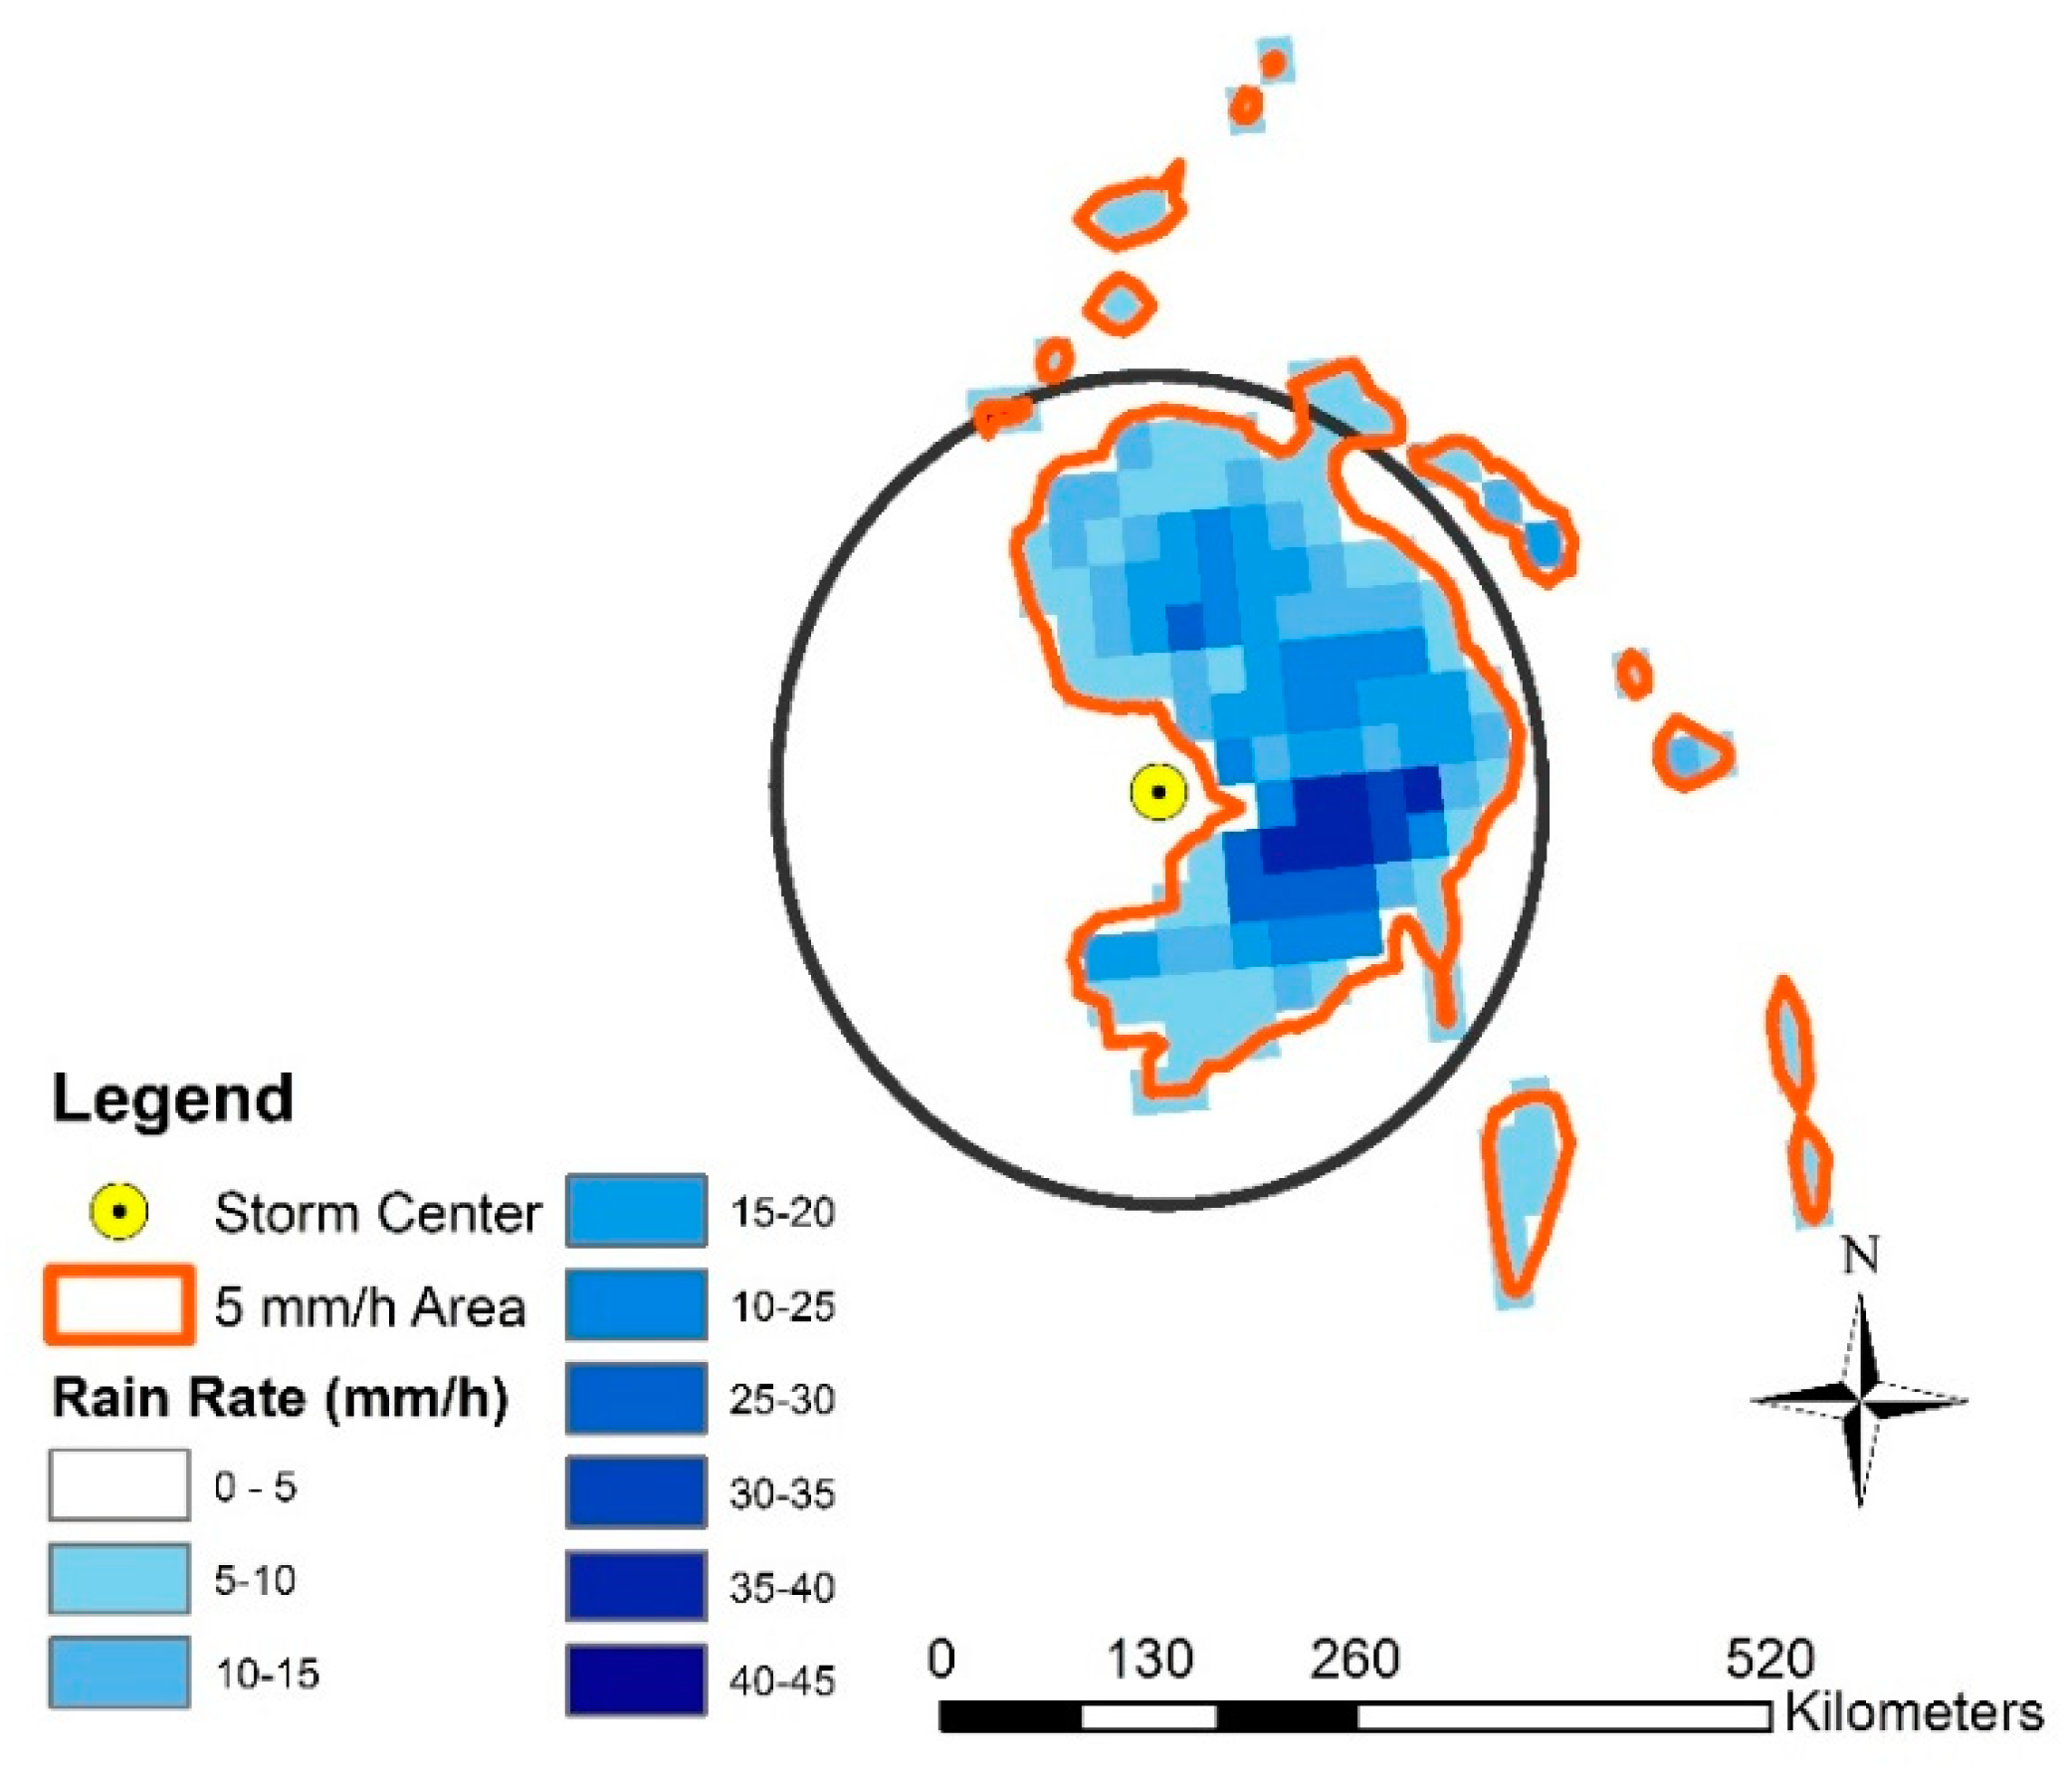
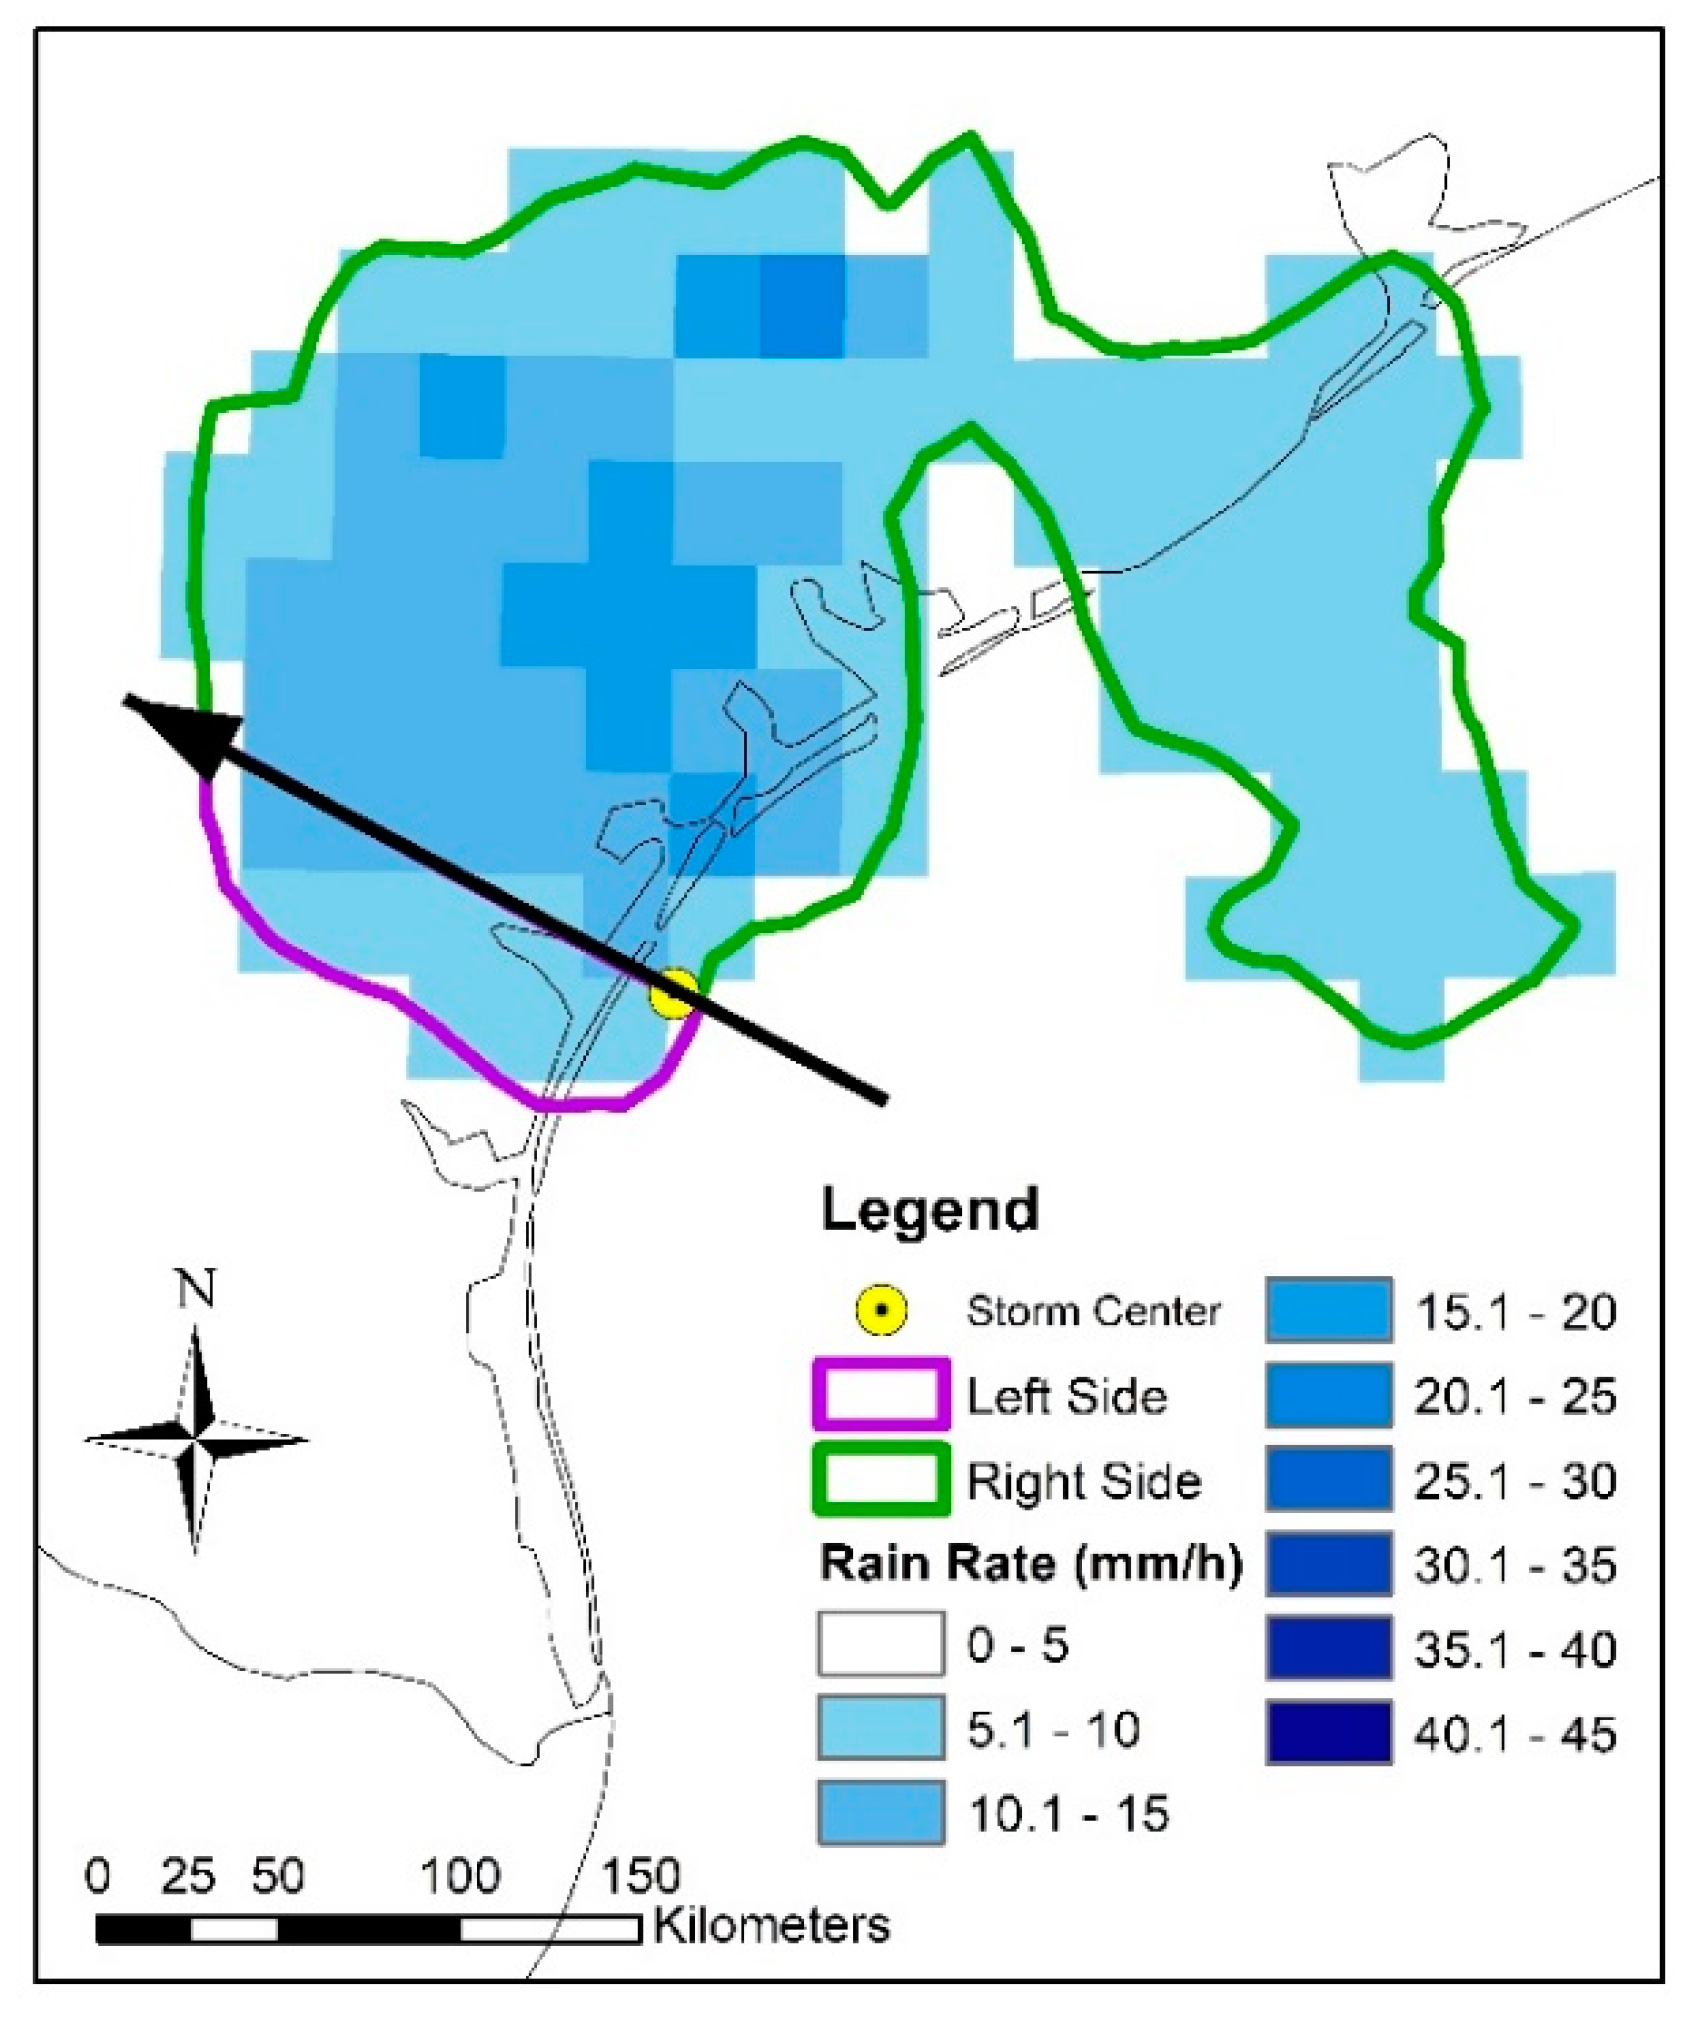
We first determined the symmetry of the rainfall. To eliminate areas with light rainfall that tended to be overestimated, the outer edges of the rain fields were contoured using a rate of 5 mm hr−1 as in [51]. The regions enclosed by contours of 5 mm hr−1 were converted into polygon features, and the areas of the polygons were measured. Polygons located within or that intersected with a 250 km buffer zone from the TC center were used to calculate the volumetric rainfall on the right and left sides of the storm at t00 by multiplying the mean value (mm hr−1) of rain rates within the selected polygons by the area (km2) of selected polygons (Figure 2). Storm motion was calculated using the coordinates of the storm center three hours prior to the rainfall analysis time and the position at analysis time. A line representing this heading was used to separate the rain rates according to whether they occurred to the right or to the left of this line. Rainfall patterns were classified into one of three groups according to the amount of rain on each side of the storm. If neither side contained 20% more rainfall than the other side, this was deemed a symmetrical (S) pattern. The remaining asymmetrical cases were grouped according to whether more rainfall occurred on the right (AR) (Figure 3) or left (AL) side of the storm.
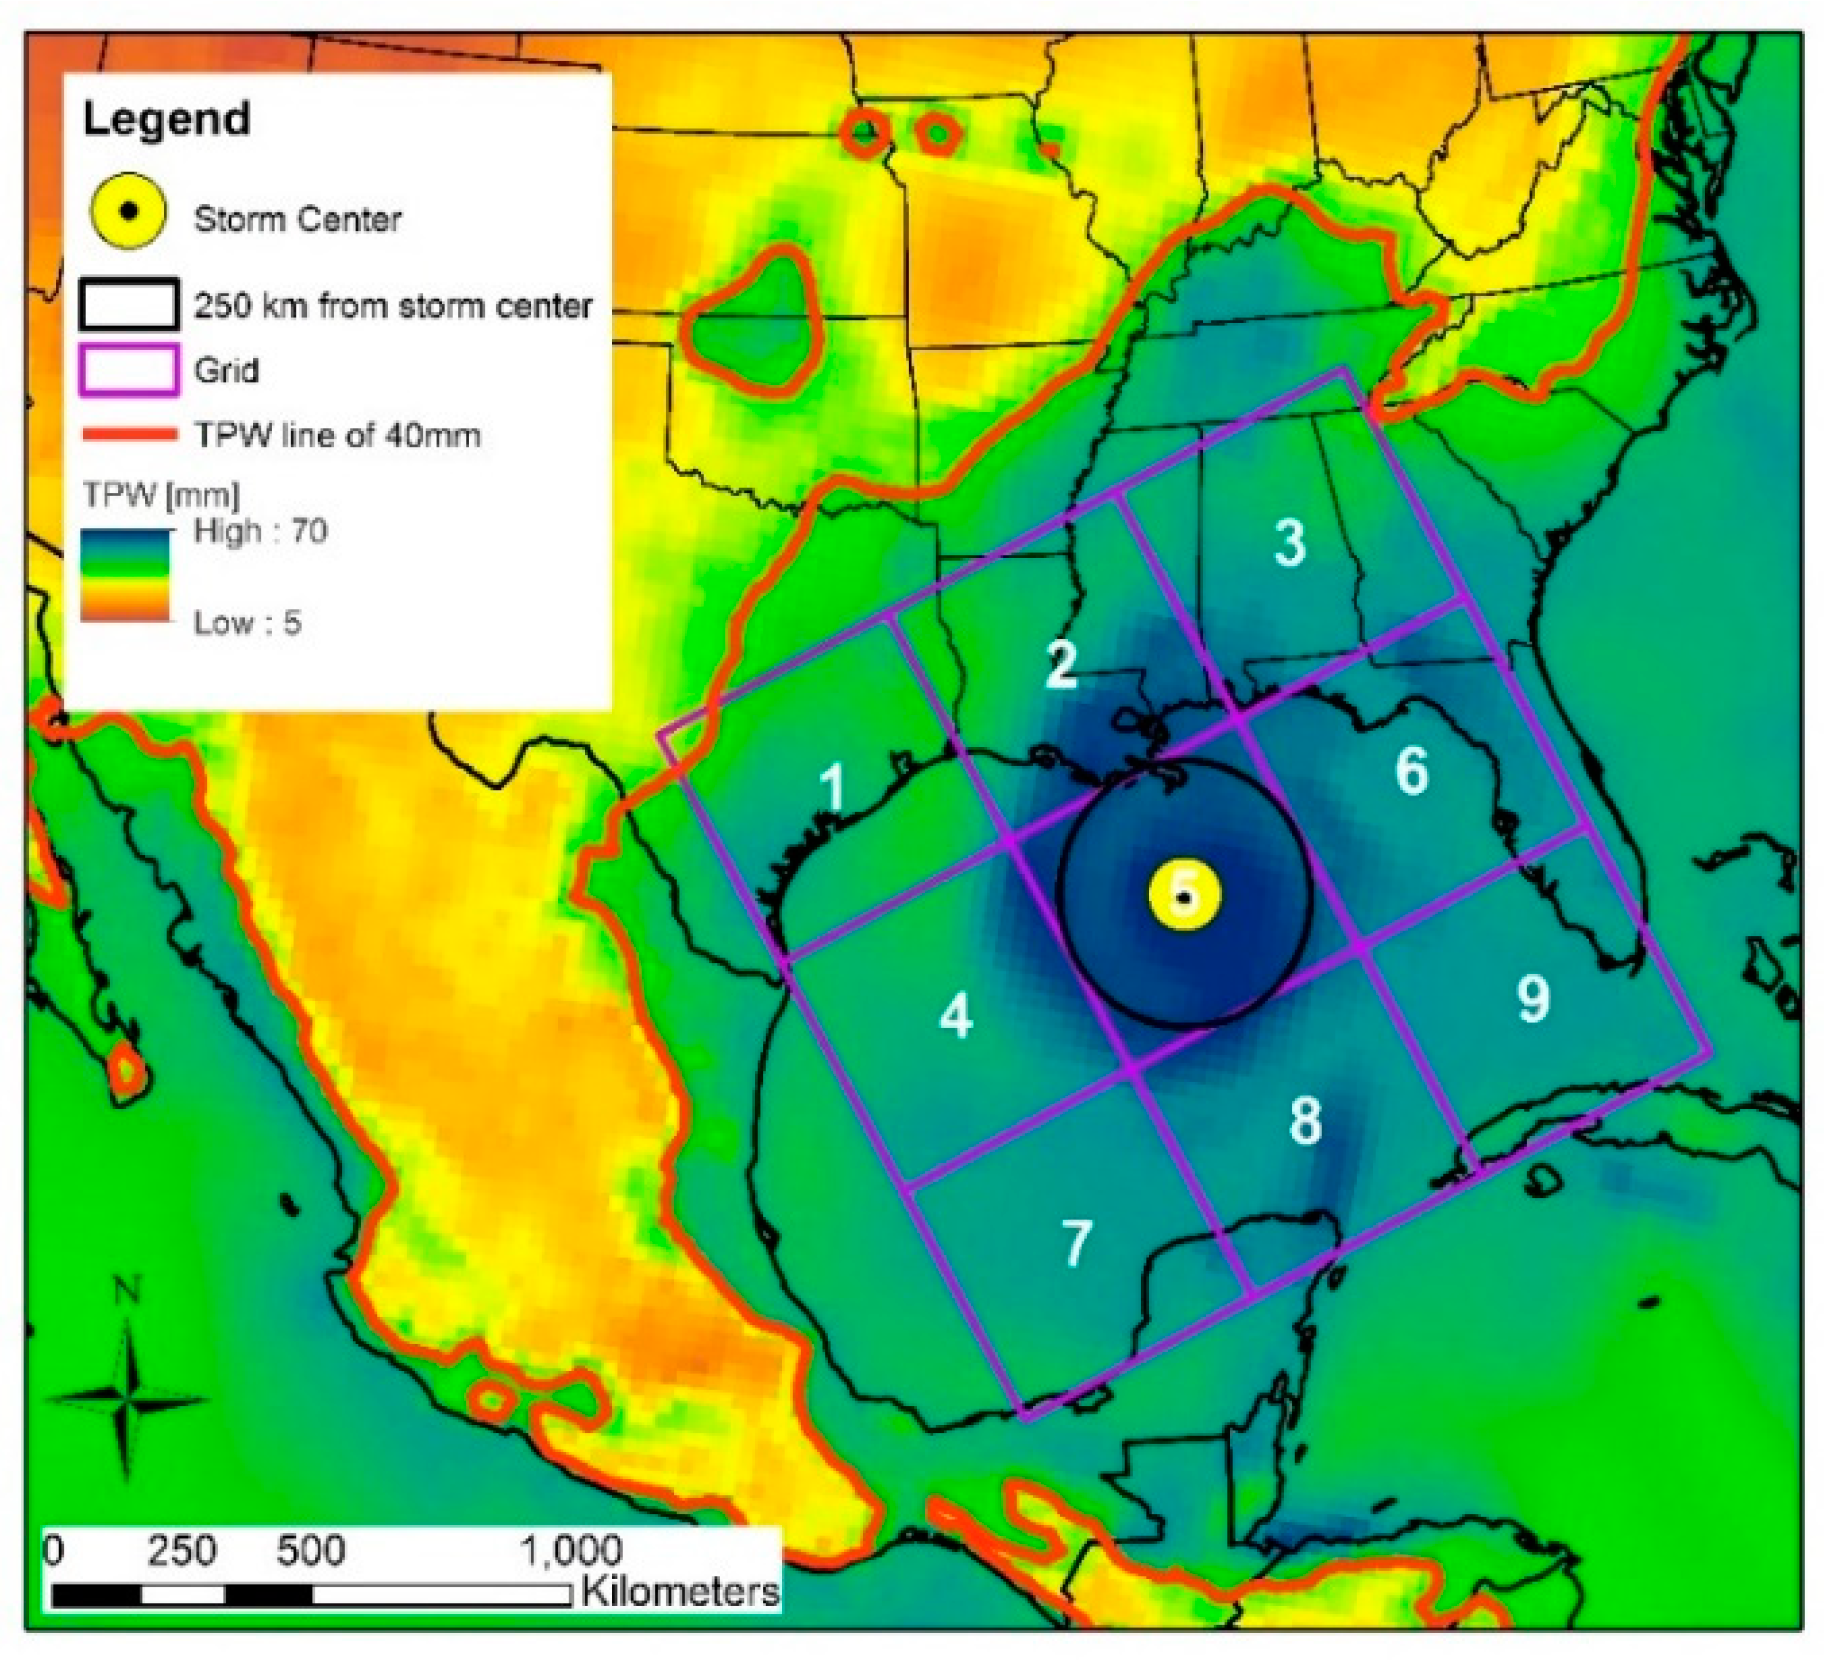
We next measured the TPW around each TC. Trenberth et al. [52] found that rainfall-producing weather systems typically gather water vapor from a distance approximately four times the radius of the precipitating region. Previous studies found that the average rain field extends 223 km from the storm center at the time closest to landfall [40] and 240 km from the storm center on the day of landfall [53]. Considering these results, we centered a 3 × 3 grid on the TC’s position and oriented it parallel to the storm’s trajectory. Each cell measured 500 × 500 km, which meant that moisture was measured 750 km away from the center over the shortest distance, and 1060 km along the diagonal distance (Figure 4). The grid cell in the upper left corner was labelled cell 1, while the TC center was in cell 5. A cell consisted of approximately 280 pixels, and values in cells 1, 4, and 7 (3, 6, 9) were averaged to determine the amount of moisture on the left (right) side of the TC. The amount of TPW was measured at t00, t03, t06, t09, t12, t15, t18, t21, and t24.
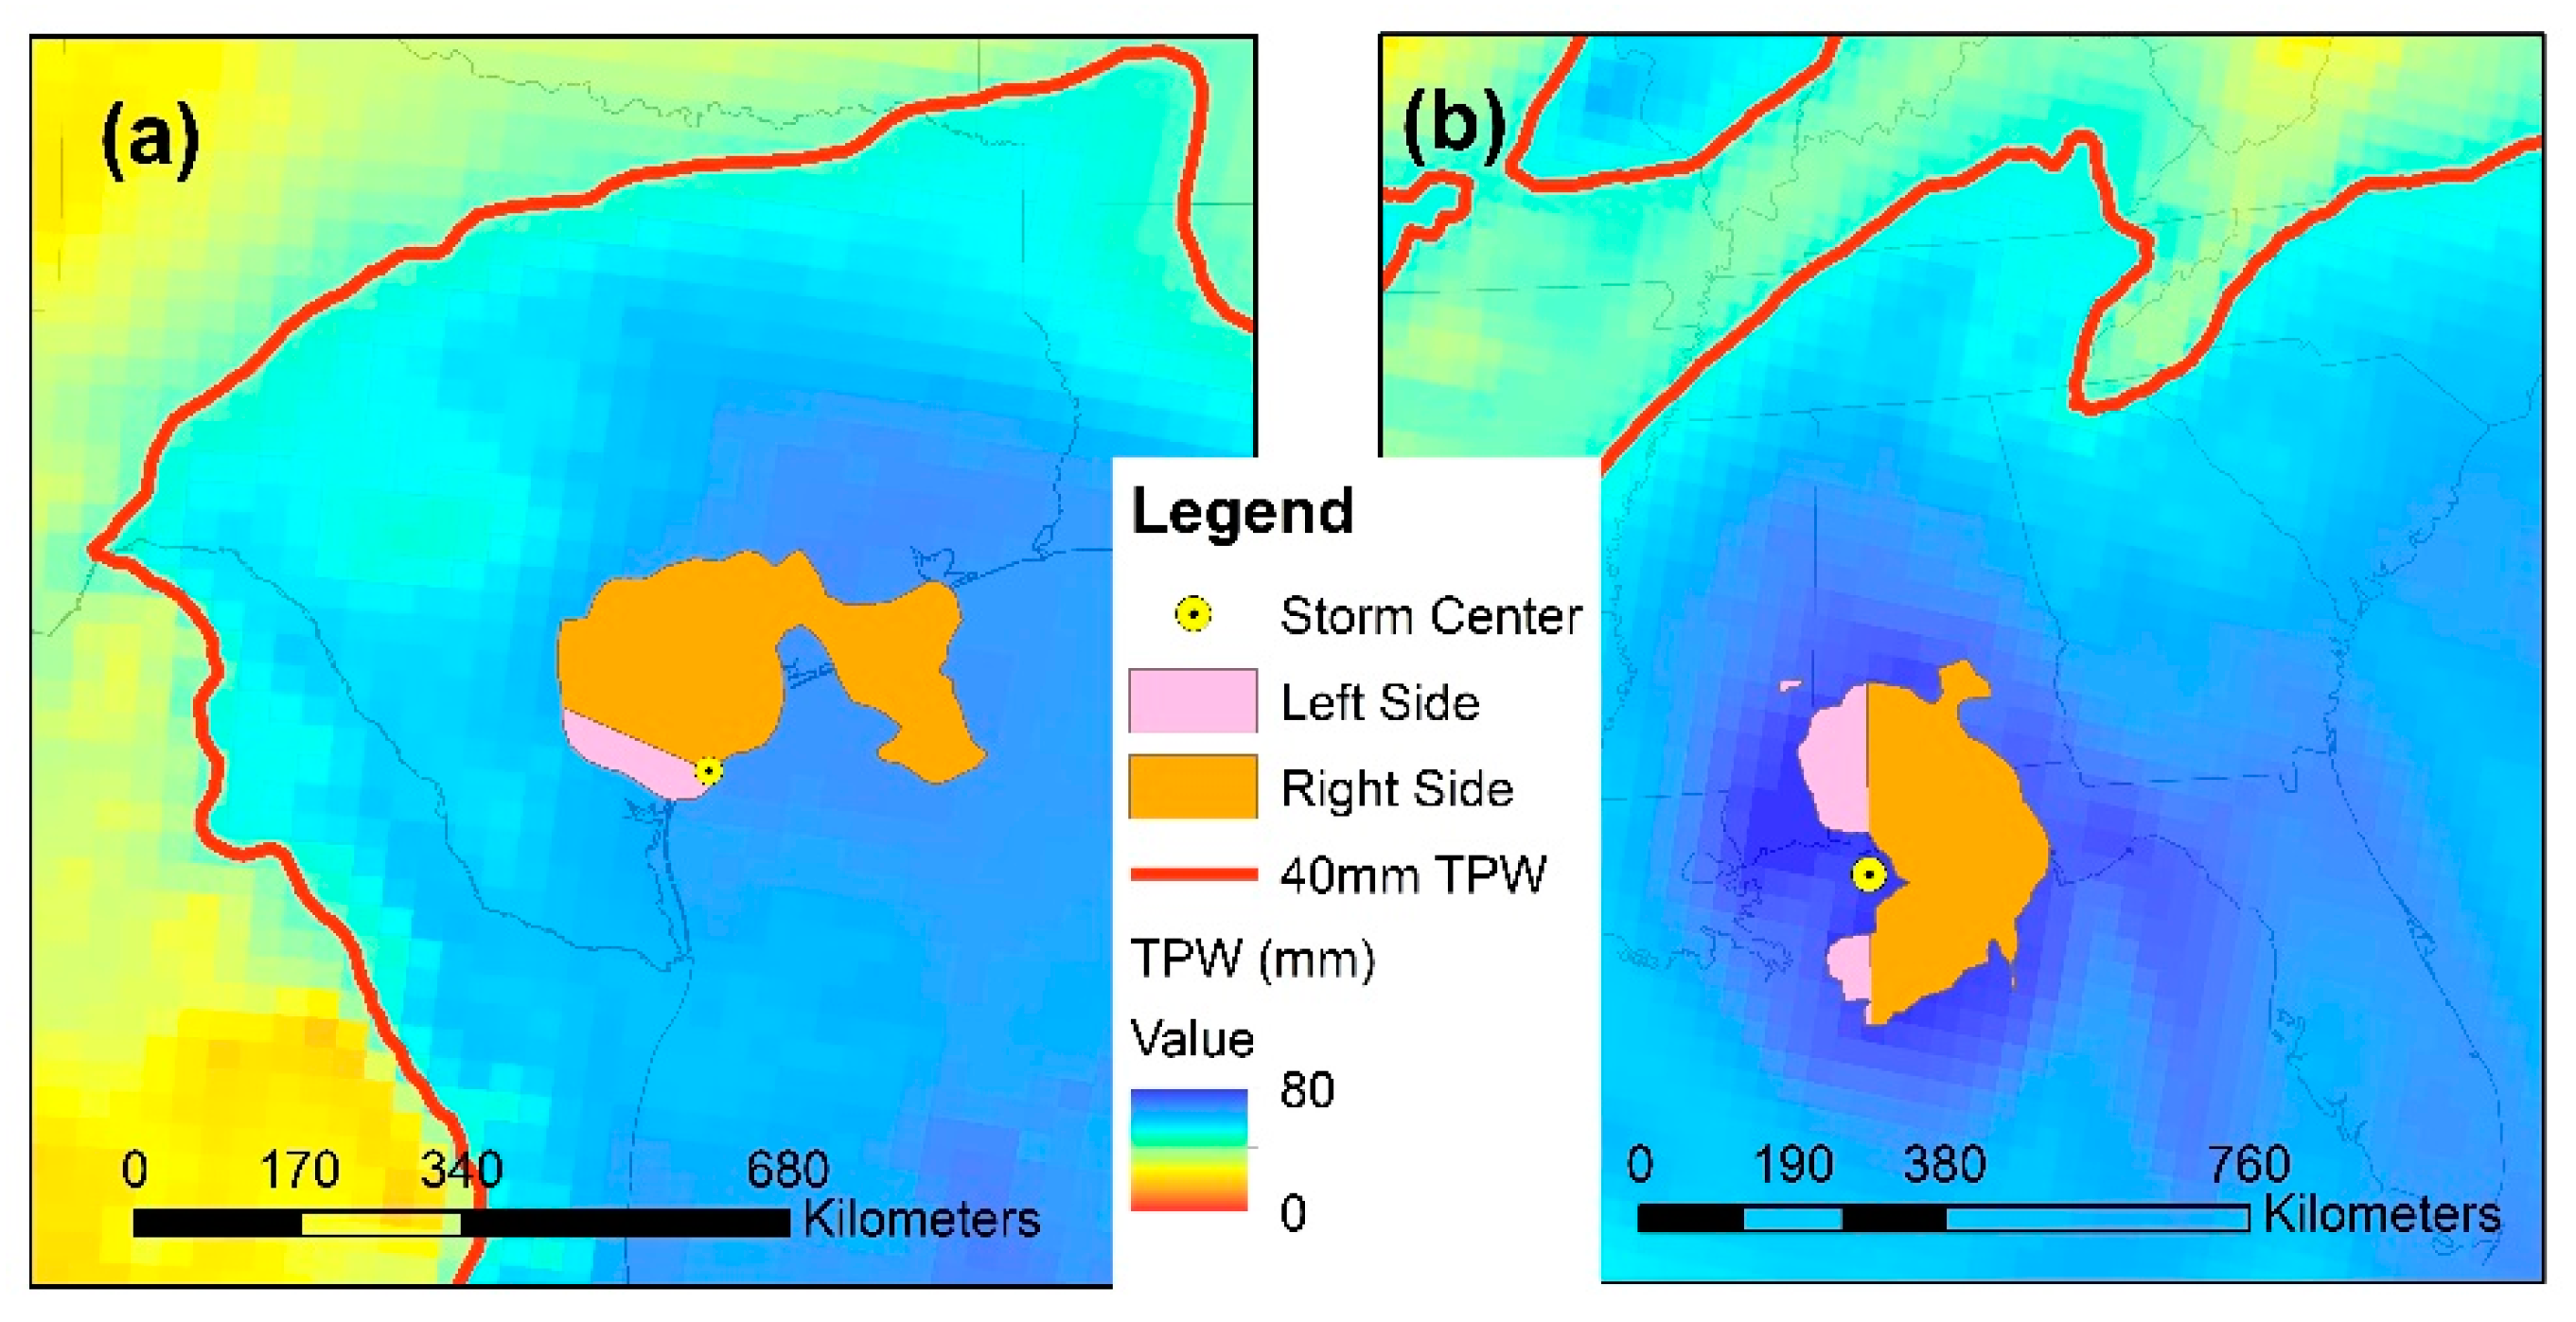
Previous studies have demonstrated that TPW values above 40 mm indicate that the environment is favorable for TC formation and heavy rainfall [54,55,56]. Therefore, a GIS was used to contour the TPW values, and the shortest distance between the 40 mm contour and TC center was measured to determine how close the relatively dry continental air mass was to the storm center (Figure 5).
Next, we compared the distribution of the volumetric rainfall at t00 and TPW conditions in the preceding 24 h to examine how moisture conditions varied among the three groups. If less moisture existed on the left side of the storm (cells 1, 4, 7) than the right side (cells 3, 6, 9), there should be less rainfall on the left side of the storm than on the right side, or an AR pattern, with the opposite moisture distribution resulting in an AL pattern. If the amount of moisture on either side was not different, storms should produce symmetrical rainfall distributions. The continental air mass should be driest for Texas landfalls. Therefore, average TPW, distance to TPW contour line of 40 mm, and the amount of rainfall should be lowest in the western group. On the other hand, landfalls in the eastern region might have been more influenced by oceanic air masses due to Florida’s peninsular shape. Therefore, average TPW, distance to TPW contour line of 40 mm, and rainfall should be highest for TCs in the eastern group when ET cases are not considered.
Finally, we analyzed the angle difference between the directions of storm motion and vertical wind shear at t00 and associated this angle to the distribution of rainfall. The need for this analysis is supported by the work of [57], who showed a statistically significant relationship between where rainfall occurred and the angle between vertical wind shear and storm motion. Time lags between the onset of wind shear and asymmetries in rainfall were not considered because [58] revealed that a lag less than six hours exists between them. The angle between the vectors of storm motion and vertical wind shear were calculated for each storm by subtracting the motion vector from the shear vector. If the angle of vertical wind shear was different from the angle of storm motion between 315° and 45° or 135° and 225°, the vortex of storms would tilt ahead of or behind the direction of storm motion. Therefore, the rainfall should be distributed ahead of or behind the storm symmetrically, creating the S pattern (Figure 6b). If the angle of vertical wind shear was different from the angle of storm motion between 45° and 135°, the rainfall should exhibit an AR pattern because the direction of wind shear was toward the right side of storm motion, and the vortex of the storm tilted to the right side producing more rainfall on the right side (Figure 6c). If the angle of vertical wind shear was different from the angle of storm motion between 225° and 315°, the storms should have an AL pattern because more rainfall could be produced on the left side due to the tilt of the vortex (Figure 6a). If the shear speed did not exceed 5 m s−1, the motion component should be more influential than shear and thus an AR pattern should occur.
To test hypotheses, we employed Mann–Whitney U tests which are designed to determine whether two samples came from the same population. We selected this nonparametric test as our data were not distributed normally and group sizes were smaller than 20 observations. Observations were pooled within each group and each group was compared to the other two groups. We tested TPW on the right and left sides of the storm, distance to 40 mm contour, and angle between vector of shear and storm motion. The null hypotheses were that conditions did not differ between the groups, and a p-value < 0.05 was required to reject the null hypotheses. We report the p-values in a series of tables. We also calculated group median values to determine which group contained higher or lower values.

4. Results

4.1. Rainfall Patterns

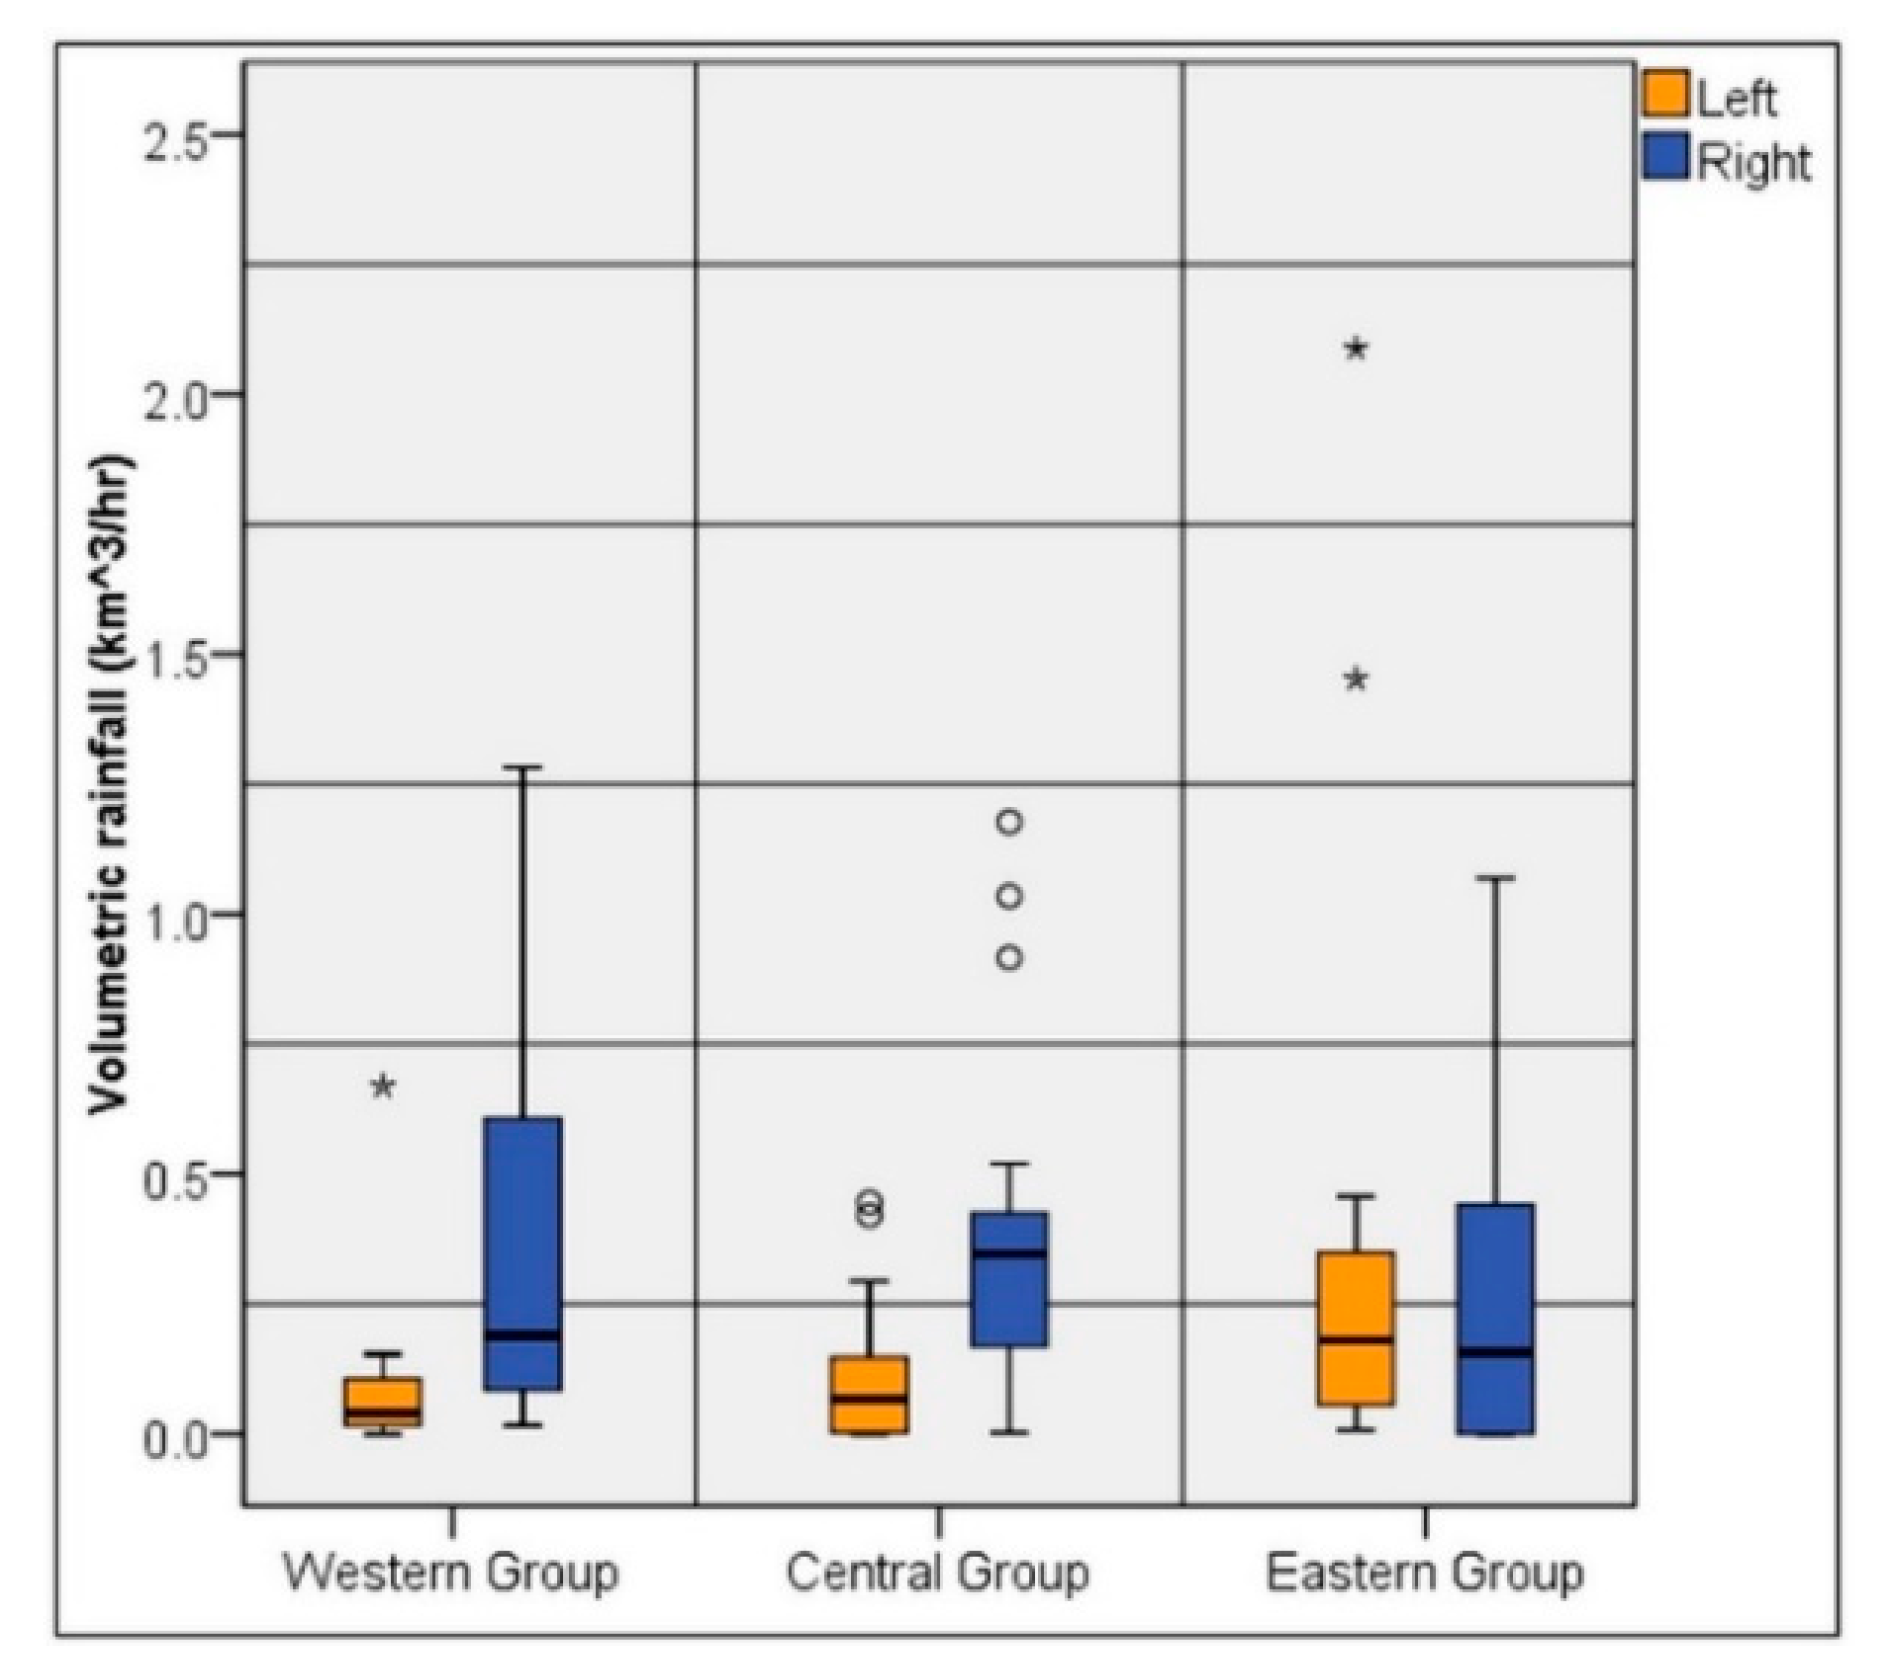
The averaged total volumetric rain over the area where the rain rates equaled or exceeded 5 mm hr−1 increased from west to east as expected. When the averaged volumetric rain on the left and right sides of each TC were compared within groups, the eastern group revealed a different pattern than the other two groups. In the western and central groups, a significant difference (p-values = 0.01) occurred in rainfall on the left and right sides of the storms, with more rainfall on the right side (Figure 7). Most cases in these groups exhibited the AR pattern (Figure 8). In the eastern group, the amount of rain on the left and the right sides did not differ significantly (p-value = 0.60), which should mean that most storms had a symmetrical distribution. However, 50% of storms had AL patterns (Figure 8) likely due to the ET process, which is discussed more below.

4.2. TPW Conditions

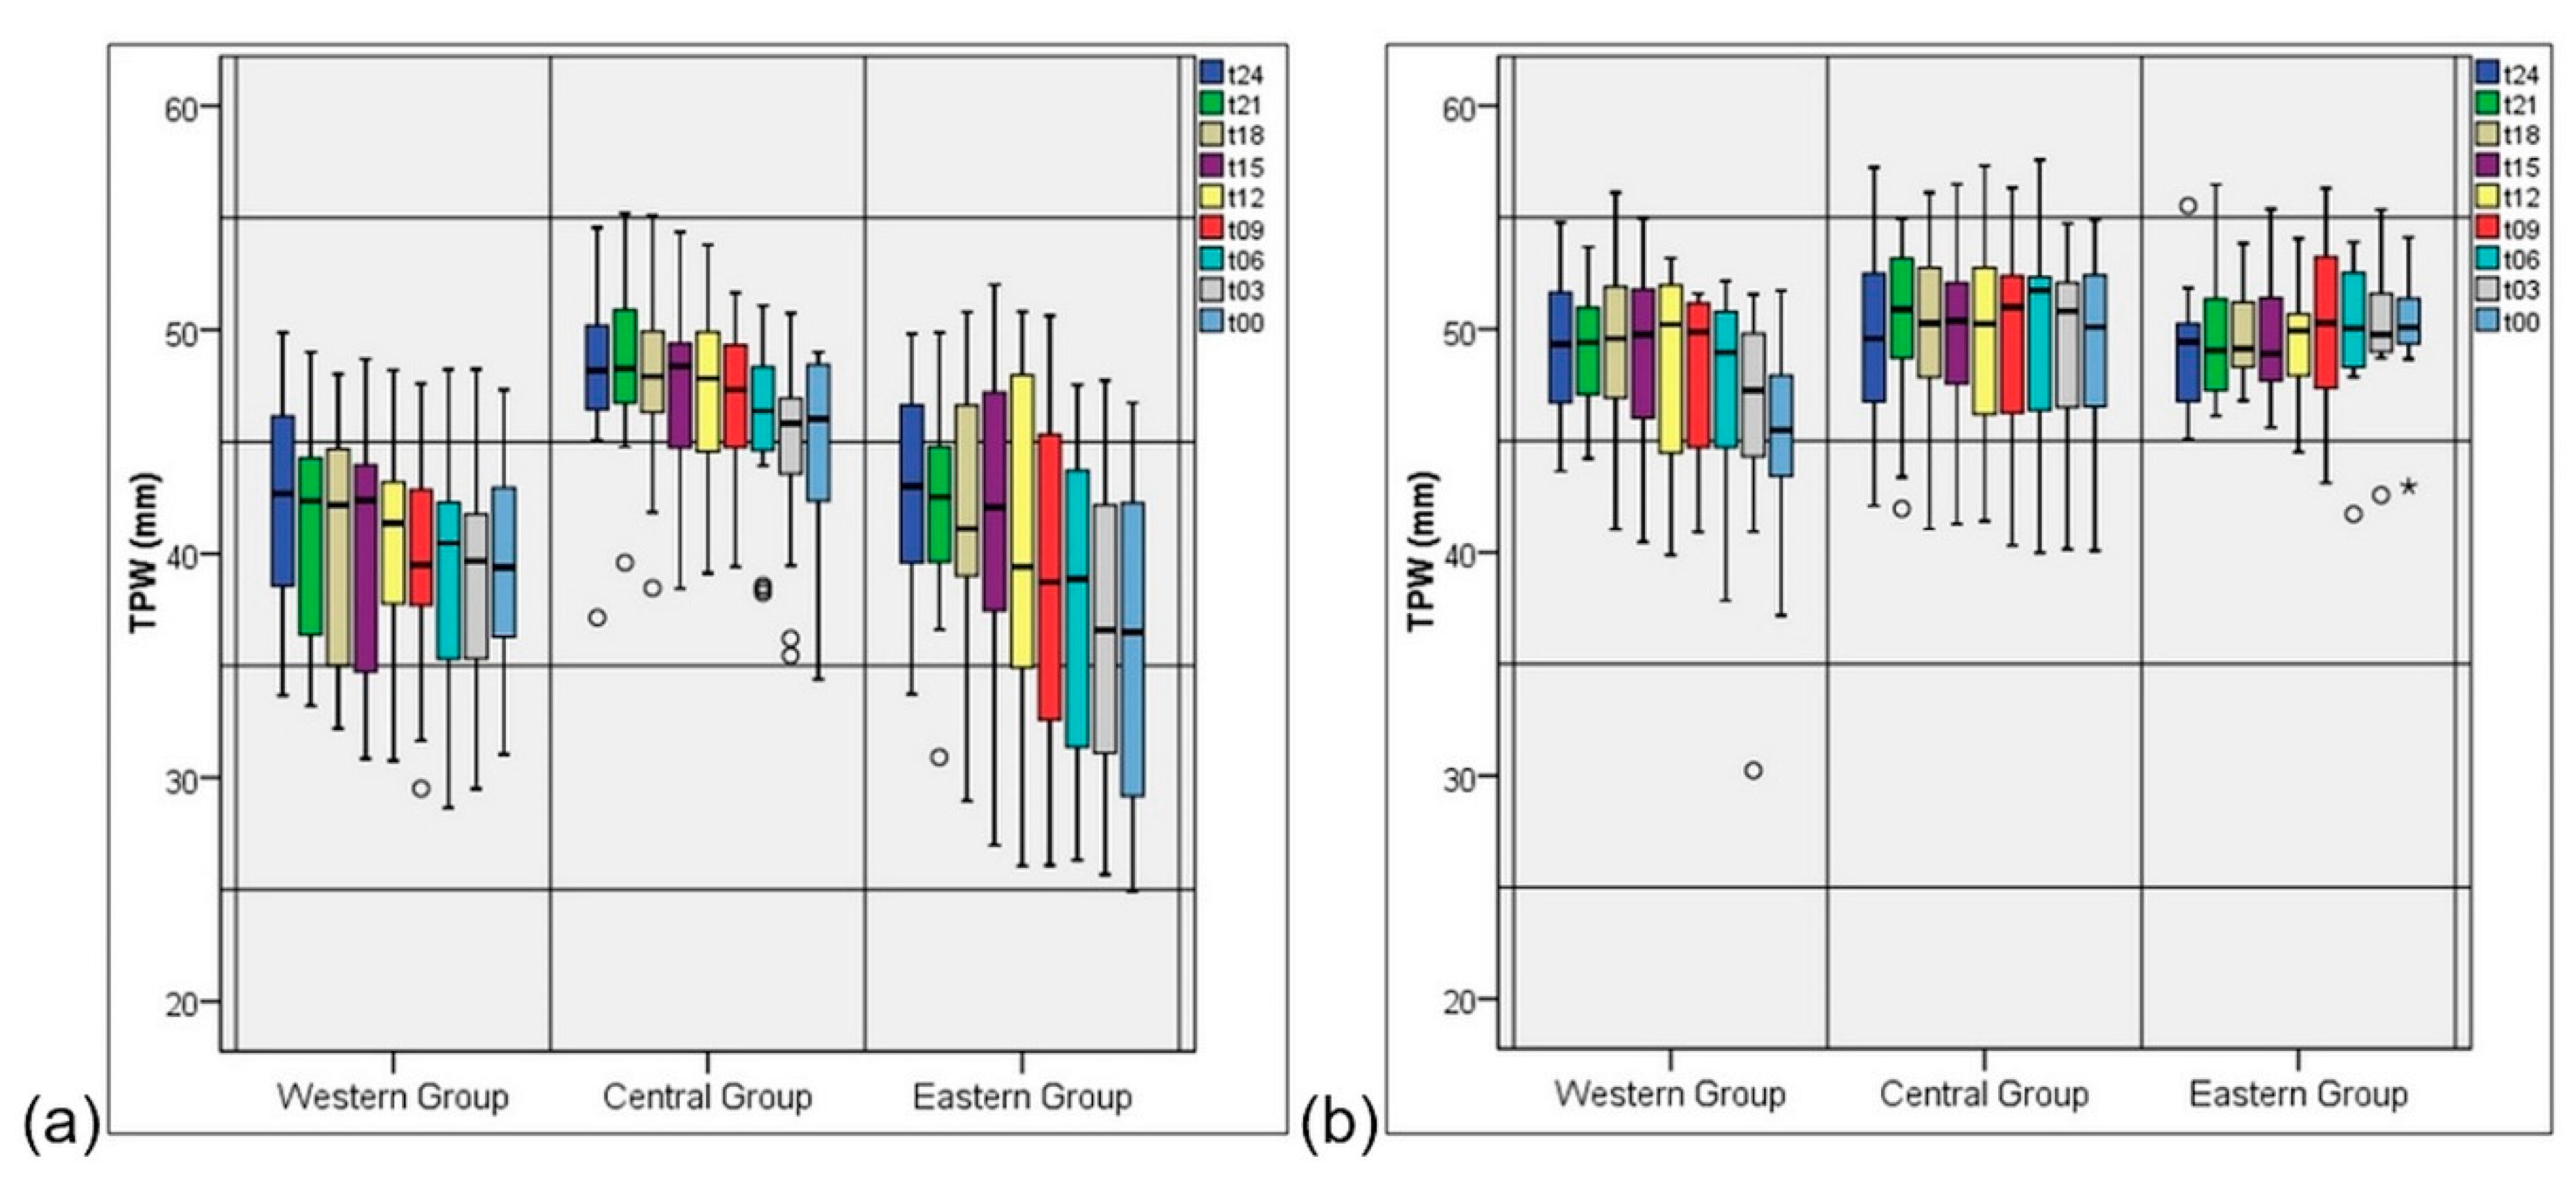
In the day prior to landfall, TPW averaged for the eight grid cells surrounding the TC center decreased in all regions as the grid moved deeper into the continental air mass. While TPW values typically remained near 50 mm on the right sides of the TCs (Figure 9b), the left sides saw lower values that decreased as landfall time approached (Figure 9a). The sharpest decrease occurred on the left sides of the eastern group TCs. Tests showed that similar values occurred on the left sides of the western and eastern storms, but the central group had values that differed significantly compared to the other groups (Table 4), and these values were higher. Values on the right sides of the TCs were similar across all three groups until landfall (Table 4).
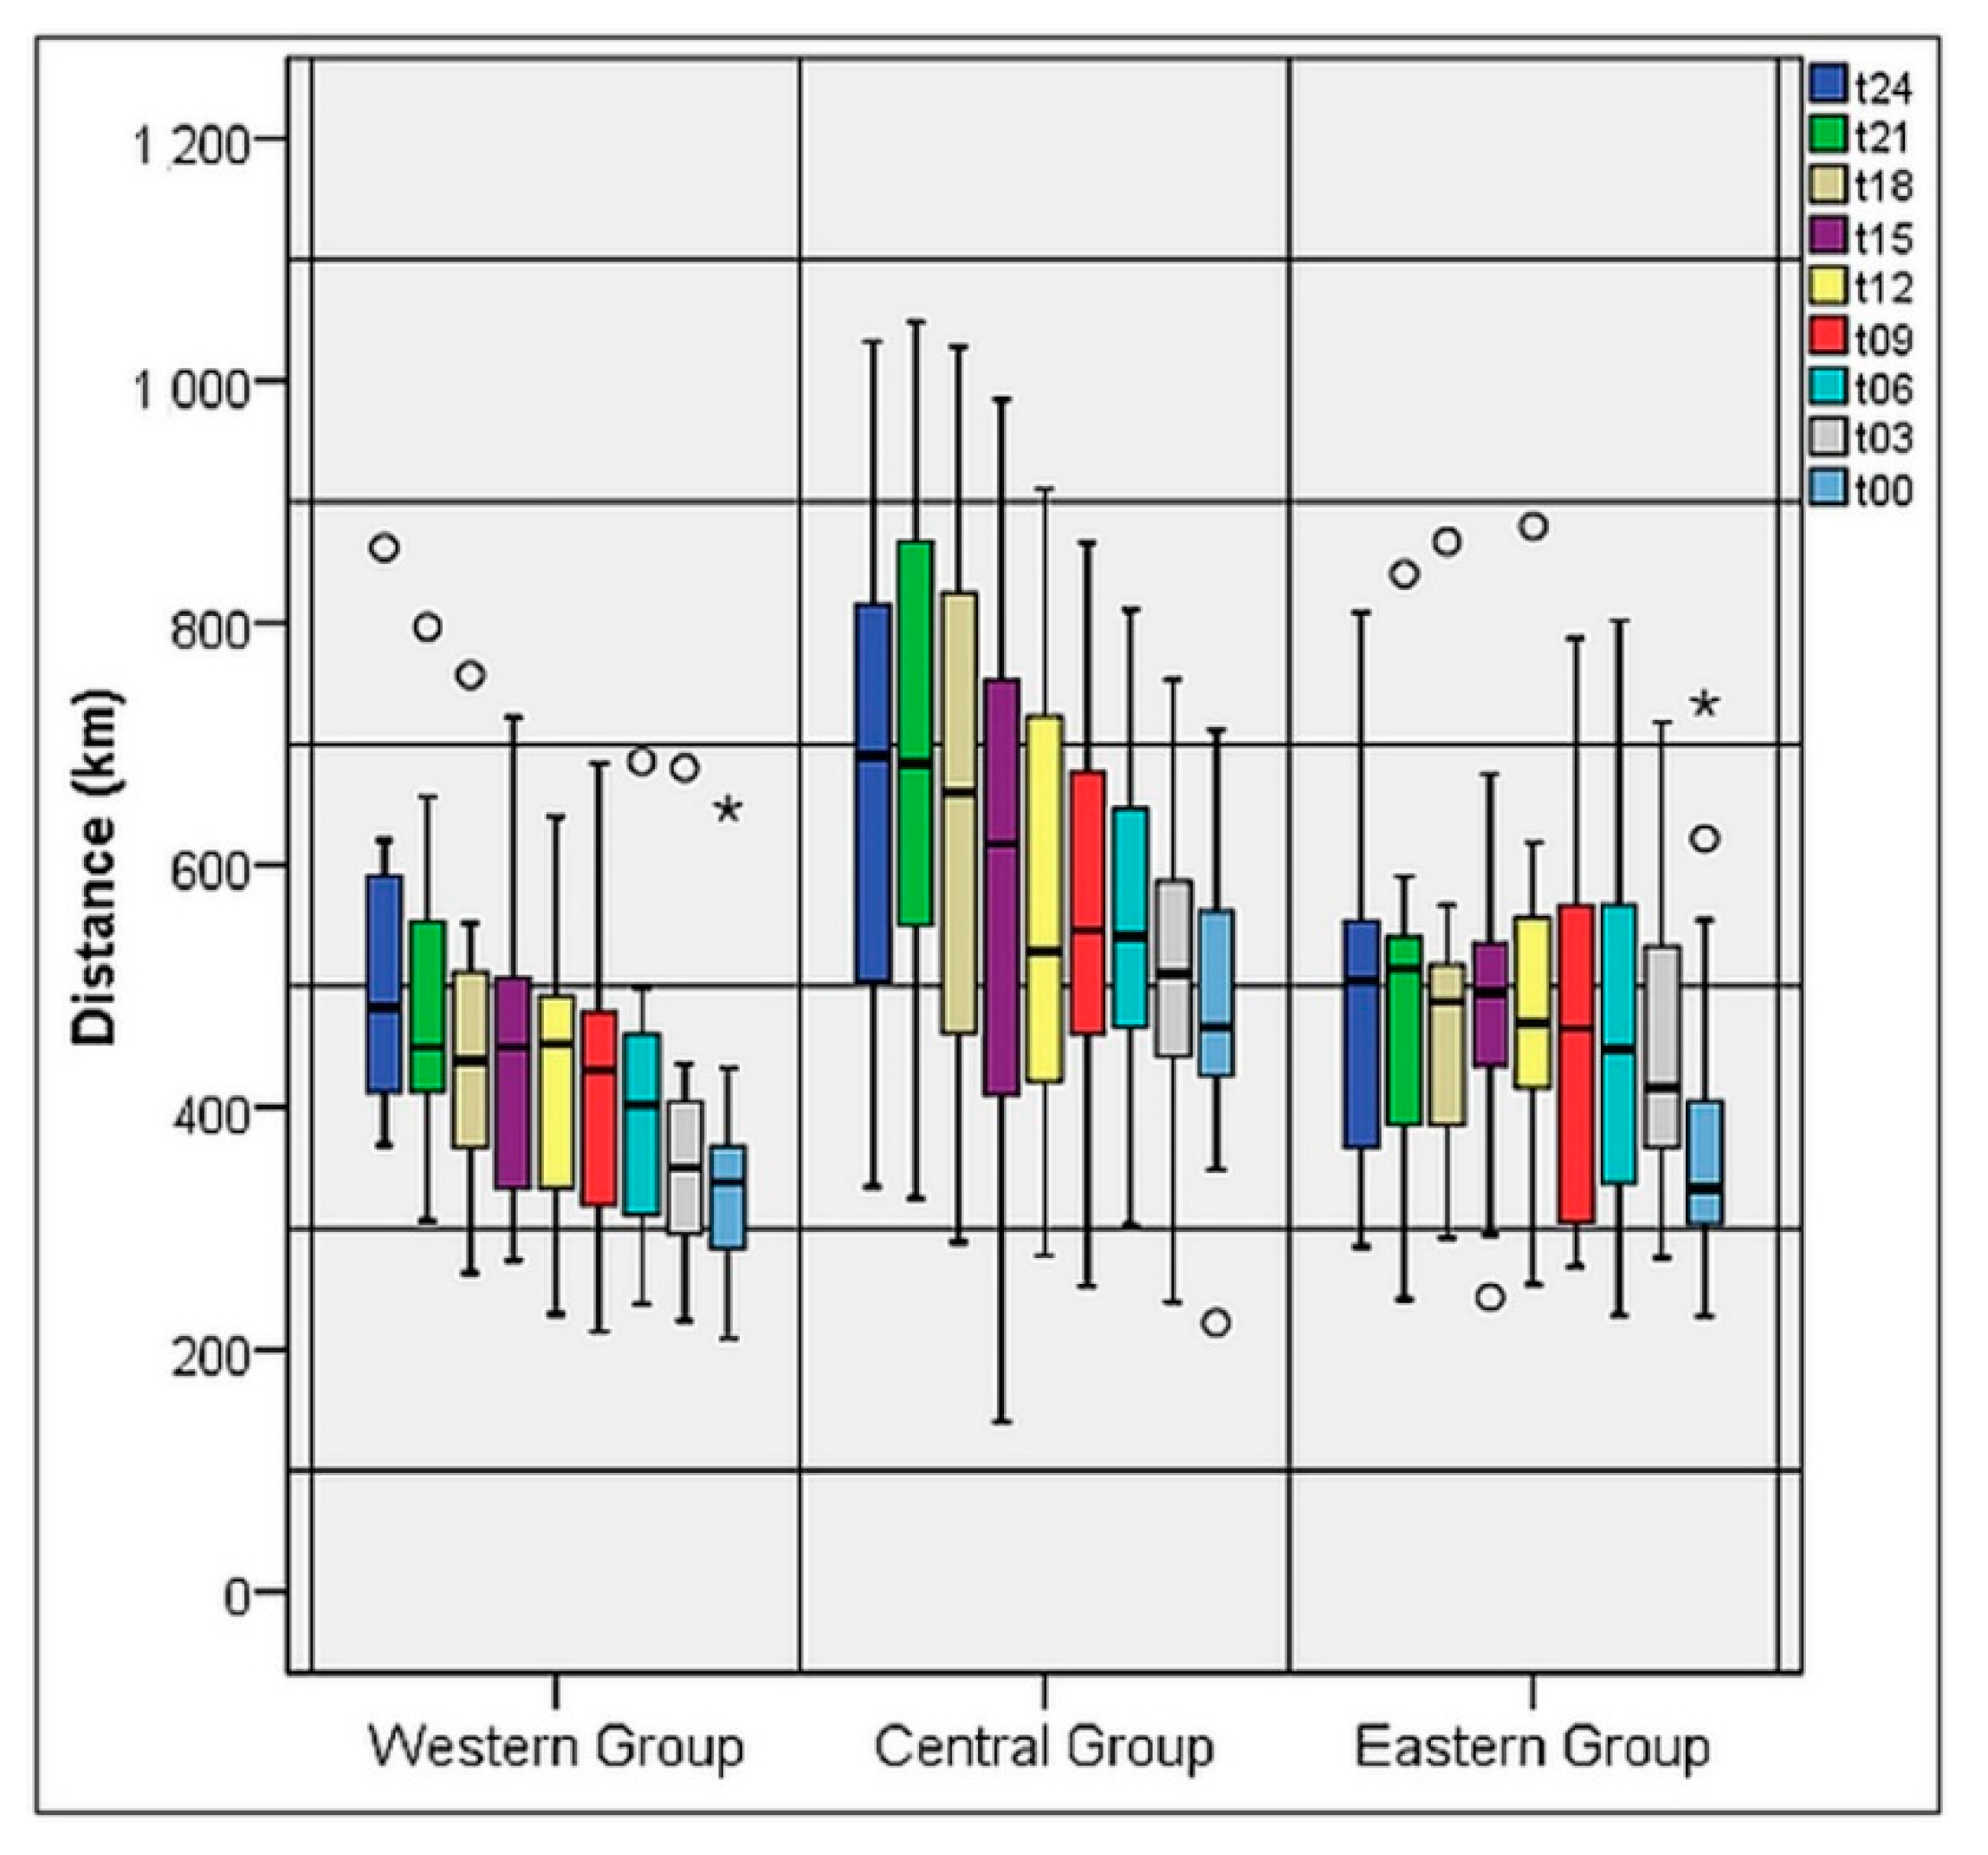
In the western group, the nearest edge of the 40 mm value of TPW occurred in cells 1 or 4 in nine cases, and the distance to the TPW contour line of 40 mm averaged 521 km at t24 and 349 km at t00, yielding the lowest averaged TPW values among the three groups. The amount of TPW on the left side of the storm likely decreased due to the North American Cordillera, which can block the influx of low-level moisture supply to TCs [36,37]. The position of the dry air mass was confirmed via surface analysis weather maps from NOAA on the day of landfall. However, moisture on the right side remained consistent, likely due to the advection of the oceanic air mass from the Gulf of Mexico. As a result, the amount of TPW on the right side was significantly higher than that on the left side (Figure 9, Table 5), supporting the finding that 9 of 12 TCs in this group exhibited the AR pattern. The lone AL storm had a distance to the TPW contour of 265 km which could be close enough to enhance precipitation. Hurricanes Claudette and Ike had symmetrical distributions of precipitation.
In central group, TPW values were the highest on both sides among the three groups (Figure 9). Values were not significantly different on either side of the storm until nine hours before landfall (Table 5). In addition, the average distance to the 40 mm contour line was much larger for TCs in the central group (Figure 10) than for other TCs, averaging 675 km at t24 and 490 km at t00. This result suggested that either the storms were embedded in a larger pool of moisture, or that the continental air mass was not as dry as it was for the other groups. It should also be noted that the outer reaches of the grid boxes did not encounter as much land on either side as did the other groups due to the width of the Gulf of Mexico. More symmetrical TCs occurred in this group (five) than in the other two groups combined (three), but the remaining eleven cases had the AR pattern. TCs at tropical storm intensity tended to have AR patterns as would be expected due to the weaker advection of moisture around the circulation center. Hurricane Cindy exhibited the AR pattern, but the 40 mm TPW contour line was on the right side at 349 km, which would support the uplift of moisture and precipitation formation on the right side. Hurricanes Katrina, Gustav, and Isaac had S patterns.
In the eastern group, the distribution of TPW between the left and the right side was significantly different from t24 until t00, suggesting that the rainfall should be distributed in the AR pattern (Figure 9, Table 5). However, the TPW contour line of 40 mm was located much closer to the storm center on the left (16 cases) than the right side (1 case) at an average distance of approximately 483 km at t24 and 389 km at t00, which was likely due to the fact that most storms completed an ET (Table 3). This process can take 0–168 h according to [59], although most TCs in their study transitioned in 36 h or less. In the current study, Gabrielle (2001) had a distance to the 40 mm contour of 346 km, more rainfall on the left side (Figure 10), and completed ET 114 h after landfall. However, Gabrielle had a 168 h transition period, so it was in transition at the time of our analysis. On the other hand, Mitch (1998) completed its ET 6 h after landfall and its transition took 36 h, indicating it was closer to completing the process than Gabrielle. In many cases, the contour line represented a frontal boundary as confirmed through inspection of surface analysis weather maps from NOAA on the day of landfall. Therefore, in contrast to the expected AR pattern from TPW distributions around storms in the eastern group, the frontal boundary or trough could be a focusing mechanism to trigger an AL pattern during the ET process. In fact, five of seven AL cases completed an ET in an average of 17 h after landfall. Furthermore, we examined the radius of the outermost closed isobar (ROCI) from the IBTrACS database as a measure of storm size as some cases were below tropical storm intensity and thus did not have a radius of gale-force winds. We found that for all of the AL cases except for Henri (2003), a TC with few regions of high rain rates, the 40 mm contour was positioned within the ROCI, supporting the idea that the boundary was close enough to the storm’s circulation to influence rain rates.
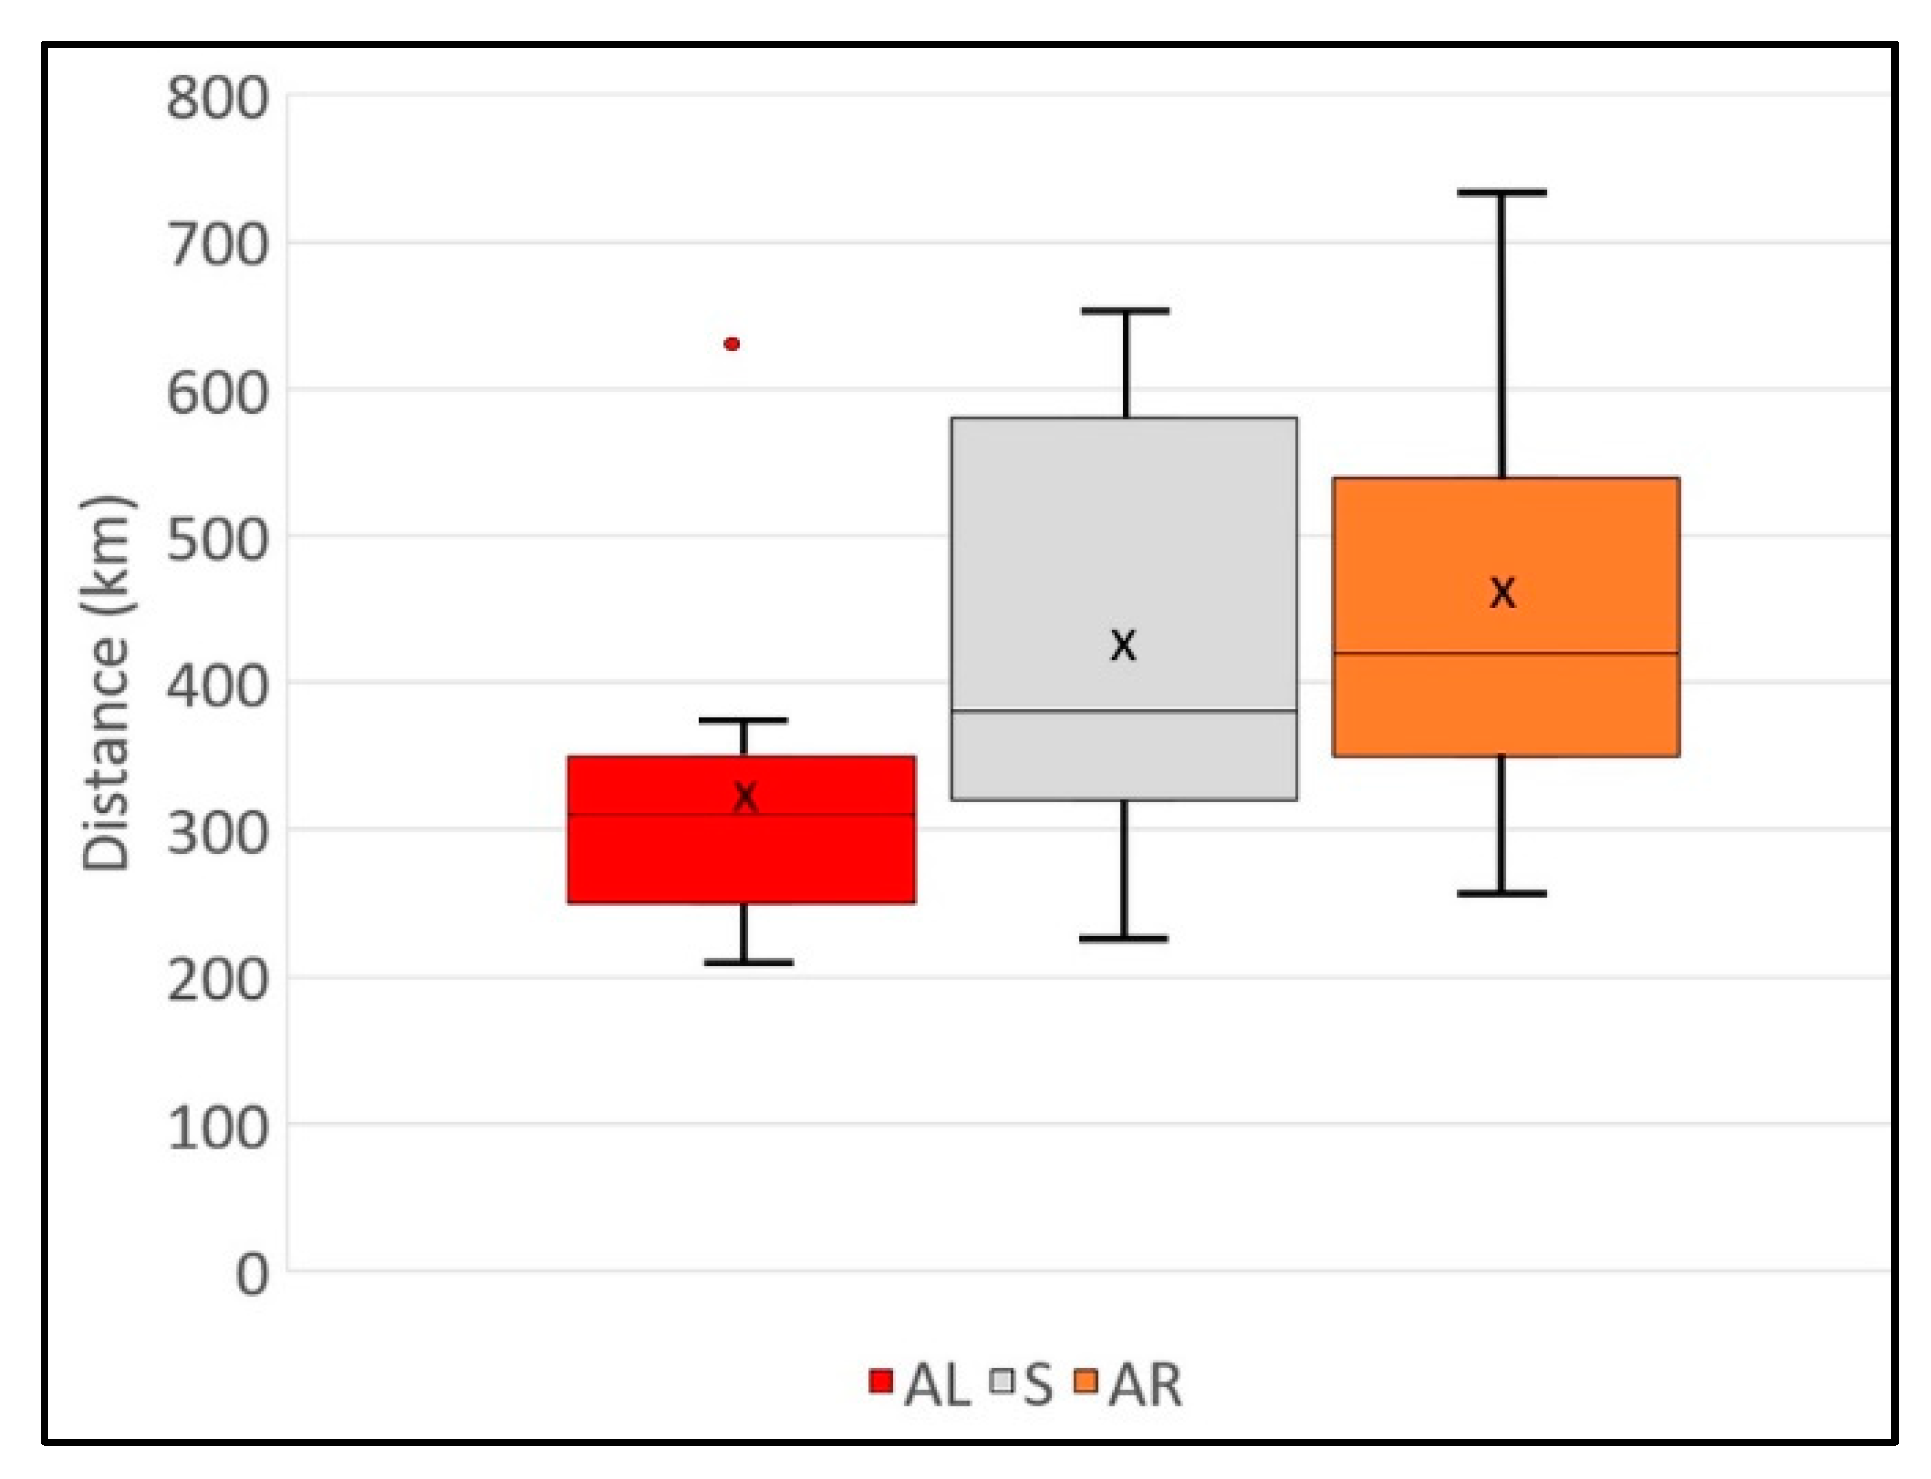
From the analysis of the distance to the TPW contour line of 40 mm for the rainfall distribution patterns of 43 storms, the values for the storms that had AR or S patterns were clearly larger than for the storms with the AL pattern (Figure 11), with an average around 305 km. When a trough or a frontal boundary approaches from the left side of the storm, they bring a cooler and drier air mass from the middle latitudes. The cyclonic motion of air flow associated with a TC can transport the moist and warm tropical air mass to converge with this somewhat cooler and drier air mass in the left front quadrant of the TC. This process of interaction between two different air masses generates an advection for uplift and more rainfall in the region, producing an AL pattern, and the distance of 275–350 km may serve as a threshold for the interaction to affect rainfall asymmetry as seven of eight AL cases had distances ranging 242–346 km. The two cases with the lowest distance to the 40 mm contour (190 and 228 km) displayed a symmetrical precipitation distribution. This could be due to the moisture gradient being located so close to the storm center that it does not allow enough precipitation to form on the left side to produce the AL pattern. We found that in 16 cases, the 40 mm TPW contour fell within the ROCI, suggesting that the moisture gradient represented by the line was close enough to interact with the TC’s circulation.

4.3. Vertical Wind Shear and Storm Motion

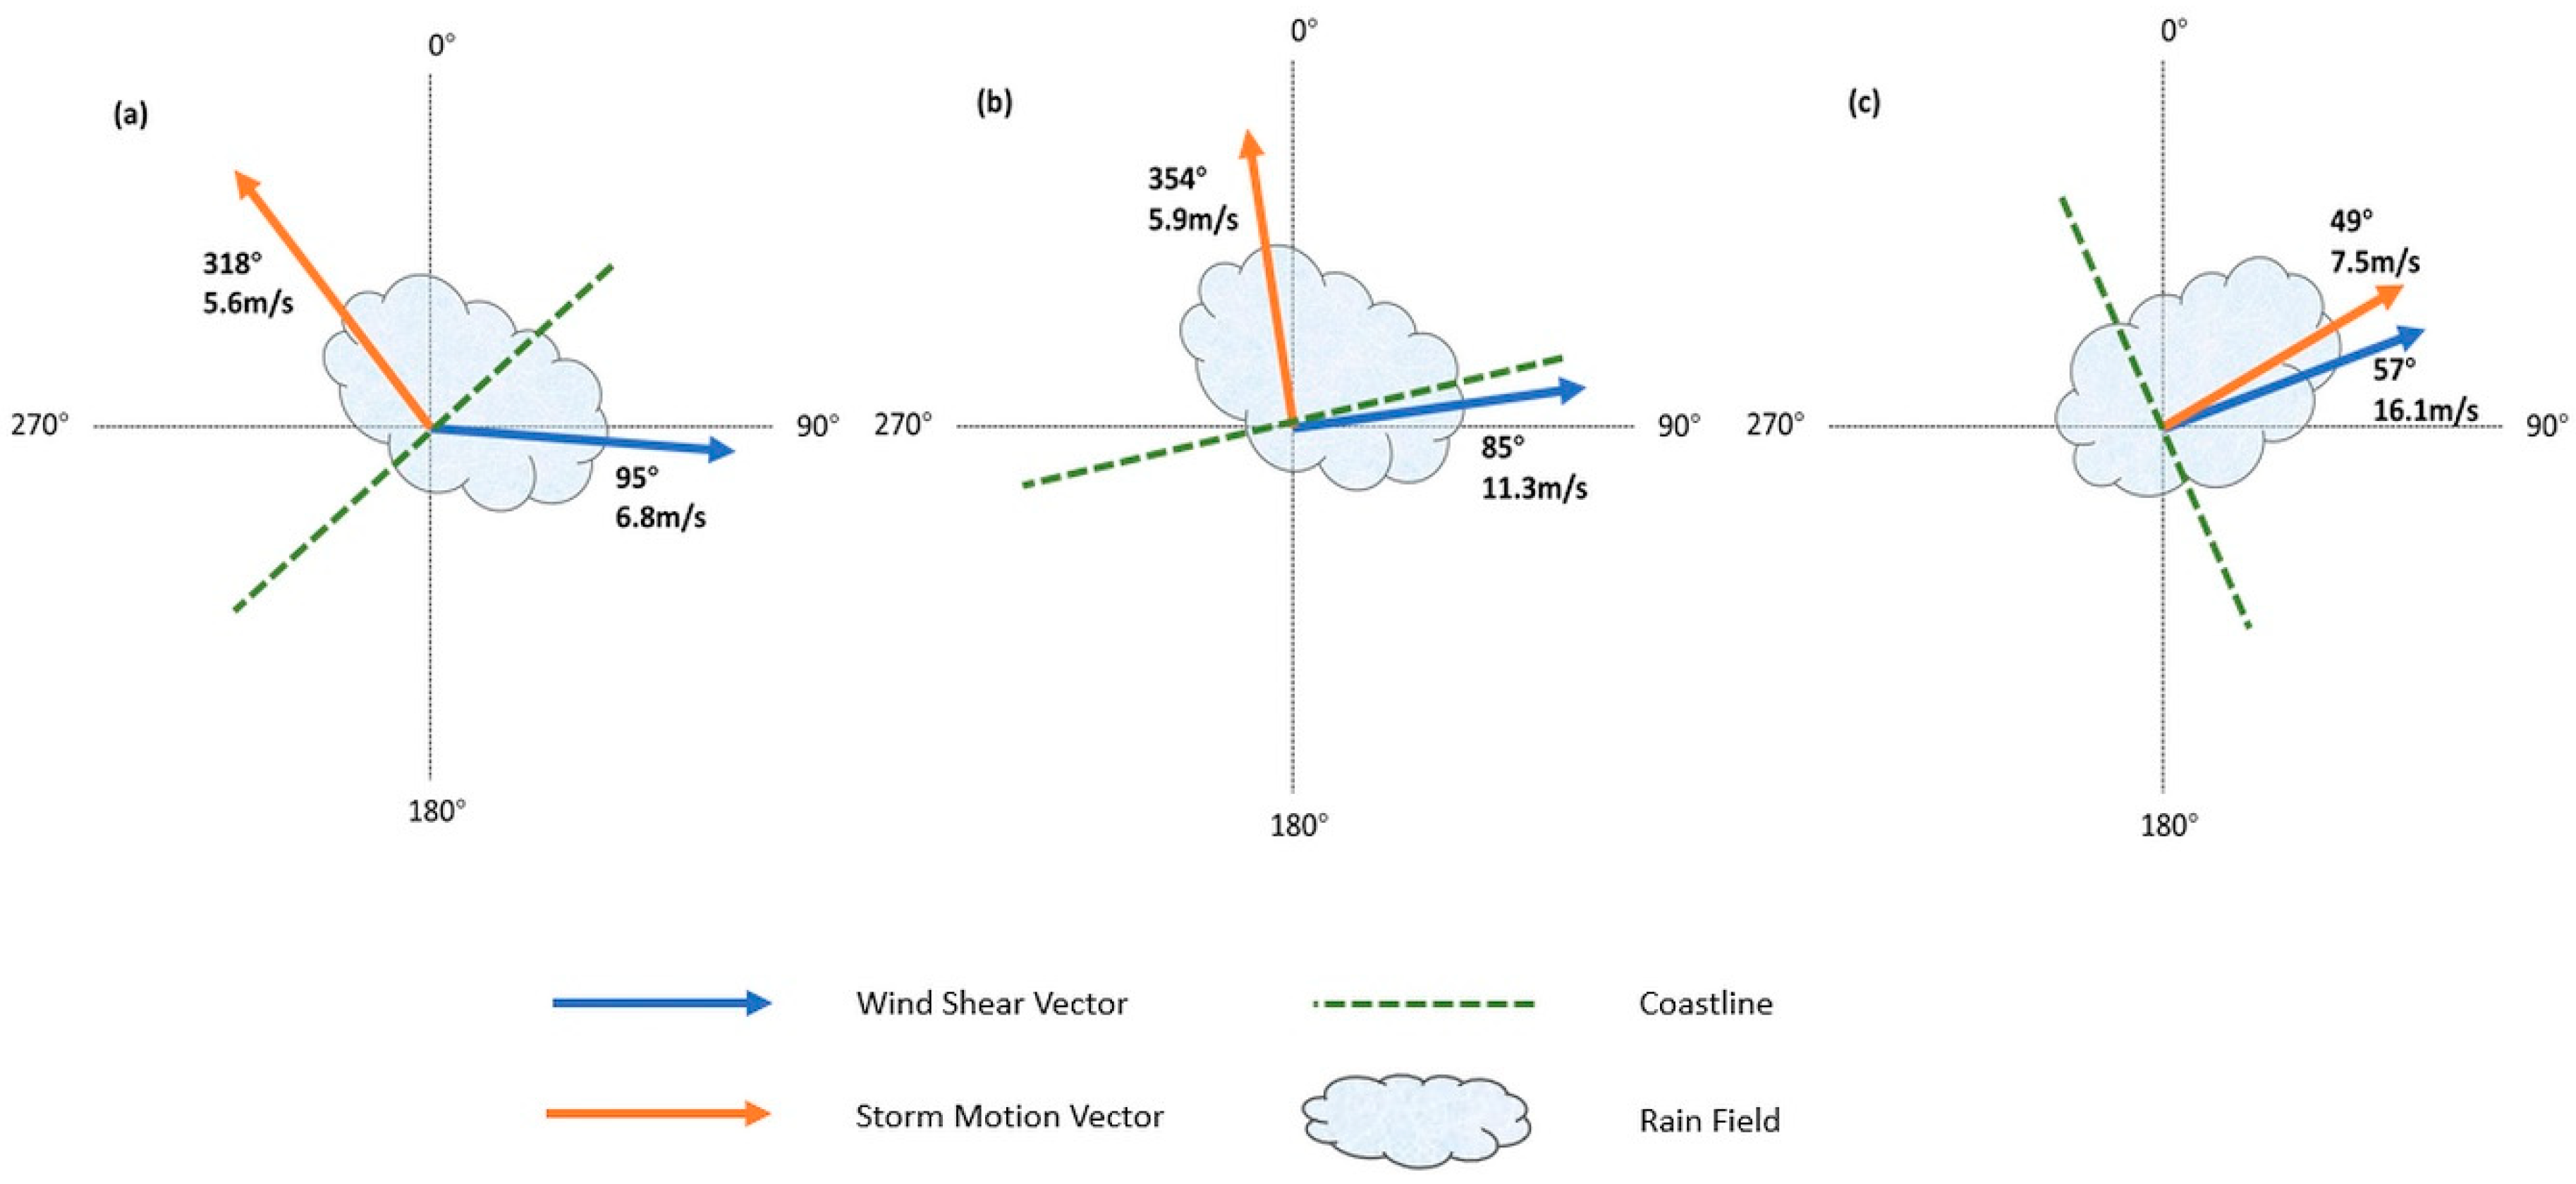
Shear and storm motion vectors at t00 were analyzed next. Vertical wind shear (storm motion speed) increased from west to east with averages of 6.8 m s−1 (5.6 m s−1) for the western group, 11.3 m s−1 (5.9 m s−1) for the central group, and 16.1 m s−1 (7.5 m s−1) for the eastern group. There were 39 storms among the 43 that had shear values exceeding 5 m s−1, a threshold established by [8] to influence more rainfall in the downshear quadrants. The four weak-shear cases produced one S, one AL, and two AR rain field distributions.
When vectors of vertical wind shear and storm motion were compared regionally, a statistically significant difference existed between vectors in the western and central groups (p-values < 0.01). We developed a diagram (Figure 12) to display the averaged vectors of vertical wind shear and storm motion for each group that also includes an averaged coastline and estimated position of rainfall corresponding to dominance of the AR patterns in the western and central groups, but a more even distribution among the three categories for the eastern group. As the averaged vertical wind shear angle was 318° and averaged storm motion angle was 95°, the average angle difference was 137° for the western group (Figure 12a). Nine cases out of 12 TCs in this group exhibited the AR pattern as shown in Figure 8, suggesting that the rain field was mostly located in the downshear direction and on the right of the storm motion direction. For the central group, the angle difference of 91° existed between the averaged vertical wind shear vector and the averaged storm motion vector (Figure 12b), which also suggested that the AR pattern should commonly occur. It is shown that 12 cases out of 17 TCs in this group exhibited the AR pattern in Figure 8. Similarly, as seen in the western group, rainfall mostly occurred downshear and right of the storm motion vector. In both western and central groups, the AR pattern dominated, occurring in 75% and 71% of cases, respectively, and may have kept six hurricanes from producing S patterns. However, the angle difference was 8° between the averaged vertical wind shear vector and the averaged storm motion vector for TCs in the eastern group (Figure 12c). This alignment should produce rainfall ahead of center, which is the S pattern, and 13 of 14 cases should have this pattern if shear was the dominant factor shaping the rain fields. Yet only three cases had symmetrical precipitation patterns and all three were hurricanes at landfall. The combination of shear and motion vectors corresponded to the AR pattern produced by Fay (2008). Thus, only 29% of eastern group cases were influenced by the combination of shear and motion vectors (Table 6).

4.4. Rainfall Patterns by TPW, Vertical Wind Shear, and Storm Motion

The combined TPW and vertical wind shear conditions suggested that AR patterns should dominate in the western group and 75% did have the AR pattern including three hurricanes. There were two S pattern cases (Claudette 2003 and Ike 2008), and one AL pattern case (Edouard 2008). For Claudette and Ike, the rainfall pattern was matched well with TPW conditions as values were similar on either side of the storms during 24 h prior to landfall. Although Ike completed an ET 30 h post-landfall, the storm might not have interacted with a frontal boundary at t00 because the shortest distance to the 40 mm line of TPW was 647 km, which was likely too far away for the interaction to occur and shear was <5 ms−1. The AL pattern of Edouard corresponded to both the shear/motion analysis and the 265 km distance to 40 mm of TPW. In this group, 67% of rainfall patterns were explained by the TPW distribution with storm intensity and 67% were explained by shear and motion vectors (Table 6). Thus, both TPW and vertical wind shear are important for predicting the symmetry of rainfall here, with seven TCs being explained by the combination of moisture, intensity, and vertical wind shear/storm motion.
In the central group, TPW analysis suggested that the S pattern should dominate for eight hurricanes and the AR pattern should prevail for seven tropical storms. Wind shear and storm motion conditions suggested that 12 storms should have AR patterns. The rainfall analysis showed that the AR pattern dominated for 71% of cases. For these storms, the average speed of wind shear was 11 m s−1, which was considered strong (>10 m s−1) so that the shear component contributed to the rainfall distribution more than storm motion [8]. As a result, the rainfall distribution in 82% of TCs corresponded to vertical wind shear, including four hurricanes whose TPW patterns suggested a symmetrical pattern. Three hurricanes did advect enough moisture to produce the S pattern, and so did Matthew (2004) which can be explained by the close proximity to the TPW gradient (228 km), and Claudette (2009) where shear and motion vectors combined to explain the symmetrical pattern. As expected, no storms had the AL pattern. Although eight TCs eventually completed an ET, the averaged distance to the 40 mm contour at t00 was 505 km and the average time between landfall and ET completion was 65 h. Thus, the storms were likely too far away to interact with a frontal boundary at t00, explaining why AL patterns were not observed. Among the 17 storms in the group, rainfall patterns for 67% were explained by the TPW distribution and intensity, and 82% were explained by shear/motion vectors (Table 6).
The eastern group presented a more complicated picture as eleven cases completed ET but at a large range of times after landfall (Table 3). The four tropical storms that were 18 h or less away from completing their ET at landfall had AL patterns with distances to the 40 mm contour <335 km. The distance to the TPW contour of 40 mm on the left side of the storm accounted for the AL pattern in six of seven cases, and in six more cases, S or AR patterns were supported by the TPW values being higher on the right side combined with storm intensity. Only four cases were explained by vertical wind shear and storm motion, and these cases were also supported by the moisture analysis (Table 6). Thus, the TPW analysis was necessary to account for precipitation patterns in eastern group storms. For Wilma, the distance to 40 mm of TPW on the left side of the storm was 364 km at t00, and the position of the TPW line coincided with a cold front from the analysis of a surface weather map. About 58% of its rainfall occurred on the left side of the storm, thus it almost qualified as an AL pattern. This result suggested that TCs near the 60/40 split criterion should be examined closely to determine in which category it fit best.
Only four TCs of the 43 featured rainfall patterns that were not accounted for by our framework and further analysis suggested that storm size and/or convergence with the coastline were important to consider in these cases. Arlene (2005) had only 658 km2 of raining area and a small radius of gale-force winds (quadrant-averaged 60 km) as it was weakening prior to landfall. Henri (2003) had only 984 km2 of raining area and was a tropical depression, thus lacking gale-force winds. The paucity of rainfall made it difficult to classify spatial patterns in these cases. Matthew (2004) was a tropical depression 12 h from completing an ET and its rain field consisted of two regions, one on each side of the storm. The region on the left stretched towards the north in a delta shape expected during ET [18]. However, the region on the right side occurred along the coastline and convergence could have helped this region to form, creating an overall S pattern rather than AL. Hurricane Bret’s (1999) AR pattern was also likely explained by convergence along the coastline. Bret was a major hurricane at landfall, and gale-force winds extended 195 km in the northeast quadrant which fell on its right side. The center crossed the coastline at a perpendicular angle (~20°). However, the Texas coastline arcs towards the northeast which may have enhanced rainfall on the right side to account for the AR pattern rather than the S pattern suggested by moisture/intensity and shear/motion analyses.

5. Conclusions, Limitations, and Future Research

The availability of moisture changes as TCs make landfall over major land masses, and the amount of moisture available are important factors for rainfall production. This research measured the distribution of volumetric rainfall around TCs at the time closest to landfall and associated their spatial patterns with atmospheric moisture and the combination of vertical wind shear and storm motion. The hypothesis related to moisture was that if less moisture exists on the left (right) side of the storm, then less rainfall would be produced on the left (right) side. Further, the distance to 40 mm of TPW was calculated to determine how close the dry air mass from the continent or a frontal boundary existed to storms. In addition, the angle difference between the averaged direction of storm motion and vertical wind shear at the time closest to landfall was analyzed to test the hypothesis that more rainfall should occur on the right side of the storm, considering storms’ cyclonic motion, but when vertical wind shear was >5 ms−1, rainfall should be displaced downshear. The analysis included the 43 TCs that made landfall over the U.S. Gulf Coast from 1998 to 2012. The cases were divided into three groups by considering the landfall location and direction of storm motion. A GIS was utilized to perform the spatial analysis of rainfall and TPW, and Mann–Whitney U tests determined whether statistically significant differences existed between the groups in terms of moisture, vertical wind shear, storm motion, and rainfall.
The results of this study supported those of previous studies [7,8,25,28,40,57,60] by showing that the storms’ rainfall distribution patterns were influenced by moisture, vertical wind shear, and storm motion. This research also identified which factors contributed more to the storms’ rainfall distribution regionally. Although TPW conditions and vertical wind shear were the crucial components for the symmetry of storms’ rainfall in general, the storms that made landfall over Texas were influenced by the dry air from the continent to produce less rainfall on the left side of the storm. The rainfall distribution patterns for the storms making landfall over the central Gulf coastal states were mainly determined by the vector of vertical wind shear as moisture was generally plentiful, and more of the rain fields occurred on the right side of the storm. For TCs making landfall over the Florida peninsula, vertical wind shear was strong. The storms tended to interact with a cooler and drier air mass behind a front to produce more rainfall on the left side of the storm if the moisture boundary represented by the 40 mm contour line existed 275–350 km from the storm center. This study is the first attempt to measure the distance between TC centers and TPW boundaries to explain the distribution patterns of TC rainfall. Our findings revealed that moisture conditions are just as important as the vectors of vertical wind shear and/or storm motion for TC rainfall distribution in the western Gulf states and the Florida peninsula.
There are several limitations of this research that future research should aim to address. The rainfall patterns were not explained by moisture conditions and combined shear and motion vectors in four of 43 cases. One possible explanation is that TC rainfall was only examined at the time closest to landfall so that changes in the spatial patterns were not measured as TCs approached the coastline and moved inland. Two of the TCs were weakening and had few regions of high rain rates. Future research should analyze the evolution of TC rainfall patterns prior to landfall as changes in storm intensity during interaction with the coastline can cause rapid changes in rain rates. Further, we showed that TPW conditions change through time, and future studies should consider a potential time lag between TPW conditions and TC rainfall distribution. Another limitation was that only 40 mm of TPW was considered when determining the location of air that was drier than that surrounding the TC. While it seemed to be a successful demarcation of the dry continental air mass west of TCs near Texas, this contour line did not match with the location of an actual cold front in all cases in the eastern group. In the future, researchers should characterize the spatial arrangement of moisture by examining a range of values to determine which are the most representative of the location of a frontal boundary in NARR. Moreover, important differences can occur within the TC’s core as opposed to its outer region during interaction with land, thus a more fine-scaled analysis of rain rates should be undertaken similar to [61]. Employing the Integrated Multi-satellitE Retrievals for GPM (IMERG) dataset with its improved spatial and temporal resolution over TRMM 3B42 is also recommended for future studies of TCs [62].

Author Contributions

Conceptualization, S.K. and C.J.M.; methodology, S.K. and C.J.M.; validation, C.J.M. and G.Y.; formal analysis, S.K., C.J.M., and G.Y.; writing—original draft preparation, S.K.; writing—review and editing, C.J.M. and G.Y.; visualization, S.K., C.J.M., and G.Y. All authors have read and agreed to the published version of the manuscript.

Funding

C.J.M. was supported by the National Science Foundation BCS-1053864. No funds were received to cover publication costs.

Acknowledgments

Data provided by NASA (https://disc.gsfc.nasa.gov/datasets/TRMM_3B42_7/summary?keywords=trmm%203b42%203%20hour) and NOAA (https://www.ncdc.noaa.gov/ibtracs/, https://www.ncdc.noaa.gov/data-access/model-data/model-datasets/north-american-regional-reanalysis-narr, http://rammb.cira.colostate.edu/research/tropical_cyclones/ships/references.asp) are highly appreciated. We acknowledge the helpful comments of three anonymous reviewers that improved this manuscript.

Conflicts of Interest

The authors declare no conflict of interest.

References

  1. Rappaport, E.N. Fatalities in the United States from Atlantic Tropical Cyclones: New Data and Interpretation. Bull. Am. Meteorol. Soc. 2014, 95, 341–346. [Google Scholar] [CrossRef]
  2. Mendelsohn, R.; Emanuel, K.; Chonabayashi, S.; Bakkensen, L. The impact of climate change on global tropical cyclone damage. Nat. Clim. Chang. 2012, 2, 205–209. [Google Scholar] [CrossRef]
  3. Benfield, A. Weather, Climate and Catastrophe Insight: 2017 Annual Report; Aon: Sydney, Australia, 2018; p. 56. [Google Scholar]
  4. McAdie, C.J.; Lawrence, M.B. Improvements in Tropical Cyclone Track Forecasting in the Atlantic Basin, 1970–1998. Bull. Am. Meteorol. Soc. 2000, 81, 989–997. [Google Scholar] [CrossRef]
  5. Jiang, H.Y.; Halverson, J.B.; Zipser, E.J. Influence of environmental moisture on TRMM-derived tropical cyclone precipitation over land and ocean. Geophys. Res. Lett. 2008, 35, 35. [Google Scholar] [CrossRef] [Green Version]
  6. Villarini, G.; Smith, J.A.; Baeck, M.L.; Marchok, T.; Vecchi, G.A. Characterization of rainfall distribution and flooding associated with U.S. landfalling tropical cyclones: Analyses of Hurricanes Frances, Ivan, and Jeanne (2004). J. Geophys. Res. Atmos. 2011, 116, D23. [Google Scholar] [CrossRef]
  7. Corbosiero, K.L.; Molinari, J. The Relationship between Storm Motion, Vertical Wind Shear, and Convective Asymmetries in Tropical Cyclones. J. Atmos. Sci. 2003, 60, 366–376. [Google Scholar] [CrossRef]
  8. Chen, S.S.; Knaff, J.A.; Marks, F.D., Jr. Effects of Vertical Wind Shear and Storm Motion on Tropical Cyclone Rainfall Asymmetries Deduced from TRMM. Mon. Weather Rev. 2006, 134, 3190–3208. [Google Scholar] [CrossRef]
  9. Rogers, R.F.; Chen, S.S.; Tenerelli, J.; Willoughby, H. A Numerical Study of the Impact of Vertical Shear on the Distribution of Rainfall in Hurricane Bonnie (1998). Mon. Weather Rev. 2003, 131, 1577–1599. [Google Scholar] [CrossRef]
  10. Kim, D.; Ho, C.-H.; Park, D.R.; Chan, J.C.; Jung, Y.; Dasol, K. The Relationship between Tropical Cyclone Rainfall Area and Environmental Conditions over the Subtropical Oceans. J. Clim. 2018, 31, 4605–4616. [Google Scholar] [CrossRef]
  11. Corbosiero, K.L.; Molinari, J. The Effects of Vertical Wind Shear on the Distribution of Convection in Tropical Cyclones. Mon. Weather Rev. 2002, 130, 2110–2123. [Google Scholar] [CrossRef] [Green Version]
  12. DeMaria, M. The effect of vertical shear on tropical cyclone intensity change. J. Atmos. Sci. 1996, 53, 2076–2087. [Google Scholar] [CrossRef] [Green Version]
  13. Jones, S.C. The evolution of vortices in vertical shear. I: Initially barotropic vortices. Quart. J. R. Meteor. Soc. 1995, 121, 821–851. [Google Scholar] [CrossRef]
  14. Hence, D.A.; Houze, R.A. Vertical Structure of Tropical Cyclone Rainbands as Seen by the TRMM Precipitation Radar. J. Atmos. Sci. 2012, 69, 2644–2661. [Google Scholar] [CrossRef] [Green Version]
  15. Lonfat, M.; Marks, F.D., Jr.; Chen, S.S. Precipitation Distribution in Tropical Cyclones Using the Tropical Rainfall Measuring Mission (TRMM) Microwave Imager: A Global Perspective. Mon. Weather Rev. 2004, 132, 1645–1660. [Google Scholar] [CrossRef]
  16. DiMego, G.J.; Bosart, L.F. The Transformation of Tropical Storm Agnes into an Extratropical Cyclone. Part I: The Observed Fields and Vertical Motion Computations. Mon. Weather Rev. 1982, 110, 385–411. [Google Scholar] [CrossRef]
  17. Foley, G.R.; Hanstrum, B.N. The Capture of Tropical Cyclones by Cold Fronts off the West Coast of Australia. Weather Forecast. 1994, 9, 577–592. [Google Scholar] [CrossRef] [Green Version]
  18. Klein, P.M.; Harr, P.A.; Elsberry, R.L. Extratropical Transition of Western North Pacific Tropical Cyclones: An Overview and Conceptual Model of the Transformation Stage. Weather Forecast. 2000, 15, 373–395. [Google Scholar] [CrossRef]
  19. Matano, H.; Sekioka, M. Some Aspects of Extratropical Transformation of A Tropical Cyclone. J. Meteorol. Soc. Jpn. 1971, 49, 736–743. [Google Scholar] [CrossRef] [Green Version]
  20. Palmén, E. Vertical Circulation and Release of Kinetic Energy during the Development of Hurricane Hazel into an Extratropical Storm. Tellus 1958, 10, 1–13. [Google Scholar] [CrossRef]
  21. Atallah, E.H.; Bosart, L.R. The Extratropical Transition and Precipitation Distribution of Hurricane Floyd (1999). Mon. Weather Rev. 2003, 131, 1063–1081. [Google Scholar] [CrossRef]
  22. Zick, S.E.; Matyas, C.J. A Shape Metric Methodology for Studying the Evolving Geometries of Synoptic-Scale Precipitation Patterns in Tropical Cyclones. Ann. Am. Assoc. Geogr. 2016, 106, 1217–1235. [Google Scholar] [CrossRef]
  23. Frank, W.M. The structure and energetics of the tropical cyclone I. Storm structure. Mon. Weather Rev. 1977, 105, 1119–1135. [Google Scholar] [CrossRef]
  24. Chan, J.C.L.; Liu, K.S.; Ching, S.E.; Lai, E.S.T. Asymmetric Distribution of Convection Associated with Tropical Cyclones Making Landfall along the South China Coast. Mon. Weather Rev. 2004, 132, 2410–2420. [Google Scholar] [CrossRef]
  25. Kimball, S.K. Structure and Evolution of Rainfall in Numerically Simulated Landfalling Hurricanes. Mon. Weather Rev. 2008, 136, 3822–3847. [Google Scholar] [CrossRef]
  26. Rodgers, E.B.; Pierce, H.F. Environmental Influence on Typhoon Bobbie’s Precipitation Distribution. J. Appl. Meteorol. 1995, 34, 2513–2532. [Google Scholar] [CrossRef]
  27. Ayala, J.J.H.; Matyas, C.J. Tropical cyclone rainfall over Puerto Rico and its relations to environmental and storm-specific factors. Int. J. Clim. 2016, 36, 2223–2237. [Google Scholar] [CrossRef]
  28. Jiang, H.; Halverson, J.B.; Simpson, J.; Zipser, E.J. On the Differences in Storm Rainfall from Hurricanes Isidore and Lili. Part II: Water Budget. Weather Forecast. 2008, 23, 44–61. [Google Scholar] [CrossRef] [Green Version]
  29. Jiang, H.Y.; Halverson, J.B.; Simpson, J. On the Differences in Storm Rainfall from Hurricanes Isidore and Lili. Part I: Satellite Observations and Rain Potential. Weather Forecast. 2008, 23, 29–43. [Google Scholar] [CrossRef] [Green Version]
  30. Thornthwaite, C.W. The Climates of North America: According to a New Classification. Geogr. Rev. 1931, 21, 633. [Google Scholar] [CrossRef]
  31. Trenberth, K.E.; Fasullo, J.T.; Mackaro, J. Atmospheric Moisture Transports from Ocean to Land and Global Energy Flows in Reanalyses. J. Clim. 2011, 24, 4907–4924. [Google Scholar] [CrossRef]
  32. Dunn, G.E.; Miller, B.I. Atlantic Hurricanes; Louisiana State University Press: Baton Rouge, LA, USA, 1964. [Google Scholar]
  33. Yu, Z.; Wang, Y.; Xu, H.; Davidson, N.; Chen, Y.; Chen, Y.; Yu, H. On the Relationship between Intensity and Rainfall Distribution in Tropical Cyclones Making Landfall over China. J. Appl. Meteorol. Clim. 2017, 56, 2883–2901. [Google Scholar] [CrossRef]
  34. Dehart, J.C.; Houze, R.A., Jr. Orographic Modification of Precipitation Processes in Hurricane Karl (2010). Mon. Weather Rev. 2017, 145, 4171–4186. [Google Scholar] [CrossRef] [Green Version]
  35. Lin, Y.-L.; Savage, L.C., III. Effects of Landfall Location and the Approach Angle of a Cyclone Vortex Encountering a Mesoscale Mountain Range. J. Atmos. Sci. 2011, 68, 2095–2106. [Google Scholar] [CrossRef]
  36. Schubert, S.D.; Helfand, H.M.; Wu, C.-Y.; Min, W. Subseasonal Variations in Warm-Season Moisture Transport and Precipitation over the Central and Eastern United States. J. Clim. 1998, 11, 2530–2555. [Google Scholar] [CrossRef]
  37. Bender, M.A.; Tuleya, R.E.; Kurihara, Y. A Numerical Study of the Effect of a Mountain Range on a Landfalling Tropical Cyclone. Mon. Weather Rev. 1985, 113, 567–583. [Google Scholar] [CrossRef]
  38. Matyas, C.J. Quantifying the Shapes of U.S. Landfalling Tropical Cyclone Rain Shields. Prof. Geogr. 2007, 59, 158–172. [Google Scholar] [CrossRef]
  39. Knapp, K.R.; Kruk, M.C.; Levinson, D.H.; Diamond, H.J.; Neumann, C.J. The International Best Track Archive for Climate Stewardship (IBTrACS): Unifying tropical cyclone data. Bull. Am. Meteorol. Soc. 2010, 91, 363–376. [Google Scholar] [CrossRef]
  40. Matyas, C.J. Associations between the size of hurricane rain fields at landfall and their surrounding environments. Meteorol. Atmos. Phys. 2010, 106, 135–148. [Google Scholar] [CrossRef]
  41. Zhou, Y.; Matyas, C.; Li, H.; Tang, J. Conditions associated with rain field size for tropical cyclones landfalling over the Eastern United States. Atmos. Res. 2018, 214, 375–385. [Google Scholar] [CrossRef]
  42. Huffman, G.J.; Bolvin, D.T.; Nelkin, E.J.; Wolff, D.B.; Adler, R.F.; Gu, G.; Hong, Y.; Bowman, K.P.; Stocker, E.F. The TRMM Multisatellite Precipitation Analysis (TMPA): Quasi-Global, Multiyear, Combined-Sensor Precipitation Estimates at Fine Scales. J. Hydrometeorol. 2007, 8, 38–55. [Google Scholar] [CrossRef]
  43. Huffman, G.J.; Bolvin, D.T. TRMM and Other Data Precipitation Data Set Documentation. NASA Greenbelt USA 2013, 28, 1. [Google Scholar]
  44. Chen, Y.; Ebert, E.E.; Walsh, K.J.E.; Davidson, N.E. Evaluation of TRMM 3B42 precipitation estimates of tropical cyclone rainfall using PACRAIN data. J. Geophys. Res. Atmos. 2013, 118, 2184–2196. [Google Scholar] [CrossRef]
  45. Mesinger, F.; DiMego, G.; Kalnay, E.; Mitchell, K.; Shafran, P.C.; Ebisuzaki, W.; Jovic, D.; Woollen, J.; Rogers, E.; Berbery, E.H.; et al. North American Regional Reanalysis. Bull. Am. Meteorol. Soc. 2006, 87, 343–360. [Google Scholar] [CrossRef] [Green Version]
  46. Zick, S.E.; Matyas, C.J. Tropical cyclones in the North American Regional Reanalysis: The impact of satellite-derived precipitation over ocean. J. Geophys. Res. Atmos. 2015, 120, 8724–8742. [Google Scholar] [CrossRef] [Green Version]
  47. Zick, S.E.; Matyas, C.J. Tropical cyclones in the North American Regional Reanalysis: An assessment of spatial biases in location, intensity, and structure. J. Geophys. Res. Atmos. 2015, 120, 1651–1669. [Google Scholar] [CrossRef]
  48. DeMaria, M.; Mainelli, M.; Shay, L.K.; Knaff, J.A.; Kaplan, J. Further Improvements to the Statistical Hurricane Intensity Prediction Scheme (SHIPS). Weather Forecast. 2005, 20, 531–543. [Google Scholar] [CrossRef] [Green Version]
  49. Kirkland, J.L.; Zick, S.E. Regional Differences in the Spatial Patterns of North Atlantic Tropical Cyclone Rainbands Through Landfall. Southeast. Geogr. 2019, 59, 294–320. [Google Scholar] [CrossRef]
  50. Trenberth, K.E.; Dai, A.; Rasmussen, R.M.; Parsons, D.B. The Changing Character of Precipitation. Bull. Am. Meteorol. Soc. 2003, 84, 1205–1218. [Google Scholar] [CrossRef]
  51. Zagrodnik, J.P.; Jiang, H. Investigation of PR and TMI Version 6 and Version 7 Rainfall Algorithms in Landfalling Tropical Cyclones Relative to the NEXRAD Stage-IV Multisensor Precipitation Estimate Dataset. J. Appl. Meteorol. Clim. 2013, 52, 2809–2827. [Google Scholar] [CrossRef] [Green Version]
  52. Trenberth, K.E.; Davis, C.A.; Fasullo, J. Water and energy budgets of hurricanes: Case studies of Ivan and Katrina. J. Geophys. Res. Atmos. 2007, 112, 11. [Google Scholar] [CrossRef]
  53. Zhou, Y.; Matyas, C.J. Spatial characteristics of storm-total rainfall swaths associated with tropical cyclones over the Eastern United States. Int. J. Clim. 2017, 37, 557–569. [Google Scholar] [CrossRef]
  54. Chu, P.-S. Large-Scale Circulation Features Associated with Decadal Variations of Tropical Cyclone Activity over the Central North Pacific. J. Clim. 2002, 15, 2678–2689. [Google Scholar] [CrossRef]
  55. Farfán, L.M.; Fogel, I. Influence of Tropical Cyclones on Humidity Patterns over Southern Baja California, Mexico. Mon. Weather Rev. 2007, 135, 1208–1224. [Google Scholar] [CrossRef]
  56. Inoue, M.; Handoh, I.C.; Bigg, G.R. Bimodal Distribution of Tropical Cyclogenesis in the Caribbean: Characteristics and Environmental Factors. J. Clim. 2002, 15, 2897–2905. [Google Scholar] [CrossRef]
  57. Deng, D.; Ritchie, E.A. Rainfall Characteristics of Recurving Tropical Cyclones over the Western North Pacific. J. Clim. 2018, 31, 575–592. [Google Scholar] [CrossRef]
  58. Wingo, M.T.; Cecil, D.J. Effects of Vertical Wind Shear on Tropical Cyclone Precipitation. Mon. Weather Rev. 2010, 138, 645–662. [Google Scholar] [CrossRef]
  59. Hart, R.E.; Evans, J.L.; Evans, C. Synoptic Composites of the Extratropical Transition Life Cycle of North Atlantic Tropical Cyclones: Factors Determining Posttransition Evolution. Mon. Weather Rev. 2006, 134, 553–578. [Google Scholar] [CrossRef] [Green Version]
  60. Lonfat, M.; Rogers, R.; Marchok, T.; Marks, F.D., Jr. A Parametric Model for Predicting Hurricane Rainfall. Mon. Weather Rev. 2007, 135, 3086–3097. [Google Scholar] [CrossRef]
  61. Wu, D.; Zhao, K.; Jou, B.J.-D.; Lee, W.-C. Radar observation of precipitation asymmetries in tropical cyclones making landfall on East China coast. Trop. Cyclone Res. Rev. 2013, 2, 81–95. [Google Scholar]
  62. Gaona, M.F.R.; Villarini, G.; Zhang, W.; Vecchi, G.A. The added value of IMERG in characterizing rainfall in tropical cyclones. Atmos. Res. 2018, 209, 95–102. [Google Scholar] [CrossRef] [Green Version]
Figure 1. Three regional groups with storm center positions every 3 h from 24 h prior to landfall to the time closest to landfall. (a) Western group; (b) central group; (c) eastern group.
Atmosphere 11 00895 g001
Figure 2. Regions where rain rates exceed 5 mm hr−1 (orange line) and that intersected with or were within 250 km of the storm center (black line) were selected for analysis. Example from Hurricane Ivan (2004).
Atmosphere 11 00895 g002
Figure 3. Rain rates and asymmetric rainfall distribution with more rain on the right side (AR) for Charley (1998). Storm motion is indicated by the long black arrow.
Atmosphere 11 00895 g003
Figure 4. The amount of total precipitable water (TPW) at 00 UTC 29 August 2005 for Hurricane Katrina. The 9-cell grid is centered on the TC position and oriented according to storm forward motion. TPW on the left (cells 1, 4, 7) and right side of a storm (cells 3, 6, 9) are measured separately. Cell 2 is ahead of the storm and cell 8 is behind the storm. They are not used in the calculation of TPW on the left or right sides of the storm. The shortest distance to the TPW contour line of 40 mm (red line) from the storm center is measured.
Atmosphere 11 00895 g004
Figure 5. TPW and area occupied by rain rates exceeding 5 mm hr−1 on the left (pink) and right (orange) sides of each TC. (a) 1998 Charley from the western and (b) 2004 Ivan from the central group.
Atmosphere 11 00895 g005
Figure 6. Diagram showing relationships between storm motion and vectors of the vertical wind shear (blue arc to indicate all angles between the arrows) and hypothesized position of the resulting rainfall regions for the (a) AL; (b) S; and (c) AR patterns.
Atmosphere 11 00895 g006
Figure 7. Boxplots for the volumetric rainfall on the left and the right sides of storms at t00 by groups. Circles (stars) denote values at least 1.5 (3) times the interquartile range.
Atmosphere 11 00895 g007
Figure 8. The number of cases exhibiting each rainfall distribution pattern by group.
Atmosphere 11 00895 g008
Figure 9. Boxplots for the averaged total TPW on the (a) left side and (b) right side of the storm by regional groups every three hours in the day prior to landfall. Circles (stars) denote values at least 1.5 (3) times the interquartile range.
Atmosphere 11 00895 g009
Figure 10. The boxplots for the averaged shortest distance between the storm center and TPW contour line of 40 mm by regional groups during 24 h prior to landfall. Circles (stars) denote values at least 1.5 (3) times the interquartile range.
Atmosphere 11 00895 g010
Figure 11. Boxplots for the distance to the TPW contour line of 40 mm at t00 by the rainfall distribution pattern. The X demarcates the mean value. The circle denotes a value at least 1.5 times the interquartile range.
Atmosphere 11 00895 g011
Figure 12. The averaged storm motion and wind shear vectors by regional groups ((a): western group; (b): central group; (c): eastern group). The shaded region is where rainfall should occur according to the combined vectors and storm’s counterclockwise rotation.
Atmosphere 11 00895 g012
Table 1. Western group tropical cyclones (TCs) and their time of rainfall analysis, maximum sustained wind speed at that time, the phase of the storm at its last observation in the database, and the time from rainfall analysis until the last observation in the database. For end phase, TS: tropical system, DS: disturbance, ET: extra tropical.
Storm NameYearTime Closest to Landfall in NARR DataMax. Wind at
Analysis Time (m/s)
End PhaseHours from Analysis until Storm’s End
Charley199809 UTC 22 August23TS45
Frances199806 UTC 11 September23TS36
Bret199900 UTC 23 August51TS54
Fay200209 UTC 07 September26DS93
Claudette200315 UTC 15 July41DS45
Grace200312 UTC 31 August18TS48
Rita200509 UTC 24 September46DS51
Erin200712 UTC 16 August15DS84
Humberto200706 UTC 13 September41DS36
Dolly200818 UTC 23 July39DS84
Edouard200812 UTC 05 August28DS36
Ike200806 UTC 13 September49ET30
Table 2. As in Table 1 but for central group TCs.
Storm NameYearTime Closest to Landfall in NARR DataMax. Wind at
Analysis Time (m/s)
End PhaseHours from Analysis Until Storm’s End
Georges199812 UTC 28 September46TS72
Hermine199806 UTC 20 September18TS12
Helene200012 UTC 22 September18TS84
Barry200106 UTC 06 August31DS54
Hanna200209 UTC 14 September26TS32
Isidore200206 UTC 26 September28ET36
Lili200212 UTC 03 October41TS30
Bill200318 UTC 30 June26ET48
Ivan200406 UTC 16 September54ET198
Matthew200412 UTC 10 October15ET12
Arlene200518 UTC 11 June26ET48
Cindy200503 UTC 06 July33DS33
Dennis200518 UTC 10 July57TS186
Katrina200512 UTC 29 August57ET36
Gustav200815 UTC 01 September46ET75
Claudette200906 UTC 17 August21DS18
Isaac201209 UTC 29 August35TS51
Table 3. As in Table 1 but for eastern group TCs.
Storm NameYearTime Closest to Landfall in NARR DataMax. Wind at
Analysis Time (m/s)
End PhaseHours from Analysis Until Storm’s End
Earl199806 UTC 03 September36ET12
Mitch199812 UTC 05 November28ET6
Harvey199918 UTC 21 September26TS18
Irene199921 UTC 15 October35ET84
Gordon200003 UTC 18 September28ET15
Gabrielle200112 UTC 14 September31ET114
Henri200309 UTC 06 September15ET39
Bonnie200415 UTC 12 August19DS33
Charley200421 UTC 13 August62ET27
Wilma200509 UTC 24 October55ET39
Alberto200618 UTC 13 June18ET18
Barry200715 UTC 02 June15ET9
Fay200809 UTC 19 August28ET189
Debby201221 UTC 26 June18TS21
Table 4. Mann–Whitney U Test p-values for averaged total TPW on the left (cells 1, 4, 7) and right (cells 3, 6, 9) side of the storm every three hours until landfall.
DataWestern vs. CentralWestern vs. EasternCentral vs. Eastern
Left, Right TPW t240.01 *, 1.000.82, 0.97<0.01 *, 0.87
Left, Right TPW t21<0.01 *, 0.330.63, 0.74<0.01 *, 0.40
Left, Right TPW t18<0.01 *, 0.660.78, 0.710.01 *, 0.71
Left, Right TPW t150.01 *, 0.470.49, 0.940.01 *, 0.52
Left, Right TPW t120.02 *, 0.650.90, 0.870.02 *, 0.68
Left, Right TPW t09<0.01 *, 0.280.90, 0.380.01 *, 0.83
Left, Right TPW t060.01 *, 0.250.82, 0.23<0.01 *, 0.98
Left, Right TPW t030.02 *, 0.140.63, 0.04 *<0.01 *, 0.71
Left, Right TPW t000.02 *, 0.04 *0.12, 0.01 *0.01 *, 0.83
* Groups tested are significantly different at α = 0.05.
Table 5. As in Table 4 but for the averaged TPW on the left side versus on the right side of the storm.
DataWestern GroupCentral GroupEastern Group
TPW left vs. right t240.01 *0.52<0.01 *
TPW left vs. right t21<0.01 *0.21<0.01 *
TPW left vs. right t18<0.01 *0.11<0.01 *
TPW left vs. right t150.01 *0.070.01 *
TPW left vs. right t12<0.01 *0.060.01 *
TPW left vs. right t9<0.01 *0.05 *<0.01 *
TPW left vs. right t6<0.01 *0.03 *<0.01 *
TPW left vs. right t30.01 *0.01 *<0.01 *
TPW left vs. right t00.01 *0.01 *<0.01 *
* Groups tested are significantly different at α = 0.05.
Table 6. The percentage of storms’ rainfall patterns that can be explained by TPW distribution or vertical wind shear and storm motion.
TPW Conditions with IntensityVertical Wind Shear/Storm MotionMoisture/Intensity and Shear/Motion
Western Group8/12 (67%)8/12 (67%)7/12 (58%)
Central Group11/17 (65%)14/17 (82%)8/17 (47%)
Eastern Group12/14 (86%)4/14 (29%)4/14 (29%)