Article

Investigation of Aerosol Climatology and Long-Range Transport of Aerosols over Pokhara, Nepal

1
Central Department of Physics, Tribhuvan University Kirtipur, Kirtipur, Nepal
2
Department of Applied Sciences, Institute of Engineering Tribhuvan University, Lalitpur, Nepal
3
School of Public Health, University of California Berkeley, Berkeley, CA 94720, USA
4
Department of Physics, San Jacinto College, South Campus, 13735 Beamer Rd, Houston, TX 77089, USA
5
State Key Laboratory of Cryospheric Science, Northwest Institute of Eco-Environment and Resources, Chinese Academy of Sciences, Lanzhou 730000, China
6
Ullens Education Foundation, Lalitpur, Nepal
7
College of Health & Natural Sciences, Franklin Pierce University, 40 University Drive, Rindge, NH 03461, USA
*
Author to whom correspondence should be addressed.
Atmosphere 2020, 11(8), 874; https://doi.org/10.3390/atmos11080874
Submission received: 20 July 2020 / Revised: 12 August 2020 / Accepted: 13 August 2020 / Published: 17 August 2020
(This article belongs to the Special Issue Emissions, Transport and Fate of Pollutants in the Atmosphere)

Abstract

:
This study presents the spectral monthly and seasonal variation of aerosol optical depth (τAOD), single scattering albedo (SSA), and aerosol absorption optical depth (AAOD) between 2010 and 2018 obtained from the Aerosol Robotic Network (AERONET) over Pokhara, Nepal. The analysis of these column-integrated aerosol optical data suggests significant monthly and seasonal variability of aerosol physical and optical properties. The pre-monsoon season (March to May) has the highest observed τAOD(0.75 ± 0.15), followed by winter (December to February, 0.47 ± 0.12), post-monsoon (October and November, 0.39 ± 0.08), and monsoon seasons (June to September, 0.27 ± 0.13), indicating seasonal aerosol loading over Pokhara. The variability of Ångström parameters, α, and β, were computed from the linear fit line in the logarithmic scale of spectral τAOD, and used to analyze the aerosol physical characteristics such as particle size and aerosol loading. The curvature of spectral τAOD, α’, computed from the second-order polynomial fit, reveals the domination by fine mode aerosol particles in the post-monsoon and winter seasons, with coarse mode dominating in monsoon, and both modes contributing in the pre-monsoon. Analysis of air mass back trajectories and observation of fire spots along with aerosol optical data and aerosol size spectra suggest the presence of mixed types of transboundary aerosols, such as biomass, urban-industrial, and dust aerosols in the atmospheric column over Pokhara.

1. Introduction

Atmospheric aerosols have a significant impact on the Earth’s atmospheric radiation budget, due to their direct scattering and absorption characteristics, as well as an indirect impact on microphysics and clouds’ formation [1,2,3]. In recent decades, there has been increasing concern about aerosols’ impact on melting snow and ice in the high Himalaya and over the Tibetan Plateau [4,5,6], with indications that a significant portion of the aerosols arrived from the Indo-Gangetic Plains [7,8]. To date, though, there have been only limited studies of aerosols over the Himalayan foothills immediately south of high Himalaya, on their route from the IGP towards the high mountains [5,9].
The measurement of atmospheric aerosol physical and optical properties can provide knowledge of understanding the role of aerosols in the climate system. In the last few decades, various techniques have been used to measure and characterize the atmospheric aerosols from ground, aircraft, and satellite measurements [10,11,12,13,14]. Aerosol Robotic Network (AERONET) is one of the global ground-based networks used to monitor atmospheric aerosol optical properties and is maintained by the National Aeronautics and Space Administration (NASA). It has adopted the robotic Cimel Sun photometer throughout its network, to measure direct and diffuse solar radiation, which is then used to retrieve the aerosol products on the AERONET website [12,15]. The network provides a readily accessible public domain database of atmospheric column integrated aerosol optical properties, such as aerosol optical depth (τAOD) measured in the ultraviolet to infrared wavelengths. Moreover, τAOD represents the columnar aerosol content resulting from the different aerosol populations in the atmospheric column above the measurement site [12,14,16]. The spectral variation of τAOD, which can be characterized by the Ångström parameters (α and β), can give a picture of aerosol size distribution and aerosol loading in the atmospheric column [14,16,17]. These are important parameters in the determination of aerosol size distribution. The variability of aerosol size distribution is a good indicator for the sources of aerosols, such as those generated from urban and industrial, biomass burning, combustion of fossil fuels, and airborne soil particles [17]. Many investigations have previously used the information on particle size and spectral aerosol optical characteristics to validate the dominant aerosol type [17,18,19].
Remote sensing techniques are important tools to monitor aerosol optical properties globally, by validating the accuracy of measurements [12,20,21]. The establishment of AERONET sites has provided an opportunity to study the aerosol loading due to local and long-range transportation over the region [13,18]. A combined analysis of ground-based column integrated aerosol optical data, atmospheric simulations such as the back trajectory analysis from Hybrid Single-Particle Lagrangian Integrated Trajectory Model (HYSPLIT) and the Moderate Resolution Imaging Spectroradiometer (MODIS) satellite observation data of atmospheric pollutants can be used to study the spatial and temporal variation of aerosol optical properties, aerosol types, and source [13,22,23]
Previous studies in Nepal have presented aerosol characteristics, but did not investigate long-term aerosol optical properties and aerosol sizes based on the spectral aerosol optical depth [24,25,26,27]. A number of studies have shown that Nepal’s atmosphere is affected by a variety of emissions, such as those produced by biomass burning, agricultural burning, and domestic uses of biofuels, which are taking place in its large neighboring countries [28,29]. Particularly the Terai—the flat part of southern Nepal that lines the northern edge of the Indo-Gangetic Plains (IGP)—is heavily affected by trans-boundary pollution from the rest of the IGP. The IGP is a densely populated region with high aerosol loading from both anthropogenic and natural sources. Past studies have shown that major sources of aerosol loading over IGP include biomass burning, desert dust, and pollution from industrial and urban activities [26,29,30].
The AERONET observation site in Pokhara, Nepal, was established in January 2010 and has continuously provided various long-term aerosol products. After a decade of operation, it has now accumulated the longest continuous atmospheric observation data site in Nepal. While previous studies have shown the influence of transboundary air pollution over the Himalayan region of Nepal [4,5,6,7,8,9,24], this is the first detailed analysis of the seasonal variation of aerosol transport over the Nepal Himalaya using a long-term aerosol dataset, combined with computer simulation and satellite data analysis, providing us with a comprehensive picture of aerosols across temporal and spatial scales. Analysis of aerosol climatology over Pokhara in the foothill of Himalayas, along with its transboundary aerosol sources, provides glimpses of regional aerosols that reach more remote locations in the high Himalayas and Tibetan plateau.
In this study, we have used monthly averaged aerosol optical properties between 2010 and 2018, such as spectral aerosol optical depth (τAOD) from ultraviolet to infrared, 0.34 μm to 1.02 μm, to examine the seasonal Angstrom exponents and characterize the aerosol types. Level 2 AERONET inversion products single scattering albedo (SSA), and absorption angstrom exponent (AAE) at four different wavelengths—0.44 µm, 0.675 µm, 0.87 µm, and 1.02 µm—are investigated to identify absorbing aerosols. HYSPLIT back trajectory analysis, combined with MODIS satellite images of fire spots, have been used to identify the origins and types of aerosols transported to the receptor site, Pokhara.

2. Methodology

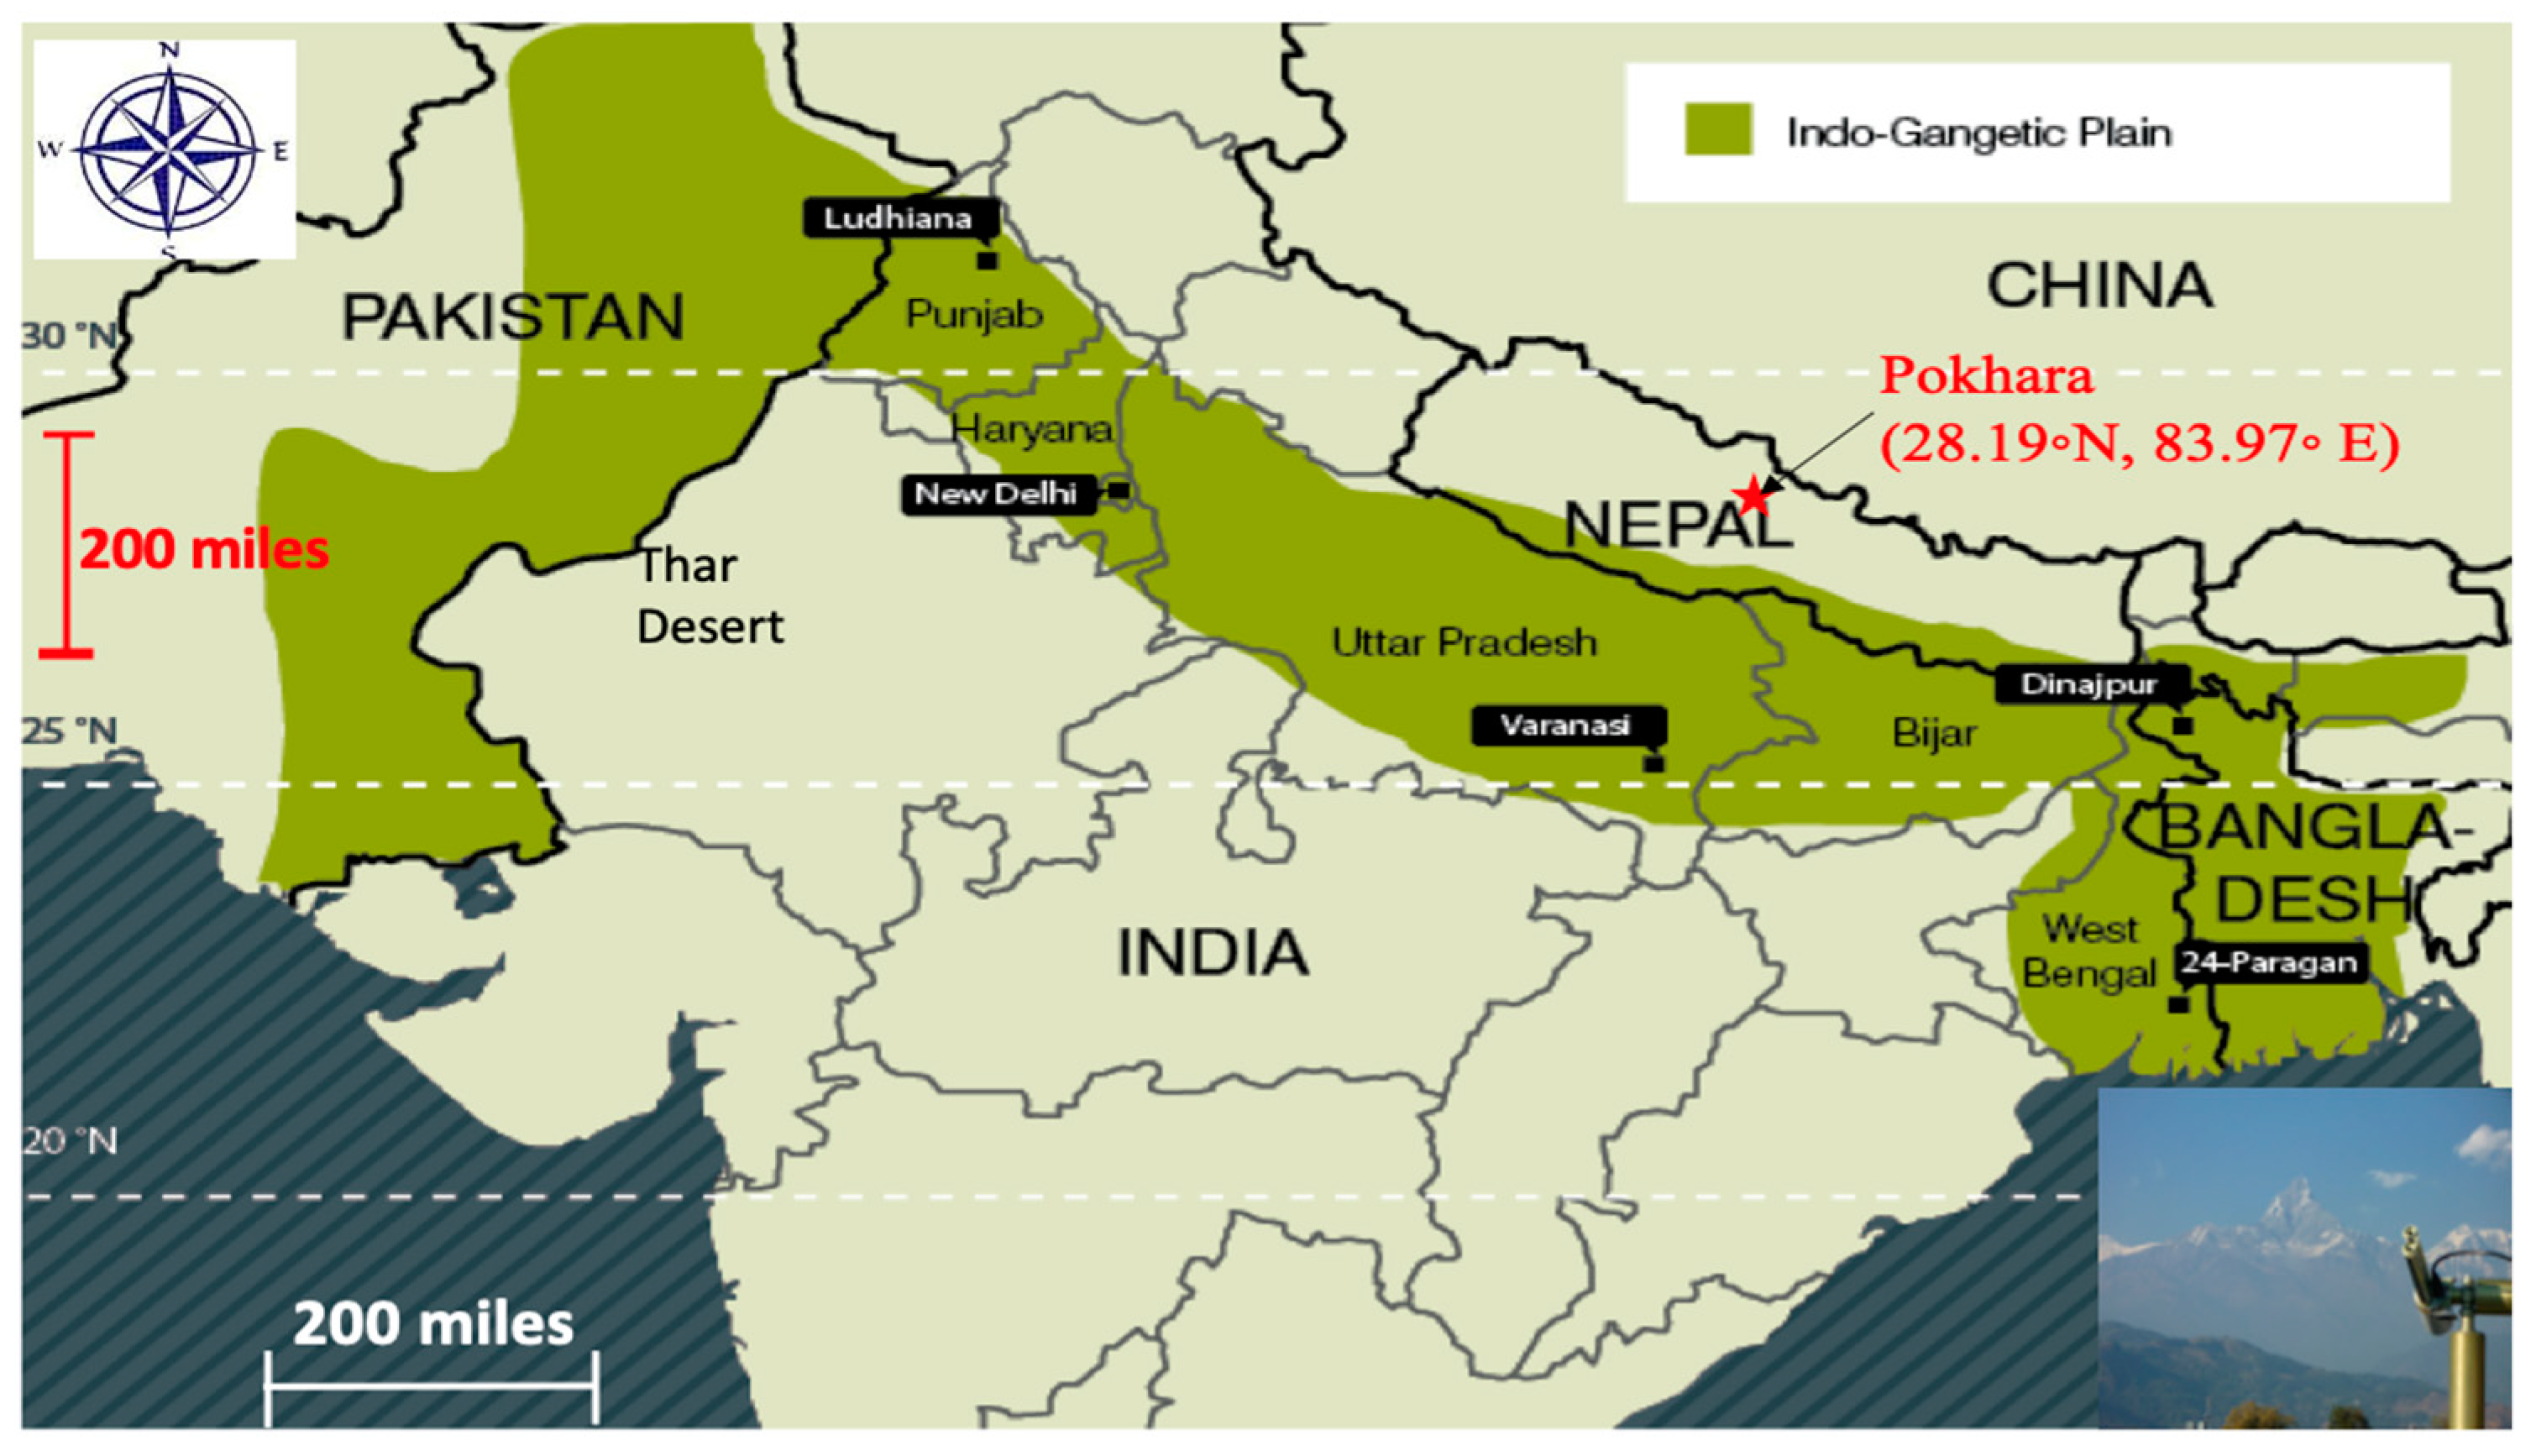
2.1. Site Description

The Pokhara AERONET site is located at 28.19° N, 83.97° E in the Pokhara Sub-Metropolitan city of Nepal. Pokhara is Nepal’s second-largest city after Kathmandu, with a population of about two hundred sixty thousand [31]. The Cimel Sun Photometer is located on the roof of Shangrila Village Resort, in the south-western suburbs of Pokhara.
The site is approximately at an altitude of 805 m above sea level, and about 140 km west of Kathmandu. It is surrounded by hills, between 1000 to 2000 m above sea level. The IGP is about 90 km to the south, while to the north, the elevation rises quickly to over 7000 m in the span of 35 km. The presence of high mountains near Pokhara assists in lifting the humid air-masses, mainly in the summertime, resulting in a large amount of precipitation, which can significantly affect the aerosol concentration in the atmosphere [9,25,27,32]. Figure 1 shows the location of Pokhara, along with the potential source regions of air masses over its atmospheric column from Nepal and outside the region, such as from IGP, along with other parts of Asia, including the Punjab region of Pakistan and the Thar Desert [33].

2.2. Cimel Sun Photometer

An automatic sun-and-sky scanning Cimel Sun Photometer is located on the roof of the Shangrila Village Resort in Pokhara’s south-western suburbs, as a part of AERONET. Descriptions of this network and methods for retrieving aerosol optical data have been published before [12,14,20].
The sun photometer measures direct sun radiances at 0.34 μm, 0.38 μm, 0.44 μm, 0.50 μm, 0.675 μm, 0.87 μm, 1.02 μm and 1.64 μm wavelengths during the daytime. The aerosol optical depth (τAOD) is derived by correcting attenuation due to Rayleigh scattering, absorption by ozone, and gaseous components in direct spectral measurements [12,14,15]. In addition, the sun photometer also measures diffuse sky radiance at four wavelengths 0.44 μm, 0.675 μm, 0.87 μm, and 1.02 μm [14,16,20]. These solar extinction measurements are used to retrieve aerosol columnar inversion products, such as volume size distribution and single scattering albedo. Three data quality levels, Level 1.0 (unscreened), Level 1.5 (cloud screened), and Level 2.0 (cloud-screened and quality-assured), are provided for analysis of aerosol data [16,20], with Level 2.0 data made available after the instrument is returned to NASA during annual swap outs. All products of AERONET are automatically computed and made available within the AERONET website [15]. The estimated uncertainty in computed AOD is reported to range from ±0.01 to ±0.02, which is spectrally dependent, and is found higher on the UV region [12,16,23].

2.3. Basic Equations and Definitions

The spectral τAOD is guided by Ångström exponent (α), as given by power-law equation [34].
τ AOD =   β λ α
In logarithmic format can be written as:
ln   τ AOD ( λ ) =   ln   β     α   ln   λ
This gives the values of Ångström parameters α and β
The Ångström exponent α can be further defined from the spectral AOD(λ) as
α = d ln τ AOD ( λ ) d   ln λ = ln ( τ AOD ( at   λ 2 )   τ AOD ( at   λ 1 ) ) ln ( λ 2 λ 1 )
The deviation of observed data from the linear fit line can be tested by using a second-order polynomial fit, with coefficients of the polynomial fit α 2 , α 1 ,   and α 0 , as defined in previous studies [17,18,19].
ln   τ AOD ( λ ) =   α 2 ( ln λ ) 2 + α 1 ( ln λ ) +   α 0
We define   α   at wavelength ( λ ) and this can also be found in previous articles [17,18].
  α   = d α d   ln λ =     d d   ln λ   [ d   ln   τ AOD ( λ ) d   ln λ   ] =   2 α 2
The aerosol absorption characteristics can be exhibited by using SSA, aerosol absorption optical depth (AAOD) and AAE, and are related as below [2,3,35],
AAOD ( λ ) = AOD ( λ )   [ 1 SSA ( λ ) ]
and,
AAOD = K λ AAE

2.4. Tools Used for Backward Trajectories and Fire Spots

Four clusters were generated for each season by calculating five days backward air mass trajectories, starting at 500 m over the receptor site Pokhara (28.19° N, 83.19° E), for every day at 0:00, 6:00, 12:00, and 18:00 UTC, based on the HYSPLIT model [13]. A free software plugin called TrajStat was used from MeteoInfo for the calculations [36]. Fire spots were obtained from NASA’s Fire Information for Resource Management System (FIRMS),which allows visualizing large scale bio-mass burning activities around the region. These active fire data were observed from NASA’s Moderate Resolution Imaging Spectroradiometer (MODIS) and NASA’s Visible Infrared Imaging Radiometer Suite (VIIRS), however, these satellite images will not provide the household level of biomass burning. A combination of satellite images of fire spots with air masses back trajectory will be presented to demonstrate a significant picture of aerosol climatology over the region [37,38,39].
In this study, we have used the data of the year 2017 to present a cluster analysis for indicating the seasonal aerosol sources’ characterization over the observation site Pokhara.

3. Results and Discussion

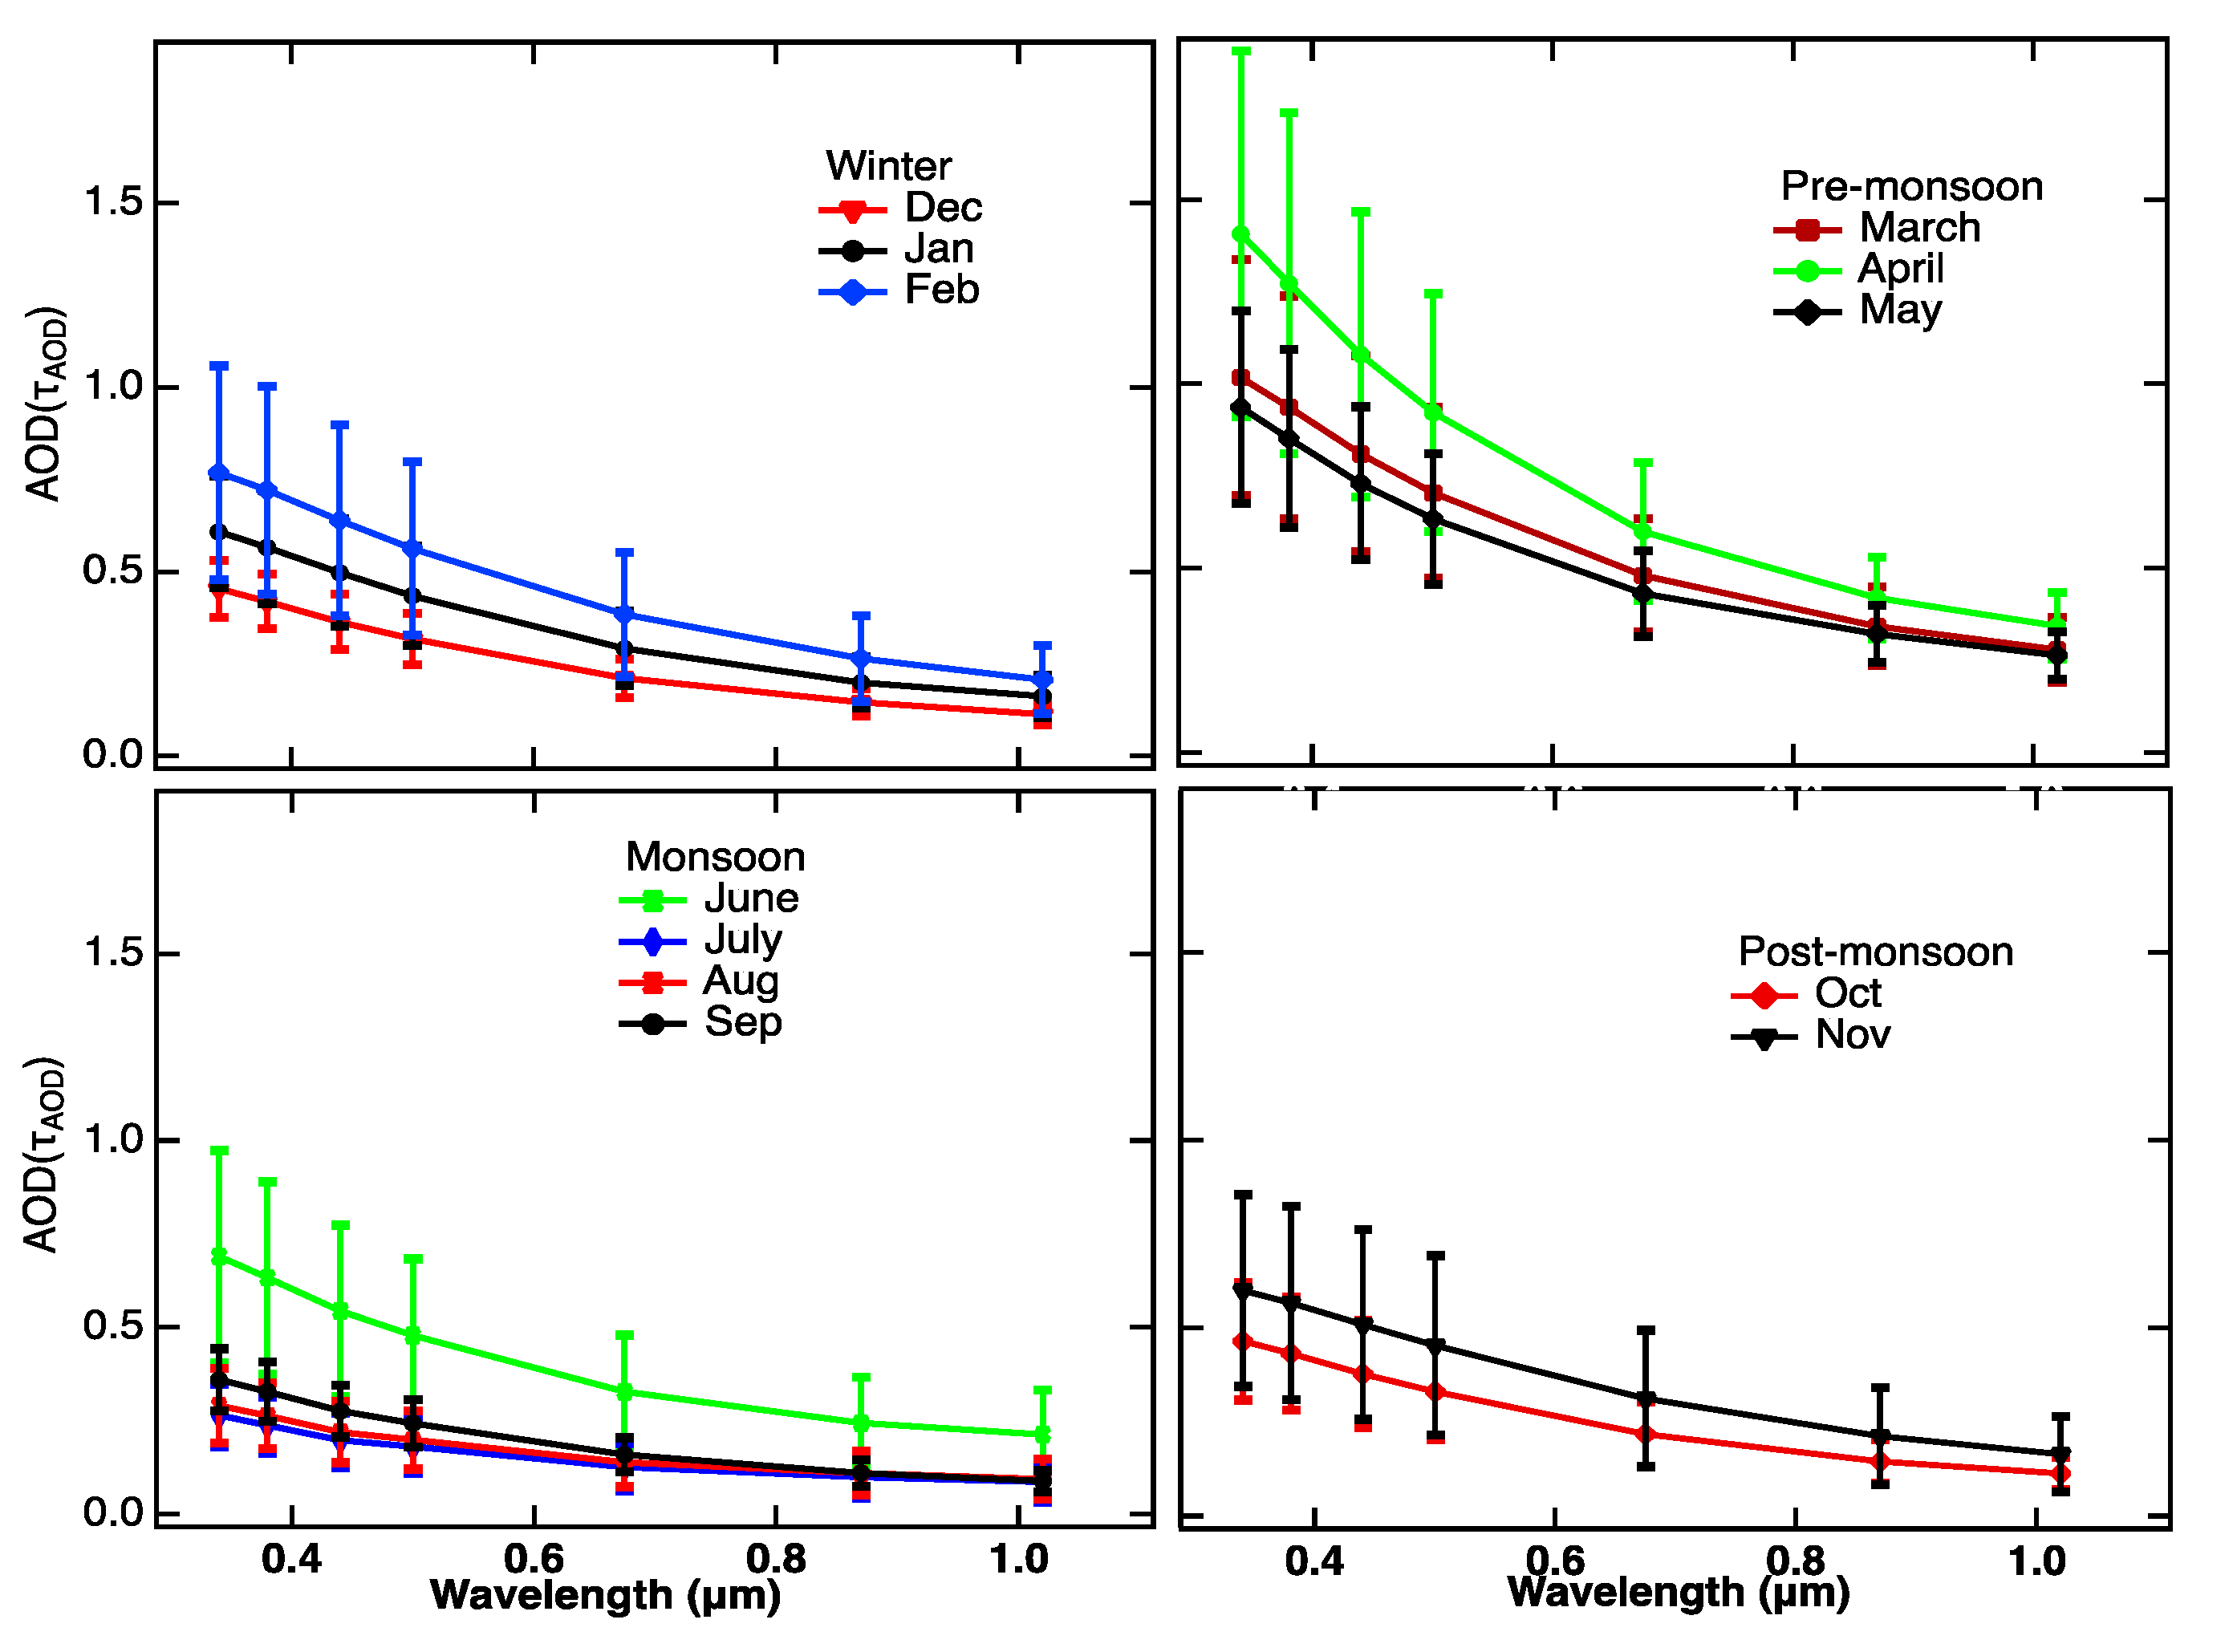
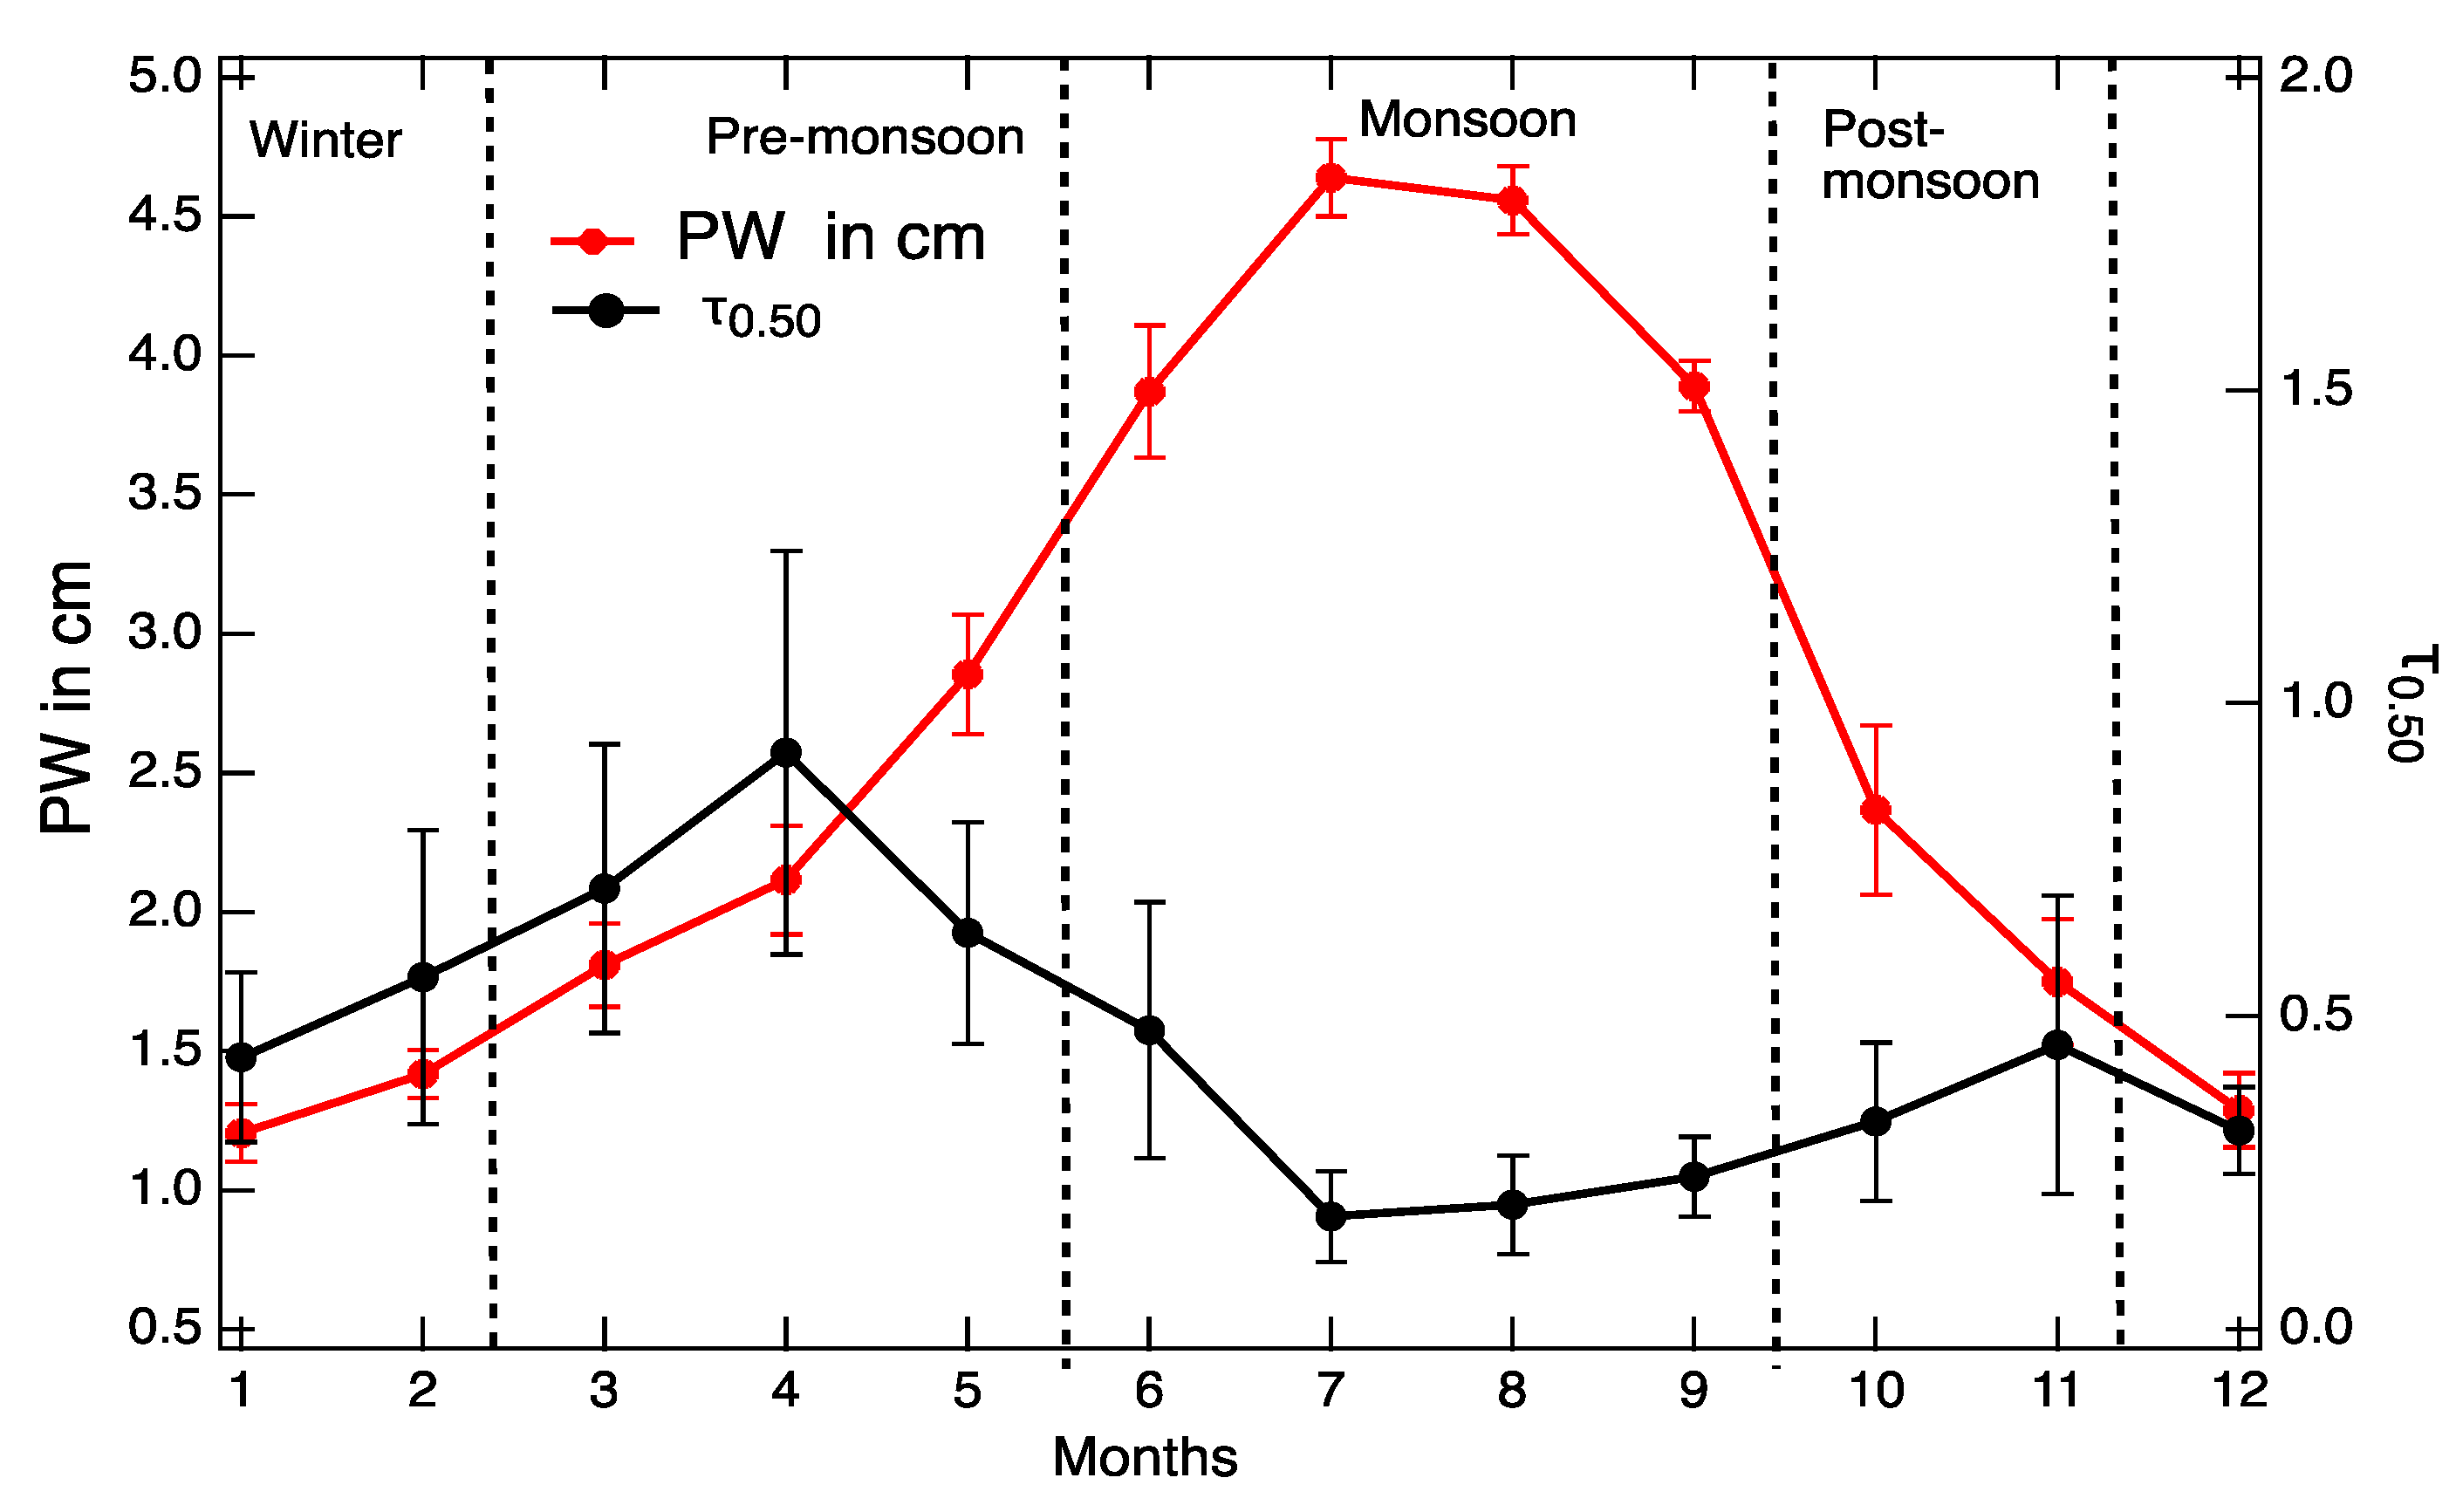
3.1. Variability of Spectral Columnar AOD and Precipitable Water

In this section, we present the monthly and seasonal variability of spectral AOD and the temporal variability of AOD, by comparing with columnar precipitable water vapor (PW). Figure 2 shows the monthly mean spectral AOD values, τAOD, over the 9 years from 2010 to 2018, at seven different wavelengths—0.34 μm, 0.38 μm, 0.44 μm, 0.50 μm, 0.675 μm, 0.87 μm, and 1.02 μm. Our statistical analysis excluded monthly averaged aerosol data from any months that had τAOD data for less than ten days.
Due to the above constraint on data availability, the mean values for each calendar month across the nine years were computed from a varying number of months, as given in the parenthesis: January (6), February (8), March (8), April (7), May (8), June (5), July (4), August (3), September (4), October (6), November (6), and December (7). Level 2 aerosol data were very scarce on the AERONET website for the rainy season months of June, July, and August, due to cloud screening of the data and the requirement for the sun photometer to remain parked in a protected position whenever the rain sensor was wet.
The general trend of spectral variations shows that the τAOD is higher at a shorter wavelength and decreases at longer wavelengths. We found the spectral τAOD highest in April, followed by March, May, February, June (January, November), (December, October) September and (August and July). Months placed in parentheses have almost identical spectral τAOD at all wavelengths. In the monsoon season, the gradient of spectral τAOD in the longer wavelength decreases. Distinct features of seasonal τAOD can be observed in Figure 2, with the highest aerosol loading in the months of pre-monsoon season followed by winter, post-monsoon, and monsoon season. In the months of two seasons, winter and post-monsoon, the aerosol loadings are not significantly deviated from each other.
The temporal variation of light attenuation is also observed using a monthly mean AOD at 0.50 µm(τ0.50), along with a column-averaged precipitable water level (PW) in centimeters for different months and seasons (Figure 3). The τ0.50, ranges from 0.31 to 0.56 in winter season with average value of 0.43 ± 0.12, 0.63 to 0.92 in pre-monsoon season with average value of 0.75 ± 0.15, 0.18 to 0.47 in monsoon season with average value of 0.27 ± 0.13, and 0.33 to 0.45, in post-monsoon season with average value of 0.39 ± 0.08. Variation of PW shows a similar trend of rainfall in Pokhara with an increase from months of winter to monsoon seasons, and then decreasing in post-monsoon season [40]. In monsoon season, the variation on τ0.50 is significantly affected by the rainfall.
The variations of τ0.50 and PW show two different characters. Between December and April, these two parameters correlate significantly, with high R2 (0.91) and low p-values (0.01), and while including data of May R2 drops to 0.35 and p-value increases to 0.21. However, in monsoon and the post-monsoon months, they vary inversely with R2 equal to 0.43 and p-value 0.15. Previous studies have shown that atmospheric water vapor can serve as a medium for igniting multiphase reaction to the formation of gas to particle transformation, and play a key role for hygroscopic growth of aerosols, which ultimately affects the aerosol optical properties [41,42]. In this study, we argue that τ0.50, which has a significant correlation with PW, from December to April, is mainly associated with the actual aerosol loading, and might not be linked with aerosol particles’ hygroscopic effect growth. However, a chemical analysis of aerosols over the observation site, such as the observation of black carbon, dust, sulfate, and organic carbon concentrations due to their hygroscopic characters, can give a picture of the aerosol hygroscopic impact on τ0.50, which we have not done in this study. A study of aerosol loading based on the Ångström turbidity coefficient (β) is also presented in the next section, that will support the effect of aerosol loading for higher AOD. A previous study on the latitudinal variation of aerosol optical properties over the IGP region to the Central Himalayas during the pre-monsoon season has also explored the AOD due to aerosol loading over the observation site, rather than depicting hygroscopic growth of aerosol particles [43].

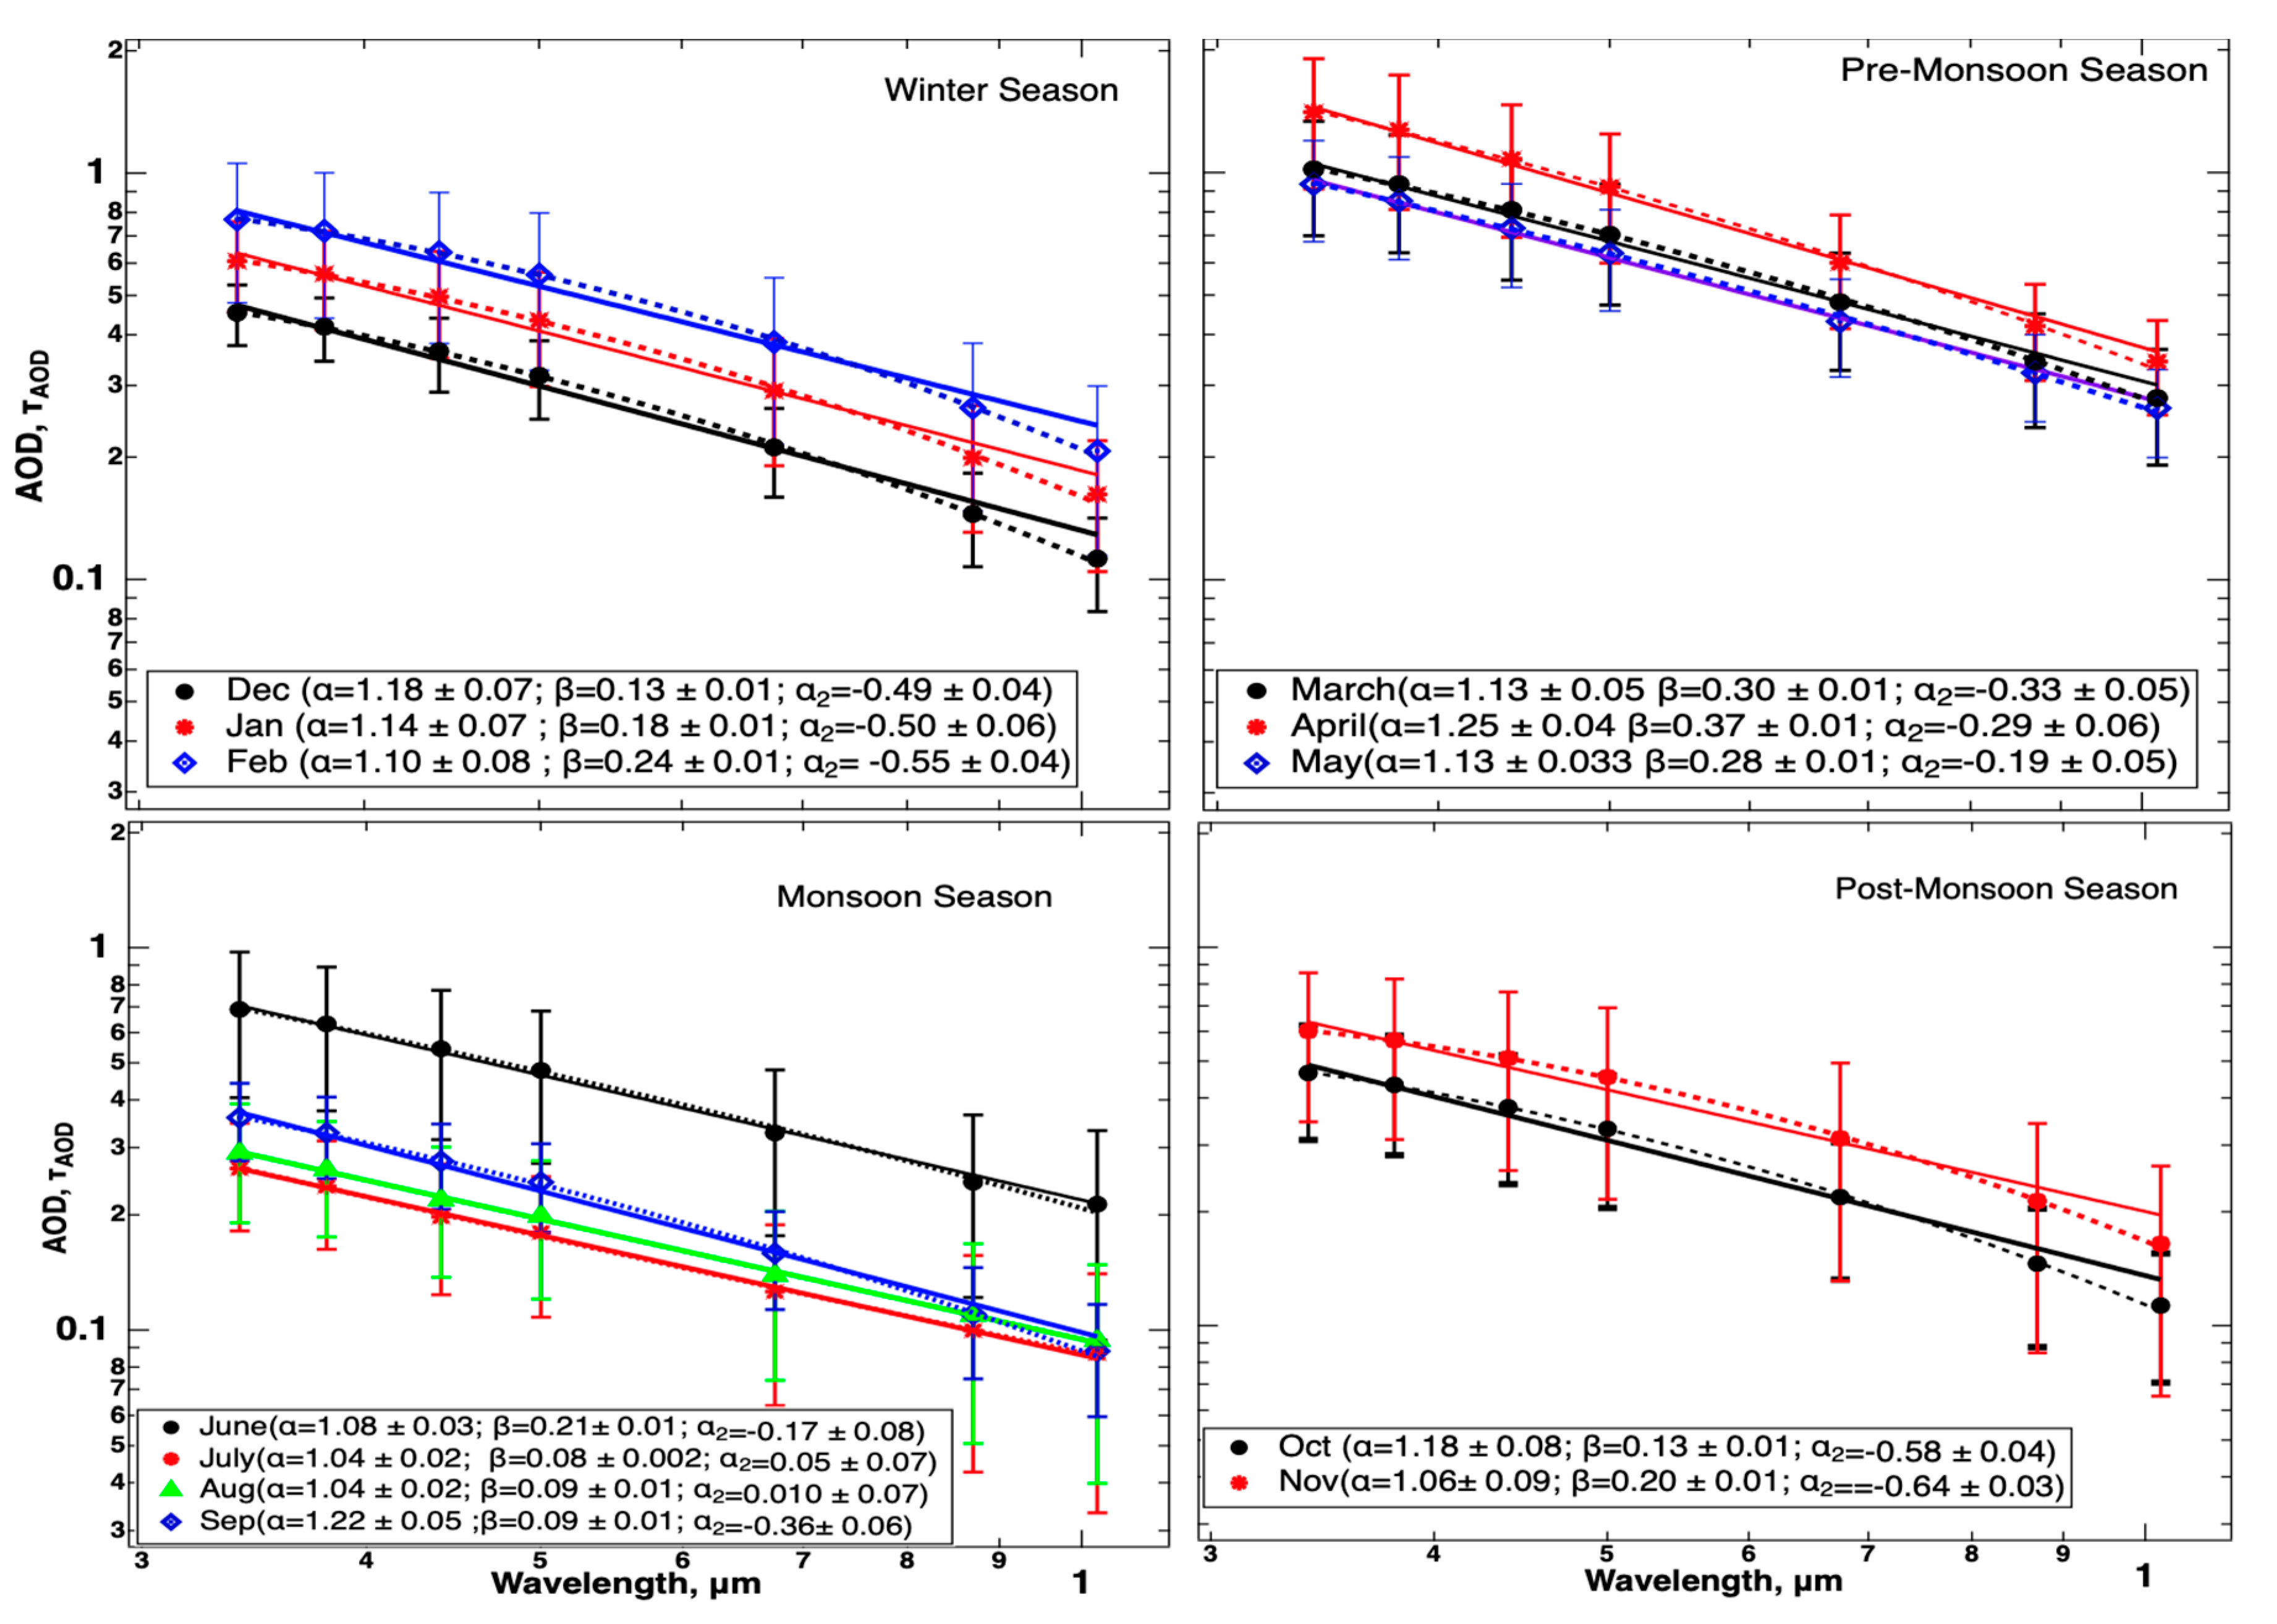
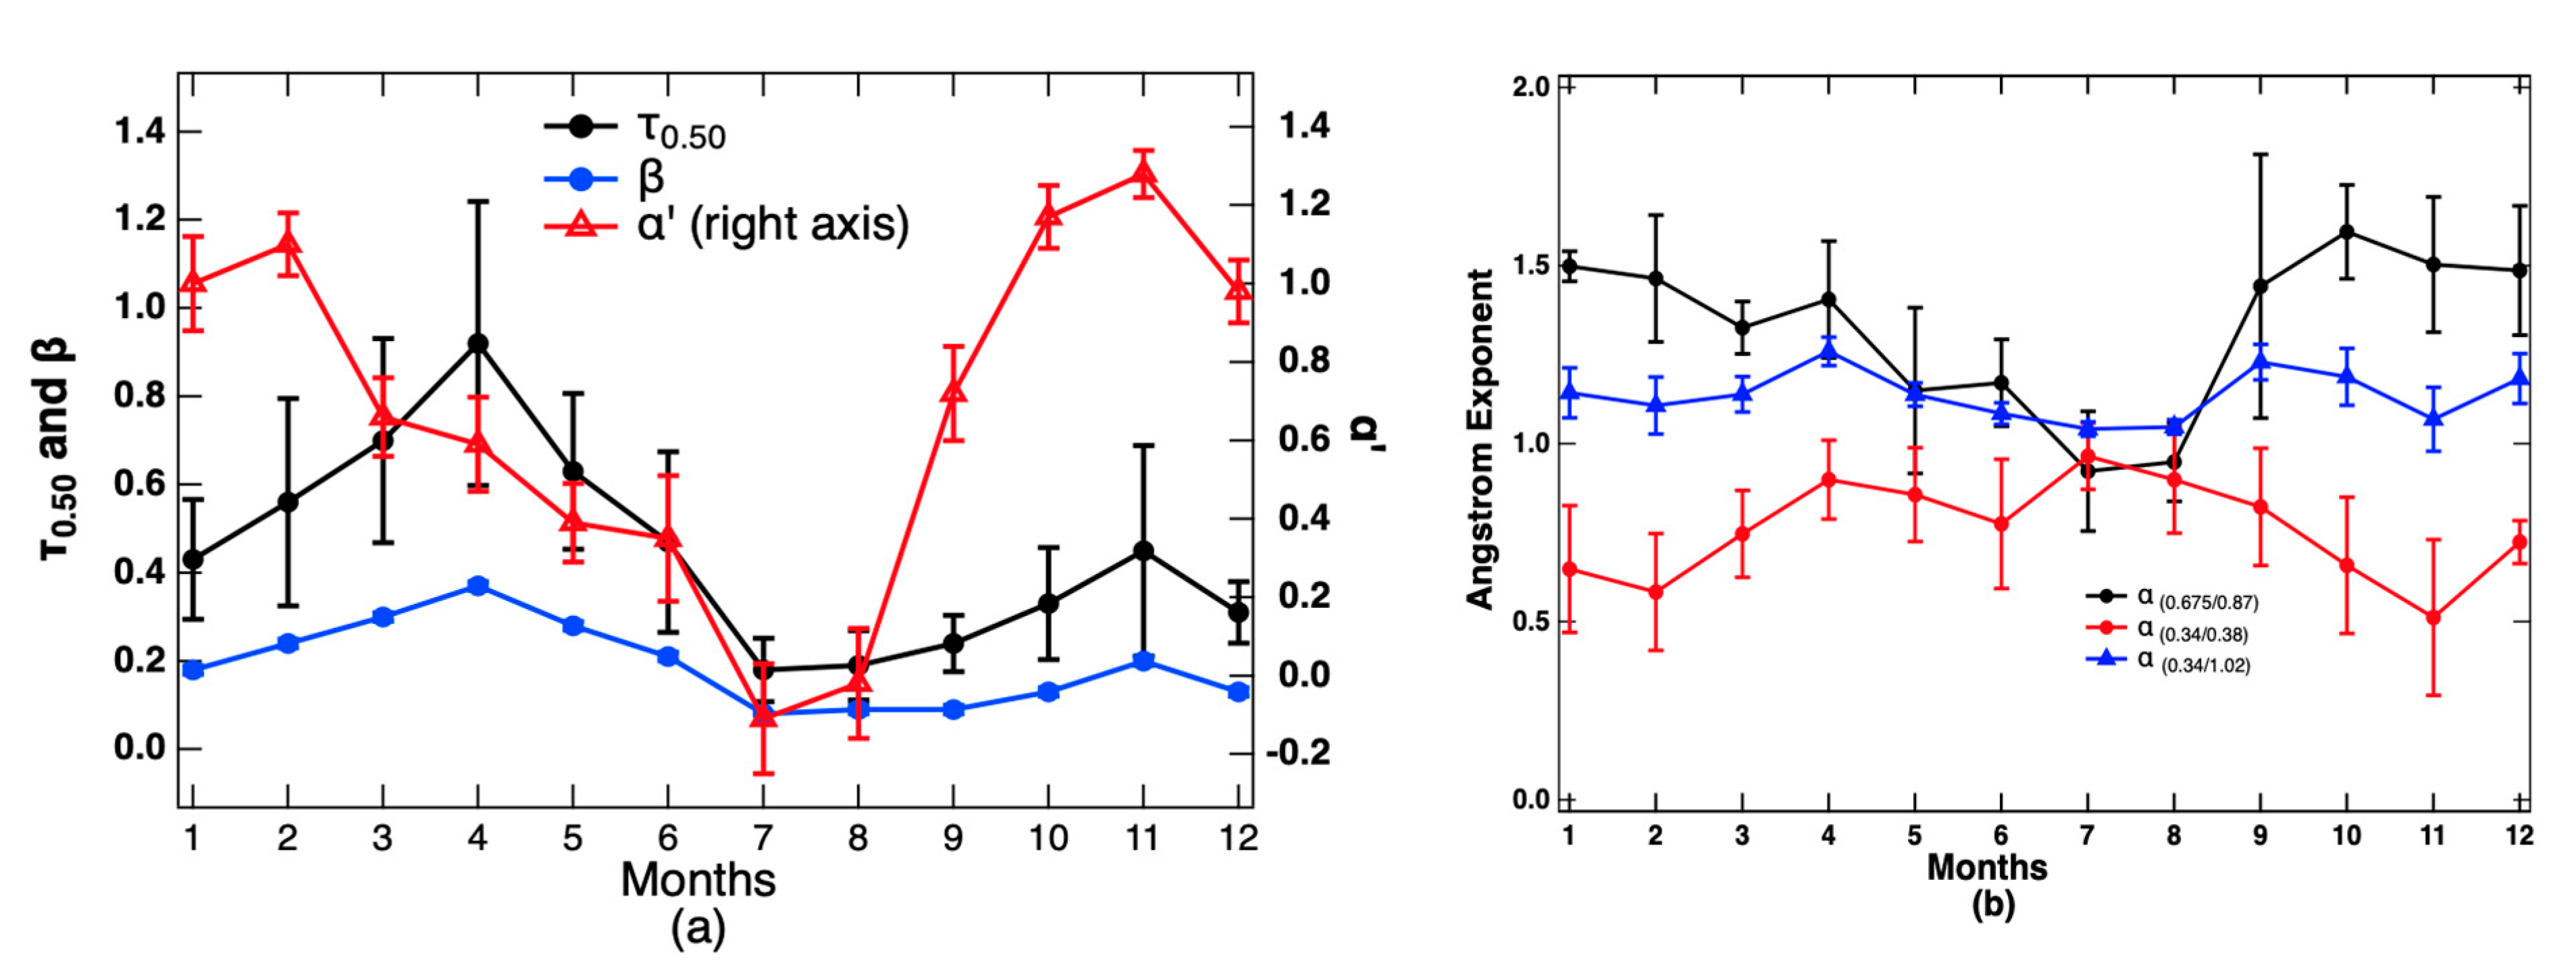
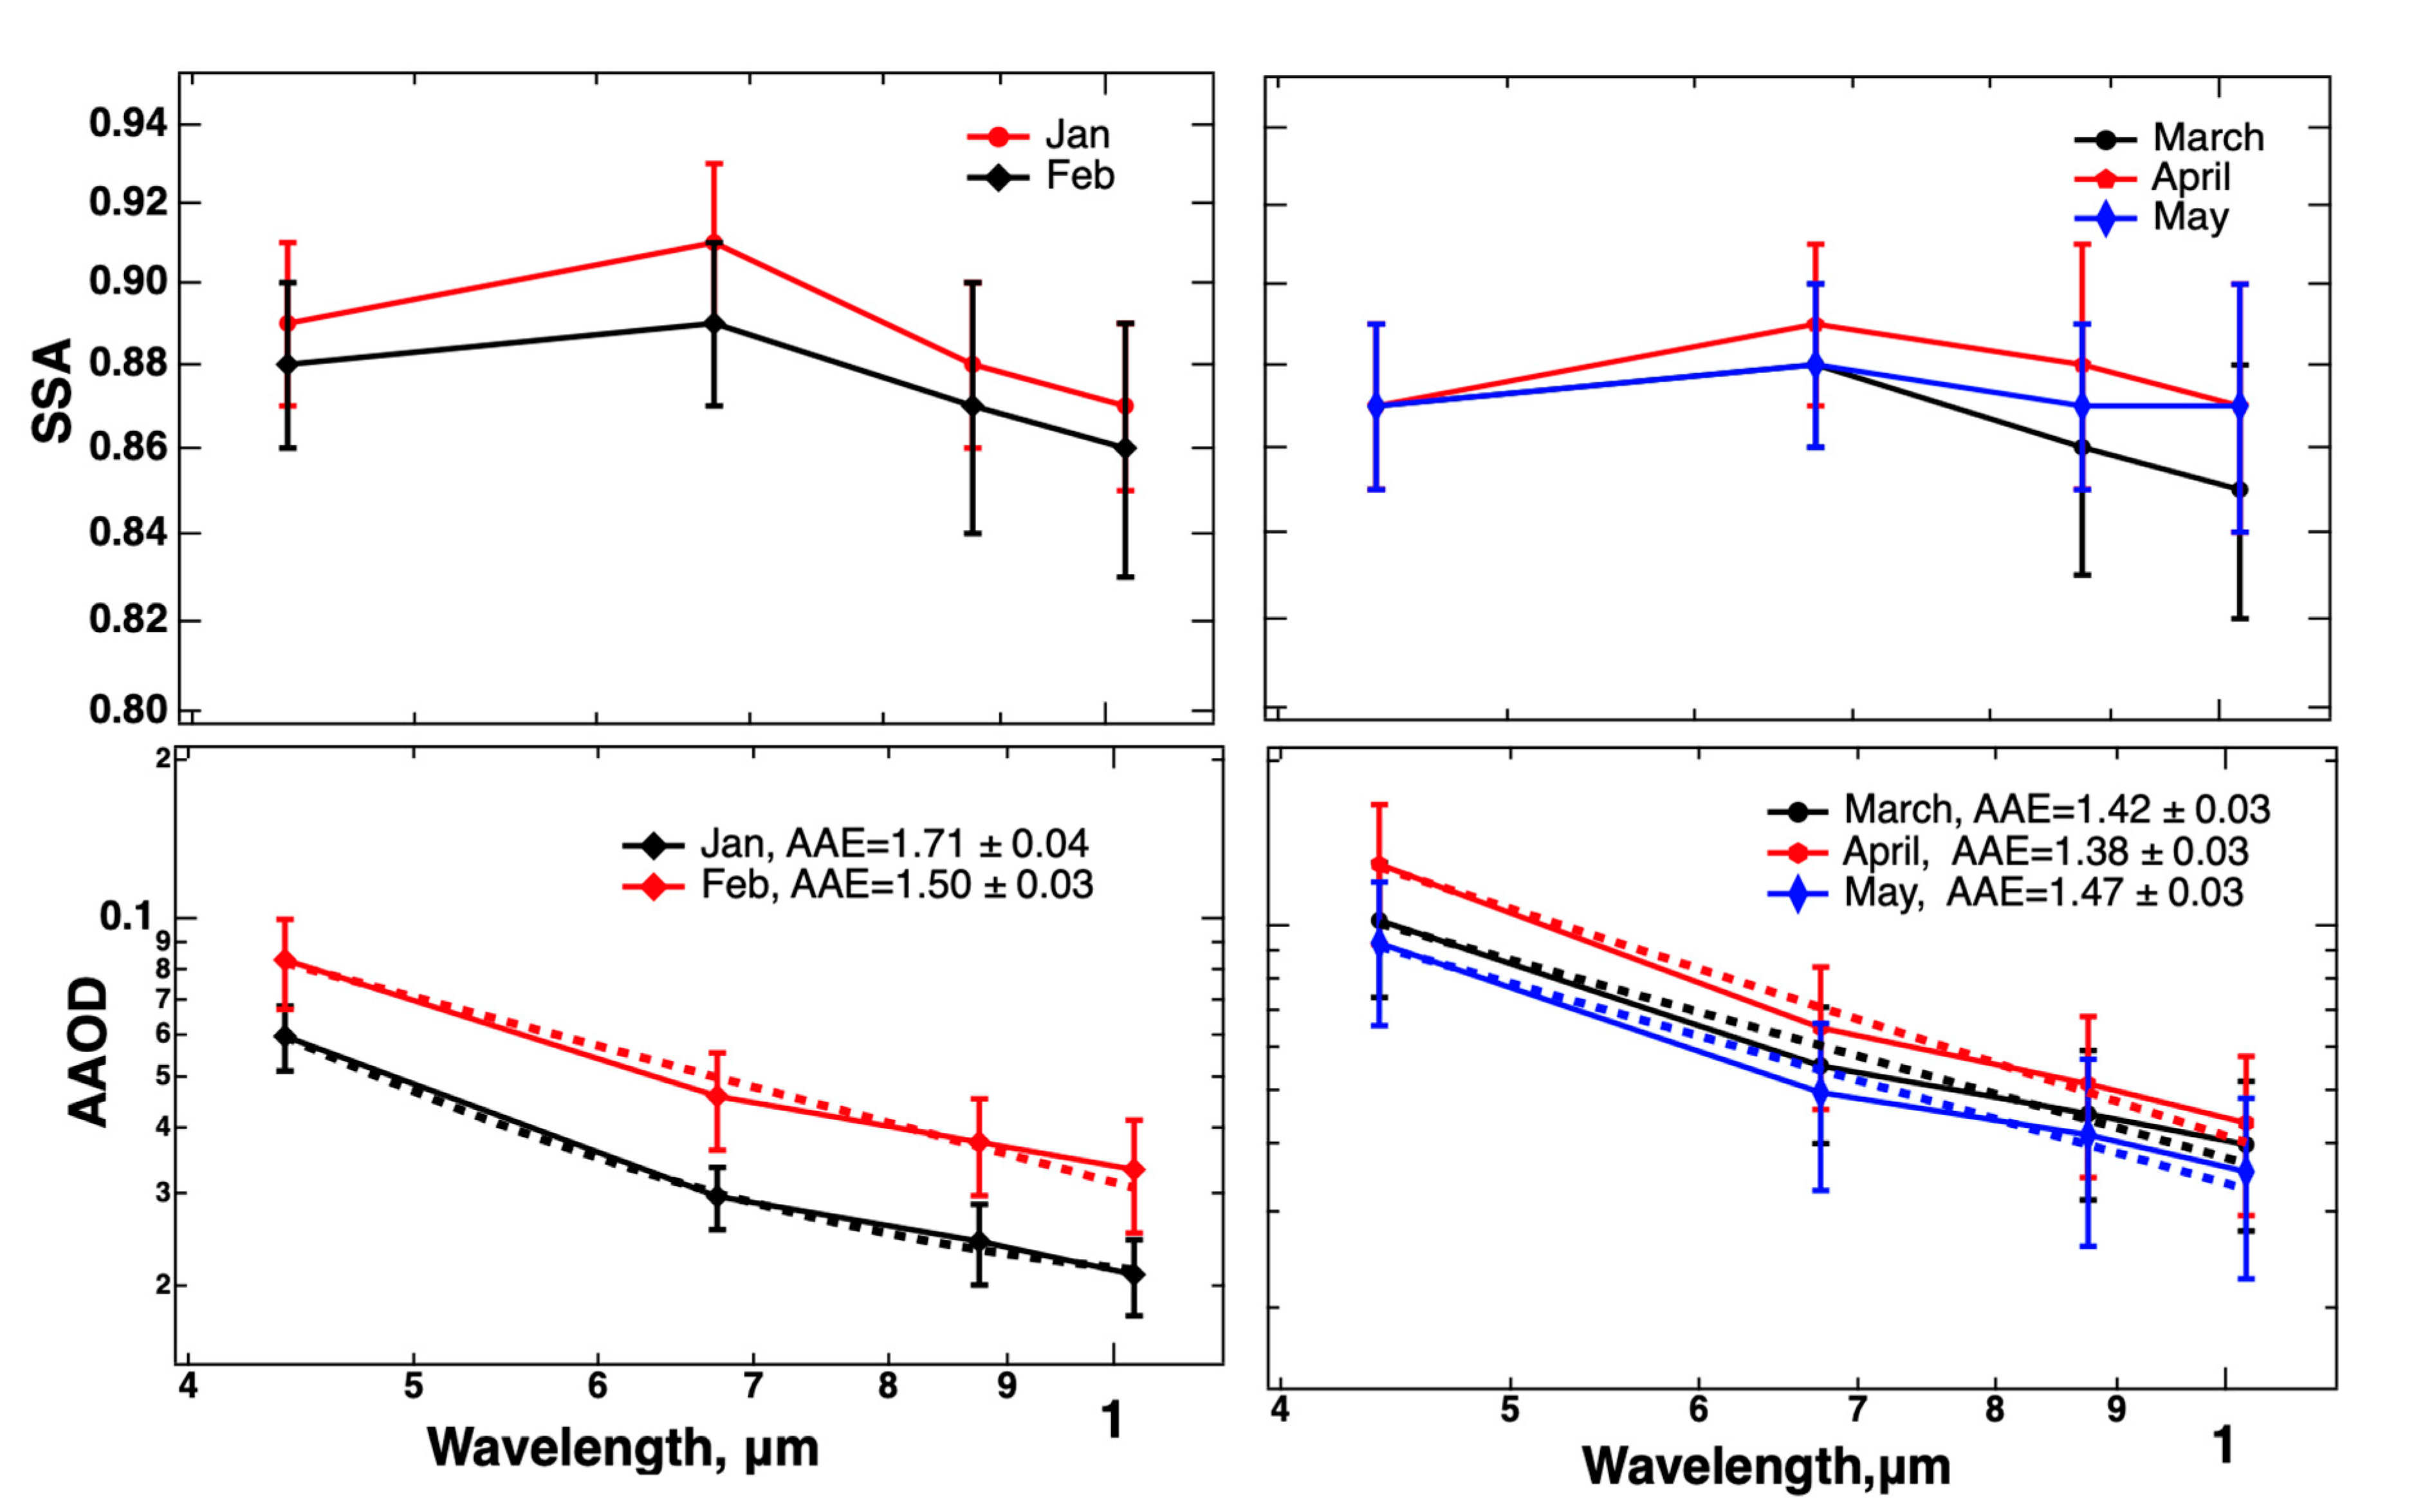
3.2. Angstrom Exponents, Curvature of AOD Spectra, SSA, AAOD and AAE

This section uses linear and second-order polynomial fit to study monthly and seasonal variation of spectral AOD in the wavelength ranges of 0.34 to 1.02 μm. Ångström parameters have been investigated in the past, by using spectral τAOD by distinguishing several AERONET sites with a variety of individual aerosol types such as biomass burning, urban and industrial, and desert dust [17].
Figure 4 shows monthly Ångström parameters ( α and β) and curvature of the spectral AOD curve ( α 2 ) . We observed that the average seasonal α as 1.14 ± 0.01 in winter, 1.17 ± 0.07 in the pre-monsoon season, 1.10 ± 0.08 in monsoon, and 1.22 ± 0.08 in the post-monsoon season, based on the monthly mean data. Similarly,   α   ( = 2 α 2 ) were obtained 1.03 ± 0.23 for winter, 0.55 ± 0.14 for pre-monsoon, 0.23 ± 0.38 for monsoon, and 1.22 ± 0.08 for post-monsoon seasons. The seasonal turbidity parameters, β, were also found 0.18 ± 0.05 in winter, 0.31 ± 0.04 in pre-monsoon, 0.11 ± 0.06 in monsoon, and 0.16 ± 0.04 in post-monsoon seasons. Moreover, β gives a picture of aerosol loading with the higher the value, the higher the aerosol loading, and similarly, smaller β shows lower aerosol loading. We observe from Figure 4 that α shows more or less the same from one season to another, even though with a significant variation of τ0.50, by indicating the seasonal differences of the aerosol size spectrum.
However, α can be seen to be the highest in post-monsoon, followed by pre-monsoon, winter, and monsoon. We found different values of   α   , even for a similar value of α , which indicates that the variation of aerosol microphysical properties can be presented by a climatological pattern of   α   rather than α .   Figure 5a,b show that the significant variation on   α   are observed for the months even with the similar α . It was observed mainly in the months of a shift from one season to another season, in which prevailing air masses will also be in transition. Higher values of   α   (greater or close to 1) in the post-monsoon season followed by winter season provide a picture of columnar aerosol size distribution showing strong contribution by fine mode particles, which are mainly originated from anthropogenic, biomass burning, urban and industrial sources. The medium values (close to 0.5) in the pre-monsoon indicate a bimodal distribution of particles, and while the lowest values of   α   (close to 0.2) in monsoon season indicate a dominance by coarse mode particles.
The monthly mean variation of τ0.50 and β is shown in Figure 5a. We found that τ0.50 and β show a significant correlation (R2 = 0.98 and p-value = 4.6   × 10 11 ,   scatter plot is not shown). This result shows that higher values of β correlating with τ0.50 was associated with aerosol loading, mainly dominated by fine mode aerosols. In July and August (peak monsoon) of monsoon, we observed lowest β along with low τ0.50, and smallest values of α ( ~ 1 ) , and   α   (smallest, closest to 0.2) supports the contribution of coarse mode particles compared to fine mode particles on overall AOD. The significantly low τ0.50 in monsoon compared to other seasons is associated with significant rainfall in this season [25,44].
We also analyzed α computed at different spectral bands, as shown in Figure 5b to identify the aerosol types. The difference in α at spectral bands ( α ( 0.675 0.87 ) α ( 0.34 0.38 ) ) was significantly higher in post-monsoon and winter seasons, indicating a size distribution dominated by fine modes (Figure 5b). The difference lowers in months of pre-monsoon seasons, supporting the company of coarse mode as well. This difference is negative in the monsoon season, which indicated domination by coarse mode aerosols [17,19].
The aspect of change in aerosol size spectrum, based on Angstrom parameters, is also examined by using aerosol volume size distribution data obtained from AERONET over Pokhara site. July to September data are not analyzed due to the limitation of availability of data in AERONET. Figure 6 shows the monthly mean of the aerosol volume size distribution for different seasons, along with   α   and α , and reveals a bimodal structure of aerosol sizes for each month. It is observed from Figure 6 that the volume size distribution for the months are significantly dominated by accumulation mode of aerosols (with higher   α   ), both modes of aerosol sizes (with the medium   α   ), and coarse modes (with smaller   α   ). For this study, July to September volume size distribution data are not available for comparison.
Figure 7 shows mean values of SSA and AAOD for five different months of winter and pre-monsoon season to study absorbing aerosols. These months are chosen because of the data availability in the AERONET site. SSA’s spectral variation, the top two figures, shows that SSA increases from 0.44 to o.675 µm, and then decreases at higher wavelengths. SSA values are found as 0.89 (January), 0.88 (February), 0.87 (March), 0.87 (April), and 0.87 (May) at wavelength 0.44 μm, and indicate the presence of reasonably strong absorbing aerosol components. Figure 7, bottom two figures, shows AAOD spectra. Previous studies reported that SSA spectra of different AERONET locations with dust containing aerosols have increased SSA with increasing wavelength, while locations dominated by urban industrial or biomass burning decrease with increasing wavelength [2,4,45,46]. This trend was also used in the past studies to differentiate between carbonaceous aerosols and dust in different locations [2,10,47,48].
The behaviors of increasing of SSA spectra up to 0.675 µm resemble aerosol components from dust aerosols, and decreasing from 0.675 µm to 1.02 µm shows similar to that of aerosol products of biomass burning, urban and industrial activities. Similar results can also be found in previous studies to define a mixed type of aerosols [45,46].
The spectral dependence of AAOD was also used to compute the absorption Ångström exponent (AAE), using a linear regression fit on the logarithmic scale plot [2,45,46]. AAE data were found for January (1.71 ± 0.04), February (1.50 ± 0.03), March (1.42 ± 0.03), April (1.38 ± 0.03) and May (1.47 ± 0.03), with ranges 1.38 to 1.71. Various studies have been done in the IGP region and different locations of AERONET to investigate the AAE based on types of aerosols [2,49,50,51]. These previous investigations have shown that AAE values vary from 1.2 to 3 for dust, 0.75 to 1.3 for urban and industrial aerosols, and 1.2 to 2 for biomass burning. Similarly, in different studies on the AERONET sites dominated by an optical mixture of smoke, dust, and industrial and urban pollution, have reported AAE in the ranges of 1.2 to 1.8 [52]. AAE observed in this study also lies in the range, indicating the absorbing behavior of aerosol components obtained in the mixed type of aerosols.

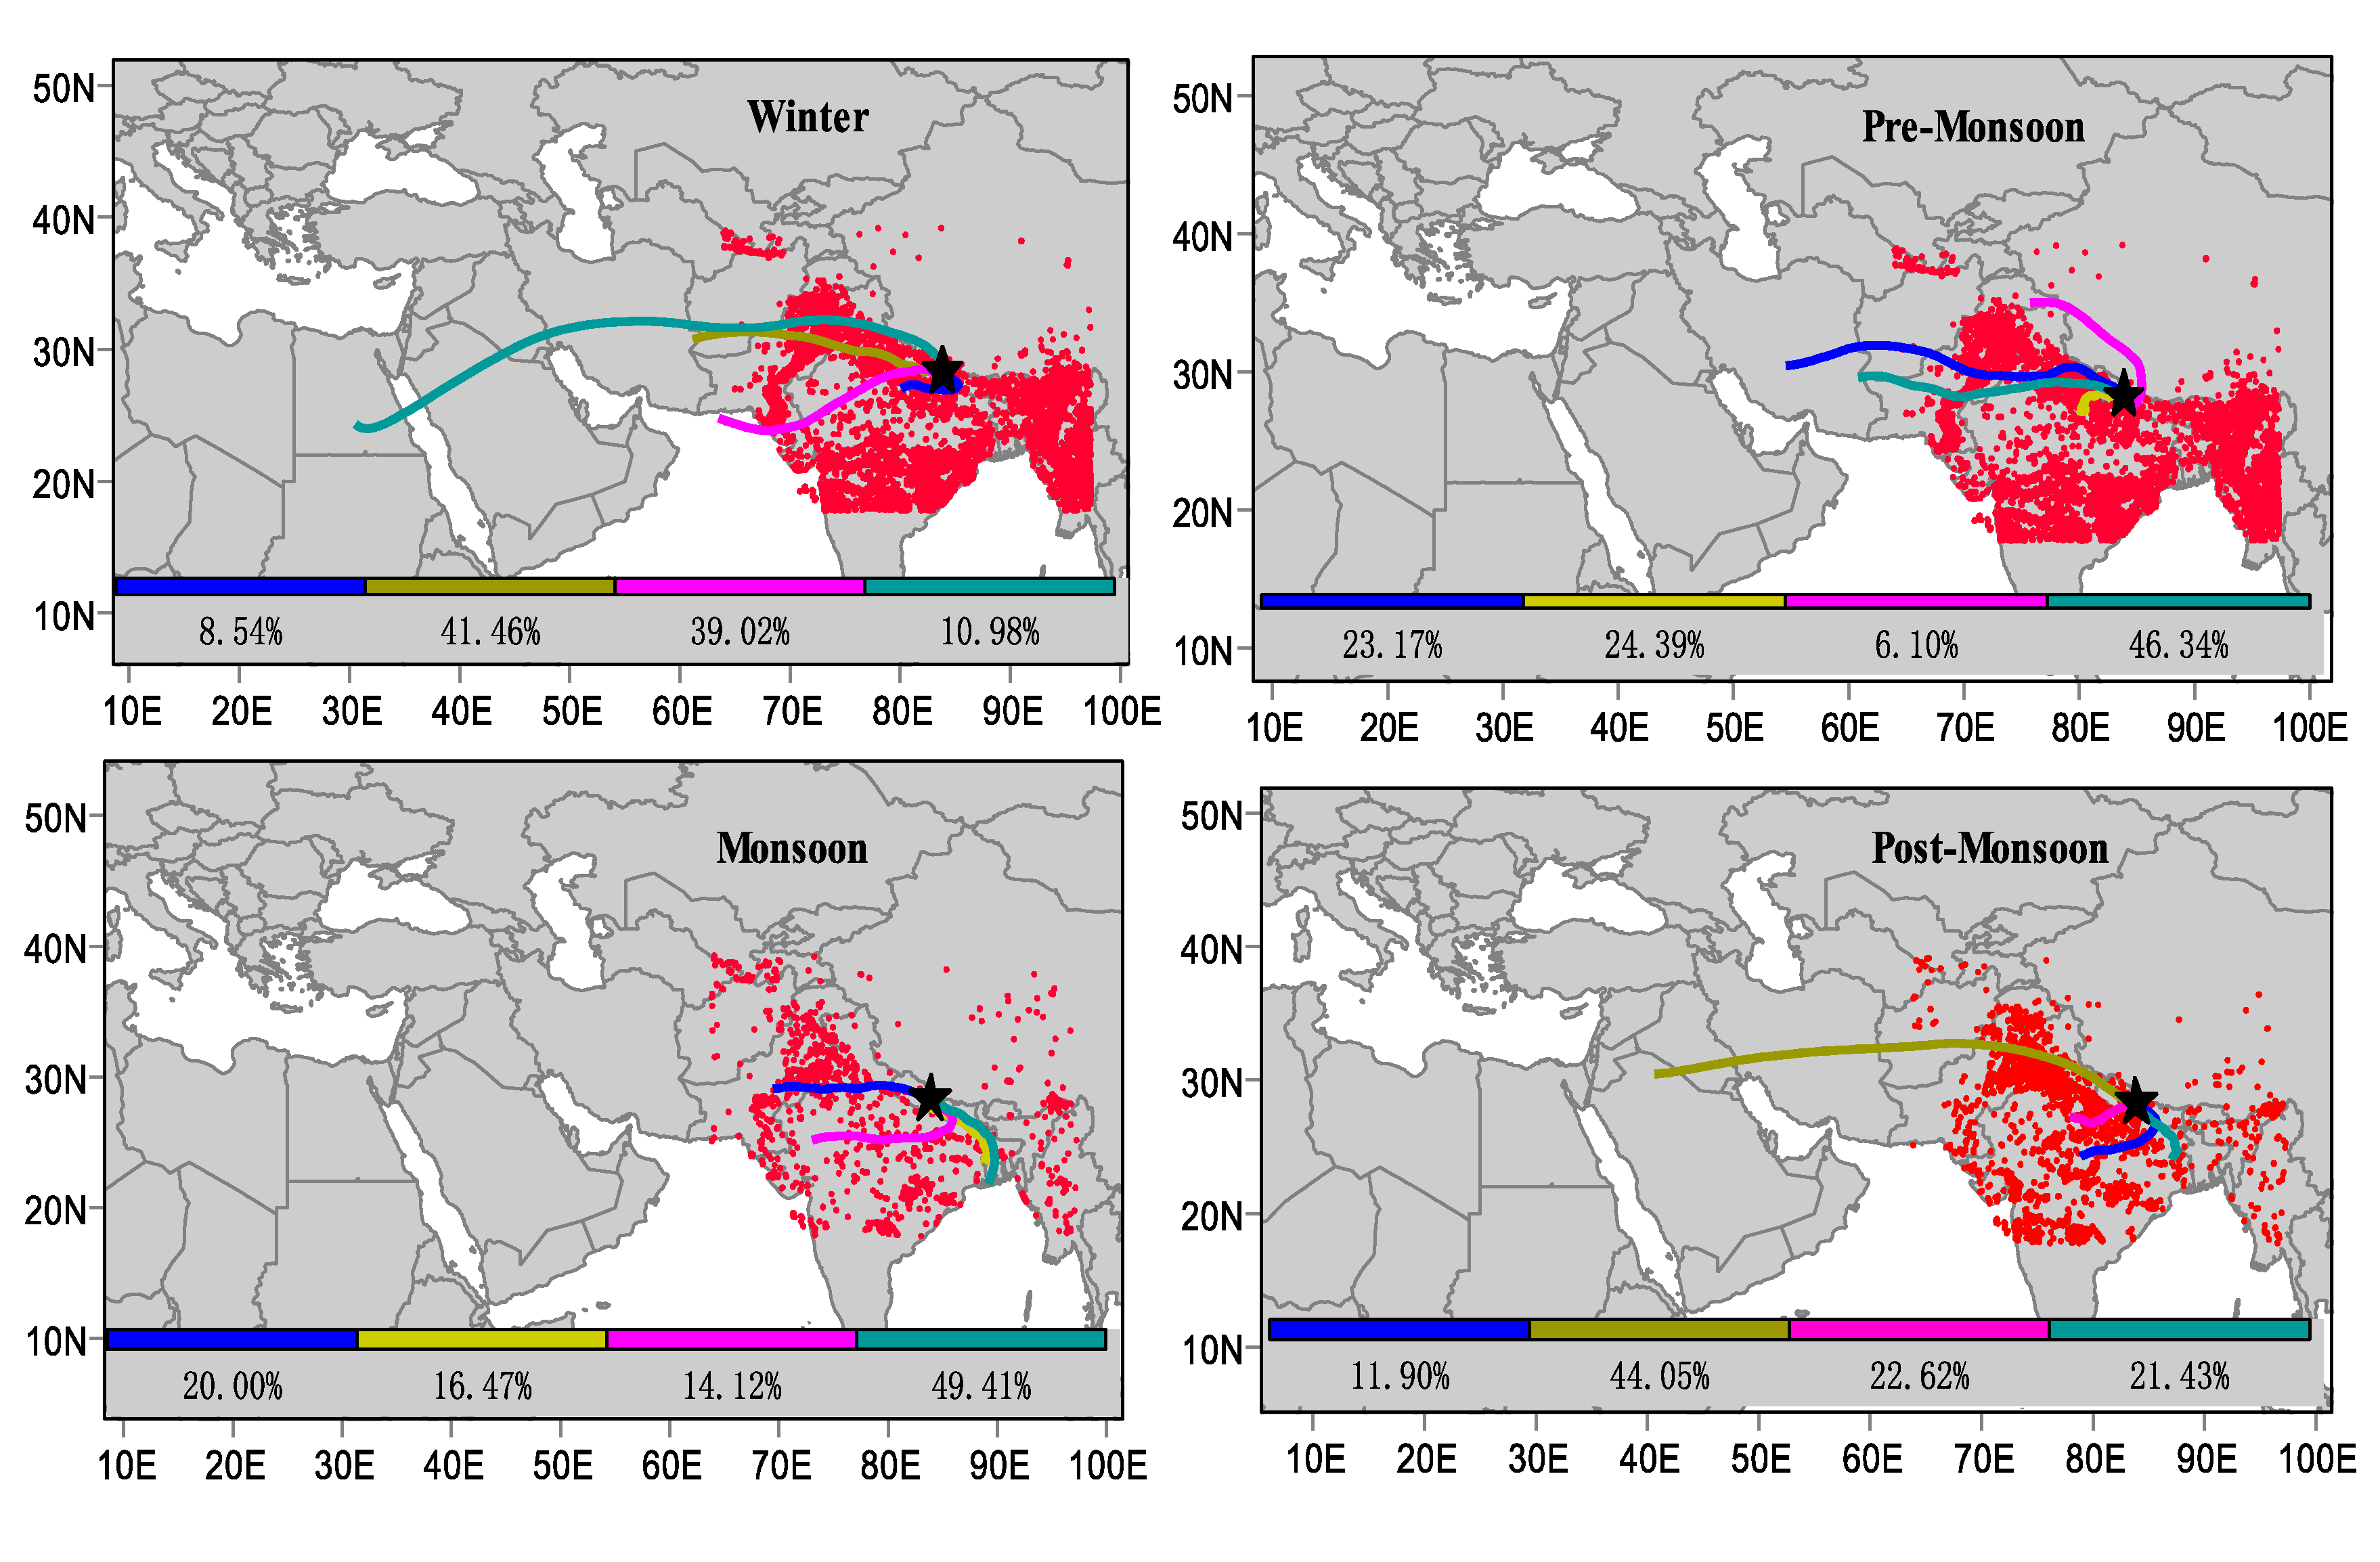
3.3. Investigation of Aerosol Sources and Types

Figure 8 shows the seasonal clusters of five days air mass back trajectories arriving at the observation site Pokhara at an altitude of 500 m and active fire spots (red dots) for 2017. The percentage contribution of each cluster is also shown in the figure for each season. The air masses reaching Pokhara valley follow two distinctive pathways from the Indo Gangetic Plain (IGP) region, during winter and pre-monsoon (Western Nepal, West India, and Pakistan), when the influence of strong western disturbances occur. During monsoon, majority of air masses arrived from the eastern IGP region and Bay of Bengal. Dense fire spots are observed during winter and pre-monsoon period over the region, which can enhance the emission of aerosols from biomass burning, that could be transported to Pokhara and influence the air quality and enhance AOD during that period [53]. In addition, during the post-monsoon, widespread crop residue burning occurs in the north-west part of India [54]. Comparatively few active fire spots are detected during the monsoon season, which might be due to cloud cover and heavy rainfall in South Asia, caused by moist air from the Arabian Sea and Bay of Bengal.
It is evident from previous analyses of aerosol chemical composition over the Himalayan foothill in Nepal that the emission from crop-residue burning over the IGP has a significant impact on the air quality over the regions [24,28,46,55,56,57,58,59]. The cluster analysis of trajectories in this study also indicates the high likelihood that the aerosol population’s physical and optical properties over the Pokhara valley could be influenced significantly by the regional transport of air masses from polluted regions of South Asia. This could be further confirmed by looking at MODIS visible imagery, showing continuous aerosol haze layers extending up from the IGP into the Himalayan valleys (Figure 9a,b). The MODIS satellite image taken on 27 October 2017 reasonably shows emissions from biomass burning. The biomass burning smoke funnels through the densely populated and industrialized areas on IGP, and after mixing with anthropogenic pollution background, it comfortably transports to Nepal’s Pokhara valley, and is also suggested by the HYSPLIT back trajectory analysis (Figure 9b).

4. Conclusions

We have been able to study a cluster analysis of the aerosol climatology over Pokhara, an AERONET site located on a Himalayan foothill, based on long-term aerosol optical properties, size spectra and regional aerosol sources, and the long-range transport of aerosols over the observation site. The variation of AOD spectra and the magnitude of AOD are strongly associated with the change in seasons that brings different air masses over the observation site.
The maximum τ0.50 in the pre-monsoon season (0.75 ± 0.15), followed by winter (0.43 ± 0.12), post-monsoon (0.39 ± 0.08), and monsoon (0.27 ± 0.13) seasons, show different aerosol loading, by a varying amount of wind-driven long-range transport of aerosols (mainly dust and aerosols from biomass burning, urban-industrial activities). The strong correlation between τ0.50 and β also shows the association of seasonal aerosol loadings to influence the τ0.50. The air masses back trajectory and local and regional fire spots were supported, to investigate the effect of transboundary air pollution, from different sectors over Pokhara. We find that Pokhara receives dominating westerly air masses during the post-monsoon season, indicating a significant effect of biomass burning, such as crop residue burning over the northeast part of Pakistan. Both westerly and southwesterly air masses crossing over the Thar desert of India affect the area during the pre-monsoon and winter seasons. The pre-monsoon season (April and May) is mainly crop harvesting time, such as wheat, in the northwest area of Pakistan, and the smoke of burning crop residue easily diffuses to the atmosphere to be transported to Pokhara. The monsoon season is significantly associated with the transport of aerosols from the side of the Bay of Bengal. The trajectory analysis provides a unique background knowledge of aerosol components, which arrives over Pokhara by mixing with anthropogenic pollution background and natural aerosols, while passing over the heavily polluted IGP or coming from the IGP.
The study of spectral variation of AOD by using α ,the first derivative of the angstrom exponent ( α ) with the wavelength in log scale distinguishes the aerosol size distribution, even with a similar value of α . Furthermore, 𝛼′ is found to be more sensitive for months when there is a transition from one season to another. This investigation suggests that the analysis of 𝛼′ gives a more sensible complement of 𝛼 to characterize more fully wavelength dependence of AOD and the comparative influence of aerosol size spectra of two modes in aerosol loading. Intermediate AAE values range from 1.38 to 1.78, and the increasing and decreasing nature of SSA with wavelengths (analyzed only for winter and pre-monsoon seasons due to limitations of availability of data) proved beneficial for identifying the aerosols over Pokhara as a mixed type of aerosols, such as dust, aerosols from biomass burning and urban-industrial activities.
We consider the presented methodology as a useful tool for the calibration of aerosol optical properties, and advancing knowledge on aerosol climatology over the Himalaya region of Nepal.

Author Contributions

J.R. is the prime author of this paper and was involved in preparing the manuscript, data and graphical analysis. A.B. was responsible for analyzing aerosol data and supporting the preparation of the manuscript. A.P. (Arnico Panday), the Pokhara AERONET site’s Principal Investigator, was responsible for the site’s establishment of and also critically reviewed the manuscript. L.T. supported the cluster Analysis and fire spots. R.A., M.G., A.P. (Amod Pokhrel), and K.N.P. supported manuscript review and analyzing the results. All authors have read and agreed to the published version of the manuscript.

Funding

This research work has received no external funding.

Acknowledgments

Authors are thankful to AERONET group of NASA, USA for providing the online aerosol optical data. We are also thankful to the National Oceanic Atmospheric, Administration Air Resources Laboratory (NOAA-ARL) for providing the HYSPLIT air mass back trajectories, and MODIS satellite fire spots data. The authors also thank Hotel Shangrila Village in Pokhara for providing space on the hotel roof for the AERONET station, and Gupta Giri for ongoing technical support. We are also thankful to the anonymous reviewers for their thoughtful comments and suggestions, which helped us improve the manuscript.

Conflicts of Interest

The authors declare no conflict of interest.

References

  1. Myhre, G.; Berglen, T.F.; Johnsrud, M.; Hoyle, C.R.; Berntsen, T.K.; Christopher, S.A.; Fahey, D.W.; Isaksen, I.S.A.; Jones, T.A.; Kahn, R.A.; et al. Modelled radiative forcing of the direct aerosol effect with multi-observation evaluation. Atmos. Chem. Phys. 2009, 9, 1365–1392. [Google Scholar] [CrossRef] [Green Version]
  2. Bergstrom, R.W.; Pilewskie, P.; Russell, P.B.; Redemann, J.; Bond, T.C.; Quinn, P.K.; Sierau, B. Spectral absorption properties of atmospheric aerosols. Atmos. Chem. Phys. 2007, 7, 5937–5943. [Google Scholar] [CrossRef] [Green Version]
  3. Russell, P.B.; Bergstrom, R.W.; Shinozuka, Y.; Clarke, A.D.; DeCarlo, P.F.; Jimenez, J.L.; Livingston, J.M.; Redemann, J.; Dubovik, O.; Strawa, A. Absorption Angstrom Exponent in AERONET and related data as an indicator of aerosol composition. Atmos. Chem. Phys. 2010, 10, 1155–1169. [Google Scholar] [CrossRef] [Green Version]
  4. Li, C.; Chen, P.; Kang, S.; Yan, F.; Tripathee, L.; Wu, G.; Qu, B.; Sillanpää, M.; Yang, D.; Dittmar, T.; et al. Fossil fuel combustion emission from South Asia influences precipitation dissolved organic carbon reaching the remote Tibetan plateau: Isotopic and molecular evidence. J. Geophys. Res. Atmos. 2018, 123, 6248–6258. [Google Scholar] [CrossRef]
  5. Dhungel, S.; Kathayat, B.; Mahata, K.; Panday, A. Transport of regional pollutants through a remote trans-Himalayan valley in Nepal. Atmos. Chem. Phys. 2018, 18, 1203–1216. [Google Scholar] [CrossRef] [Green Version]
  6. Xu, B.; Cao, J.; Hansen, J.; Yao, T.; Joswia, D.R.; Wang, N.; Wu, G.; Wang, M.; Zhao, H.; Yang, W.; et al. Black soot and the survival of Tibetan glaciers. Proc. Natl. Acad. Sci. USA 2010, 106, 22114–22118. [Google Scholar] [CrossRef] [Green Version]
  7. Li, C.; Bosch, C.; Kang, S.; Andersson, A.; Chen, P.; Zhang, Q.; Cong, Z.; Bing, C.; Qin, D.; Gustafsson, Ö. Sources of black carbon to the Himalayan–Tibetan Plateau glaciers. Nat. Commun. 2016, 7, 12574. [Google Scholar] [CrossRef]
  8. Zhang, R.; Wang, H.; Qian, Y.; Rasch, P.J.; Easter, R.C.; Ma, P.L.; Singh, B.; Huang, J. Quantifying sources, transport, deposition, and radiative forcing of black carbon over the Himalayas and Tibetan Plateau. Atmos. Chem. Phys. 2015, 15, 77–121. [Google Scholar] [CrossRef]
  9. Singh, A.; Mahata, K.S.; Rupakheti, M.; Junkermann, W.; Panday, A.K. An overview of airborne measurement in Nepal–Part 1: Vertical profile of aerosol size, number, spectral absorption, and meteorology. Atmos. Chem. Phys. 2019, 19, 245–258. [Google Scholar] [CrossRef] [Green Version]
  10. Kaskaoutis, D.G.; Sifakis, N.; Retalis, A.; Kambezidis, H.D. Aerosol monitoring over athens using satellite and ground-based measurements. Adv. Meteorol. 2010, 12. [Google Scholar] [CrossRef] [Green Version]
  11. Aryal, R.P.; Voss, K.J.; Terman, P.A.; Keene, W.C.; Moody, J.L.; Welton, E.J.; Holben, B.N. Comparison of surface and column measurements of aerosol scattering properties over the western North Atlantic Ocean at Bermuda. Atmos. Chem. Phys. 2014, 14, 7617–7629. [Google Scholar] [CrossRef] [Green Version]
  12. Holben, B.; Eck, T.; Slutsker, I.; Tanre, D.; Buis, J.; Setzer, A.; Vermote, E.; Reagan, J.; Kaufman, Y.; Nakajima, T.; et al. AERONET—A federated instrument network and data archive for aerosol characterization. Remote Sens. Environ. 1998, 66, 1–16. [Google Scholar] [CrossRef]
  13. Stein, A.F.; Draxler, R.R.; Rolph, G.D.; Stunder, B.J.B.; Cohen, M.D.; Ngan, F. NOAA’s HYSPLIT atmospheric transport and dispersion modeling system. Bull. Am. Meteor. Soc. 2015, 96, 2059–2077. [Google Scholar] [CrossRef]
  14. Holben, B.; Tanre, D.; Smirnov, A.; Eck, T.; Slutsker, I.; Abuhassan, N.; Newcomb, W.; Schafer, J.; Chatenet, B.; Lavenu, F.; et al. An emerging ground-based aerosol climatology: Aerosol optical depth from AERONET. J. Geophys. Res. 2001, 106, 12067–12097. [Google Scholar] [CrossRef]
  15. AERONET. Available online: http://aeronet.gsfc.nasa.gov/ (accessed on 1 April 2015).
  16. Dubovik, O.; King, M.A. Flexible inversion algorithm for retrieval of aerosol optical properties from sun and sky radiance measurements. J. Geophys. Res. 2000, 105, 20673–20696. [Google Scholar] [CrossRef] [Green Version]
  17. Eck, T.F.; Holben, B.N.; Reid, J.S.; Dubovik, O.; Smirnov, A.; O’ Neill, N.T.; Slutsker, I.; Kinne, S. Wavelength Dependence of the Optical Dept of Bio Mass Burning, Urban, and Desert Dust Aerosols. J. Geophys. Res. 1999, 104, 31333–31349. [Google Scholar] [CrossRef]
  18. Schuster, G.L.; Dubovik, O.; Holben, B.N. Ångström exponent and bimodal aerosol size distributions. J. Geophys. Res. Atmos. 2006, 111, 1–14. [Google Scholar] [CrossRef] [Green Version]
  19. Kaskaoutis, D.G.; Kambezidis, H.D.; Hatzianastassiou, N.; Kosmopoulos, P.G.; Badarinath, K.V.S. Aerosol climatology: Dependence of the Angstrom exponent on wavelength over four AERONET sites. Atmos. Chem. Phys. Discuss. 2007, 7, 7347–7397. [Google Scholar] [CrossRef]
  20. Holben, B.; Eck, T.; Slutsker, I.; Smirnov, A.; Schafer, J.; Giles, D.; Dubovik, O. AERONET’s Version 2.0 quality assurance criteria. Proc. SPIE 2006, 6408, 64080Q. [Google Scholar]
  21. Giles, D.M.; Sinyuk, M.S.; Sorokin, J.S.; Schafer, A.; Smirnov, I.; Slutsker, T.F.; Eck, B.N.; Holben, J.R.; Lewis, J.R.; Campbell, E.J.; et al. Advancements in the Aerosol Robotic Network (AERONET) Version 3 database–automated near real-time quality control algorithm with improved cloud screening for Sun photometer aerosol optical depth measurements. Atmos. Meas. Tech. 2019, 12, 169–209. [Google Scholar] [CrossRef] [Green Version]
  22. HYSPLIT. Available online: https://www.ready.noaa.gov/HYSPLIT_traj.php/ (accessed on 2 April 2020).
  23. Kim, S.W.; Yoon, S.C.; Kim, J.; Kim, S.Y. Seasonal and monthly variations of columnar aerosol optical properties over East Asia determined from multi-year MODIS, LiDAR, and AERONET sun/sky radiometer measurements. Atmos. Environ. 2007, 41, 1634–1651. [Google Scholar] [CrossRef]
  24. Tripathee, L.; Kang, S.C.; Rupakheti, D.; Zhang, Q.G.; Huang, J.; Sillanpää, M. Water-soluble ionic composition of aerosols at urban location in the foothills of Himalaya, Pokhara Valley, Nepal. Atmosphere 2016, 7, 102. [Google Scholar] [CrossRef] [Green Version]
  25. Bhattarai, B.C.; Burkhart, J.F.; Stordal, F.; Xu, C.-Y. Aerosol Optical Depth Over the Nepalese Cryosphere Derived from an Empirical Model. Front. Earth Sci. 2019, 7, 178. [Google Scholar] [CrossRef]
  26. Xu, C.; Ma, Y.M.; Pandey, A.; Cong, Z.Y.; Yang, K.; Zhu, Z.K.; Wang, J.M.; Amatya, P.M.; Zhao, L. Similarities and differences of aerosol optical properties between southern and northern slopes of the Himalayas. Atmos. Chem. Phys. 2014, 14, 3133–3149. [Google Scholar] [CrossRef] [Green Version]
  27. Ranabhat, C.L.; Kim, C.-B.; Kim, C.-S.; Jha, N.; Deepak, K.C.; Connel, F.A. Consequence of indoor air pollution in rural area of Nepal: A simplified measurement approach. Front. Public Health 2015, 3, 5. [Google Scholar] [CrossRef] [Green Version]
  28. Wan, X.; Kang, S.; Li, Q.; Rupakheti, D.; Zhang, Q.; Guo, J.; Chen, P.; Tripathee, L.; Rupakheti, M.; Panday, A.K.; et al. Organic molecular tracers in the atmospheric aerosols from Lumbini, Nepal, in the northern Indo-Gangetic Plain: Influence of biomass burning. Atmos. Chem. Phys. 2017, 17, 8867–8885. [Google Scholar] [CrossRef] [Green Version]
  29. Gautam, R.; Hsu, N.C.; Lau, K.M. Premonsoon aerosol characterization and radiative effects over the Indo-Gangetic Plains: Implications for regional climate warming. J. Geophys. Res. 2010, 115, 1383–1392. [Google Scholar] [CrossRef]
  30. Kumar, M.; Parmar, K.S.; Kumar, D.B.; Mhawish, A.; Broday, D.M.; Mall, R.K.; Banerjee, T. Long-term aerosol climatology over Indo-Gangetic Plain: Trend, prediction and potential source fields. Atmos Environ. 2018, 180, 37–50. [Google Scholar] [CrossRef]
  31. National Population and Housing Census 2011. Available online: https://unstats.un.org/unsd/demographic-social/census/documents/Nepal/Nepal-Census-2011-Vol1.pdf (accessed on 10 August 2020).
  32. Poudyal, K.N.; Bhattarai, B.K.; Sapkota, B.K.; Kjeldstad, B.; Karki, N.R. Estimation of Global Solar Radiation using Pyranometer and NILU-UV Irradiance Meter at Pokhara Valley in Nepal. J. Inst. Eng. 2014, 9, 69–78. [Google Scholar] [CrossRef] [Green Version]
  33. Home. Available online: https://www.pinterest.com/pin/259238522278164839/ (accessed on 12 August 2020).
  34. Ångström, A. Techniques of Determinig the Turbidity of the Atmosphere. Tellus B 1961, 214–223. [Google Scholar] [CrossRef]
  35. Gyawali, M.; Arnott, W.P.; Lewis, K.; Moosmüller, H. In situ aerosol optics in Reno, NV, 5 USA during and after the summer 2008 California wildfires and the influence of absorbing and non-absorbing organic coatings on spectral light absorption. Atmos. Chem. Phys. 2009, 9, 8007–8015. [Google Scholar] [CrossRef] [Green Version]
  36. Wang, Y. MeteoInfo: GIS software for meteorological data visualization and analysis. Meteorol. Appl. 2014, 21, 360–368. [Google Scholar] [CrossRef]
  37. Morton, D.C.; Defries, R.S.; Randerson, J.T.; Giglio, L.; Schroeder, W.; van der Werf, G.R. Agricultural intensification increases deforestation fire activity in Amazonia. Glob. Chang. Biol. 2008, 14, 2262–2275. [Google Scholar] [CrossRef] [Green Version]
  38. Zhang, X.; Kondragunta, S.; Ram, J.; Schmidt, C.; Huang, H.C. Near real time global biomass burning emissions product from geostationary satellite constellation. Geophys. Res. Atmos. 2012, 117. [Google Scholar] [CrossRef]
  39. Li, J.; Li, X.; Carlson, B.E.; Kahn, R.A.; Lacis, A.A.; Dubovik, O.; Nakajima, T. Reducing multi-sensor satellite monthly mean aerosol optical depth uncertainty, Part I: Objective assessment of current AERONET locations. J. Geophys. Res. Atmos. 2016, 121, 13609–13626. [Google Scholar] [CrossRef]
  40. Government of Nepal, Ministry of Energy, Water Resources and Irrigation. Available online: https://www.dhm.gov.np/climate/ (accessed on 10 July 2020).
  41. Herrmann, H.; Schaefer, T.; Tilgner, A.; Styler, S.A.; Weller, C.; Teich, M.; Otto, T. Tropospheric aqueous-phase chemistry: Kinetics, mechanisms, and its coupling to a changing gas phase. Chem. Rev. 2015, 115, 4259–4334. [Google Scholar] [CrossRef]
  42. Altaratz, O.R.; Bar-Or, Z.; Wollner, U.; Koren, I. Relative humidity and its effect on aerosol optical depth in the vicinity of convective clouds. Environ. Res. Lett. 2013, 8, 034025. [Google Scholar] [CrossRef]
  43. Dumka, U.C.; Tripathi, S.N.; Misra, A.; Giles, D.M.; Eck, T.F.; Sagar, R.; Holben, B.N. Latitudinal variation of aerosol properties from Indo-Gangetic Plain to central Himalayan foothills during TIGERZ campaign. J. Geophys. Res. 2014, 119, 4750–4769. [Google Scholar] [CrossRef]
  44. Sigdel, M.; Ikeda, M. Summer Monsoon Rainfall over Nepal Related with Large-Scale Atmospheric Circulations. J. Earth Sci Climate Change 2012, 3, 112. [Google Scholar] [CrossRef]
  45. Li, J.; Carlson, B.E.; Lacis, A.A. Using Single Scattering Albedo Spectral Curvature to Characterize East Asian Aerosol Mixtures. J. Geophys. Res. Atmos. 2015, 120, 2037–2052. [Google Scholar] [CrossRef]
  46. Mallet, M.; Dubovik, O.; Nabat, P.; Dulac, F.; Kahn, R.; Sciare, J.; Paronis, D.; Léon, J.F. Absorption properties of Mediterranean aerosols obtained from multi-year ground-based remote sensing observations. Atmos. Chem. Phys. 2013, 13, 9195–9210. [Google Scholar] [CrossRef] [Green Version]
  47. Collaud Coen, M.; Weingartner, E.; Schaub, D.; Hueglin, C.; Corrigan, C.; Henning, S.; Schwikowski, M.; Baltensperger, U. Saharan dust events at the jungfraujoch: Detection by wavelength dependence of the single scattering albedo and first climatology analysis. Atmos. Chem. Phys. 2004, 4, 2465–2480. [Google Scholar] [CrossRef] [Green Version]
  48. Meloni, D.; di Sarra, A.; Pace, G.; Monteleone, F. Aerosol optical properties at Lampedusa (Central Mediterranean). 2. Determination of single scattering albedo at two wavelengths for different aerosol types. Atmos. Chem. Phys. 2006, 6, 715–727. [Google Scholar] [CrossRef] [Green Version]
  49. Srivastava, A.K.; Tripathi, S.N.; Dey, S.; Kanawade, V.P.; Tiwari, S. Inferring Aerosol Types over the Indo-Gangetic Basin from Ground Based Sunphotometer Measurements. Atmos. Res. 2012, 109–110, 64–75. [Google Scholar] [CrossRef]
  50. Giles, D.; Holben, B.; Tripathi, S.; Eck, T.; Newcomb, W.; Slutsker, I.; Dickerson, R.; Thomspon, A.; Mattoo, S.; Wang, S.H.; et al. Aerosol properties over the Indo-Gangetic Plain: A mesoscale perspective from the TIGERZ experiment. J. Geophys. Res. 2011, 11. [Google Scholar] [CrossRef]
  51. Moody, J.L.; Keene, W.C.; Cooper, O.R.; Voss, K.J.; Aryal, R.; Eckhardt, S.; Holben, B.; Maben, J.R.; Izaguirre, M.A.; Galloway, J.N. Flow climatology for physicochemical properties of dichotomous aerosol over the western North Atlantic Ocean at Bermuda. Atmos. Chem. Phys. 2014, 14, 691–717. [Google Scholar] [CrossRef] [Green Version]
  52. Eck, T.F.; Holben, B.N.; Sinyuk, A.; Pinker, R.T.; Goloub, P.; Chen, H.; Chatenet, B.; Li, Z.; Singh, R.P.; Tripathi, S.N. Optical properties of fine/coarse mode aerosol mixtures. J. Geophys. Res. Atmos. 2010, 115, 5548–5554. [Google Scholar] [CrossRef] [Green Version]
  53. Kaskaoutis, D.G.; Kumar, S.; Sharma, D.; Singh, R.P.; Kharol, S.K.; Sharma, M.; Singh, A.K.; Singh, S.; Singh, A.; Singh, D. Effects of crop residue burning on aerosol properties, plume characteristics, and long-range transport over northern India. J. Geophys. Res. Atmos. 2013, 119, 5424–5444. [Google Scholar] [CrossRef]
  54. Guo, J.; Ram, K.; Tripathee, L.; Kang, S.; Huang, J.; Chen, P.; Ghimire, P.S. Study on Mercury in PM10 at an Urban Site in the Central Indo-Gangetic Plain: Seasonal Variability and Influencing Factors. Aerosol Air Qual. Res. 2020, in press. [Google Scholar] [CrossRef]
  55. Rupakheti, D.; Kang, S.; Rupakheti, M.; Cong, Z.; Tripathee, L.; Panday, A.K.; Holben, B.N. Observation of optical properties and sources of aerosols at Buddha’s birthplace, Lumbini, Nepal: Environmental implications. Environ. Sci. Pollut. Res. Int. 2018, 25, 14868–14881. [Google Scholar] [CrossRef]
  56. Kulshrestha, U.; Kumar, B. Airmass Trajectories and Long Range Transport of Pollutants: Review of Wet Deposition Scenario in South Asia. Adv. Meteorol. 2014, 2014, 596041. [Google Scholar] [CrossRef]
  57. Tripathee, L.; Guo, J.; Kang, S.; Paudyal, R.; Huang, J.; Sharma, C.M.; Zhang, Q.; Chen, P.; Ghimire, P.S.; Sigdel, M. Spatial and temporal distribution of total mercury in atmospheric wet precipitation at four sites from the Nepal-Himalayas. Sci. Total Environ. 2019, 655, 1207–1217. [Google Scholar] [CrossRef] [PubMed]
  58. Gautam, R.; Hsu, N.C.; Tsay, S.C.; Lau, K.M.; Holben, B.; Bell, S.; Smirnov, A.; Li, C.; Hansell, R.; Ji, Q.; et al. Accumulation of aerosols over the Indo-Gangetic plains and southern slopes of the Himalayas: Distribution, properties and radiative effects during the 2009 pre-monsoon season. Atmos. Chem. Phys. 2011, 11, 12841–12863. [Google Scholar] [CrossRef] [Green Version]
  59. Tripathee, L.; Kang, S.; Rupakheti, D.; Cong, Z.; Zhang, Q.; Huang, J. Chemical characteristics of soluble aerosols over the central Himalayas: Insights into spatiotemporal variations and sources. Environ. Sci. Pollut. Res. 2017, 24, 24454–24472. [Google Scholar] [CrossRef]
Figure 1. The map with the aerosol ground monitoring station (Pokhara, Nepal) has an inset in the bottom right corner that shows the Aerosol Robotic Network (AERONET) sun photometer in Pokhara (photo by Arnico Panday) and a compass rose on the left corner. This image is adopted from online resources, and horizontal and vertical scales in 200 miles are shown on the map.
Atmosphere 11 00874 g001
Figure 2. Spectral variation of monthly mean aerosol optical depth (AOD), over nine years between 2010–2018, in different seasons.
Atmosphere 11 00874 g002
Figure 3. Temporal variation, monthly mean τ0.50 (right axis), and precipitable water level in cm (left axis). The vertical dotted lines indicate the boundaries between different seasons.
Atmosphere 11 00874 g003
Figure 4. Ångström parameters ( α , β) computed by using the linear regression (solid line), and α 2 from second-order polynomial fit (dotted curve) of monthly mean spectral AOD, between years 2010–2018, in the logarithmic scale for different seasons, as indicated.
Atmosphere 11 00874 g004
Figure 5. Time series of (a) Aerosol Optical Depth at 0.50 µm and Ångström Turbidity Parameter β and curvature of the curve. (b) Ångström Exponent in different wavelength pairs.
Atmosphere 11 00874 g005
Figure 6. The monthly averaged columnar volume particle size distribution in the range of sizes 0.05 µm ≤ r ≤ 15 µm, for different seasons, as indicated.
Atmosphere 11 00874 g006
Figure 7. Monthly mean spectral SSA (top two figures), averaged within the months of the study period of years 2010–2018, from January to May, along with AAOD (bottom two figures) in the logarithmic scale. The dotted lines are the linear fit of spectral AAOD in the logarithmic scale.
Atmosphere 11 00874 g007
Figure 8. Clusters of five days air mass back trajectories computed with HYSPLIT model reaching Pokhara and at altitude 500 m and all active fire spots; each season is symbolized with red dots at different seasons (winter, pre-monsoon, monsoon and post-monsoon) of 2017. The percentage contributions of each cluster are shown in different colors.
Atmosphere 11 00874 g008
Figure 9. (a) The corrected reflectance true-color MODIS satellite image of the day 27 October 2017, shows intensive air pollution plumes over the IGP. (b) NOAA HYSPLIT MODEL Back Trajectories ending at 0600UTC on 27 October 2017. Horizontal and vertical scales of 400 miles on the left figure are shown.
Atmosphere 11 00874 g009

