Article

Dispersion of CO Using Computational Fluid Dynamics in a Real Urban Canyon in the City Center of Valencia (Spain)

by
Alejandro Marulanda Tobón
1,
Ignacio José Moncho-Esteve
2,
Jordi Martínez-Corral
3 and
Guillermo Palau-Salvador
4,*
1
Department of Phisical Sciences, Universidad Eafit, Carrera 49, Nº 7 Sur-50, Medellin 050022, Colombia
2
Fundació Assut, Calle Embarcador 28, 46012 El Saler, Valencia, Spain
3
Nuevas Tecnologías Forestales S.L. Avda. Rey Juan Carlos I 28, 16400 Tarancón, Spain
4
INGENIO (CSIC-UPV) Universitat Politècnica de València, Camino de Vera s/n, 46022 Valencia, Spain
*
Author to whom correspondence should be addressed.
Atmosphere 2020, 11(7), 693; https://doi.org/10.3390/atmos11070693
Submission received: 5 June 2020 / Accepted: 26 June 2020 / Published: 30 June 2020
(This article belongs to the Special Issue Traffic-Related Air Pollution and Its Impacts on Human Health)

Abstract

:
One of the main environmental problems we are currently facing is air pollution. Air quality models calculate how much pollution is emitted and dispersed into the atmosphere. This research presents a Computational Fluid Dynamic model using a real urban geometry for the analysis of CO contamination with a three-dimensional model. This method includes a procedure of calculating emissions using different types of vehicles. CO Measurements are obtained from a Wireless Sensor Network to validate the models. The present study analyzes six representative real cases of different traffic situations and climatic conditions plus 3 hypothetical cases in a hotspot area in the city center of Valencia. The results show what influences pollution levels the most is the wind direction, which influences the generation of velocity patterns. In the validation cases, the real wind direction is used and a slight change produces great differences in both velocities and CO concentration. In the hypothetical cases, parallel and perpendicular winds are defined to observe the differences when this ideal situation is applied. In conclusion, the mixing and transport of air pollutants are closely related to the structures of velocity and turbulence that occur in the air, which depends strongly on the wind direction.

1. Introduction

One of the main environmental problems affecting big cities today is air pollution. This pollution of the lower layers of the atmosphere in cities is mainly due to the emission of gases from internal combustion engines (passenger cars, motorcycles, etc.), as well as certain appliances (heating) or industries [1]. The pollutants are released in the form of gases, vapors, and even solid particles that can remain in suspension, being able to reach damaging levels posing a danger to human, plant, and animal health. Environmental problems that involve the discharge of pollutants into the air are very serious, increasingly important in aspects related to the health of city dwellers [1,2,3,4,5]. Nevertheless, between the years 1990–2014 a CO reduction of 83% in European countries has been achieved according to European Environment Agency [6].
The direct pollutants emitted by transport are nitrogen oxides (NOx), Sulfur Dioxide (SO2), Volatile Organic Compounds (VOCs), Carbon Monoxide (CO), suspended particles, and greenhouse gases. CO is the pollutant most produced by vehicles. It is produced by the incomplete combustion of fuel caused by the lack of oxygen.
The amount and manner in which a pollutant is emitted and dispersed to the atmosphere can be modeled by different methodologies and models. Some research tries to compare different models to analyze the deviation with experimental data, such as the Japan case [7]. The most widespread models are those of dispersion, due to their robustness, speed and complete parameterization of variables. The most used is the Danish Operational Street Pollution Model (OSPM), which has been validated in many cities and for different situations and pollutants (CO, NOx, PM10 and PM2.5) [8].
The integration of spatial information into pollutant dispersion models allows the integration, analysis, and simulation of spatial and temporal data while allowing the calculation of past, present, and future conditions, including the integration of intensity and emission information of traffic [9]. The analysis of spatial information for air quality has been used significantly in recent years [10,11,12]. Models that include the spatial component include techniques that are not always appropriate due to limitations, such as interpolation models.
For this reason, in recent years there has been a great advance in the numerical methods applied to the dispersion of pollutants [13]. Thanks to the increase in computational speed and capacity, numerical methods such as computational fluid dynamics (CFD) allow the development of complex system simulations. Its application in the dispersion of pollutants is widespread [14,15,16,17,18,19,20,21]. The main variables studied in the literature are; (i) the relationship between height and separation of buildings (H/W) [22,23]; (ii) modeling real buildings with complex geometries [24,25,26,27,28]; and (iii) the influence of the wind direction and velocity [29,30].
Among urban areas, urban canyons are geometries of great interest in the study of pollutant dispersion. An urban canyon can be defined as a narrow street confined between buildings, which can be composed of different geometries and aspect ratios [15]. It is characterized by the width of the street (W), the length of the street (B), and the height of the buildings (H), defining two different aspect ratios, W/H and B/H. CFD models have been often used in urban canyons over the last years, mainly because of the impact of pollution on human health [31]. The configurations of urban canyons have focused the attention of many CFD research projects, using Direct Numerical Simulations [32], Large Eddy Simulations [13], or Reynolds-Averaged Navier-Stokes models [33]. The physics of the flow in urban canyons is complex, presenting a wide variety of physical features including vortexes and acceleration patterns, and are eminently three-dimensional [34]. Vardoulakis et al. [14] studied the influence of the length of the urban canyons in the vortex generation. They observed that in short canyons (B/H ≈ 3) there was not enough space to create a stable vortex perpendicular to the street in the mid-section. Chan et al. [35] found that pollutant concentration can also be influenced by this B/H ratio. In Reference [36], they observed that one of the main factors which effects pollution is the vortices at the street ends. Furthermore, it is important to note that the use of realistic geometries can affect all these flow patterns as shown in References [37,38].
Moreover, among CFD modelers, there is a great concern of achieving grid independency [39] minimizing numerical diffusion errors. This goal is achieved by a great effort to create meshes based on a hexahedral element, even in complex geometries. Hefny and Oka [40] showed that it is recommended to use hexahedral elements since they reduce numerical errors, which influence greatly the pollutant dispersion modelling. This goal requires a balance between using high-quality grid resolution and an affordable number of cells reducing the computational needs.
In any case, one of the unknowns that all studies must address is the estimation of the emission coefficient of the fleet of vehicles circulating through city streets, specifically the emission of carbon monoxide (CO). One of the options recommended by the European Commission is the reverse modeling application, where air quality models are coupled to measured concentrations to strengthen the emission calculation [10,41,42]. The other option commonly used is to calculate the average emission using the vehicle’s inventory of the city [43,44,45].
In the present work, CO contamination in a realistic urban canyon in a hotspot area of Valencia is analyzed by experimental analysis and modeling with CFD. The real geometry of the buildings has been taken into account and the emission coefficient has been obtained averaging different types of vehicles’ emissions. The aspect ratio, the realistic geometry, and the climatological influence have been studied in this paper. Moreover, this research is motivated by the importance of analyzing the flow physics in a hotspot area of the city of Valencia (Spain) due to the large number of pedestrians and the impact of pollution on human health. The study has served as a validation of the use of a RANS model to simulate through numerical methods the influence of pollutants from vehicles.

2. Materials and Methods

2.1. Study Area

For the selection of the study space, the morphological conditions of the urban topology, the traffic intensity, and the practical possibilities of sensor location were considered. The area of Colon Street, located in the center of the city, was selected due to its high traffic intensity, its morphology, and its location in a significant commercial area that could generate interest in health entities for research into possible respiratory diseases.
The area of study is marked in Figure 1a, and adjoined an area around the intersection of Colon and Pizarro Streets. One sensor was suspended from a traffic light approximately 3 m high. The study area can be defined as an urban canyon (schematized in Figure 1b), which is described by its aspect ratio as a long urban canyon (B/H = 8) [31], although it is asymmetric because on the left side there are two blocks of buildings with a skimming flow regime due to W/H = 1 [46].

2.2. Experimental Data

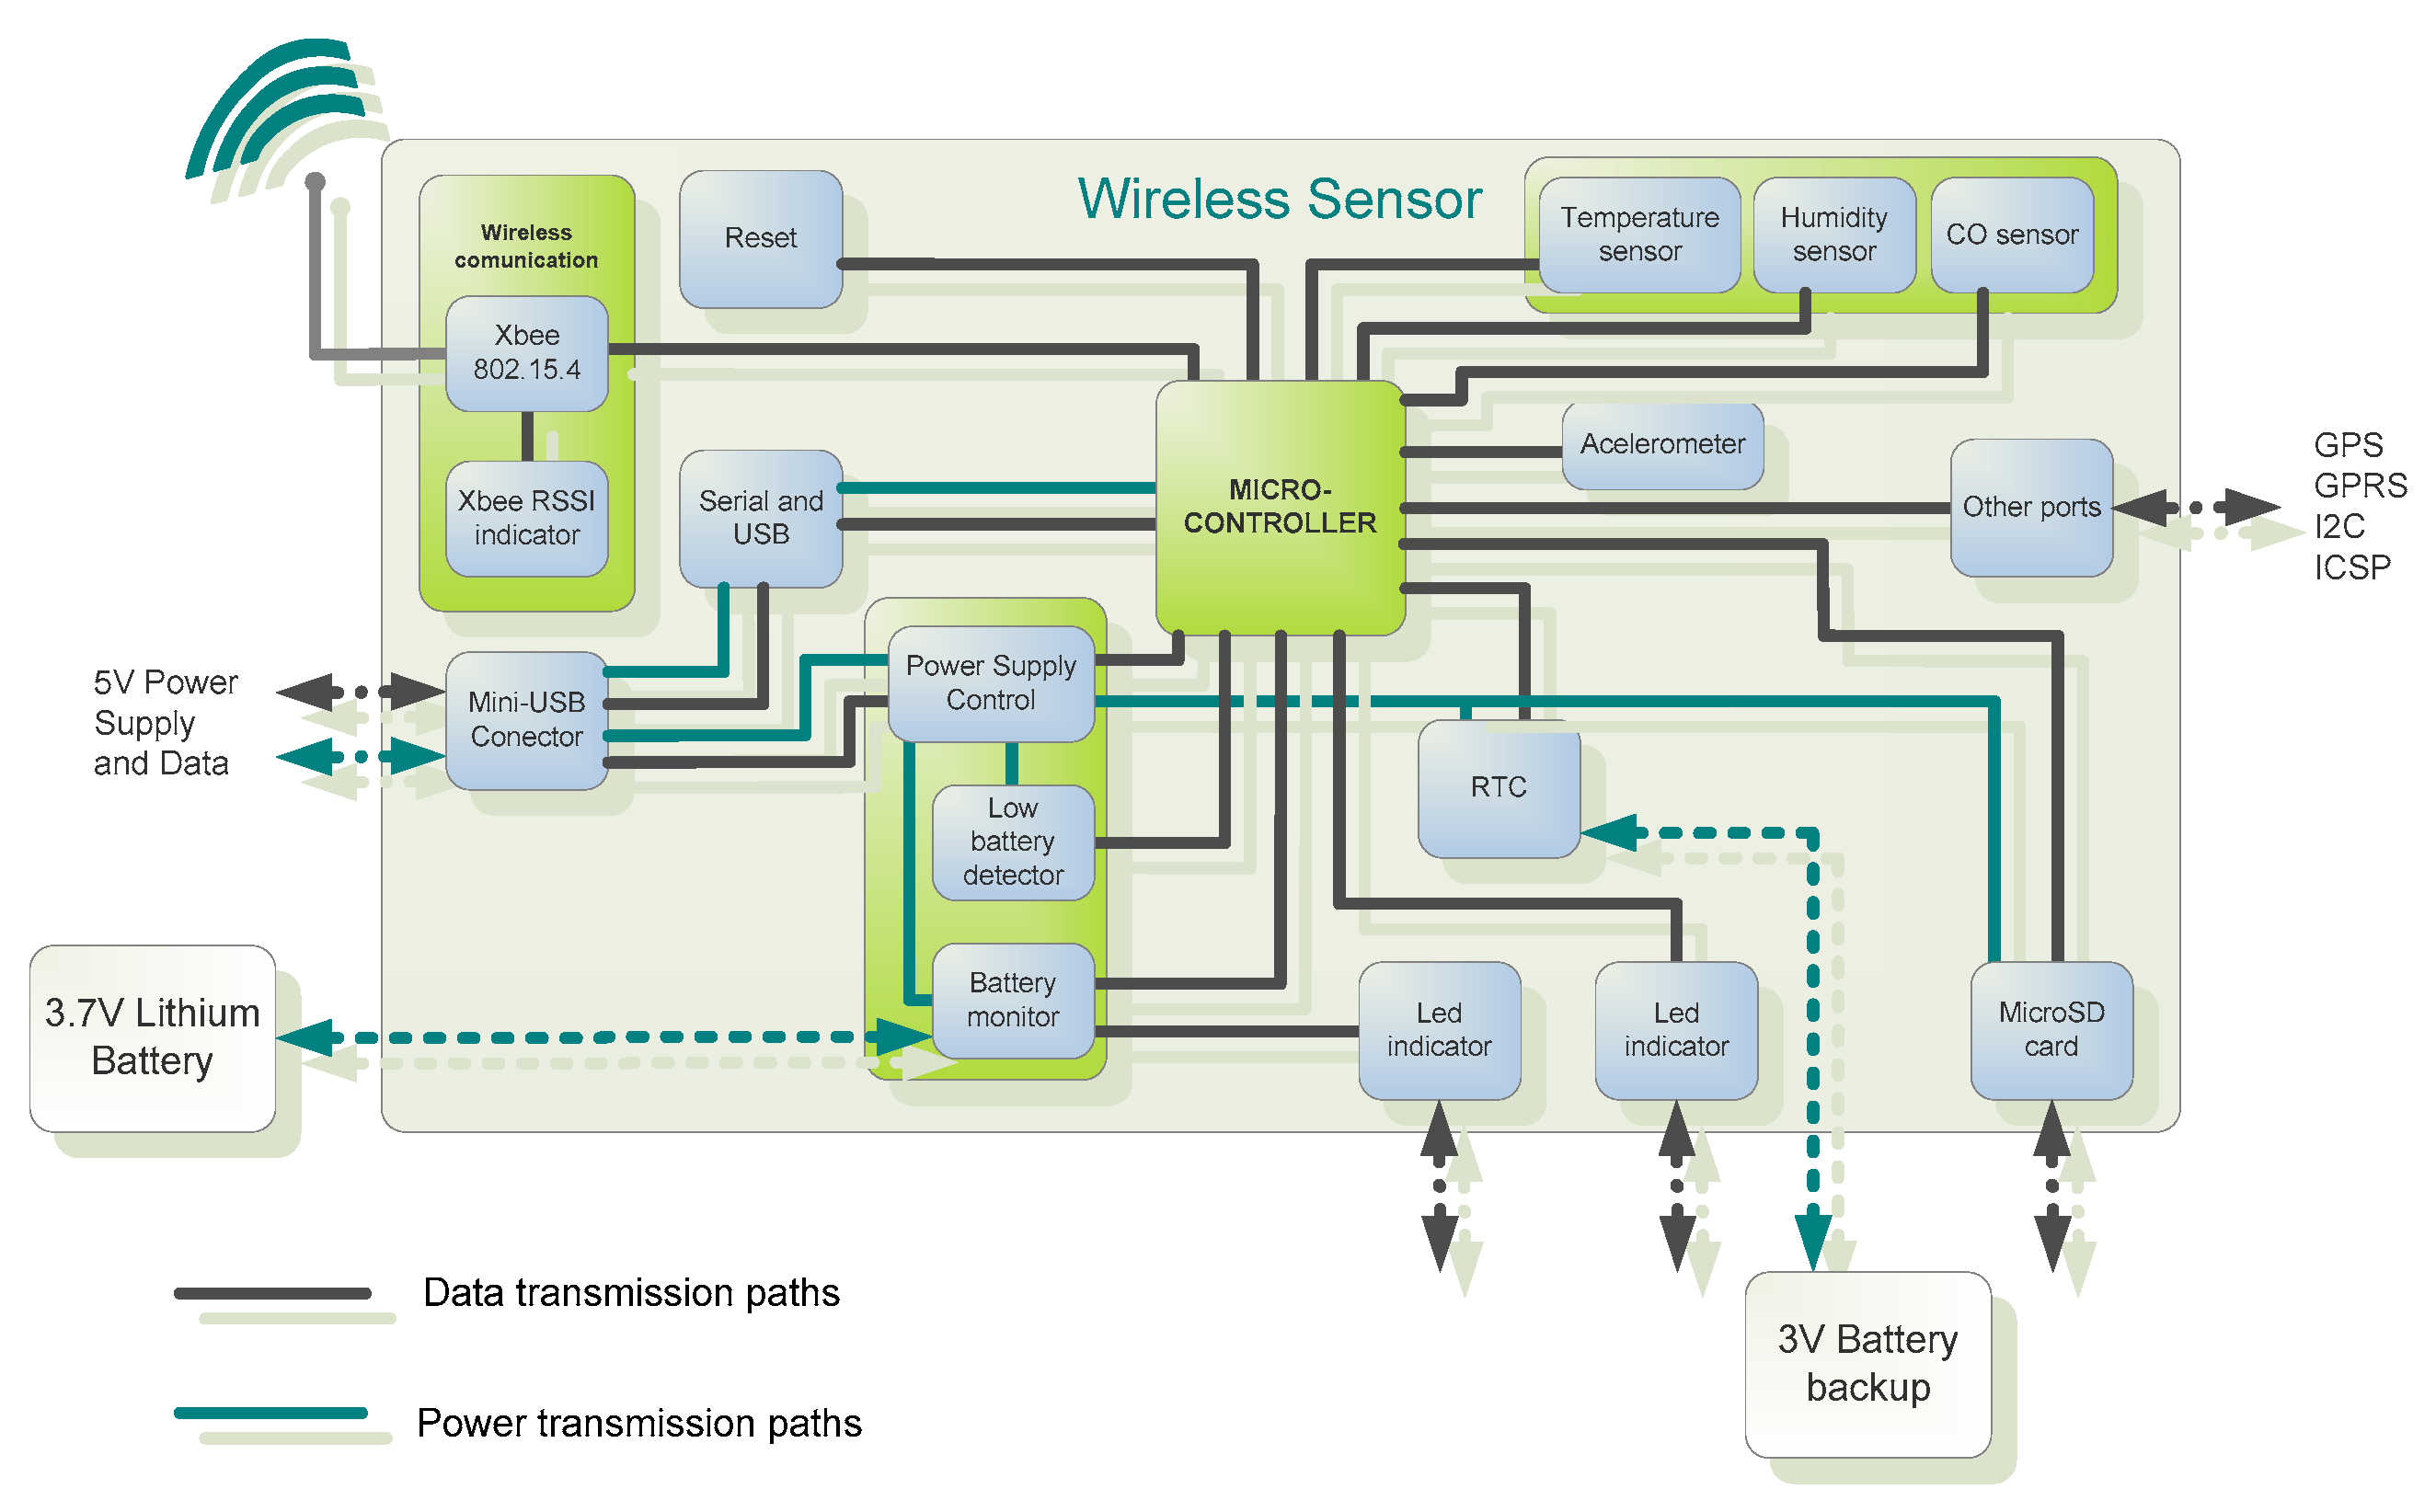
A wireless sensor network (WSN) was used to acquire the experimental variables of interest. Due to its flexibility, scalability, and autonomy [47], WSN has been used in multiple applications, among them, environmental monitoring and specifically those connected to air quality monitoring [48]. Its application has also allowed the validation of CFD models [49]. The wireless communication of the WSN implemented was generated under the IEEE 802.15.4 standard, integrating Digi Xbee PRO 802.15.4 commercial modules. An Atmel microcontroller reference Atmega1281 (Figure 2) was selected for each node, with 72 h of autonomy using a lithium-pol battery with a capacity of 2200 mAh at 3.7 V. Each node also had a 2 GB micro-SD memory to store locally the sensor data and its generation time. The integrated transducers were temperature, relative humidity, carbon monoxide, carbon dioxide, and volatile organic compounds.
The data were collected between November 23 of 2010 and November 28 of 2010, recording a set of working days and holidays. The sampling time was established between 10 to 15 s, seeking to obtain five readings per minute. A modular electronic card was coupled to the transmission card, allowing the signal conditioning of the Carbon Monoxide (CO) and temperature sensors. Because the technology of the selected sensors is based on the principle of the physical functioning of the semiconductors, which reduces the costs of the devices and the same implementation, data processing and filtering were required, without losing the representativeness of the samples about the measured variables. Moreover, the climatic data were obtained from the weather station from the Spanish Meteorology National Agency located in a Garden less than 1 km away from the city center of Valencia.

2.3. Numerical Model

STAR-CCM + is an interactive software designed to simulate physical processes in engineering (fluids or solids). This platform is an interactive interface that has implemented various models and algorithms allowing, within a relatively friendly environment, to develop computational models from previously preconceived conceptual models [50]. The code used the finite volume method (FVM) to solve the Reynolds-averaged Navier-Stokes equations (RANS). For the advective and diffusive terms, a discretization of the finite volume equations with central second-order differences is used, as recommended by Blocken [39]. The computational simulations in this study have been carried out following the recommendations of COST action 732 (European Cooperation in the field of Scientific and Technical Research) [51]. The standard k—ε turbulence was used for the closure of the governing equations [52].
Furthermore, some boundary conditions have been applied, among which are the model of the free surface at the top of the domain, a boundary layer model for the walls of buildings, and the street and the passive scalar model for injection and subsequent diffusion of the contaminant. The injection of the scalar from the vehicles in the domain was carried out by defining the cells of the lanes of the streets through which the vehicles passed.
In relation to the discretization of the domain, the simulations for the different cases have been carried out with a computational domain with the following dimensions: 77.6 m (LX) in the longitudinal direction of the X coordinate (UTM coordinates), 219.8 m (LY) in the Y direction (UTM) and 50 m (LZ) in the vertical Z (UTM), using said global coordinate system for calculations and analysis of results. A detail of the mesh used can be observed in Figure 3. The size of the cells in the mesh increases to achieve a better resolution near the wall. The growth rate of the cells does not exceed 4% in any of the cases. Table 1 shows the size of the mesh, as well as the maximum and minimum cell sizes. This mesh configuration follows the recommendation of skewness and accuracy by Blocken [39].

2.4. Studied Cases

In the present work, the flow has been simulated in a section of Colon Street at the intersection with Pizarro Street in the commercial center of Valencia (Spain). For the validation, six representative cases of different traffic situations and climatic conditions were selected (Table 2).
Within the framework of the investigation, one of the objectives is the study of the pollutant dispersion according to different wind directions. In this way, 3 hypothetical cases were defined for parallel (cases hv1 and hv2) and perpendicular (case hv3) wind directions to Colon Street. The cases were simulated with the highest traffic conditions, as shown in Table 3.

2.5. Emission Factor

For the calculation of the emission factors, the equations proposed by Parra Narváez were used [53]. These functions calculate the emission factor depending on the type and velocity of the vehicles. The number of vehicles in each case was collected from automatic traffic counts recording hourly flows of Traffic Management Center of the city of Valencia, although the vehicle type was not registered along with the traffic counts. Furthermore, the vehicles travelled a distance of 0.234 km in the section studied, at an average speed of 50 km/h.
Moreover, two different situations were considered in order to calculate the emission factor. First, an estimation was carried out of those vehicles that emitted the maximum levels of emissions and secondly those that emitted the minimum. Finally, a more realistic emission factor was estimated by using a uniform distribution of all types of vehicles. In Table 4, the three emission factors used for the validation are shown. Furthermore, the more realistic emission factor considering the types of vehicles is equal to 5.32 g km−1 veh−1. This value is in the same order of magnitude of others obtained in different locations, such as Rouen −7.5 g km−1 veh−1 [54], Copenhagen −11.0 g km−1 veh−1 [55] or Valencia −11.6 g km−1 veh−1 [10], all using an inverse model approach or the case of Lebanon −6.19 g km−1 veh−1 [45] using the inventory fleet of vehicles.

3. Results

3.1. Model Validation

For the validation of the numerical model, simulations cv1 to cv6 were used to compare the results with in-situ concentrations of CO measured by means of a sensor placed at a traffic light on the street. The simulations were performed with the average, maximum, and minimum values of the emissions calculated in Table 4. The results show a good correlation between the simulations and the sensor measurements since in all the cases studied the value measured in the real traffic and wind conditions is between the maximum and minimum limits obtained in the numerical results (Figure 4) and close to the average value. However, we can observe that the experimental data is in most cases above the numerical result using the average emission factor, which can mean that the real emission factor is higher than the average one. Nevertheless, considering this slight limitation, it can be concluded that the simulations are correctly representing the mixing process in the urban canyon.

3.2. CO Dispersion in Real Cases

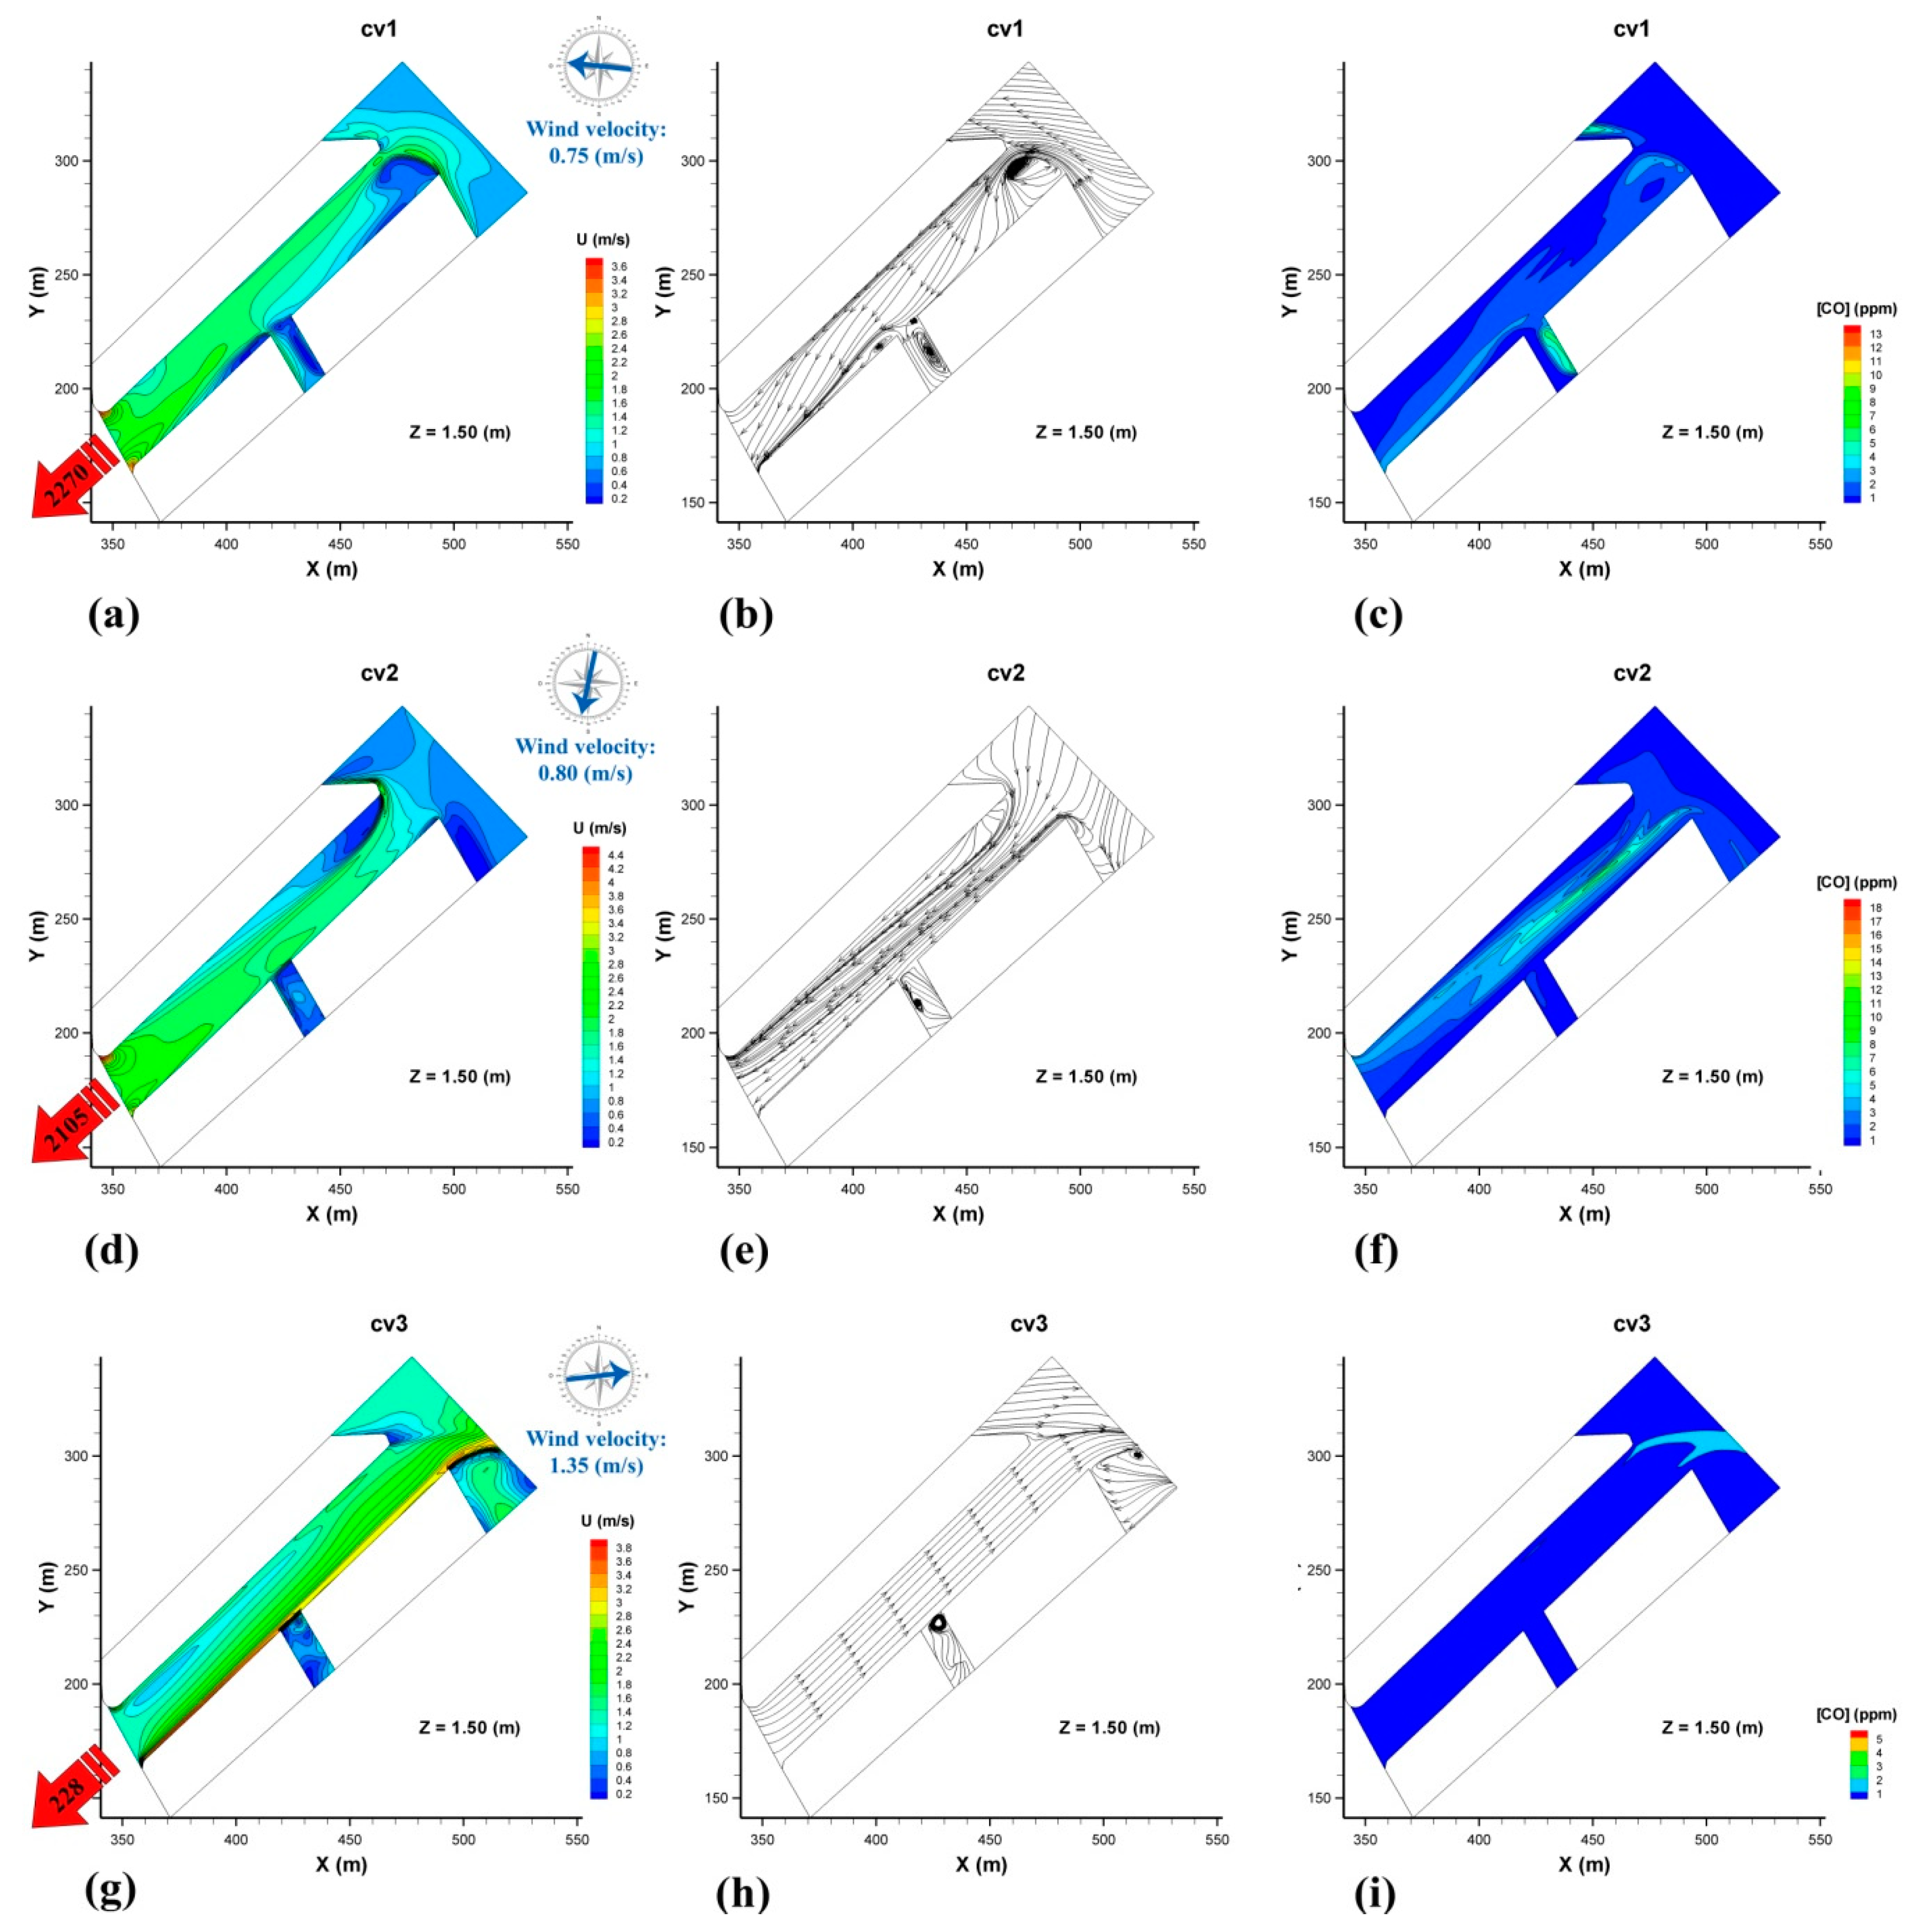
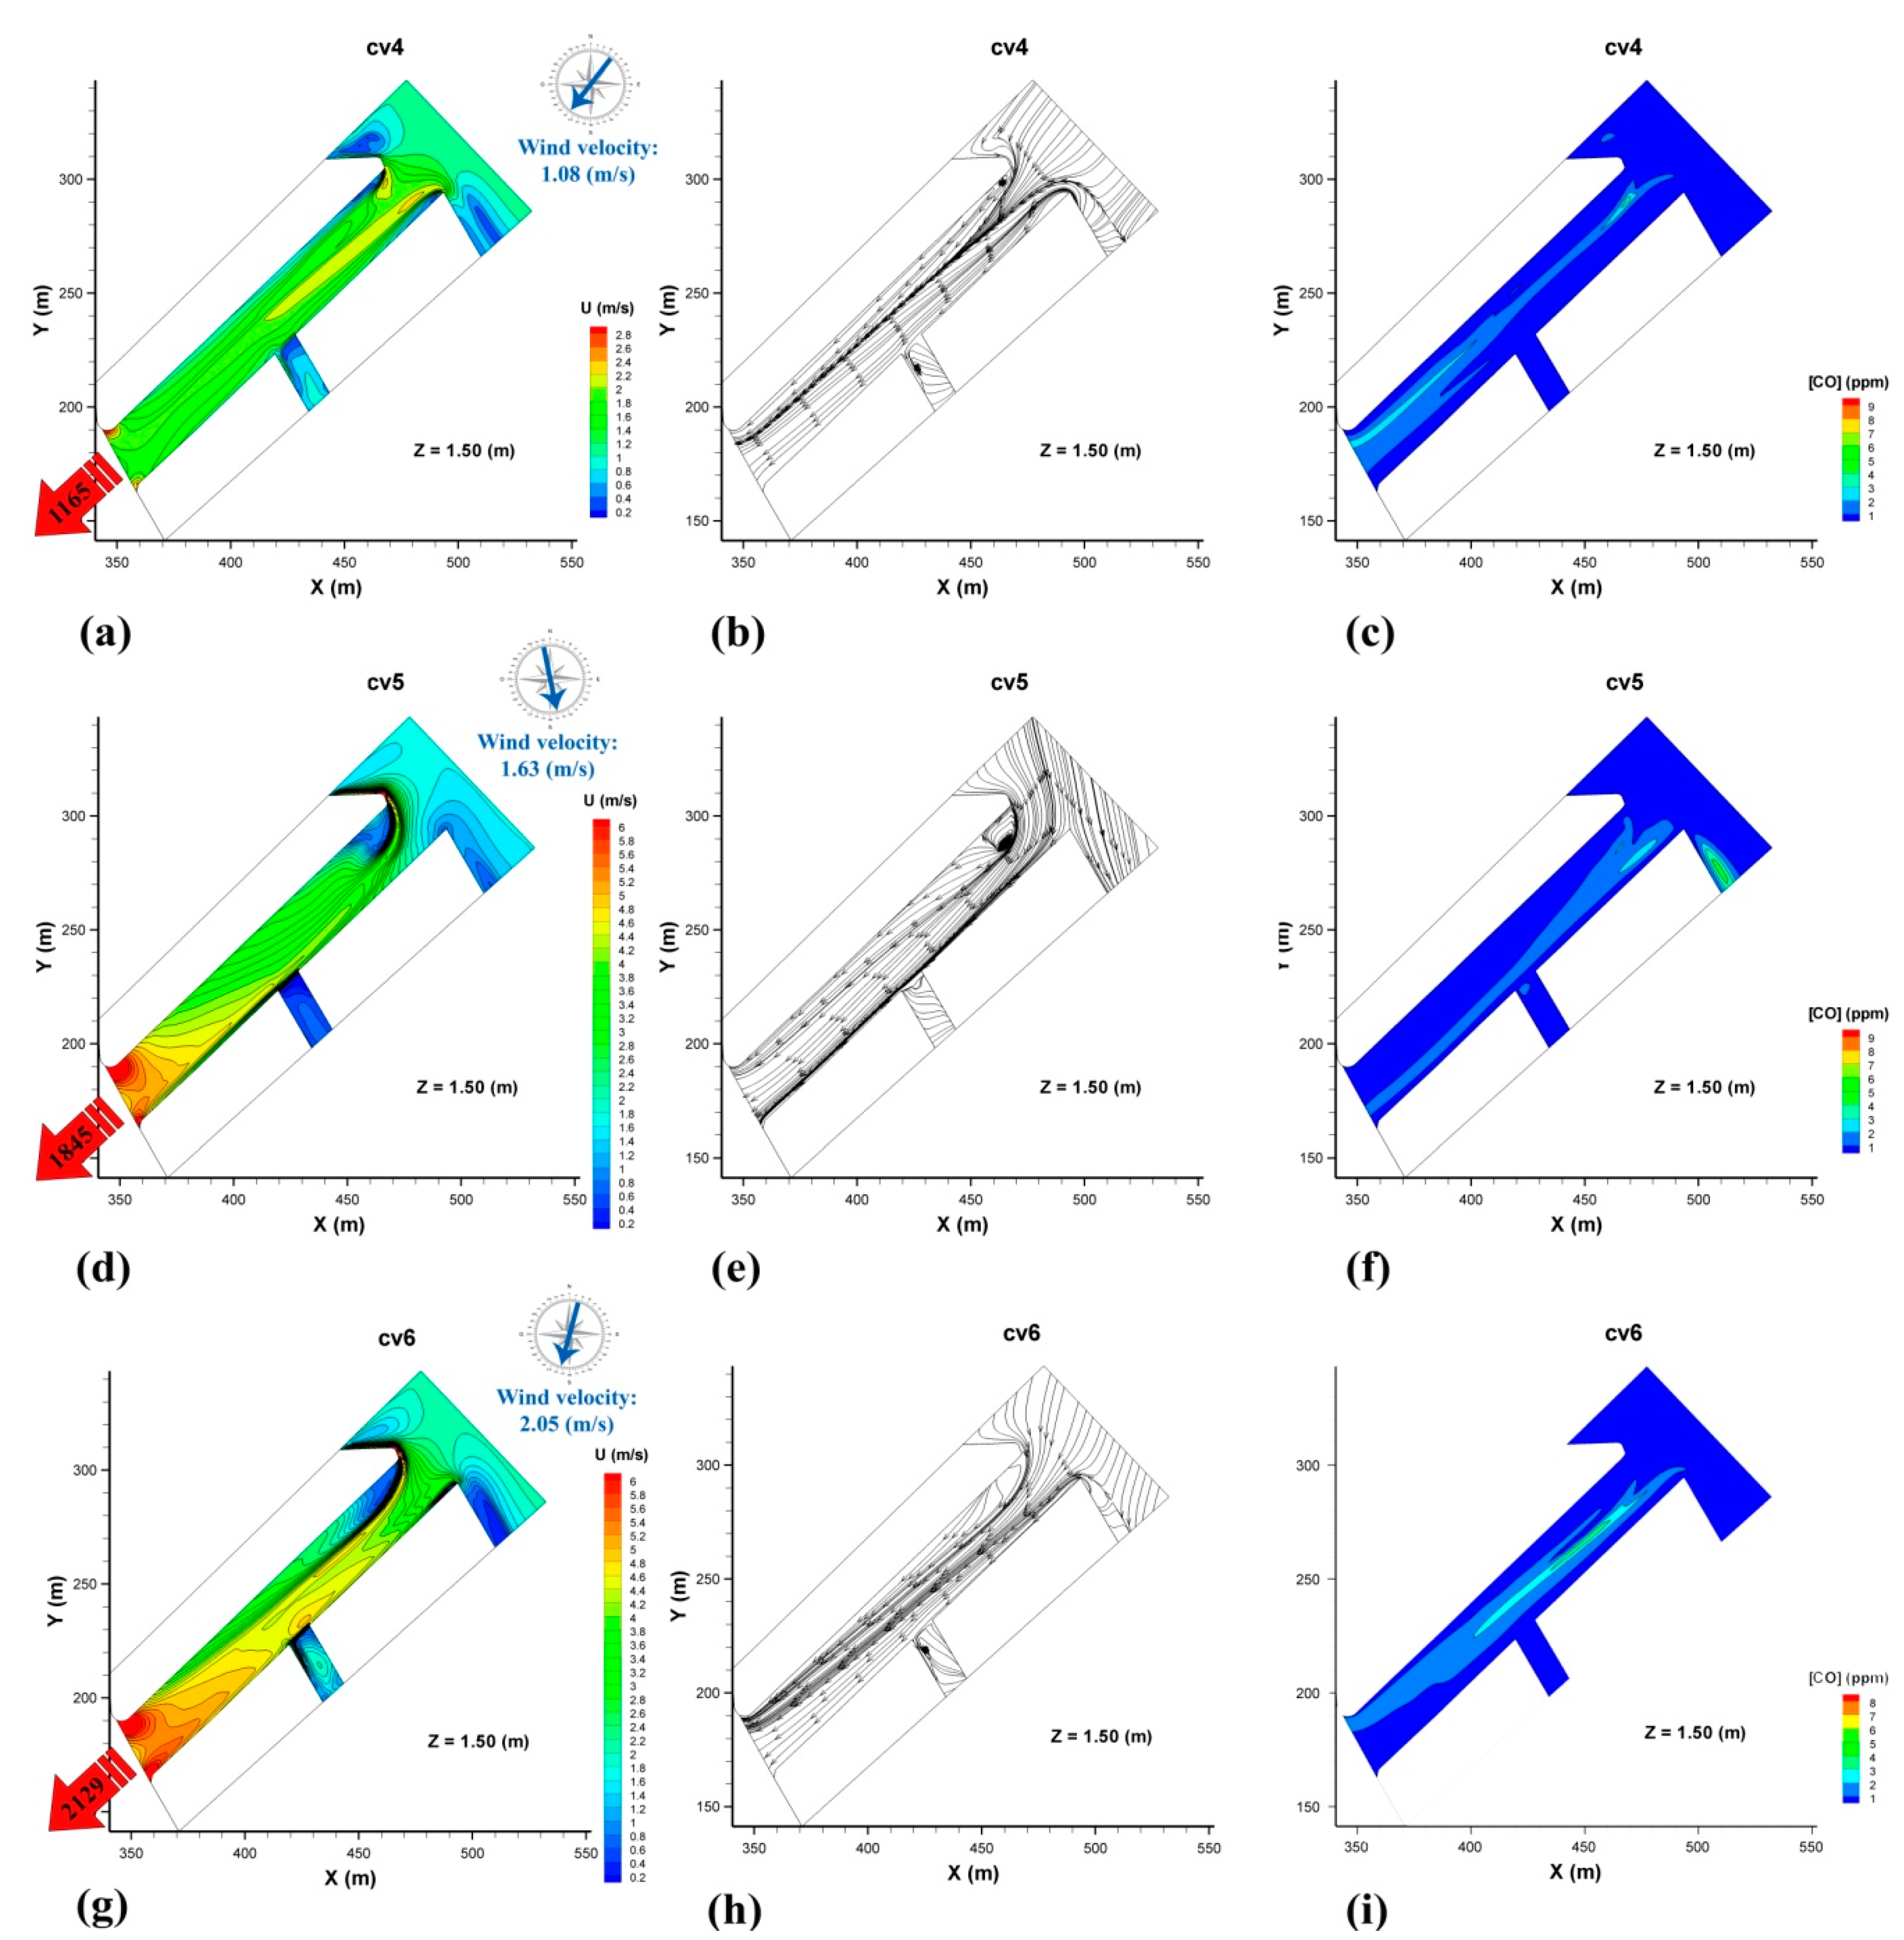
If we carried out a more in-depth analysis of the CO dispersion processes in these real cases, it is worth noting the great differences in aerodynamic and mixing behavior depending on the characteristics of the case. Traffic intensity and wind velocity affected the magnitude of the phenomena, but wind direction is clearly observed as the most influential parameter in the physics of the flow within the urban canyon. In Figure 5 and Figure 6, horizontal planes for each case showing velocity contours, streamlines, and CO concentration contours are presented. The results are shown in a plane located at a height of 1.5 m. Traffic and wind characteristics are marked with red and blue arrows, respectively.
In more detail, when the wind blows from directions close to the north-east entrance of the Colon Street, as it is the case cv1, cv2, cv4, cv5 and cv6, a very interesting flow pattern occurred. First, for case cv4 where the wind direction is almost parallel to the street, there is a more uniform distribution of CO concentration as observed by Thaker and Gokhale [38] and a jet in the middle of the canyon appears towards the south-west exit of Colon Street. However, a slight change in wind direction produces a big difference in the flow structures. First of all, in cases cv2, cv5, and cv6 where the wind direction is more northern, a separation and recirculation appear at the west sidewalk of the beginning of Colon Street which implies a larger concentration of CO in the east sidewalk influenced by the acceleration produced in the separation process. This effect is stronger in case cv6 because of a higher wind velocity which defines a clearer separation process. These cases (cv2, cv5, and cv6) also produce a strong current towards the south-west exit of Colon Street reducing the accumulation of CO within the urban canyon. Nonetheless, case cv1 is also interesting because its direction is from the east, producing a vortex in the east side of the north-east entrance of Colon Street. In this case, there is a lower acceleration process within the urban canyon, with less advection, which produces higher concentrations of CO along the street.
Furthermore, flow patterns and CO concentrations are completely different in case cv3 where the wind direction blows closer to the south-west exit of Colon Street. This effect causes the streamlines to go from south to north, opposite to the traffic direction. This situation produces an accumulation of CO concentration near the north entrance of the urban canyon, which will be explored in more detail in Section 3.3.1.
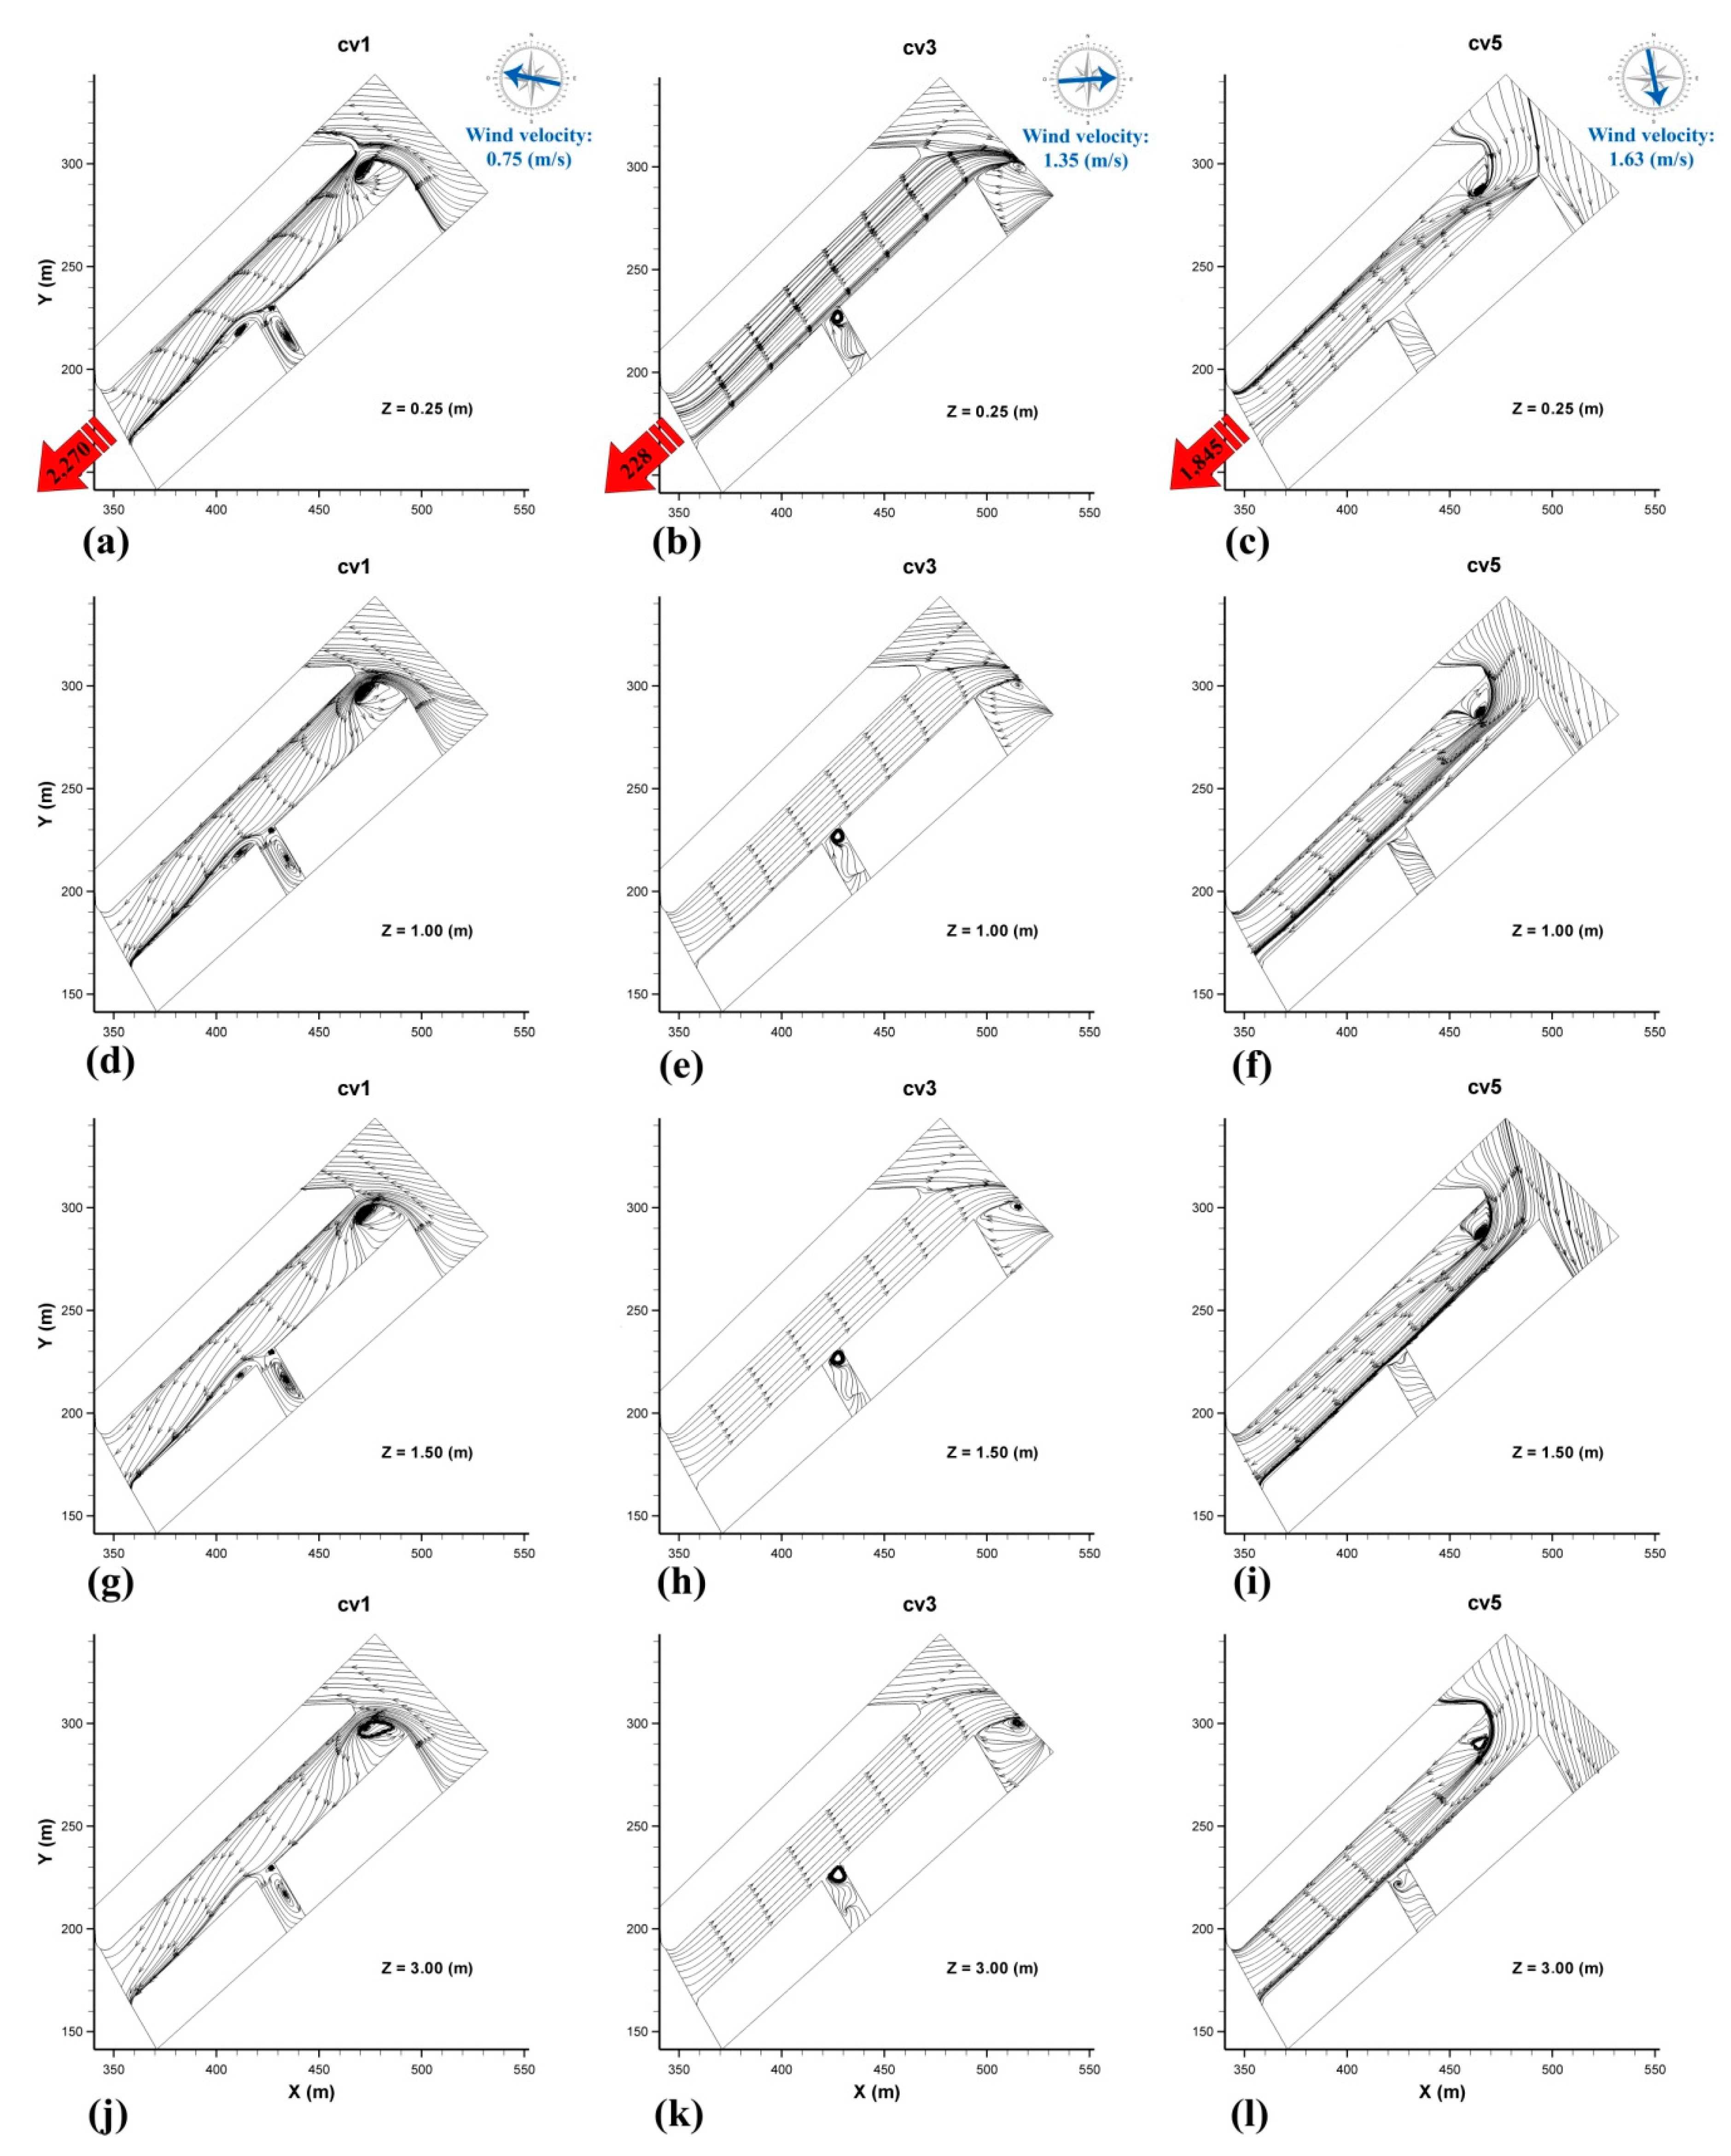
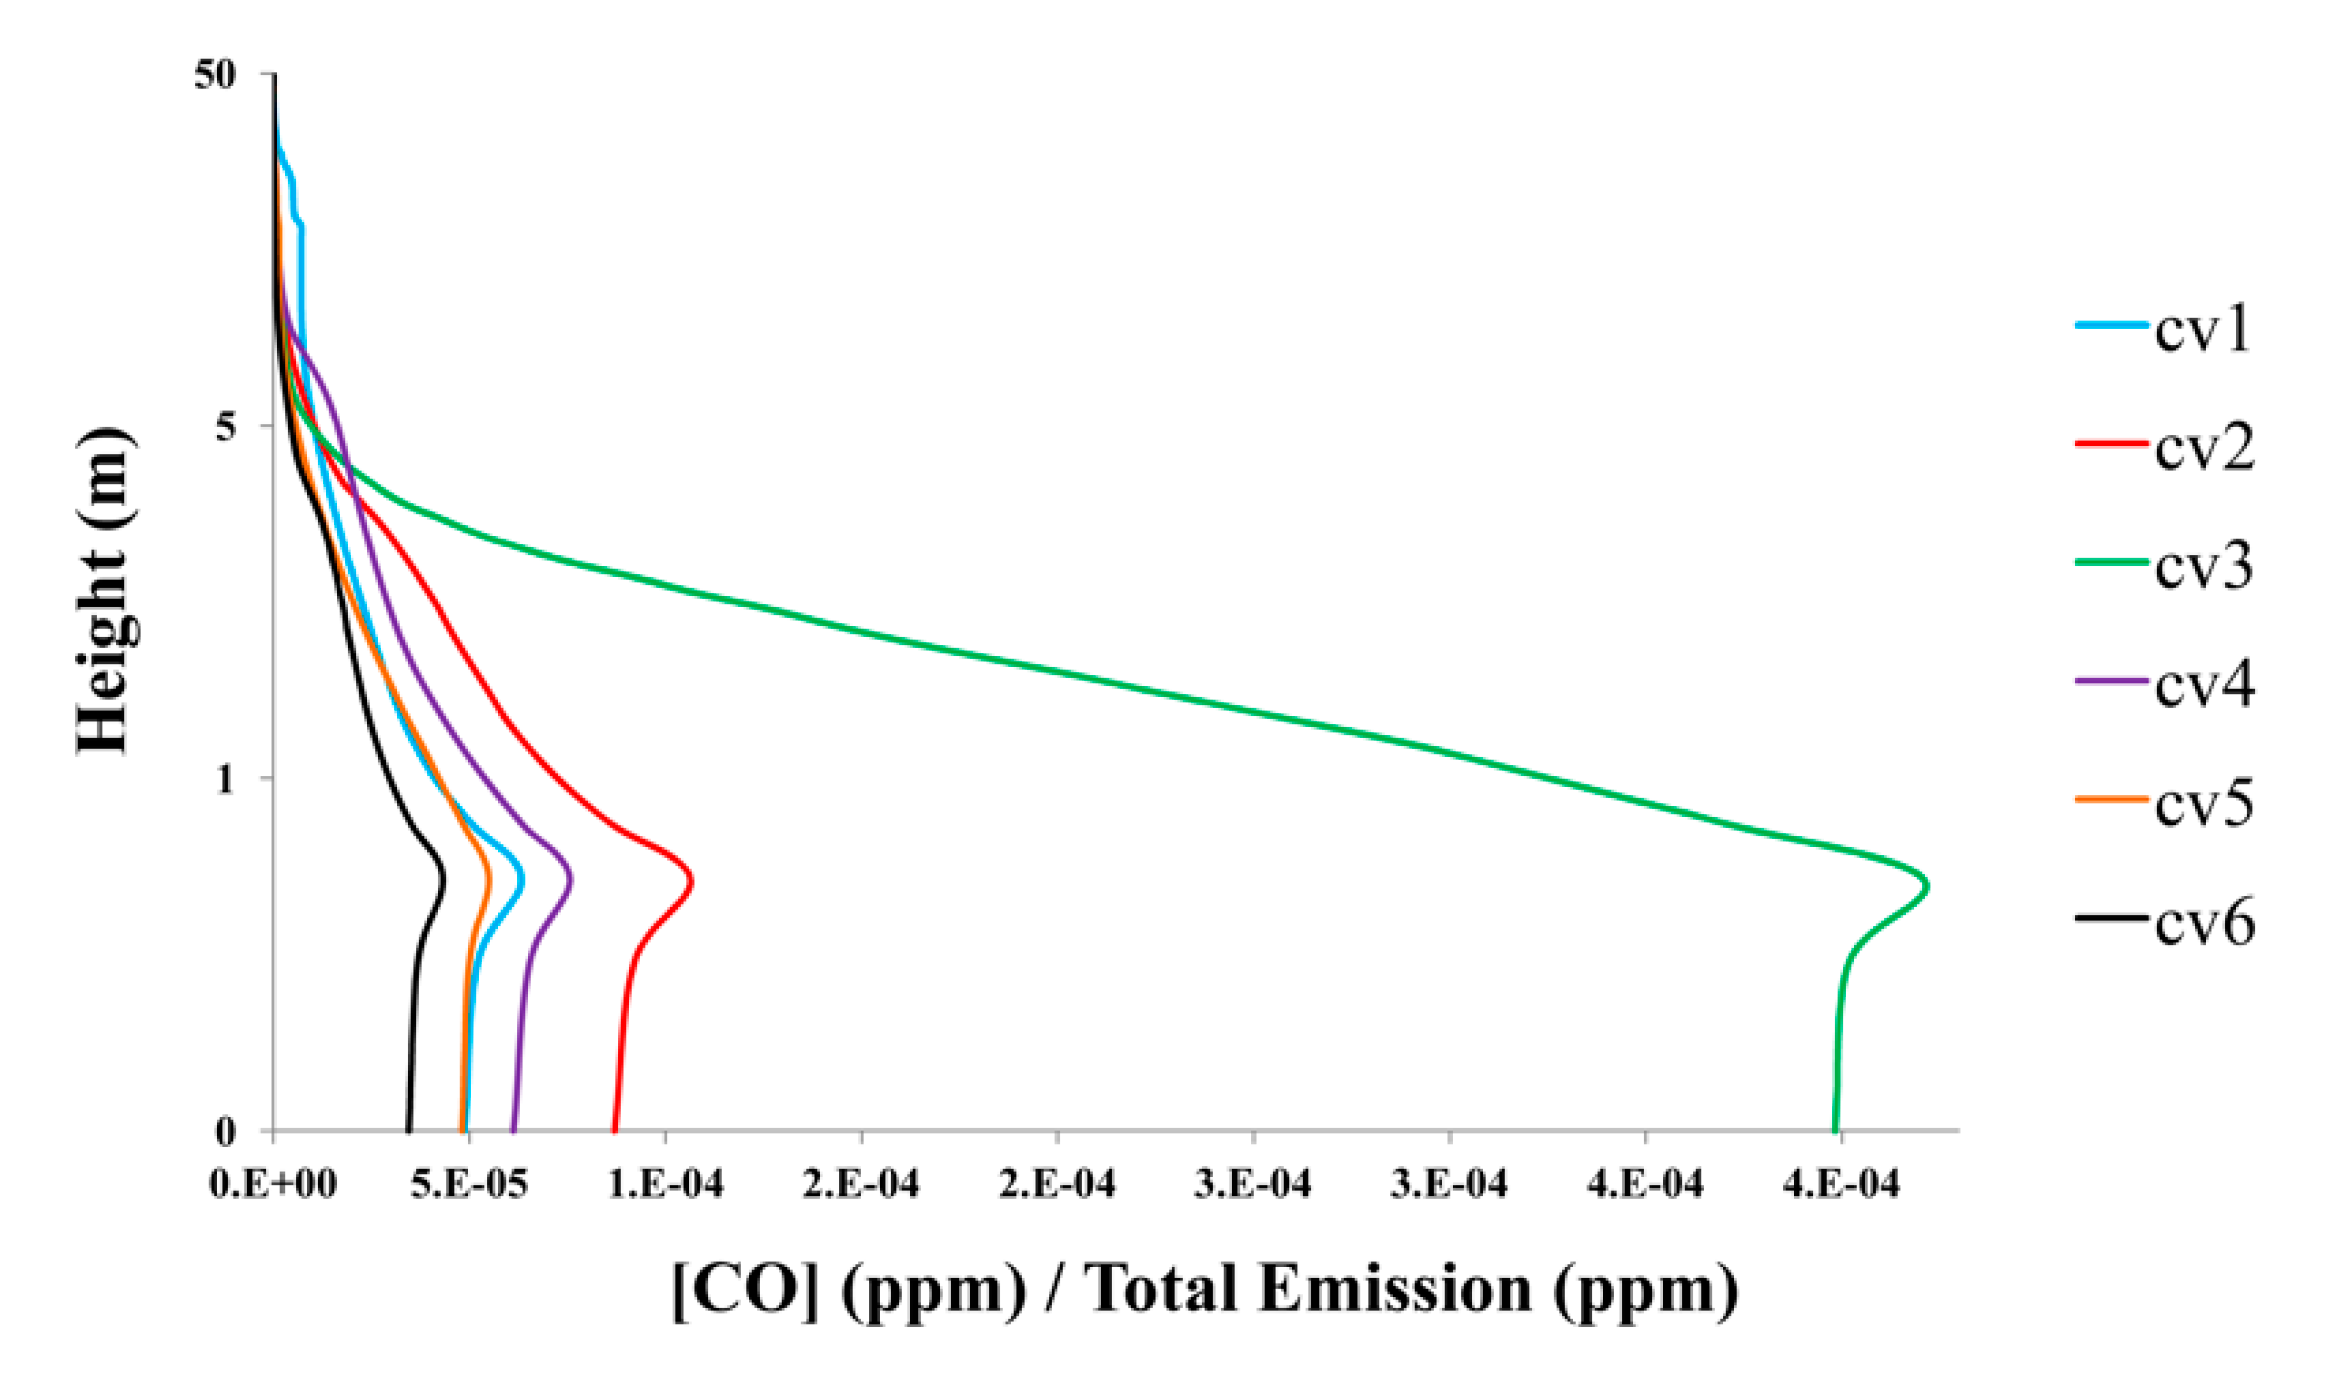
In order to understand the three-dimensional behavior of the flow, three cases, cv1, cv3, and cv5, are analyzed in more detail in Figure 7. We can observe that the effects described previously are highly three-dimensional and occupied the critical zone for human health, between 0.25 and 3 m height. It is also clear that for cases cv1 and cv5, the recirculation patterns near the north entrance of Colon Street show their maximum around 1 to 1.5 m, decreasing their magnitude above that height. On the other hand, cv3 shows a more uniform longitudinal behavior along Colon Street, with the appearance of two clockwise recirculation vortex in the north entrance and the intersection with Pizarro Street. The presence of these structures clearly affects the CO concentrations in the vertical profiles. This is shown in Figure 8, where the double averaged (in time and space) profiles proposed by Nikora [56] are presented. It can be seen how the differences previously explained are summarized in these vertical profiles. On the one hand, in case cv3, the concentration is higher because of the previously explained effect of the wind flowing in the opposite direction to the traffic. Moreover, the other 5 profiles have similar characteristics with a decrease of CO, and differences in magnitude could be explained by the wind velocity. The highest value of 2.05 m/s corresponding to case cv6 produces the highest mixing and the lowest CO concentration. Case cv2, on the other hand, has the smallest values, corresponding to the lowest wind velocity.
It can be concluded from this first analysis in real and experimental conditions studied that the direction of the wind clearly effect the flow structures and the behavior of mixing and transport of the pollutant (CO) in both Colon Street and Pizarro Street. Therefore, in Section 3.2, this influence will be further explored by simulating controlled conditions for parallel and perpendicular winds to Colon Street.

3.3. Effect of Wind Direction

For a better understanding of the effect of wind direction, a sensitivity analysis was carried out studying three different options, two parallel wind directions and one perpendicular to Colon Street. Thus, the case hv1 has a north-east direction and the case hv2 has a south-west direction, both parallel to the Colon Street, while hv3 has a south-east direction, perpendicular to the Colon Street. For each case, different wind velocities were studied with a constant emission and traffic intensity. The differences between the three cases are significant due to the variations in transport processes that are closely related to recirculation and vortices in the study domain, also observed in [27].

3.3.1. Parallel Winds

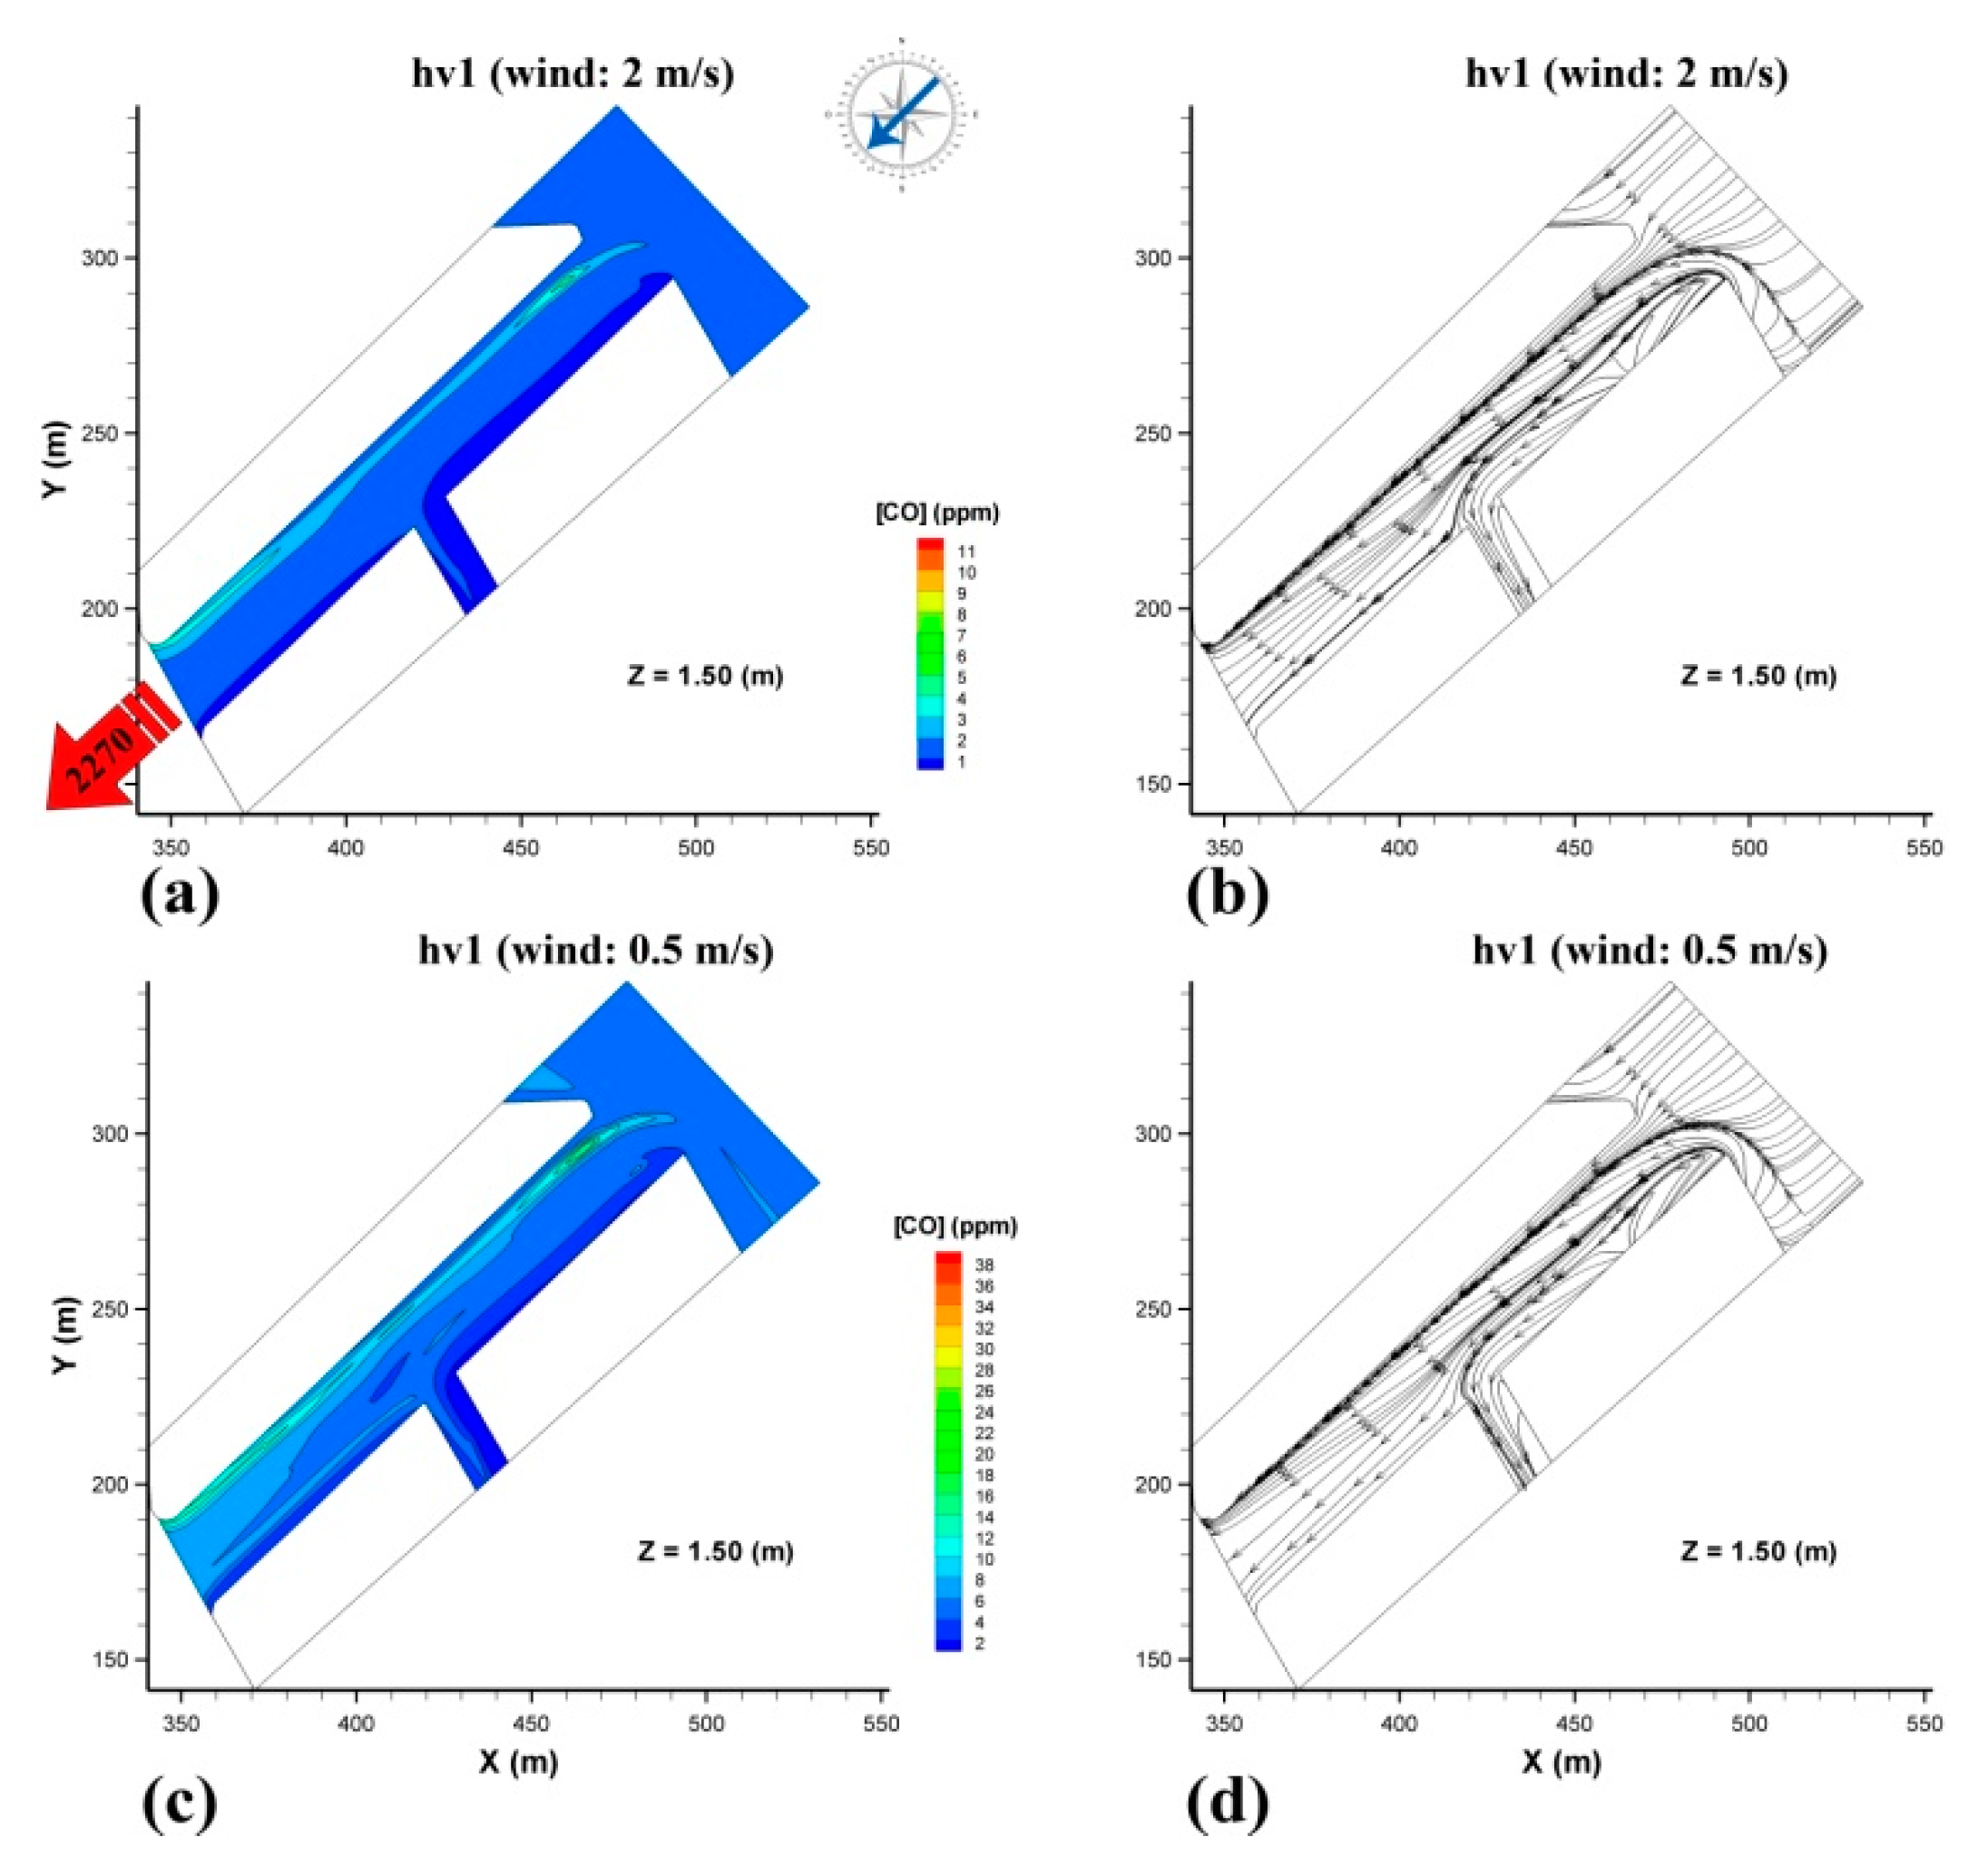
It might be observed in Figure 9 that, for the first direction -hv1, the highest concentrations occur in the Colon Street in the area of the west sidewalk (where the experimental sensor is located) and in the area of Pizarro Street because the velocity is very low, producing a large concentration of CO emitted by the vehicles that circulate in that area. The main reason could be explained by the great influence of Pizarro Street in the simulation, changing the flow pattern with a concentration of streamlines near the conjunction towards Pizarro Street. This effect produces a higher concentration on the west sidewalk of Colon Street. In this case, an increase of wind velocity produces a displacement of the maximum concentration towards the end of Colon Street. This effect is three-dimensional, as explained in the previous section, with a maximum value of around 1.50 m.
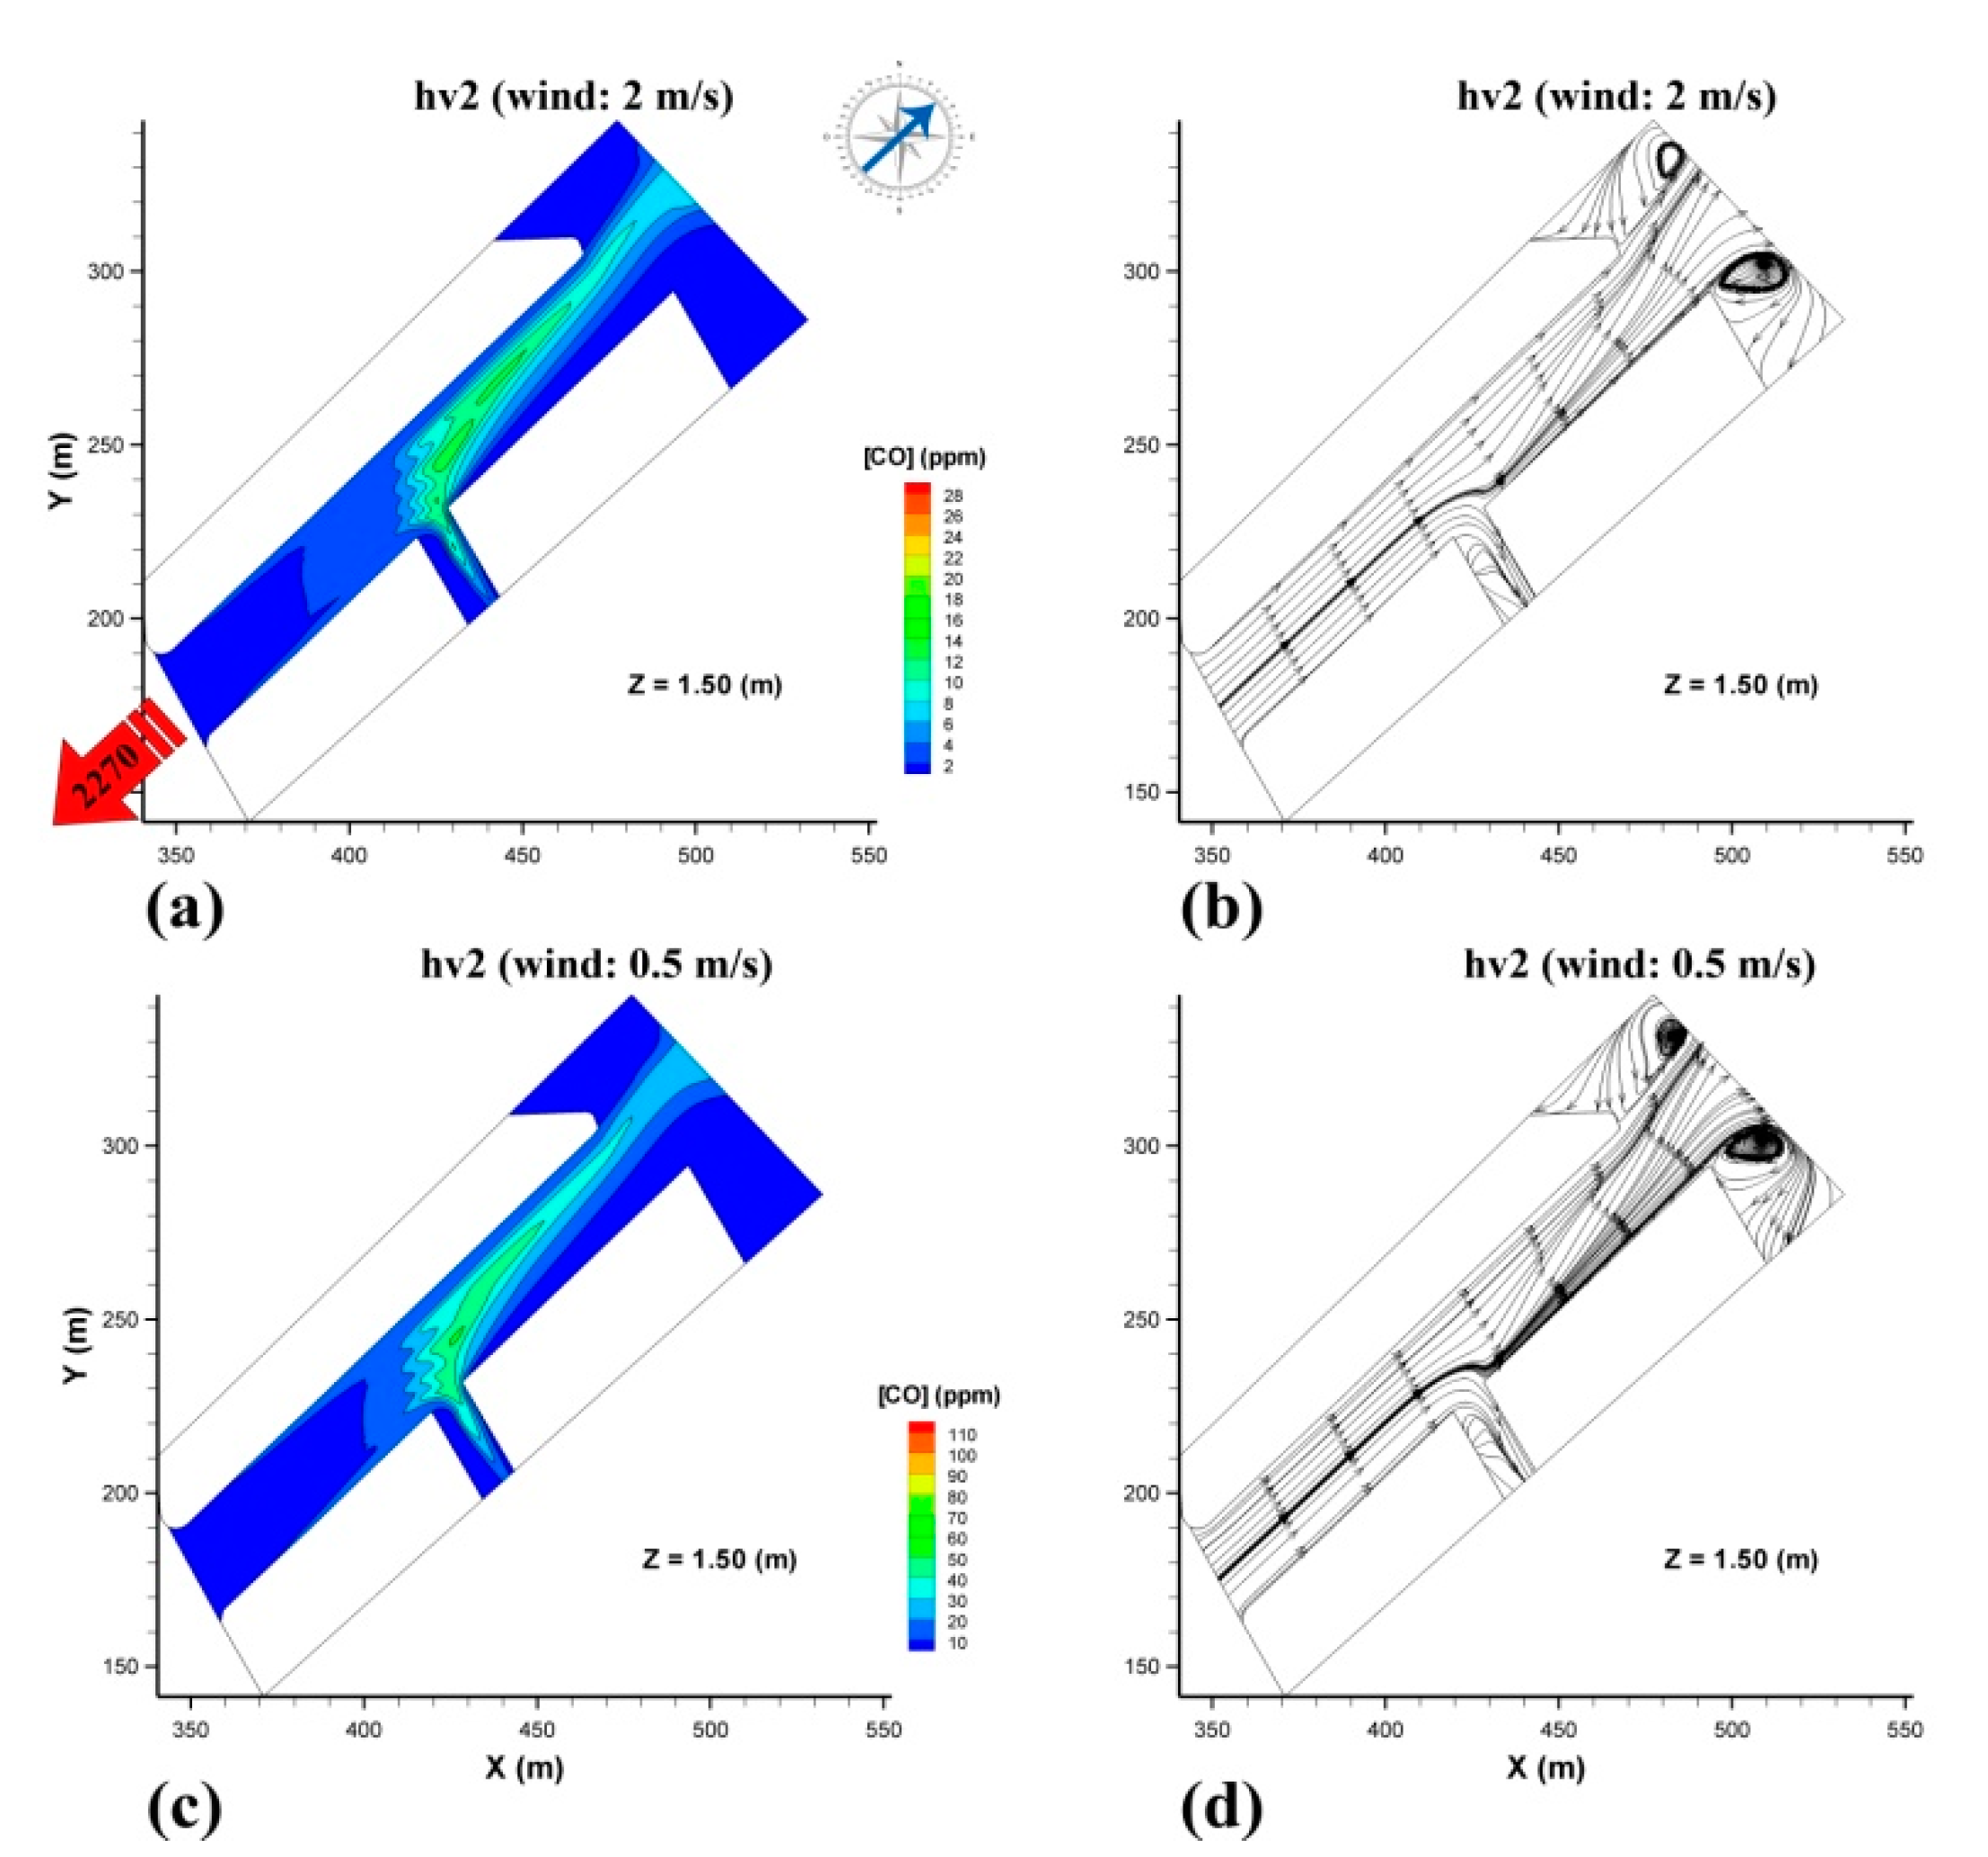
On the other hand, for the hv2 case, a very different effect is produced since the wind flows against the direction of the vehicles so that there is a greater CO concentration towards the center of Colon Street and it is focalized in the crossing with Pizarro Street (Figure 10). This situation is similar to the case described by Thaker and Gokahle [38] which obtained an analogous distribution of CO. Moreover, as wind velocity increases, the maximum values move towards the northeast entrance of Colon Street due to the thrust exerted by the flow that accumulates CO against the direction of circulation of the vehicles. In this case, there is also a higher concentration of CO in the north sidewalk of Pizarro Street due to the recirculation that occurred when the flow enters this street.

3.3.2. Perpendicular Winds

Finally, the third situation (hv3) is the most contrasting of the three since the wind direction is perpendicular to the direction of movement of the vehicles. In this latter case, the highest concentrations also occur at the junction between the two streets (Figure 11). This produces a peculiar effect since the flow is much more complex so that the areas of maximum concentrations occur in the recirculation that appears in the domain creating dead zones of low speed and reducing the mixing process. In this direction, the effect of wind velocity is more difficult to analyze and is less influencing. The concentration is strongly correlated with the recirculation that occurs in the confluence zone between Pizarro and Colon Streets (similar to Reference [27]). These two recirculation zones near Pizarro Street were also observed by [31], although in our case, they are a bit displaced by the presence of the street intersection, an effect which is clearer for low wind velocities. However, it is true that the recirculation expands and increases with greater velocities, favoring the CO mixing processes.

3.3.3. Three-Dimensional Flow Pattern

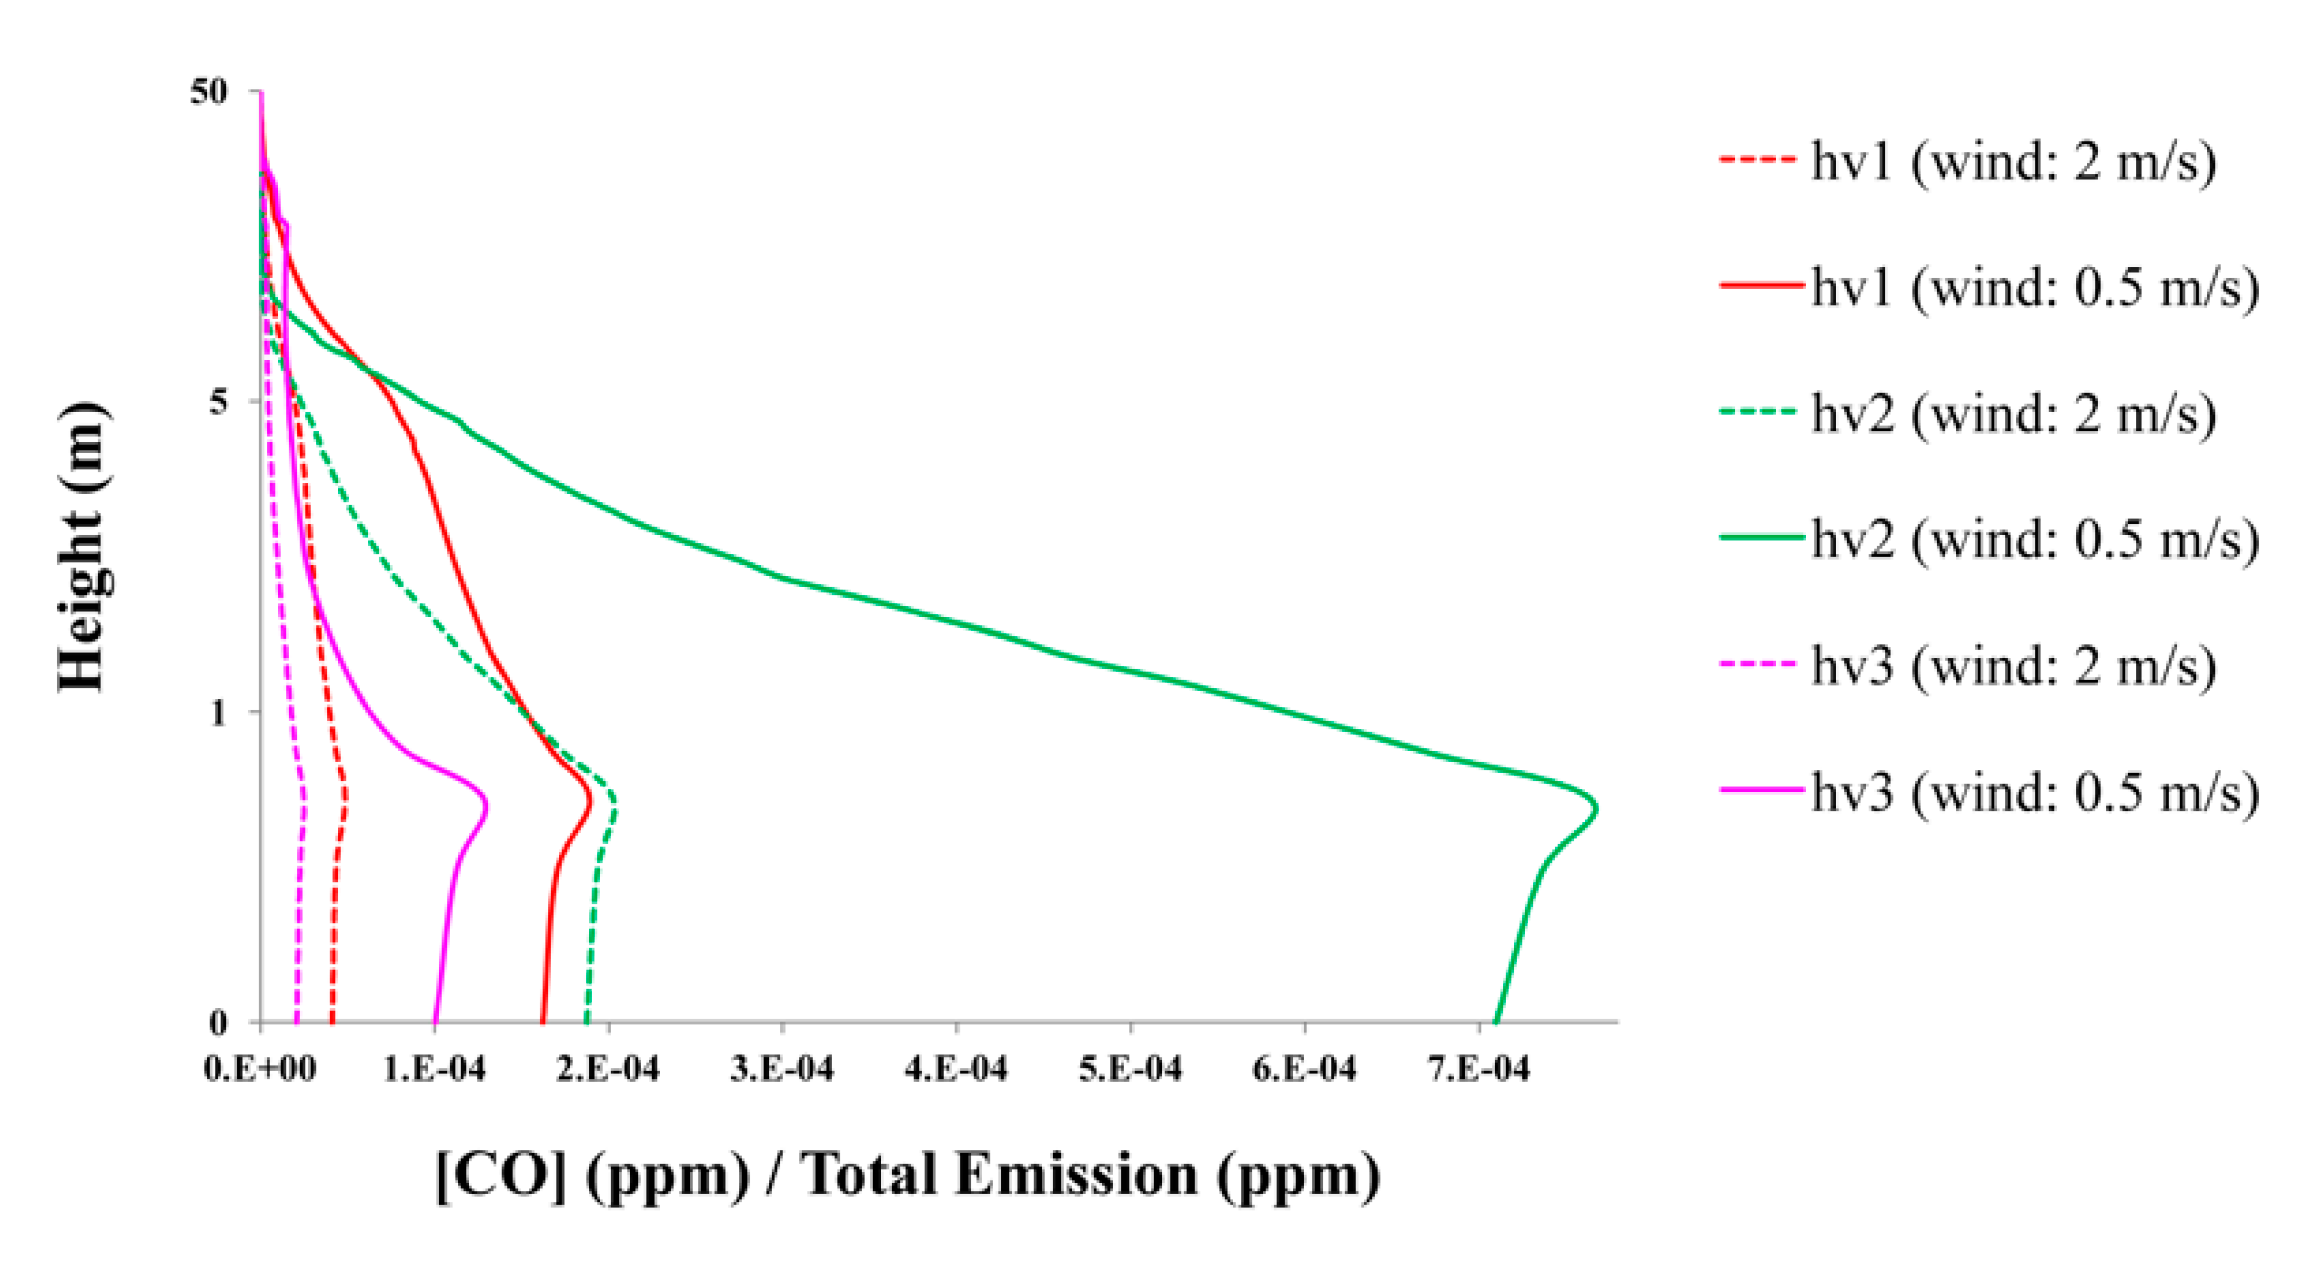
Furthermore, double-averaged concentration profiles have been calculated in each of the cases studied (Figure 12). It is interesting to observe that case hv2, wind direction parallel to Colon Street and opposite to traffic direction, is the one with more CO concentration in the domain. Moreover, this effect is similar to the one observed in the cv3 real case, which indicates a greater accumulation in case hv1 of CO inside the domain. These effects have also been observed in References [25,30].
Finally, the iso-surfaces of CO concentration are shown in Figure 13 for the hv1 case, a wind velocity of 0.5 m/s, and three different traffic intensity (500, 1500, and 2500 vehicles). The results show the three-dimensional behavior of the CO transport with the influence of the secondary structures and the advection processes within the urban canyon. The influence of this characteristic is noticeable in the west sidewalk of Colon Street, and also the complex behavior in the intersection with Pizarro Street is clearer for the case of 2500 vehicles.

4. Conclusions

In this study, the application of a three-dimensional CFD model in a realistic urban canyon is presented. The focus is to determine the influence of wind direction in the flow patterns within a real urban canyon and its influence on CO concentration in pedestrian zones (between 0 to 3 m height).
First of all, the emission factor used in this paper was obtained using an average of emissions from different types of vehicles (motorbikes, cars, and trucks). The results show that the emission factor underestimates the experimental results, which were closer to those obtained using inverse modelling, reinforcing the recommendations of using this kind of methodology in the air pollution processes. However, the procedure presented in this paper is much easier and can be used without the need for a large series of data.
From the results, we can conclude that the mixing and transport of air pollutants are closely related to the structures of velocity and turbulence that occur in the urban canyon. Therefore, recirculation and turbulent structures that occur at the entrances to the streets or at the top of the buildings affect the pollution levels considerably. The results show that the advective transport, in the cases where wind velocity is parallel to the Colon Street, has a great impact on CO concentration and also that the recirculation patterns that occur when wind direction is perpendicular to the urban canyon seriously effects the CO diffusion, presenting zones with higher concentrations which could have an important impact on pedestrians.
In our study, the most unfavorable case is that of a wind direction coming from the south-west exit of Colon Street that causes high concentrations in the central part of the domain. The most favorable case is that of a direction from the north-east entrance of Colon Street that causes greater mixing and transport of the pollutant, limiting the values that affect pedestrians in the area.
The CFD model applied does not require a great computational effort due to its relatively coarse mesh and the usage of a RANS turbulence model, but this simplicity does not jeopardize its accuracy, and besides it is validated with experimental data of CO measurements. Its simplicity without risking the feasibility of the model guarantees his usage in different scenarios which can lead to making decisions in urban mobility or traffic to limit levels of CO concentration or other polluting gases. Nonetheless, this work can be used by public bodies to locate sensors in hotspots analyzed in this paper, controlling real concentrations in the influence area of pedestrians.

Author Contributions

All authors (A.M.T., I.J.M.-E., J.M.-C., G.P.-S.) have contributed equally to conceptualization; methodology; formal analysis; writing—original draft preparation. All authors have read and agreed to the published version of the manuscript.

Funding

This research received no external funding.

Conflicts of Interest

The authors declare no conflict of interest.

References

  1. World Health Organization. Mortality and Burden of Disease from Ambient Air Pollution. Available online: http://www.who.int/gho/phe/outdoor_air_pollution/burden_text/en/ (accessed on 20 April 2020).
  2. Zhou, Y.; Levy, J.I. The impact of urban street canyons on population exposure to traffic-related primary pollutants. Atmos. Environ. 2008, 42, 3087–3098. [Google Scholar] [CrossRef]
  3. Calderón-Garcidueñas, L.; Franco-Lira, M.; Henríquez-Roldán, C.; Osnaya, N.; González-Maciel, A.; Reynoso-Robles, R.; Villarreal-Calderon, R.; Herritt, L.; Brooks, D.; Keefe, S.; et al. Urban air pollution: Influences on olfactory function and pathology in exposed children and young adults. Exp. Toxicol. Pathol. 2010, 62, 91–102. [Google Scholar] [CrossRef] [PubMed] [Green Version]
  4. Ji, W.; Zhao, B. Estimating mortality derived from indoor exposure to particles of outdoor origin. PLoS ONE 2015, 10, e0124238. [Google Scholar] [CrossRef] [Green Version]
  5. Scungio, M.; Stabile, L.; Rizza, V.; Pacitto, A.; Russi, A.; Buonanno, G. Lung cancer risk assessment due to traffic-generated particles exposure in urban street canyons: A numerical modelling approach. Sci. Total Environ. 2018, 631, 1109–1116. [Google Scholar] [CrossRef]
  6. EEA. Air Quality in Europe—2016 Report, EEA Report No 28/2016, European Environment Agency. 2016. Available online: https://www.eea.europa.eu/publications/air-quality-in-europe-2016 (accessed on 20 April 2020).
  7. Yamaji, K.; Chatani, S.; Itahashi, S.; Saito, M.; Takigawa, M.; Morikawa, T.; Kanda, I.; Miya, Y.; Komatsu, H.; Sakurai, T.; et al. Model Inter-Comparison for PM2.5 Components over urban Areas in Japan in the J-STREAM Framework. Atmosphere 2020, 11, 222. [Google Scholar] [CrossRef] [Green Version]
  8. Kakosimos, K.E.; Hertel, O.; Ketzel, M.; Berkowicz, R. Operational Street Pollution Model (OSPM)–A review of performed application and validation studies, and future prospects. Environ. Chem. 2010, 7, 485–503. [Google Scholar] [CrossRef]
  9. Puliafito, E.; Guevara, M.; Puliafito, C. Characterization of urban air quality using GIS as a management system. Environ. Pollut. 2003, 122, 105–117. [Google Scholar] [CrossRef]
  10. López-Pérez, E.; Hermosilla, T.; Carot-Sierra, J.M.; Palau-Salvador, G. Spatial determination of traffic CO emissions within street canyons using inverse modelling. Atmos. Pollut. Res. 2019, 10, 1140–1147. [Google Scholar] [CrossRef]
  11. Liu, Z.; Xie, M.; Tian, K.; Gao, P. GIS-based analysis of population exposure to PM2.5 air pollution—A case study of Beijing. J. Environ. Sci. 2017, 59, 48–53. [Google Scholar] [CrossRef]
  12. Barzyk, T.M.; Isakov, V.; Arunachalam, S.; Venkatram, A.; Cook, R.; Naess, B. A near-road modeling system for community-scale assessments of traffic-related air pollution in the United States. Environ. Modell. Softw. 2015, 66, 46–56. [Google Scholar] [CrossRef]
  13. Lateb, M.; Meroney, R.N.; Yataghene, M.; Fellouah, H.; Saleh, F.; Boufadel, M.C. On the use of numerical modelling for near-field pollutant dispersion in urban environments−A review. Environ. Pollut. 2016, 208, 271–283. [Google Scholar] [CrossRef] [PubMed] [Green Version]
  14. Vardoulakis, S.; Fisher, B.E.; Pericleous, K.; Gonzalez-Flesca, N. Modelling air quality in street canyons: A review. Atmos. Environ. 2003, 37, 155–182. [Google Scholar] [CrossRef] [Green Version]
  15. Li, X.X.; Liu, C.H.; Leung, D.Y.; Lam, K.M. Recent progress in CFD modelling of wind field and pollutant transport in street canyons. Atmos. Environ. 2006, 40, 5640–5658. [Google Scholar] [CrossRef]
  16. Palau-Salvador, G.; García-Villalba, M.; Rodi, W. Scalar transport from point sources in the flow around a finite-height cylinder. Environ. Fluid Mech. 2011, 11, 611–625. [Google Scholar] [CrossRef]
  17. Di Sabatino, S.; Buccolieri, R.; Salizzoni, P. Recent advancements in numerical modelling of flow and dispersion in urban areas: A short. Int. J. Environ. Pollut. 2013, 52, 172–191. [Google Scholar] [CrossRef]
  18. Zhang, Y.; Gu, Z.; Yu, C.W. Review on numerical simulation of airflow and pollutant dispersion in urban street canyons under natural background wind condition. Aerosol Air Qual. Res. 2018, 18, 780–789. [Google Scholar] [CrossRef] [Green Version]
  19. Assimakopoulos, V.D.; ApSimon, H.M.; Moussiopoulos, N. A numerical study of atmospheric pollutant dispersion in different two-dimensional street canyon configurations. Atmos. Environ. 2003, 37, 4037–4049. [Google Scholar] [CrossRef]
  20. Soulhac, L.; Garbero, V.; Salizzoni, P.; Mejean, P.; Perkins, R.J. Flow and dispersion in street intersections. Atmos. Environ. 2009, 43, 2981–2996. [Google Scholar] [CrossRef]
  21. Goel, A.; Kumar, P. A review of fundamental drivers governing the emissions, dispersion and exposure to vehicle-emitted nanoparticles at signalised traffic intersections. Atmos. Environ. 2014, 97, 316–331. [Google Scholar] [CrossRef] [Green Version]
  22. Chang, C.H.; Meroney, R.N. Concentration and flow distributions in urban street canyons: Wind tunnel and computational data. J. Wind Eng. Ind. Aerod. 2003, 91, 1141–1154. [Google Scholar] [CrossRef]
  23. Buccolieri, R.; Sandberg, M.; Di Sabatino, S. City breathability and its link to pollutant concentration distribution within urban-like geometries. Atmos. Environ. 2010, 44, 1894–1903. [Google Scholar] [CrossRef]
  24. Mavroidis, I.; Griffiths, R.F. Local characteristics of atmospheric dispersion within building arrays. Atmos. Environ. 2011, 35, 2941–2954. [Google Scholar] [CrossRef]
  25. Gu, Z.L.; Zhang, Y.W.; Cheng, Y.; Lee, S.C. Effect of uneven building layout on air flow and pollutant dispersion in non-uniform street canyons. Build. Environ. 2011, 46, 2657–2665. [Google Scholar] [CrossRef]
  26. Hang, J.; Li, Y.; Buccolieri, R.; Sandberg, M.; Di Sabatino, S. On the contribution of mean flow and turbulence to city breathability: The case of long streets with tall buildings. Sci. Total Environ. 2012, 416, 362–373. [Google Scholar] [CrossRef] [PubMed]
  27. Antoniou, N.; Montazeri, H.; Wigo, H.; Neophytou, M.K.A.; Blocken, B.; Sandberg, M. CFD and wind-tunnel analysis of outdoor ventilation in a real compact heterogeneous urban area: Evaluation using “air delay”. Build. Environ. 2017, 126, 355–372. [Google Scholar] [CrossRef]
  28. Santiago, J.L.; Buccolieri, R.; Rivas, E.; Sanchez, B.; Martilli, A.; Gatto, E.; Martín, F. On the Impact of Trees on Ventilation in a Real Street in Pamplona, Spain. Atmosphere 2019, 10, 697. [Google Scholar] [CrossRef] [Green Version]
  29. Bady, M.; Kato, S.; Huang, H. Towards the application of indoor ventilation efficiency indices to evaluate the air quality of urban areas. Build. Environ. 2008, 43, 1991–2004. [Google Scholar] [CrossRef]
  30. Lin, M.; Hang, J.; Li, Y.; Luo, Z.; Sandberg, M. Quantitative ventilation assessments of idealized urban canopy layers with various urban layouts and the same building packing density. Build. Environ. 2014, 79, 152–167. [Google Scholar] [CrossRef]
  31. Mei, S.J.; Luo, Z.; Zhao, F.Y.; Wang, H.Q. Street canyon ventilation and airborne pollutant dispersion: 2-D versus 3-D CFD simulations. Sustain. Cities Soc. 2019, 50, 101700. [Google Scholar] [CrossRef]
  32. Coceal, O.; Goulart, E.V.; Branford, S.; Thomas, T.G.; Belcher, S.E. Flow structure and near-field dispersion in arrays of building-like obstacles. J. Wind Eng. Ind. Aerodyn. 2014, 125, 52–68. [Google Scholar] [CrossRef] [Green Version]
  33. An, K.; Wong, S.M.; Fung, J.C.H. Exploration of sustainable building morphologies for effective passive pollutant dispersion within compact urban environments. Build. Environ. 2019, 148, 508–523. [Google Scholar] [CrossRef]
  34. Deck, S. Zonal-detached-eddy simulation of the flow around a high-lift configuration. AIAA J. 2005, 43, 2372–2384. [Google Scholar] [CrossRef] [Green Version]
  35. Chan, A.T.; So, E.S.; Samad, S.C. Strategic guidelines for street canyon geometry to achieve sustainable street air quality. Atmos. Environ. 2001, 35, 4089–4098. [Google Scholar] [CrossRef]
  36. Chan, A.T.; Au, W.T.; So, E.S. Strategic guidelines for street canyon geometry to achieve sustainable street air quality—Part II: Multiple canopies and canyons. Atmos. Environ. 2003, 37, 2761–2772. [Google Scholar] [CrossRef]
  37. Gallagher, J.; Gill, L.W.; McNabola, A. Numerical modelling of the passive control of air pollution in asymmetrical urban street canyons using refined mesh discretization schemes. Build. Environ. 2012, 56, 232–240. [Google Scholar] [CrossRef]
  38. Thaker, P.; Gokhale, S. The impact of traffic-flow patterns on air quality in urban street canyons. Environ. Pollut. 2016, 208, 161–169. [Google Scholar] [CrossRef]
  39. Blocken, B. Computational Fluid Dynamics for urban physics: Importance, scales, possibilities, limitations and ten tips and tricks towards accurate and reliable simulations. Build. Environ. 2015, 91, 219–245. [Google Scholar] [CrossRef] [Green Version]
  40. Hefny, M.M.; Ooka, R. CFD analysis of pollutant dispersion around buildings: Effect of cell geometry. Build. Environ. 2009, 44, 1699–1706. [Google Scholar] [CrossRef]
  41. Palmgren, F.; Berkowicz, R.; Ziv, A.; Hertel, O. Actual car fleet emissions estimated from urban air quality measurements and street pollution models. Sci. Total Environ. 1999, 235, 101–109. [Google Scholar] [CrossRef]
  42. Zárate, E.; Belalcázar, L.C.; Clappier, A.; Manzi, V.; Van den Bergh, H. Air quality modelling over Bogota, Colombia: Combined techniques to estimate and evaluate emission inventories. Atmos. Environ. 2007, 41, 6302–6318. [Google Scholar] [CrossRef] [Green Version]
  43. Bellasio, R.; Bianconi, R.; Corda, G.; Cucca, P. Emission inventory for the road transport sector in Sardinia (Italy). Atmos. Environ. 2007, 41, 677–691. [Google Scholar] [CrossRef]
  44. Doumbia, M.; Toure, N.D.E.; Silue, S.; Yoboue, V.; Diedhiou, A.; Hauhouot, C. Emissions from the road traffic of West African cities: Assessment of vehicle fleet and fuel consumption. Energies 2018, 11, 2300. [Google Scholar] [CrossRef] [Green Version]
  45. Baayoun, A.; Itani, W.; El Helou, J.; Halabi, L.; Medlej, S.; El Malki, M.; Moukhadder, A.; Aboujaoude, L.K.; Kabakian, V.; Mounajed, H.; et al. Emission inventory of key sources of air pollution in Lebanon. Atmos. Environ. 2019, 215, 116871. [Google Scholar] [CrossRef]
  46. Oke, T.R. Street design and urban canopy layer climate. Energy Build. 1988, 11, 103–113. [Google Scholar] [CrossRef]
  47. Tiberi, U. Analysis and Design of IEEE 802.15.4 Networked Control Systems. Ph.D. Thesis, University of L’Aquila, L'Aquila AQ, Italy, 2011. [Google Scholar]
  48. Gaura, E.; Girod, L.; Brusey, J.; Allen, M.; Challen, G. Wireless Sensor Networks: Deployments and Design Frameworks; Springer Science & Business Media: Berlin/Heidelberg, Germany, 2010. [Google Scholar]
  49. Hajdukiewicz, M.; Geron, M.; Keane, M.M. Formal calibration methodology for CFD models of naturally ventilated indoor environments. Build. Environ. 2013, 59, 290–302. [Google Scholar] [CrossRef] [Green Version]
  50. CD-Adapco, Inc. STAR-CCM+ (5.04.006) User’s Guide; CD-Adapco: New York, NY, USA, 2010. [Google Scholar]
  51. Franke, J.; Hellsten, A.; Schlunzen, K.H.; Carissimo, B. The COST 732 Best Practice Guideline for CFD simulation of flows in the urban environment: A summary. Int. J. Environ. Pollut. 2011, 44, 419–427. [Google Scholar] [CrossRef]
  52. Launder, B.E.; Spalding, D.B. The numerical computation of turbulent flows. Comput. Methods Appl. Mech. Eng. 1974, 3, 269–289. [Google Scholar] [CrossRef]
  53. Parra Narváez, R.R. Desarrollo del Modelo EMICAT2000 Para la Estimación de Emisiones de Contaminantes del Aire en Cataluña y su Uso en Modelos de Dispersión Fotoquímica. Ph.D. Thesis, Universitat Politècnica de Catalunya, Barcelona, Spain, 2004. [Google Scholar]
  54. Ghenu, A.; Rosant, J.M.; Sini, J.F. Dispersion of pollutants and estimation of emissions in a street canyon in Rouen, France. Environ. Modell. Softw. 2008, 23, 314–321. [Google Scholar] [CrossRef]
  55. Ketzel, M.; Wåhlin, P.; Berkowicz, R.; Palmgren, F. Particle and trace gas emission factors under urban driving conditions in Copenhagen based on street and roof-level observations. Atmos. Environ. 2003, 37, 2735–2749. [Google Scholar] [CrossRef]
  56. Nikora, V.; McEwan, I.; McLean, S.; Coleman, S.; Pokrajac, D.; Walters, R. Double-averaging concept for rough-bed open-channel and overland flows: Theoretical background. J. Hydraul. Eng. 2007, 133, 873–883. [Google Scholar] [CrossRef]
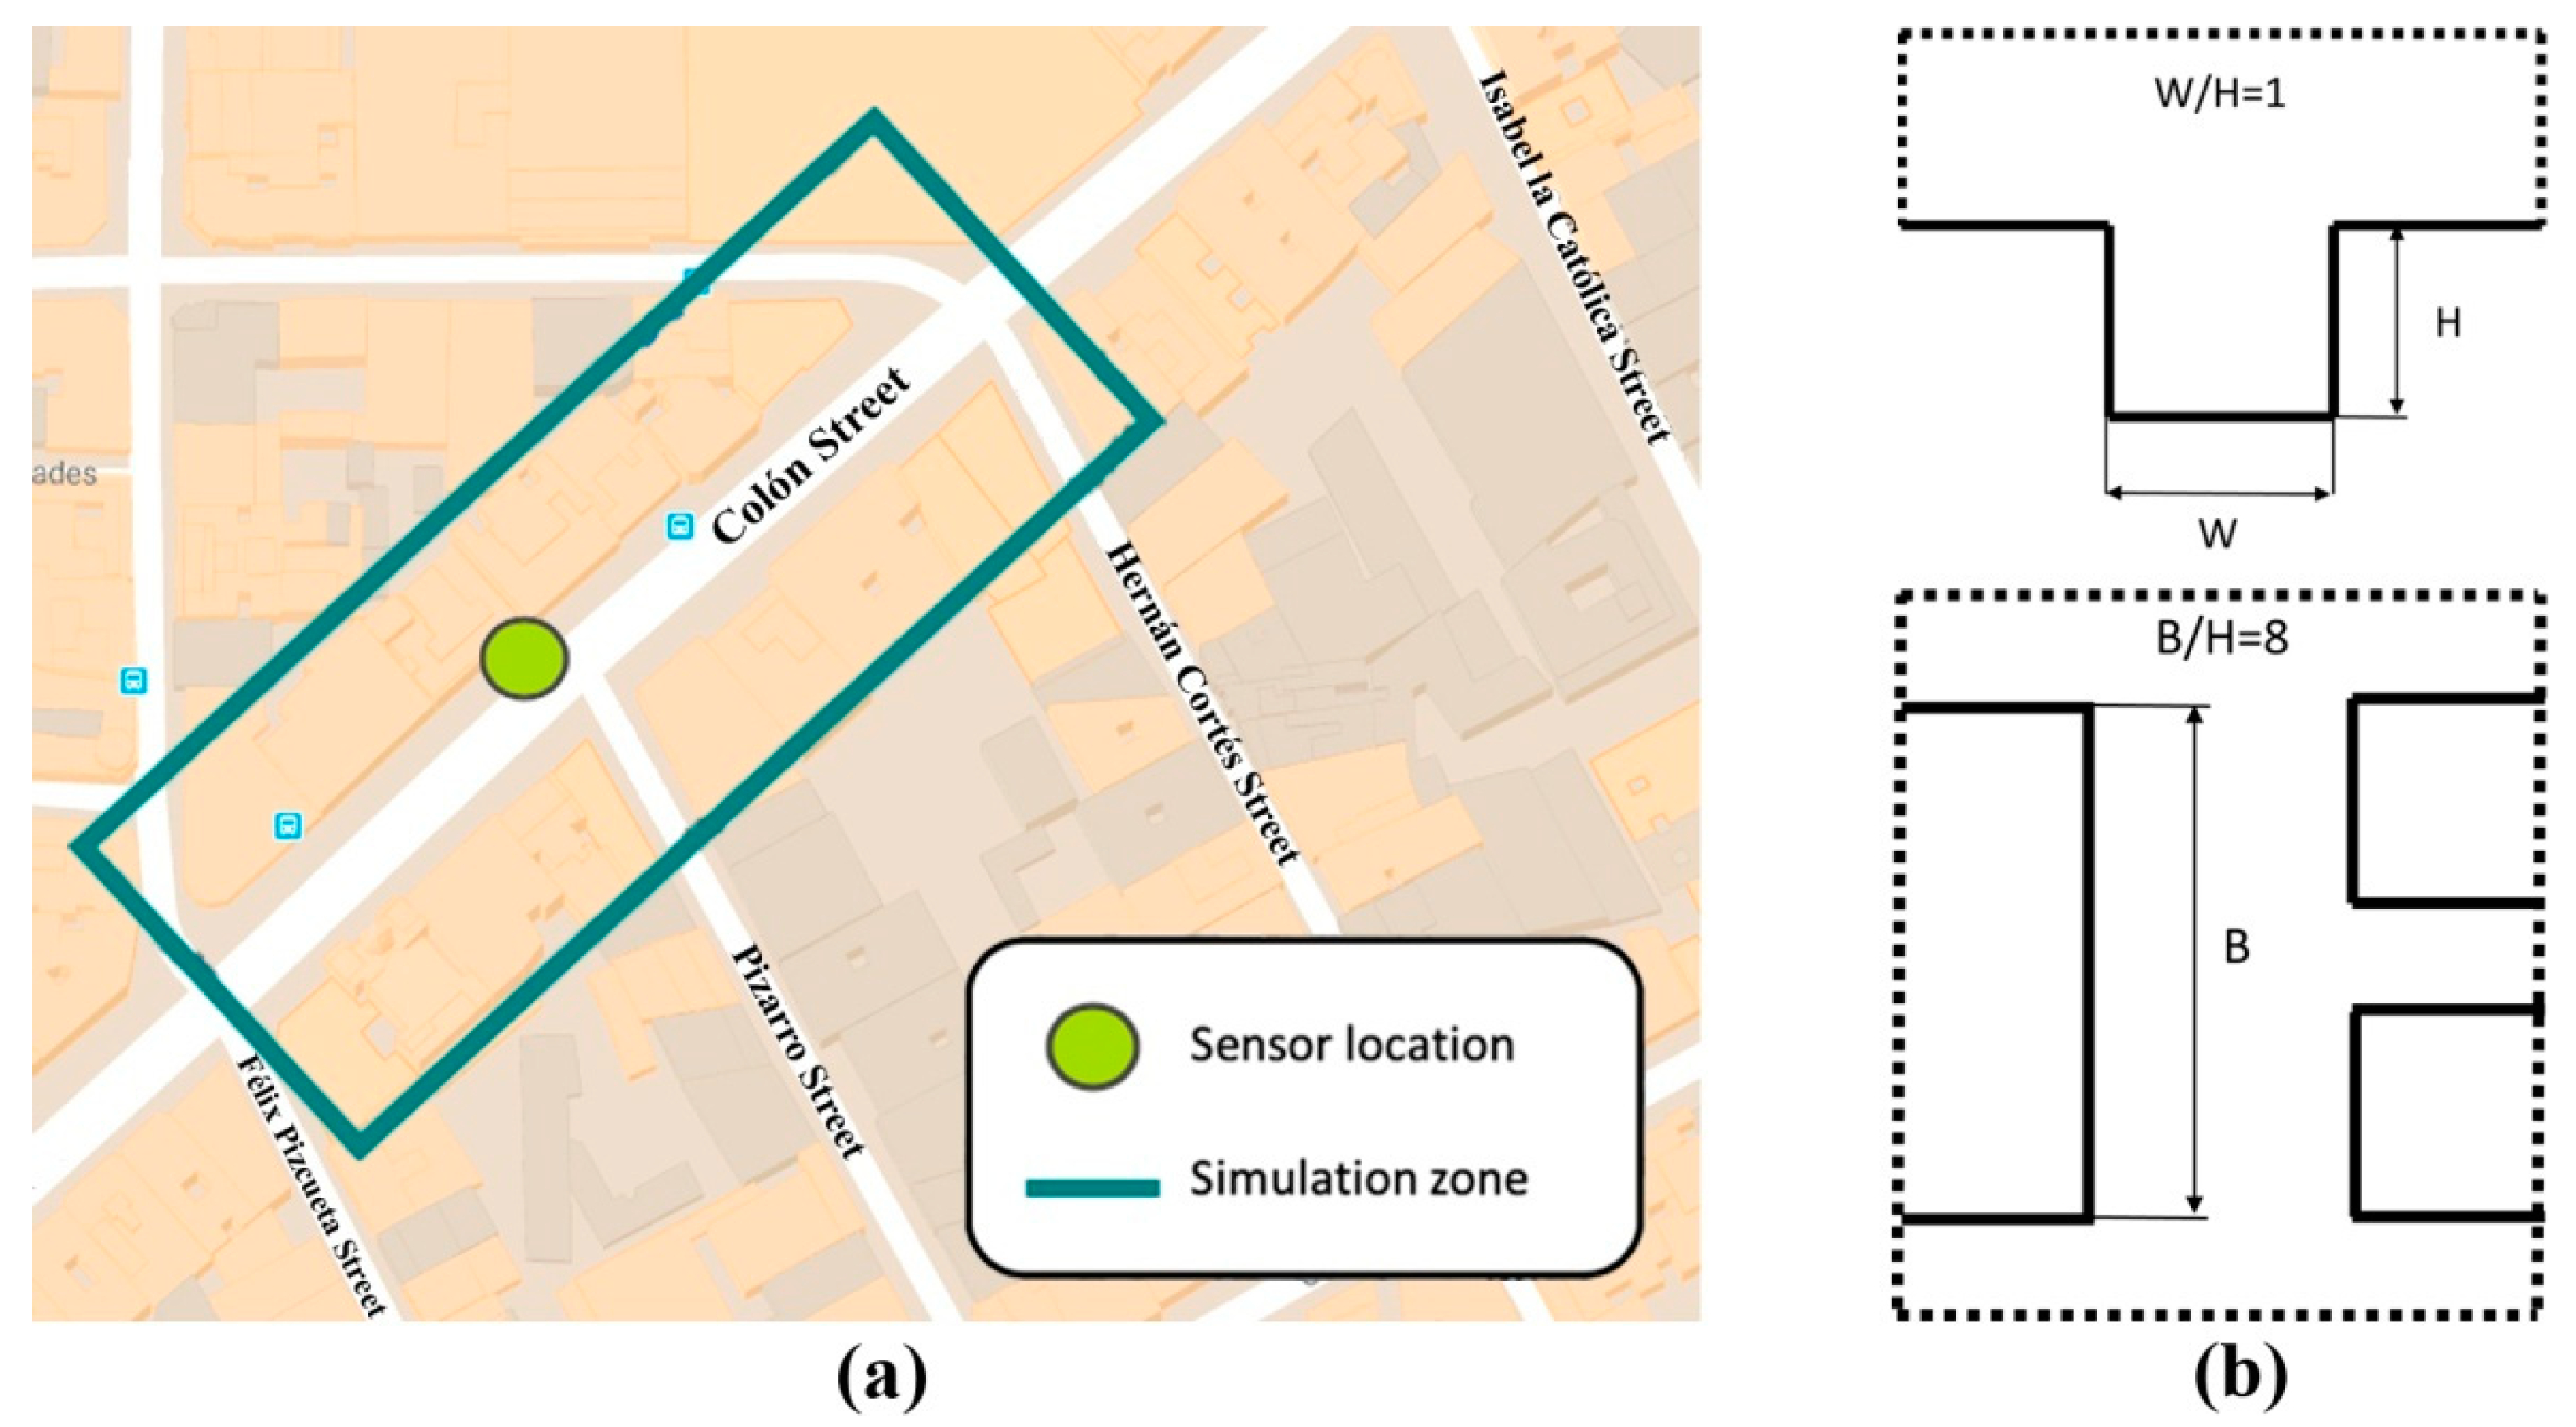
Figure 1. (a) Limits of the urban canyon studied in this paper; (b) vertical and horizontal schematics of the urban canyon analyzed in this study.
Atmosphere 11 00693 g001
Figure 2. Block diagram with a WSN’s node parts.
Atmosphere 11 00693 g002
Figure 3. Detail of the grid used in the CFD model: (a) general view; (b) detail near the wall in a vertical section.
Atmosphere 11 00693 g003
Figure 4. Comparison between experimental CO concentration (ppm) and numerical results at the control point used to validate the model for the six validation cases.
Atmosphere 11 00693 g004
Figure 5. Contour velocity planes (a,d,g), streamlines (b,e,h) and contour planes of CO concentration (c,f,i) for cv1, cv2 and cv3 validation cases, respectively. The planes were located at 1.5 m of height. Traffic and wind direction are marked with red and blue arrows, respectively. Traffic intensity and velocity are specified in their respective arrows.
Atmosphere 11 00693 g005
Figure 6. Contour velocity planes (a,d,g), streamlines (b,e,h), and contour planes of CO concentration (c,f,i) for cv4, cv5, and cv6 validation cases, respectively. The planes were located at 1.5 m of height. Traffic and wind direction are marked with red and blue arrows, respectively. Traffic intensity and velocity are specified in their respective arrows.
Atmosphere 11 00693 g006
Figure 7. Streamlines at different heights: 0.25 m (a,b,c); 1.00 m (d,e,f); 1.50 m (g,h,i); and 3.00 m (j,k,l) for cv1, cv3 and cv5 validation cases, respectively.
Atmosphere 11 00693 g007
Figure 8. Double averaged profiles of CO concentration normalized with the total emission for the six validation cases.
Atmosphere 11 00693 g008
Figure 9. CO concentration contours (ppm) and streamlines in the hypothetical case hv1 for 2 m/s in (a,b) and for 0.5 m/s in (c,d). Traffic and wind direction are marked with red and blue arrows, respectively.
Atmosphere 11 00693 g009
Figure 10. CO concentration contours (ppm) and streamlines in the hypothetical case hv2 for 2 m/s in (a,b) and for 0.5 m/s in (c,d). Traffic and wind direction are marked with red and blue arrows, respectively.
Atmosphere 11 00693 g010
Figure 11. CO concentration contours (ppm) and streamlines in the hypothetical case hv3 for 2 m/s in (a,b) and for 0.5 m/s in (c,d). Traffic and wind direction are marked with red and blue arrows, respectively.
Atmosphere 11 00693 g011
Figure 12. Double averaged profiles of CO concentration in the 3 hypothetical cases with wind velocities of 0.5 and 2 m/s.
Atmosphere 11 00693 g012
Figure 13. Iso-surfaces of CO concentration (blue 0.35 ppm and green 0.7 ppm) in the h1 case and a wind velocity of 0.5 m/s for a traffic intensity of (a) 500 vehicles, (b) 1500 vehicles, and (c) 2500 vehicles.
Atmosphere 11 00693 g013
Table 1. Grid information.
Computational Domain (m)Number of CellsTotal Grid Cells
General dimensions77.6 × 219.8 × 50213 × 74 × 801,616,160
AxisCell numberMin. length (m)Max. length (m)
X2130.382.90
Y740.751.25
Z800.101.00
Table 2. Validation cases (CV) used in the study.
CASENumber of VehiclesAverage Wind Velocity (m/s)Average Wind Direction (°)
cv122700.7596
cv221050.8012
cv32281.35263
cv411651.0838
cv518451.63348
cv621292.0515
Table 3. Hypothetical cases (hv) with parallel and perpendicular wind directions.
CASENr. VehiclesAverage Wind Velocity (m/s)Average Wind Direction (°)
hv12270From 0.5 to 246
hv22270From 0.5 to 2226
hv32270From 0.5 to 2149
Table 4. Emission factors by different hypotheses: maximum, inventory and minimum scenarios.
CASEEmission Factor (g km−1 veh−1)
Maximum emission29.2
Minimum emission0.47
Average emission5.32