Odor Characteristics and Concentration of Malodorous Chemical Compounds Emitted from a Combined Sewer System in Korea


Abstract
1. Introduction
2. Material and Methods
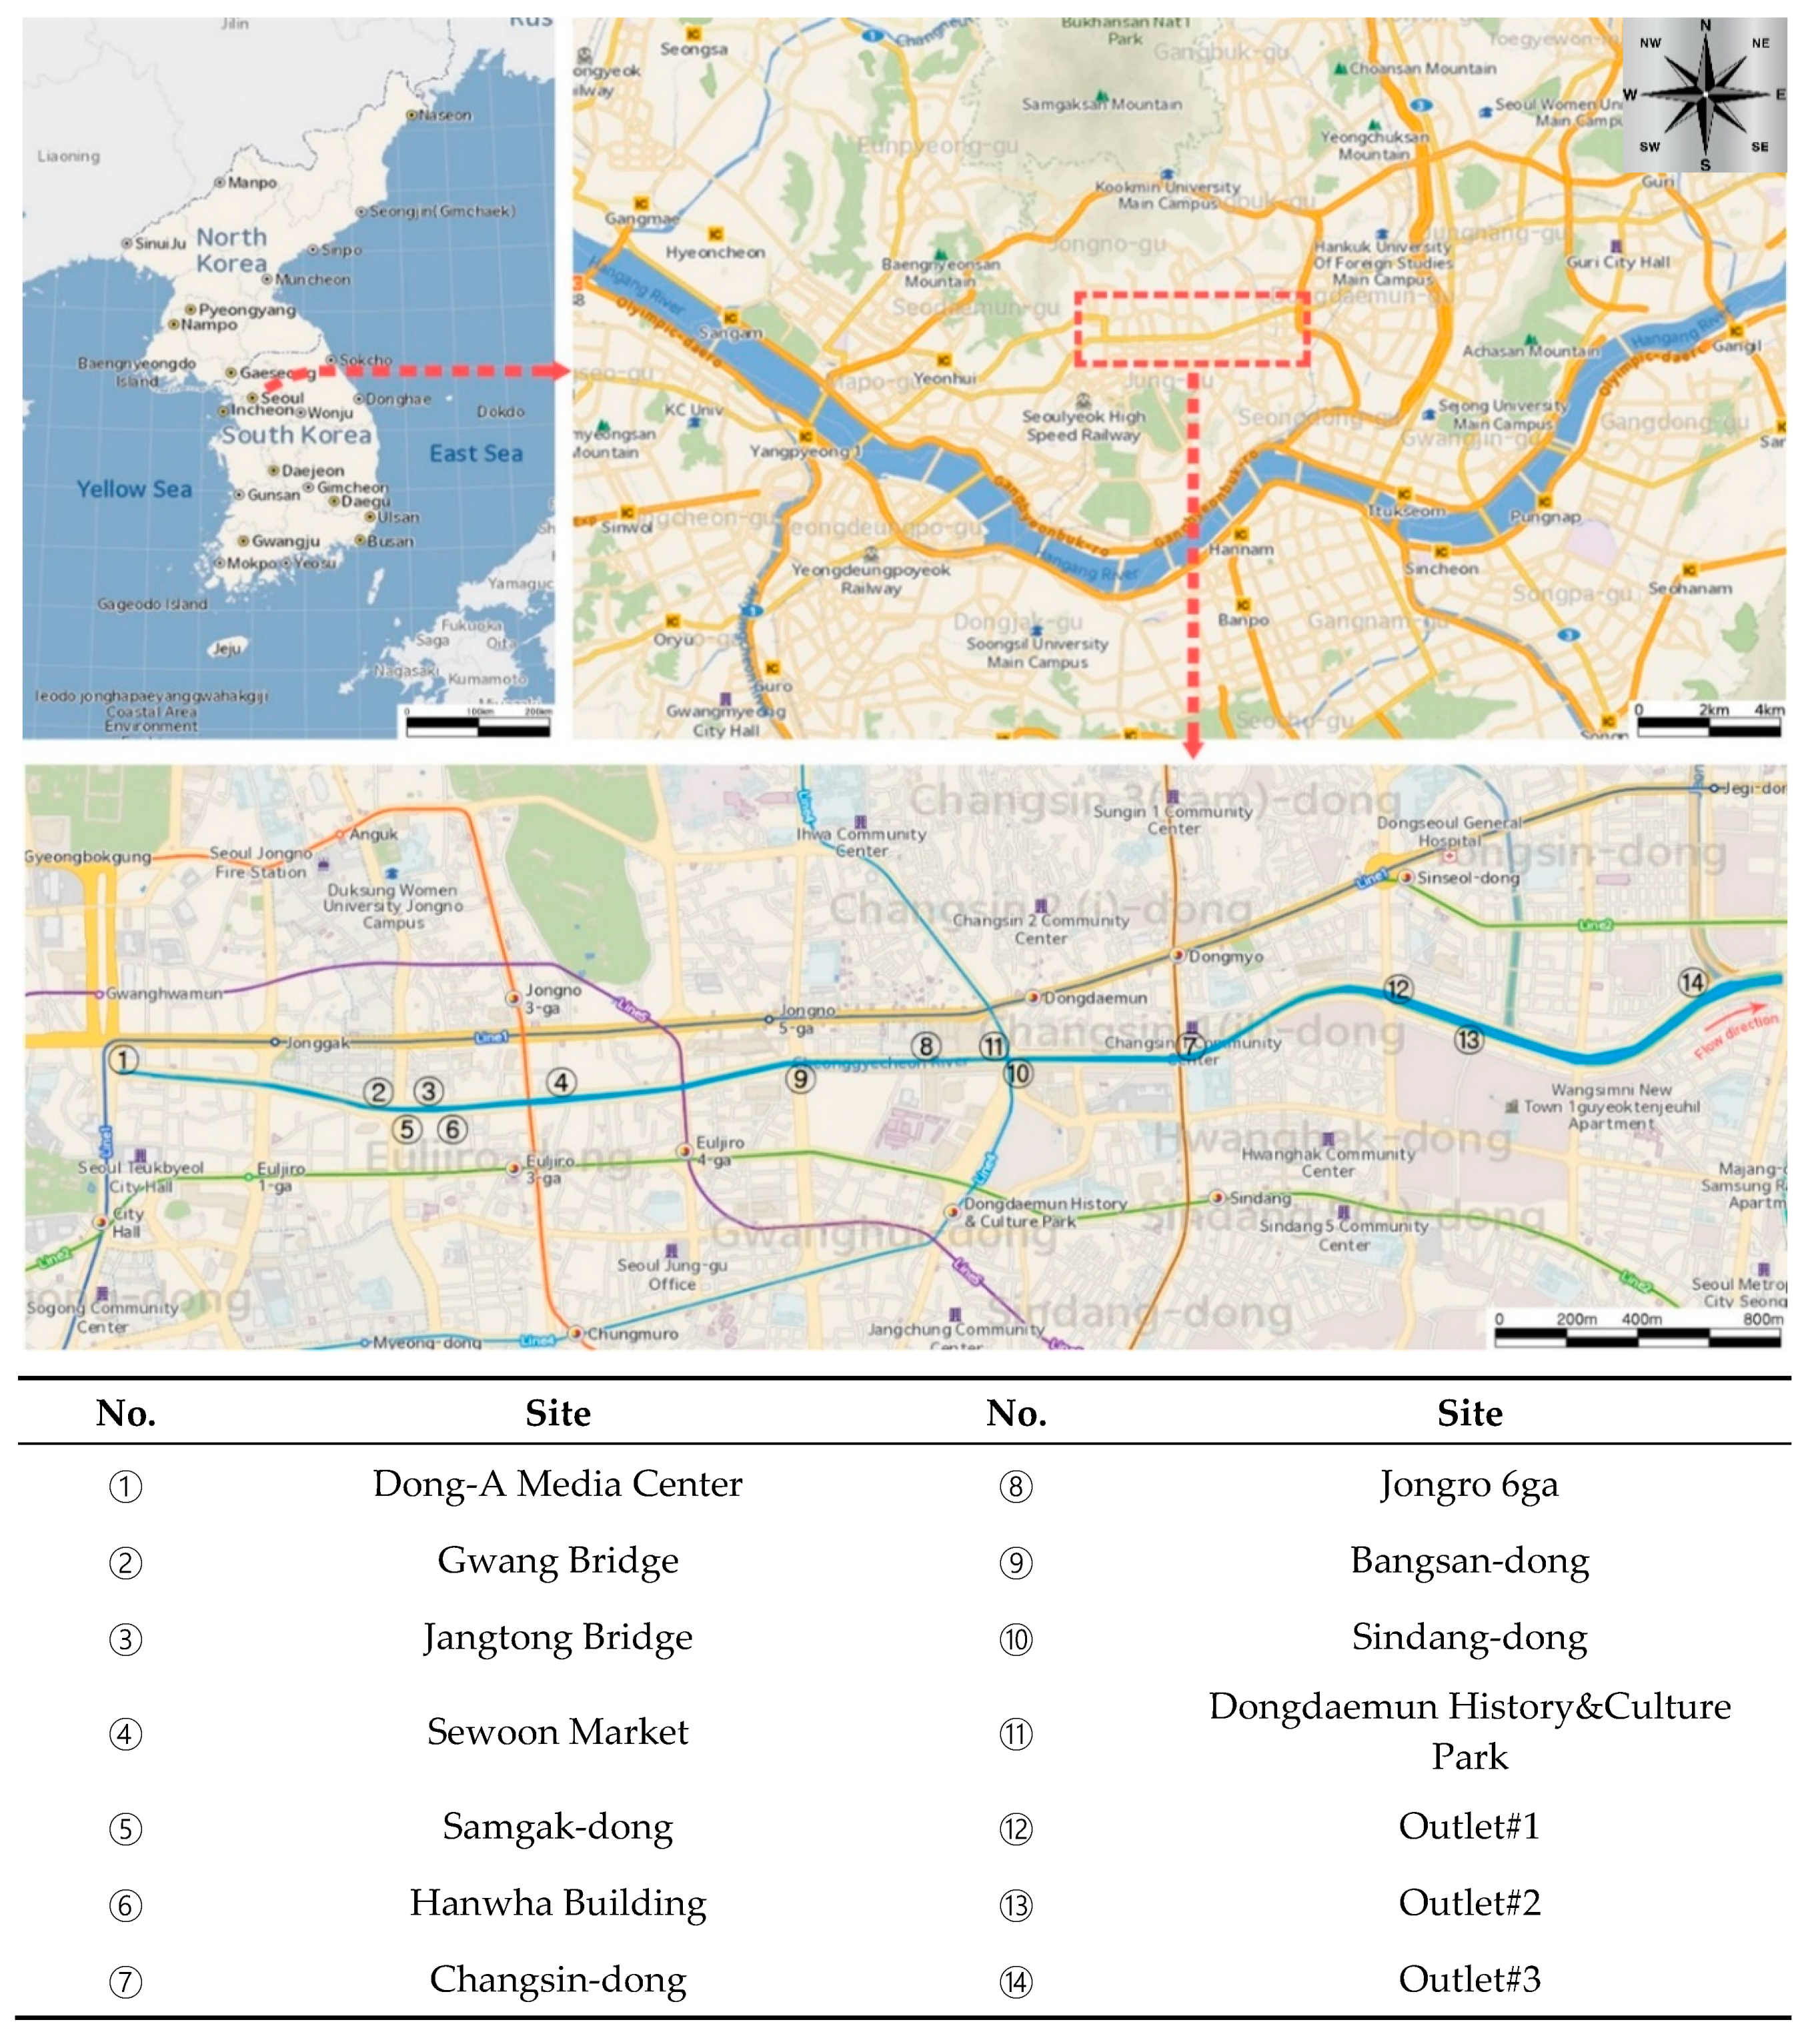
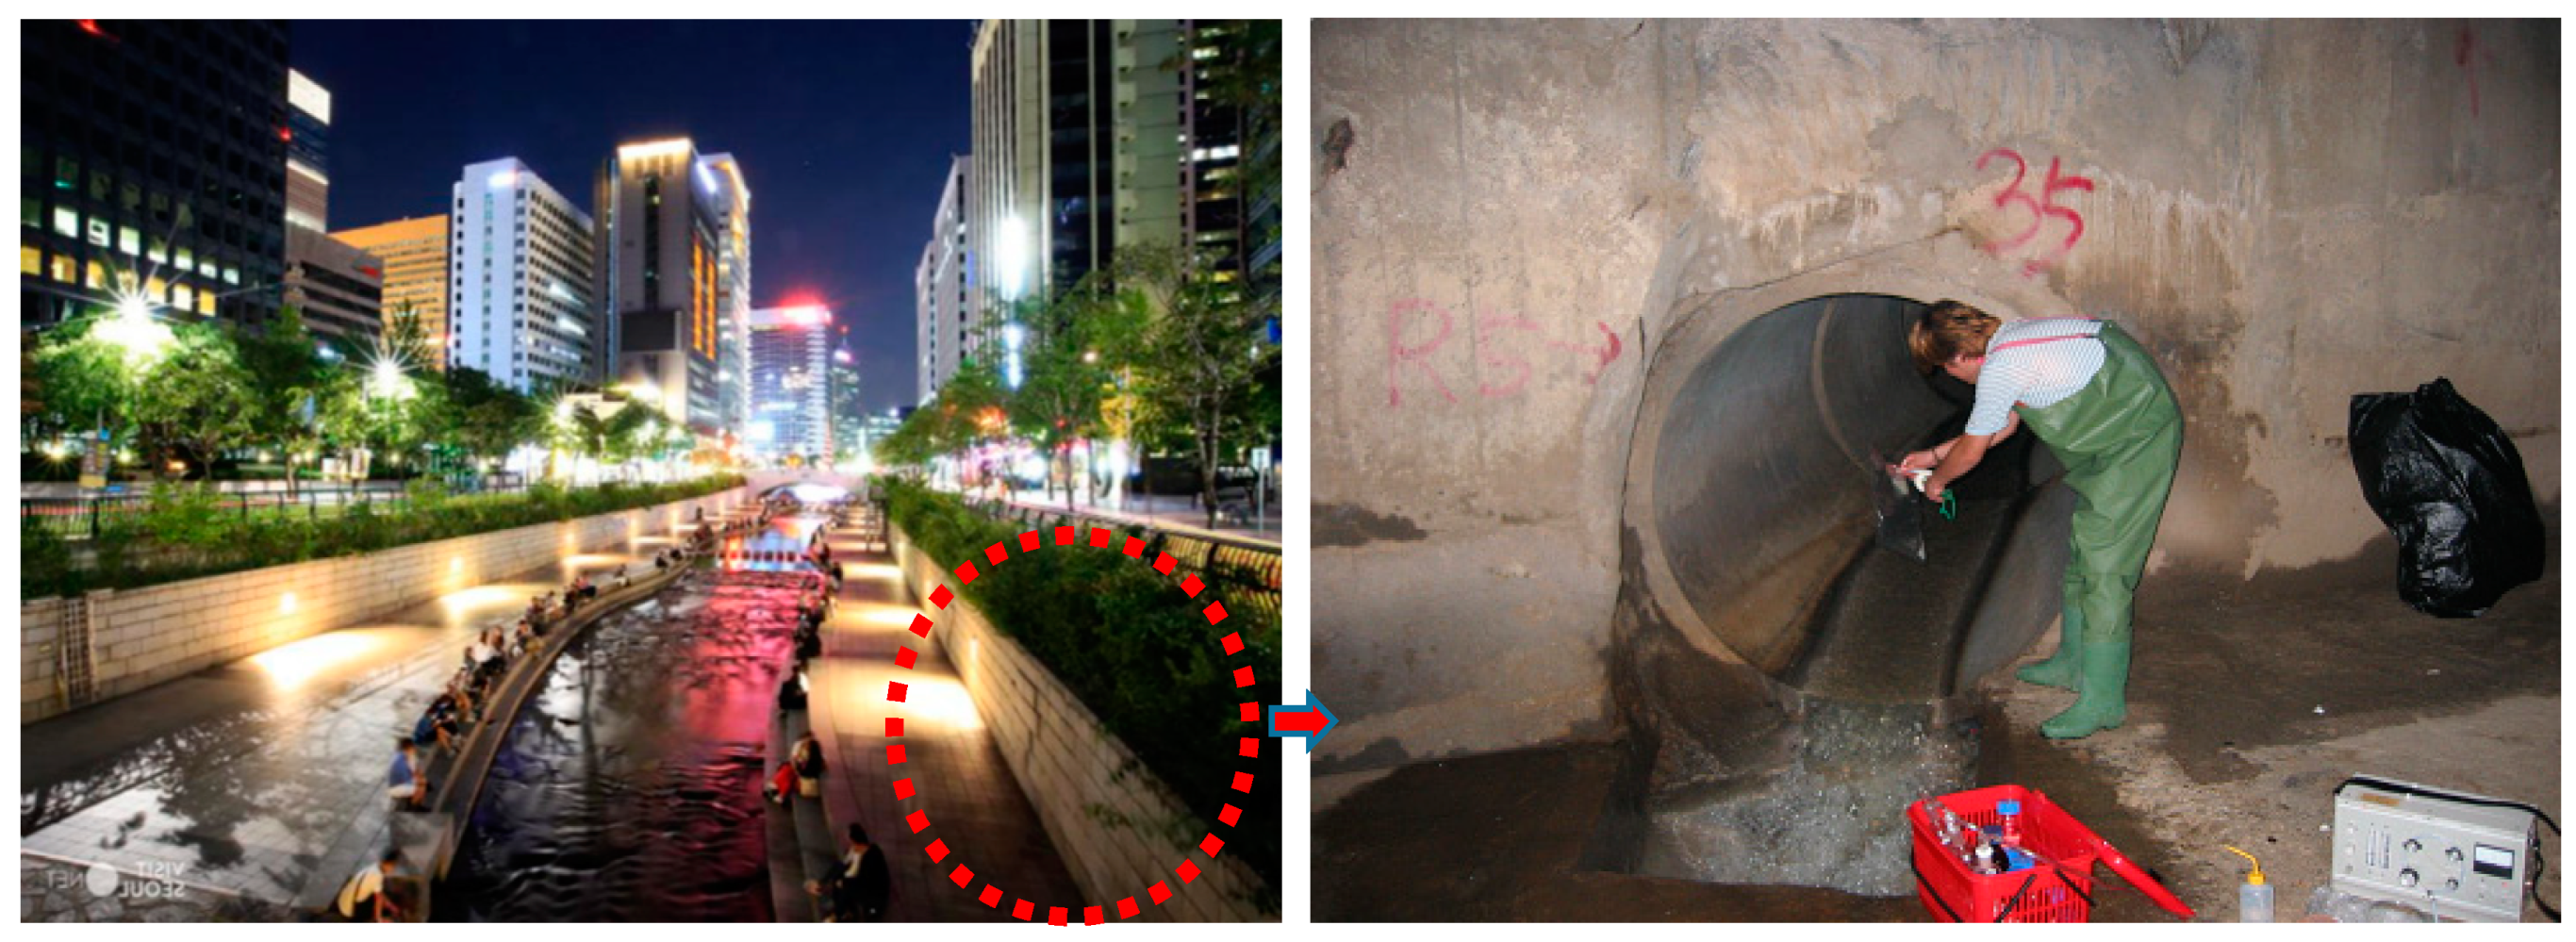
2.1. Outline of the Study Area and Sewer Odor Sampling Sites
2.2. Determination of Target Malodorous Compounds and Analysis Methods
2.2.1. Determination and Analysis of Target Odorant Compounds
2.2.2. Analysis of Target Malodorous Compounds
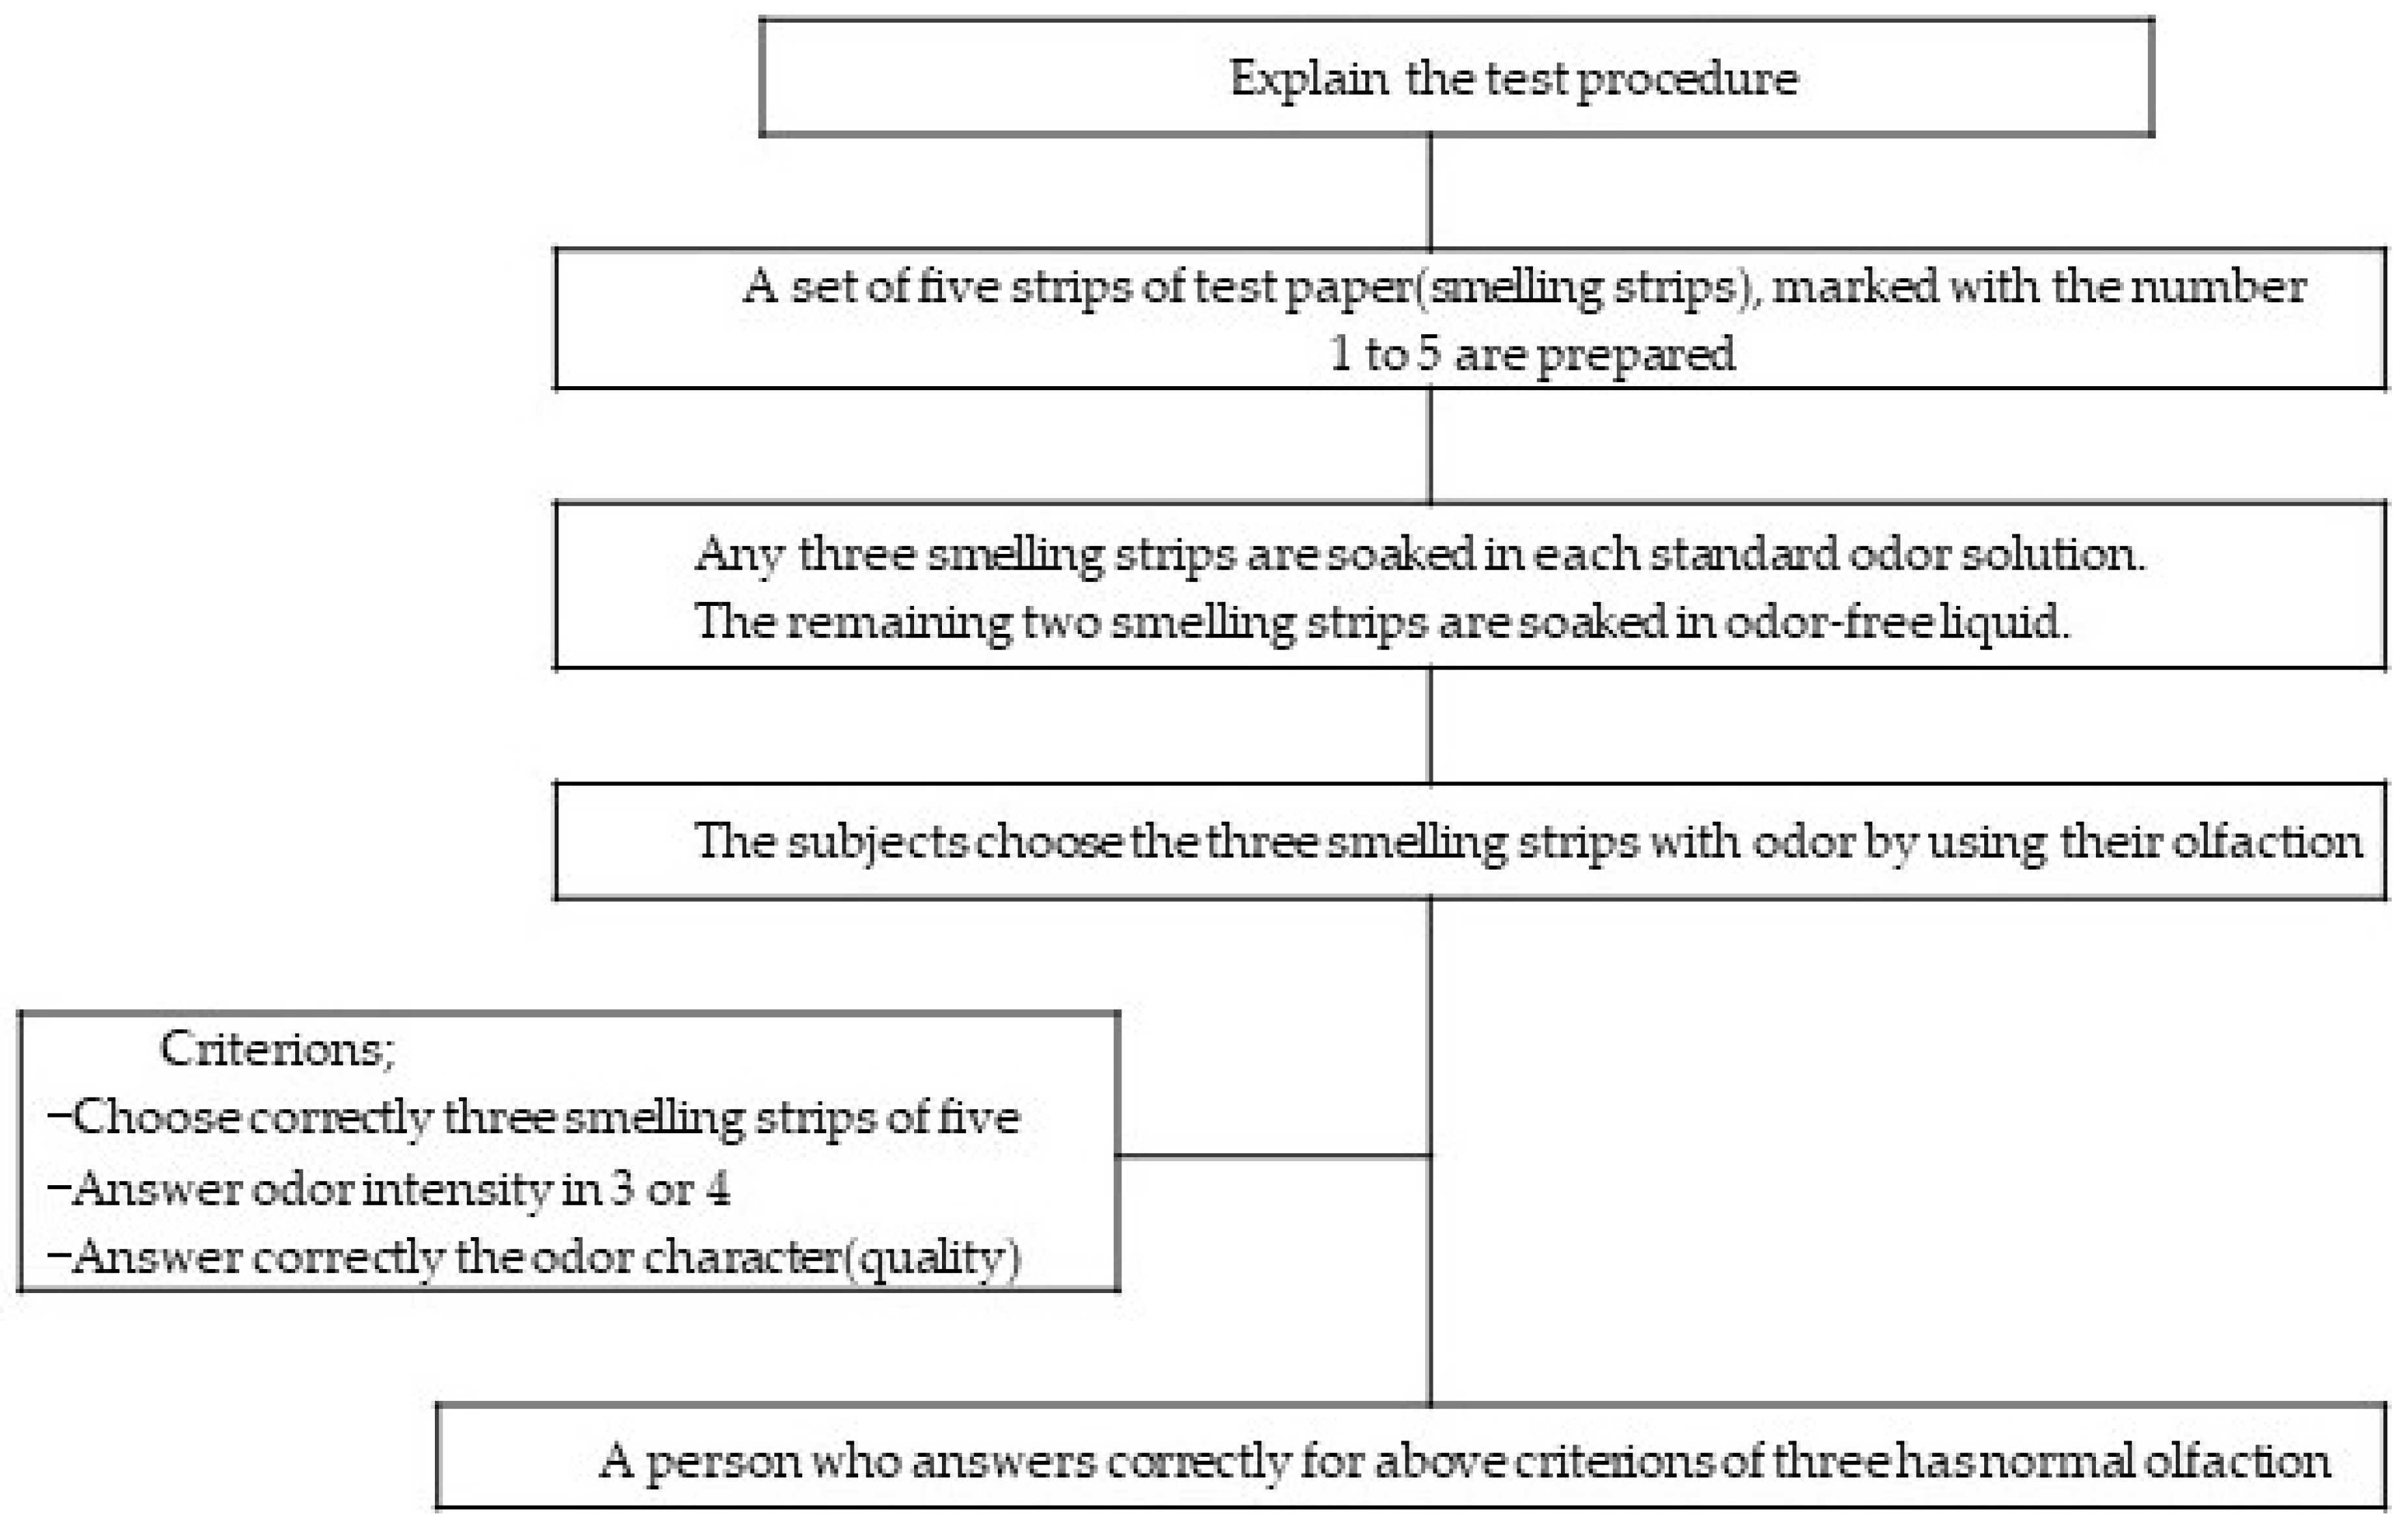
2.3. Evaluation of On-Site Odor Intensity Using a Panelist’s Olfactory Test Method
2.4. Evaluation of Odor Concentration Using the Odorant Compounds Concentration and Threshold Limit Value
- COC: Converted Odor Concentration
- MCC: Malodorous Compounds Concentration (ppm or ppb)
- TLV: Threshold Limit Value (ppm or ppb)
3. Results
3.1. Concentration of Target Malodorous Compounds Emitted from Sewage Odor
3.2. Observed Odor Intensity(OOI) by On-Site Olfactory Test Method
4. Discussion
4.1. Determination of Dominant Odorant Compounds in a Combined Sewer Odor
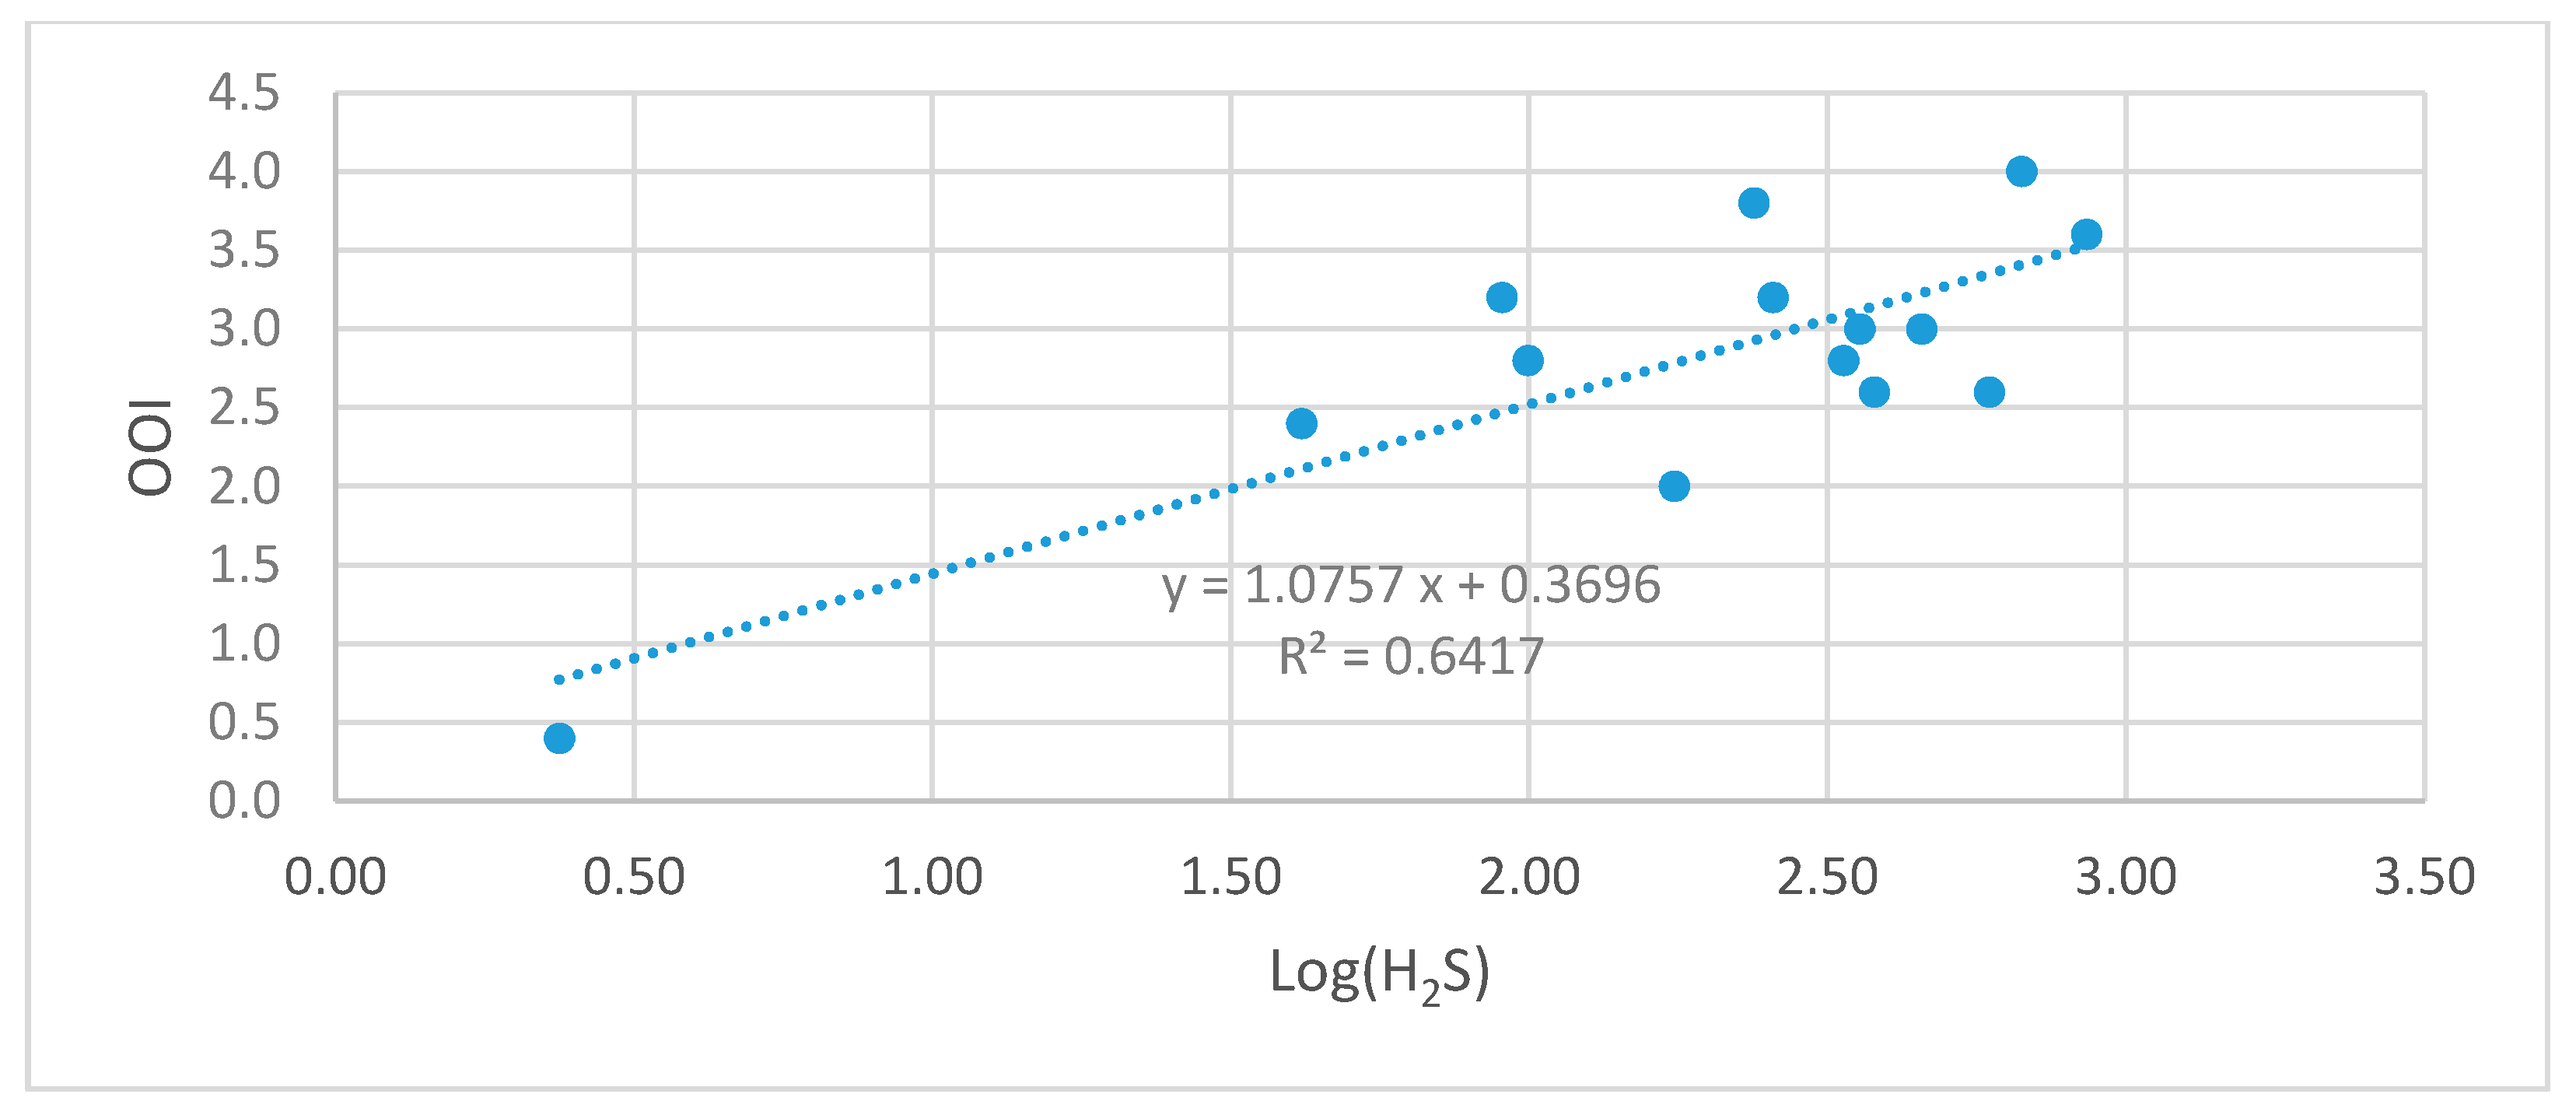
4.2. Correlation between On-Site Observed Odor Intensity and H2S Concentration in a Combined Sewer Odor
- COI
- : Converted Odor Intensity
- COI
- MCC: Malodorous Compounds Concentration
- COI
- a, b: Coefficient for the malodorous compounds
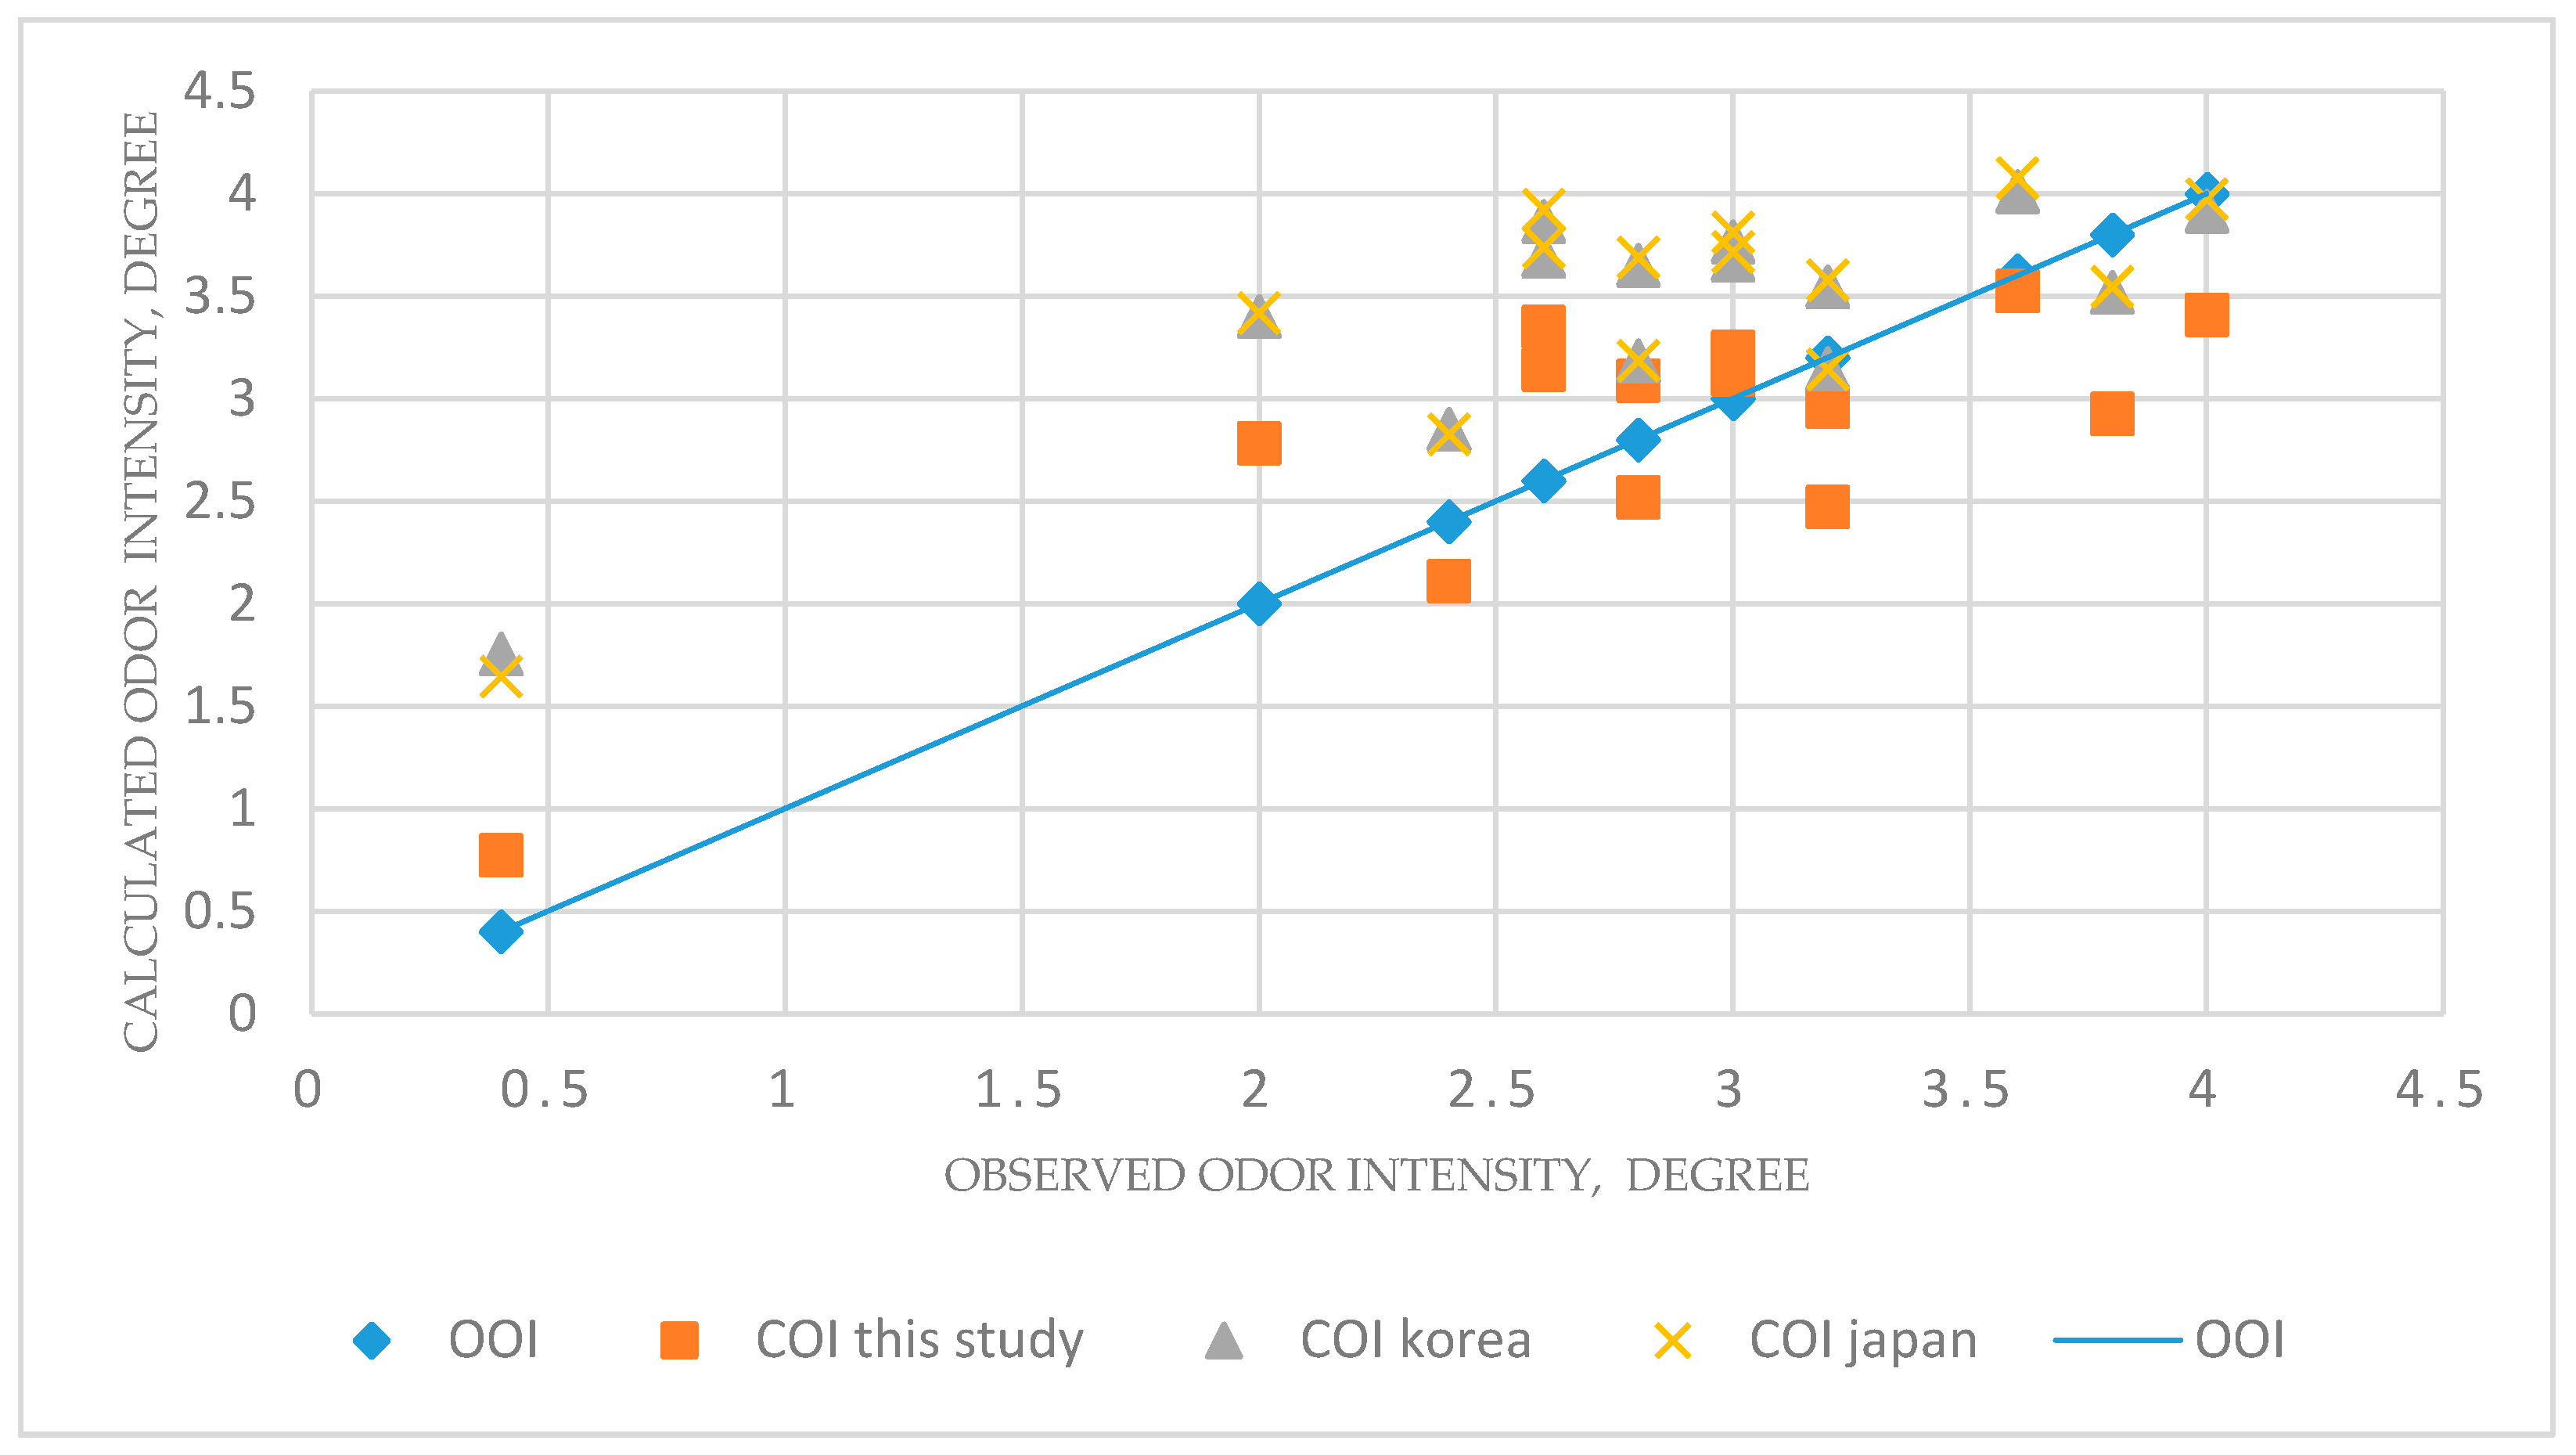
4.3. Comparison of Other Studies about Correlation Equation between Odor Intensity and Compound Concentration
5. Conclusions
- Among the 13 malodor substances investigated in this study, the inorganic malodor compounds had an average of 325 ppb for H2S, 121 ppb for NH3, 102 ppb for CH3SH, and toluene showed an average of 108 ppb for volatile organic compounds, which was higher than other compounds. The rest of the compounds appeared low, below 60 ppb.
- On the basis of the COC calculated by using the compound concentration and the threshold limit value, H2S, CH3SH, and (CH3)3N turned out to be compounds with high contribution to combined sewer odor. Especially, H2S was estimated to be the primary odor-causing compound, considering the contribution to the odor and the magnitude of compound concentration.
- The on-site odor intensity estimated by 5 panelists at 14 sites of combined sewer was found to be 2.8 degrees on average. It showed that the odor emitted from the combined sewer needs to be reduced because the odor emission criteria of non-industrial areas in Korea are set to be less than 2.5 degrees of odor intensity.
- As a result of the correlation analysis between the measured H2S concentration and the observed odor intensity in this study, the correlation between the odor intensity and the compound concentration in the combined sewer appeared as the following equation: COI, degrees = 1.0757 × log (H2S conc., ppb) + 0.3696.
- Since the method of on-site odor intensity by the human nose requires a lot of manpower and time, it was estimated that the COI method using the malodorous compound concentration can also be effectively used to evaluate the odor intensity to understand the characteristics of the combined sewer odor, as the alternative of OOI.
Funding
Conflicts of Interest
References
- US Environmental Protection Agency (US EPA). Design Manual: Odor and Corrosion Control in Sanitary Sewerage Systems and Treatment Plants; EPA Press: Washington, DC, USA, 1985; pp. 1–85. [Google Scholar]
- Pochwat, K.; Kida, M.; Ziembowicz, S.; Koszelnik, P. Odours in sewerage—A description of emissions and of technical abatement measures. Environments 2019, 6, 89. [Google Scholar] [CrossRef]
- Sivret, E.C.; Wang, B.; Parcsi, G.; Stuetz, R.M. Prioritisation of odorants emitted from sewers using odour activity values. Water Res. 2016, 88, 308–321. [Google Scholar] [CrossRef] [PubMed]
- Pandey, S.K.; Kim, K.H.; Kwon, E.E.; Kim, Y.H. Hazardous and odorous pollutants released from sewer manholes and stormwater catch basins in urban areas. Environ. Res. 2016, 146, 235–244. [Google Scholar] [CrossRef] [PubMed]
- Wang, B.; Sivert, E.C.; Parcsi, G.; Wang, X.; Stuetz, R.M. Characterising volatile organic compounds from sewer emission by thermal desorption coupled with Gas-Chromatography-mass spectrometry. Chem. Eng. Trans. 2012, 30, 73–78. [Google Scholar]
- Frechen, F.B.; Romaker, J.; Giebel, S.M. Controlling chemical dosing into sewers for odour and corrosion abatement. Chem. Eng. Trans. 2014, 40, 217–222. [Google Scholar]
- Liu, Y.; Ganigue, R.; Sharma, K.; Yuana, Z. Event-driven model predictive control of sewage pumping stations for sulfide mitigation in sewer networks. Water Res. 2016, 98, 376–383. [Google Scholar] [CrossRef]
- Sun, J.; Pikaar, I.; Sharma, K.R.; Keller, J.; Yuan, Z. Feasibility of sulfide control in sewers by reuse of iron rich drinking water treatment sludge. Water Res. 2015, 71, 150–159. [Google Scholar] [CrossRef] [PubMed]
- Rathnayake, D.; Sathasivan, A.; Kastl, G.; Bal-Krishna, K.C. Hydrogen sulphide control in sewers by catalysing the reaction with oxygen. Sci. Total Environ. 2019, 689, 1192–1200. [Google Scholar] [CrossRef] [PubMed]
- Korea Ministry of Environments. Statics of Sewerage Works in Korea. 2018. Available online: https://www.hasudoinfo.or.kr/stat/statRefDetail.do# (accessed on 10 April 2020).
- Hayes, J.E.; Stevenson, R.J.; Stuetz, R.M. The impact of malodour on communities: A review of assessment techniques. Sci. Total Environ. 2014, 500, 395–407. [Google Scholar] [CrossRef]
- Seoul City. Full-Scale Reduction Study of Odor Emitted from Sewer Facilities; Seoul City Hall Press: Seoul, Korea, 2010; pp. 35–83. [Google Scholar]
- Park, S.J. Remote monitoring and real-time abatement of odor emitted from sewer using odor sensors, wireless communication technique and microbial deodorant. Glob. NEST J. 2018, 20, 646–653. [Google Scholar]
- National Environmental Technology Information Center. Final Report of Advanced Odor Management in Korea; National Environmental Technology Information Center Press: Seoul, Korea, 2014. [Google Scholar]
- Hanbit Car Center Blog. Famous Night-View of Seoul Metropolitan City. Available online: https://search.naver.com/search.naver?sm=tab_hty.top&where=image&query=%EC%B2%AD%EA%B3%84%EC%B2%9C+%EA%B3%B5%EC%9B%90+%EC%95%BC%EA%B2%BD&oquery=%EC%B2%AD%EA%B3%84%EC%B2%9C+%EA%B3%B5%EC%9B%90+%ED%8C%9C%ED%94%8C%EB%A0%9B&tqi=UYss%2FdprvN8ssAb%2FZgdssssssAd-301092#imgId=blog114445776%7C13%7C220808067807_873028109&vType=rollout (accessed on 22 June 2020).
- ASTM International. Atmospheric Analysis Standards. Available online: https://www.astm.org/Standards/atmospheric-analysis-standards.html (accessed on 29 May 2020).
- US EPA. Method 16—Semi-Continuous Determination of Sulfur Emissions from Stationary Sources. Available online: https://19january2017snapshot.epa.gov/sites/production/files/2016-06/documents/m-16.pdf (accessed on 29 May 2020).
- National Institute of Environmental Research. Standard Method for Odor Estimation and Analysis in Korea. Available online: https://qaqc.nier.go.kr/qaqcnew/standard/standardlist.do (accessed on 29 May 2020).
- Wu, C.; Liu, J.; Zhao, P.; Piringer, M.; Schauberger, G. Conversion of the chemical concentration of odorous mixtures into odour concentration and odour intensity: A comparison of methods. Atmos. Environ. 2016, 127, 283–292. [Google Scholar] [CrossRef]
- Han, J.S.; Park, S.J. A study of the correlation between the concentration and dilution factor of sulfur compounds, NH3, and TMA. Korean J. Odor Res. Eng. 2012, 11, 87–93. [Google Scholar] [CrossRef]
- Han, J.S.; Lim, Y.J.; Park, S.J. A study on the calculation methods of odor threshold values of the specified offensive odor substances. Korean J. Odor Res. Eng. 2012, 11, 24–33. [Google Scholar]
- Nagata, N. Measurement of Odor Threshold by Triangle Odor Bag Method. Available online: https://www.env.go.jp/en/air/odor/measure/02_3_2.pdf (accessed on 10 January 2019).
- Leonardos, G.; Kendall, D.; Barnard, N. Odor Threshold Determinations of 53 Odorant Chemicals. J. Air Pollut. Control Assoc. 1969, 19, 91–95. [Google Scholar] [CrossRef]
- Langford, S.V.; McEwan, J.M.; Askey, M.; Barnes, H.A.; Olerenshaw, J.G. Comprehensive instrumental odor analysis using SIFT-MS: A case study. Environments 2018, 5, 43. [Google Scholar] [CrossRef]
- Dentoni, L.; Capelli, L.; Sironi, S.; Rosso, R.D.; Zanetti, S.; Torre, M.D. Development of an electronic nose for environmental odour monitoring. Sensors 2012, 12, 14363–14381. [Google Scholar] [CrossRef]
- Brattoli, M.; Cisternino, E.; Dambruoso, P.R.; Gennaro, G.; Giungato, P.; Mazzone, A.; Palmisani, J.; Tutino, M. Gas chromatography analysis with olfactometric detection (GC-O) as a useful methodology for chemical characterization of odorous compounds. Sensors 2013, 13, 16759–16800. [Google Scholar] [CrossRef]
- Yan, L.; Liu, J.; Jiang, S.; Wu, C.; Gao, K. The regular interaction pattern among odorants of the same type and its application in odor intensity assessment. Sensors 2017, 17, 1624. [Google Scholar] [CrossRef]
- Xu, Y.; Zhao, X.; Chen, Y.; Zhao, W. Research on a mixed gas recognition and concentration detection algorithm based on a metal oxide semiconductor olfactory system sensor array. Sensors 2018, 18, 3264. [Google Scholar] [CrossRef]
- Wen, T.; Luo, D.; He, J.; Mei, K. The odor characterizations and reproductions in machine Olfactions: A review. Sensors 2018, 18, 2329. [Google Scholar] [CrossRef]
- Wen, W.C.; Chou, T.I.; Tang, K.T. A Gas mixture prediction model based on the dynamic response of a metal-oxide sensor. Micromachines 2019, 10, 598. [Google Scholar] [CrossRef] [PubMed]
- Damuchali, A.M.; Guo, H. Evaluation of a field olfactometer in odour concentration measurement. Biosyst. Eng. 2019, 187, 239–246. [Google Scholar] [CrossRef]
- Pérez, A.O.; Frenes, V.K.; Filbert, A.; Kneer, J.; Bierer, B.; Held, P.; Klein, P.; Wöllenstein, J.; Benyoucef, D.; Kallfaß, S.; et al. Odor-sensing system to support social participation of people suffering from incontinence. Sensors 2017, 17, 58. [Google Scholar] [CrossRef] [PubMed]
- Cipriano, D.; Capell, L. Evolution of electronic noses from research objects to engineered environmental odour monitoring systems: A review of standardization approaches. Biosensors 2019, 9, 75. [Google Scholar] [CrossRef] [PubMed]
- Han, J.S.; Park, S.J. A study of the correlation between the odor intensity and dilution factor of NH3, TMA and styrene. Korean J. Odor Res. Eng. 2010, 9, 196–202. [Google Scholar]
- Japan Association on Odor Environment. Chapter 3 Correlation Equation between Odor Intensity and Odor Compounds Concentration—Handbook of Odor Prevention Law, 6th ed.; Gyosei Digital Press: Tokyo, Japan, 2012; Volume 2. [Google Scholar]


| Model | GC-17A(Shimadzu, Kyoto, Japan) |
|---|---|
| Detector | Flame Photometric Detector |
| Oven/Injection/Detector Temp. | 80 °C /150 °C /150 °C |
| Column | Packed Column (2.6 mm (I.D) × 3 m) |
| Column Material | β,β′-oxidropionitriebo 60~80 mesh chromosorb w |
| Carrier Gas Flow Rate | 50 mL/min |
| H2 Gas Pressure | 60 kpa |
| Carrier Gas | N2 |
| Standard Gas | H2S 47.8 ppmv, CH3SH 45.7 ppmv, (CH3)2S 44.4 ppmv, (CH3)2S2 47.6 ppmv (Kotte & Zeller Co., Cypress CA, USA) |
| Model | GCMS-QP5050A(Shimadzu, Kyoto, Japan) |
|---|---|
| Aerotrap Desorber Techmar Dohrmann 6000 | |
| Adsorbent Tube Tekmar Tube #14-1677-203 Cabosieve S-III + Tenax TA | |
| Oven/Injection/Interface Temp. | 35 °C/100 °C/270 °C |
| Column | Capillary column (60 m × 0.32 mm (I.D) × 0.25 µm (df)) |
| Pressure | 30 kpa |
| Temp. program | 35 °C (4 min) → 5 °C/min → 85 °C (2 min) → 7 °C/min → 250 °C (10 min) |
| Mass range | 34~300 |
| Scan interval | 0.5 s |
| Detector volts | 1.5 kV |
| Carrier gas | He |
| Degrees | Intensity | Properties |
|---|---|---|
| 0 | None | People cannot feel an odorous smell with a normal sense of smell |
| 1 | Threshold | People smell something but cannot recognize the type of smell |
| 2 | Moderate | People smell something and can recognize the type of smell |
| 3 | Strong | People easily smell something strongly like a cresol smell in hospitals |
| 4 | Very Strong | People strongly smell something like a conventional rest room |
| 5 | Over Strong | People strongly smell something and gag or hold their breath |
| Compound (Unit: ppb) | Korea [21] | Japan [22] | USA [23] |
|---|---|---|---|
| Hydrogen sulfide (H2S) | 0.4 | 0.41 | 0.47 |
| Methyl mercaptan (MM) | 0.3 | 0.07 | 2.1 |
| Dimethyl sulfide (DMS) | 3.1 | 3 | 1 |
| Dimethyl disulfide (DMDS) | 2.2 | 2.2 | 1 |
| Ammonia (NH3) | 2890 | 1500 | 46,800 |
| Trimethylamine (TMA) | 0.2 | 0.032 | 0.21 |
| Acetaldehyde | 2.6 | 1.5 | 210 |
| Benzene | 2700 | 4680 | |
| Ethyl-benzene | 170 | ||
| Toluene | 1221 | 330 | 2140 |
| m,p-Xylene | 62.8 | 49.5 | 470 |
| o-Xylene | 380 | ||
| Styrene | 70 | 35 | 47 |
| Site | H2S | MM | DMS | DMDS | NH3 | TMA | Acetaldehyde | Benzene | Ethyl-Benzene | Toluene | m,p-Xylene | o-Xylene | Styrene | |
|---|---|---|---|---|---|---|---|---|---|---|---|---|---|---|
| 1 | Dong-A Media Center | 858 | 69 | 48 | N.D. | N.D. | 43 | 34 | 0.53 | 82 | 54 | 4.2 | N.D. | 31 |
| 2 | Gwang Bridge | 256 | 35 | 25 | N.D. | 242 | 7.9 | 25 | 0.29 | 20 | 58 | 1.8 | 1.8 | 2.9 |
| 3 | Jangtong Bridge | 175 | 17 | 13 | N.D. | 356 | N.D | 17 | N.D. | 76 | 45 | 5.2 | 22 | N.D. |
| 4 | Sewoon Shopping Street | 42 | 10 | 12 | 8.1 | 274 | N.D | 12 | 0.9 | 444 | 179 | 109 | 107 | N.D. |
| 5 | Samgak-dong | 454 | 51 | 26 | N.D. | 310 | N.D | 36 | 0.29 | 116 | 61 | 15 | 62 | N.D. |
| 6 | Hanwha Building | 2.4 | N.D. | N.D. | N.D. | N.D. | N.D | 6.3 | 8.5 | 14 | 20 | 1.8 | 6 | N.D. |
| 7 | Changsin-dong | 90 | 24 | 24 | 2.7 | tr | N.D. | N.D. | N.D. | 16 | 25 | 15 | 8.6 | 0.23 |
| 8 | Jongro 6ga | 378 | 27 | 24 | N.D. | 448 | 87 | N.D. | N.D. | 9.3 | 21 | 15 | 13 | N.D. |
| 9 | Bangsan-dong | 238 | 166 | 34 | N.D. | 60 | 70 | 13 | N.D. | 25 | 339 | 58 | 57 | N.D. |
| 10 | Sindang-dong | 358 | N.D. | N.D. | N.D. | tr | 98 | N.D. | N.D. | 2.1 | 22 | 3.8 | 3.2 | 0.53 |
| 11 | Dongdaemun History&Culture Park | 668 | 554 | 167 | N.D. | tr | 163 | N.D. | 1.0 | 32 | 605 | 21 | 16 | N.D. |
| 12 | Outlet#1 | 100 | 56 | 55 | N.D. | tr | N.D. | N.D. | N.D. | 5.9 | 25 | 9.4 | 11 | 0.28 |
| 13 | Outlet#2 | 589 | 86 | 83 | N.D. | tr | 70 | N.D. | 1.1 | 1.2 | 38 | 1.8 | 1.5 | 0.38 |
| 14 | Outlet#3 | 336 | 332 | 332 | N.D. | tr | 70 | N.D. | 0.5 | 3.5 | 20 | 6.4 | 6.6 | 0.56 |
| Average | 325 | 102 | 60 | 0.8 | 121 | 44 | 10 | 0.9 | 60 | 108 | 19 | 23 | 2.6 | |
| Minimum | 2.4 | 10 | 12 | 2.7 | 60 | 7.9 | 6.3 | 0.29 | 1.2 | 20 | 1.8 | 1.5 | 0.23 | |
| Maximum | 858 | 554 | 332 | 8.1 | 448 | 163 | 36 | 8.5 | 444 | 605 | 109 | 107 | 31 | |
| Standard Deviation | 242 | 157 | 89 | 2.7 | 119 | 42 | 11 | 2.6 | 112 | 162 | 29 | 31 | 11 | |
| Coefficient of Variation | 0.74 | 1.5 | 1.5 | 3.5 | 0.98 | 0.96 | 1.0 | 2.8 | 1.9 | 1.5 | 1.5 | 1.3 | 4.1 | |
| Site | Observed On-Site Odor Intensity by 5 Panelists | ||||||
|---|---|---|---|---|---|---|---|
| A | B | C | D | E | Average | ||
| 1 | Dong-A Media Center | 3 | 4 | 4 | 3 | 4 | 3.6 |
| 2 | Gwang Bridge | 3 | 3 | 3 | 4 | 3 | 3.2 |
| 3 | Jangtong Bridge | 2 | 2 | 2 | 2 | 2 | 2.0 |
| 4 | Sewoon Shopping Street | 3 | 2 | 2 | 2 | 3 | 2.4 |
| 5 | Samgak-dong | 3 | 3 | 3 | 3 | 3 | 3.0 |
| 6 | Hanwha Building | 0 | 0 | 0 | 1 | 1 | 0.4 |
| 7 | Changsin-dong | 3 | 4 | 3 | 3 | 3 | 3.2 |
| 8 | Jongro 6ga | 3 | 2 | 3 | 2 | 3 | 2.6 |
| 9 | Bangsan-dong | 4 | 3 | 4 | 4 | 4 | 3.8 |
| 10 | Sindang-dong | 4 | 3 | 3 | 2 | 3 | 3.0 |
| 11 | Dongdaemun History&Culture Park | 4 | 4 | 4 | 4 | 4 | 4.0 |
| 12 | Outlet#1 | 3 | 3 | 2 | 3 | 3 | 2.8 |
| 13 | Outlet#2 | 3 | 3 | 2 | 2 | 3 | 2.6 |
| 14 | Outlet#3 | 3 | 3 | 3 | 2 | 3 | 2.8 |
| Average | 2.8 | ||||||
| Minimum | 0.4 | ||||||
| Maximum | 4.0 | ||||||
| Standard Deviation | 0.85 | ||||||
| Coefficient of Variation | 0.30 | ||||||
| Sites T.L.V.(Unit: ppb) | H2S | MM | DMS | DMDS | NH3 | TMA | Acetaldehyde | Benzene | Ethyl-Benzene | Toluene | m,p-Xylene | o-Xylene | Styrene | COC | |
|---|---|---|---|---|---|---|---|---|---|---|---|---|---|---|---|
| 0.4 | 0.3 | 3.1 | 2.2 | 2890 | 0.2 | 2.6 | 2700 | 170 | 1221 | 62.8 | 380 | 70 | Sum | ||
| 1 | Dong-A Media Center | 2144 | 231 | 15 | 214 | 13 | 0.0002 | 0.48 | 0.044 | 0.066 | 0.44 | 2619 | |||
| 2 | Gwang Bridge | 641 | 117 | 8.1 | 0.1 | 40 | 9.8 | 0.0001 | 0.11 | 0.047 | 0.029 | 0.0046 | 0.042 | 815 | |
| 3 | Jangtong Bridge | 437 | 58 | 4.0 | 0.1 | 6.5 | 0.44 | 0.037 | 0.083 | 0.059 | 507 | ||||
| 4 | Sewoon Shopping Street | 104 | 34 | 3.8 | 3.7 | 0.1 | 4.6 | 0.0003 | 2.6 | 0.15 | 1.7 | 0.28 | 154 | ||
| 5 | Samgak-dong | 1136 | 171 | 8.3 | 0.1 | 14 | 0.0001 | 0.68 | 0.050 | 0.23 | 0.16 | 1330 | |||
| 6 | Hanwha Building | 5.9 | 2.4 | 0.0031 | 0.080 | 0.017 | 0.028 | 0.016 | 8.5 | ||||||
| 7 | Changsin-dong | 225 | 80 | 7.7 | 1.2 | 0.068 | 0.021 | 0.24 | 0.023 | 0.0032 | 314 | ||||
| 8 | Jongro 6ga | 945 | 90 | 7.8 | 0.2 | 438 | 0.055 | 0.017 | 0.25 | 0.034 | 1481 | ||||
| 9 | Bangsan-dong | 595 | 555 | 11 | 0.0 | 350 | 5.2 | 0.15 | 0.28 | 0.93 | 0.15 | 1517 | |||
| 10 | Sindang-dong | 895 | 490 | 0.012 | 0.018 | 0.060 | 0.0085 | 0.0076 | 1385 | ||||||
| 11 | Dongdaemun History & Culture Park | 1671 | 1847 | 54 | 817 | 0.0004 | 0.19 | 0.50 | 0.34 | 0.043 | 4389 | ||||
| 12 | Outlet#1 | 249 | 186 | 18 | 0.035 | 0.021 | 0.15 | 0.028 | 0.0040 | 453 | |||||
| 13 | Outlet#2 | 1474 | 287 | 27 | 350 | 0.0004 | 0.0071 | 0.031 | 0.029 | 0.0039 | 0.0054 | 2138 | |||
| 14 | Outlet#3 | 840 | 1106 | 107 | 350 | 0.0002 | 0.021 | 0.016 | 0.10 | 0.017 | 0.0080 | 2404 | |||
| COC sum | 11,361 | 4761 | 272 | 4.9 | 0.6 | 3047 | 55.7 | 0.0 | 4.9 | 1.2 | 4.3 | 0.8 | 0.5 | 19,513 | |
| (percentage) | 58% | 24% | 1% | 0.025% | 0.003% | 16% | 0.285% | 0.00002% | 0.025% | 0.006% | 0.022% | 0.004% | 0.003% | 100% | |
| Site | H2S | Log(H2S) | OOI | |
|---|---|---|---|---|
| 1 | Dong-A Media Center | 858 | 2.93 | 3.6 |
| 2 | Gwang Bridge | 256 | 2.41 | 3.2 |
| 3 | Jangtong Bridge | 175 | 2.24 | 2.0 |
| 4 | Sewoon Shopping Street | 42 | 1.62 | 2.4 |
| 5 | Samgak-dong | 454 | 2.66 | 3.0 |
| 6 | Hanwha Building | 2.4 | 0.37 | 0.4 |
| 7 | Changsin-dong | 90 | 1.95 | 3.2 |
| 8 | Jongro 6ga | 378 | 2.58 | 2.6 |
| 9 | Bangsan-dong | 238 | 2.38 | 3.8 |
| 10 | Sindang-dong | 358 | 2.55 | 3.0 |
| 11 | Dongdaemun History & Culture Park | 668 | 2.83 | 4.0 |
| 12 | Outlet#1 | 100 | 2.00 | 2.8 |
| 13 | Outlet#2 | 589 | 2.77 | 2.6 |
| 14 | Outlet#3 | 336 | 2.53 | 2.8 |
| Average | 325 | 2.3 | 2.8 | |
| Standard Deviation | 242 | 0.6 | 0.9 | |
| Coefficient of Variation | 0.74 | 0.28 | 0.30 | |
| Correlation Equation | Y = 1.0757 × log (X) + 0.3696 where, Y: Calculated odor intensity, degree X: H2S conc., ppb | |||
| Correlation Equation | Sample | ||
|---|---|---|---|
| This study | COI = 1.0757 × log (H2S Conc. of ppb) + 0.3696 | Combined sewer odor | |
| Reference | Equation of Korea [20] | COI = 0.8815 × log (H2S Conc. of ppm) + 4.0688 | H2S Standard gas |
| Equation of Japan [34] | COI = 0.95 × log(H2S Conc. of ppm) + 4.14 | H2S Standard gas | |
| Site | OOI | COI This Study | COI Korea | COI Japan | |
|---|---|---|---|---|---|
| 1 | Dong-A Media Center | 3.60 | 3.53 | 4.01 | 4.08 |
| 2 | Gwang Bridge | 3.20 | 2.96 | 3.55 | 3.58 |
| 3 | Jangtong Bridge | 2.00 | 2.78 | 3.40 | 3.42 |
| 4 | Sewoon Shopping Street | 2.40 | 2.11 | 2.85 | 2.83 |
| 5 | Samgak-dong | 3.00 | 3.23 | 3.77 | 3.81 |
| 6 | Hanwha Building | 0.40 | 0.77 | 1.75 | 1.65 |
| 7 | Changsin-dong | 3.20 | 2.47 | 3.15 | 3.15 |
| 8 | Jongro 6ga | 2.60 | 3.14 | 3.70 | 3.74 |
| 9 | Bangsan-dong | 3.80 | 2.93 | 3.52 | 3.55 |
| 10 | Sindang-dong | 3.00 | 3.12 | 3.68 | 3.72 |
| 11 | Dongdaemun History & Culture Park | 4.00 | 3.41 | 3.91 | 3.97 |
| 12 | Outlet#1 | 2.80 | 2.52 | 3.19 | 3.19 |
| 13 | Outlet#2 | 2.60 | 3.35 | 3.87 | 3.92 |
| 14 | Outlet#3 | 2.80 | 3.09 | 3.65 | 3.69 |
| Average | 2.8 | 2.8 | 3.4 | 3.4 | |
| Standard Deviation | 0.9 | 0.7 | 0.6 | 0.6 | |
| Coefficient of Variation | 0.30 | 0.24 | 0.16 | 0.17 | |
© 2020 by the author. Licensee MDPI, Basel, Switzerland. This article is an open access article distributed under the terms and conditions of the Creative Commons Attribution (CC BY) license (http://creativecommons.org/licenses/by/4.0/).
Share and Cite
Park, S. Odor Characteristics and Concentration of Malodorous Chemical Compounds Emitted from a Combined Sewer System in Korea. Atmosphere 2020, 11, 667. https://doi.org/10.3390/atmos11060667
Park S. Odor Characteristics and Concentration of Malodorous Chemical Compounds Emitted from a Combined Sewer System in Korea. Atmosphere. 2020; 11(6):667. https://doi.org/10.3390/atmos11060667
Chicago/Turabian StylePark, Sangjin. 2020. "Odor Characteristics and Concentration of Malodorous Chemical Compounds Emitted from a Combined Sewer System in Korea" Atmosphere 11, no. 6: 667. https://doi.org/10.3390/atmos11060667
APA StylePark, S. (2020). Odor Characteristics and Concentration of Malodorous Chemical Compounds Emitted from a Combined Sewer System in Korea. Atmosphere, 11(6), 667. https://doi.org/10.3390/atmos11060667