Article

Improvement of the Numerical Tropical Cyclone Prediction System at the Central Weather Bureau of Taiwan: TWRF (Typhoon WRF)

Central Weather Bureau, No. 64, Gongyuan Road, Taipei 100006, Taiwan
*
Author to whom correspondence should be addressed.
Atmosphere 2020, 11(6), 657; https://doi.org/10.3390/atmos11060657
Submission received: 1 June 2020 / Revised: 15 June 2020 / Accepted: 16 June 2020 / Published: 19 June 2020
(This article belongs to the Special Issue Modeling and Data Assimilation for Tropical Cyclone Forecasts)

Abstract

:
Typhoon WRF (TWRF) based on the Advanced Research Weather Research and Forecasting Model (ARW WRF) was operational at the Central Weather Bureau (CWB) for tropical cyclone (TC) predictions since 2010 (named TWRF V1). CWB has committed to improve this regional model, aiming to increase the model predictability toward typhoons over East Asia. In 2016, an upgraded version designed to replace TWRF V1 became operational (named TWRF V2). Compared with V1, which has triple-nested meshes with coarser resolution (45/15/5 km), V2 increased the model resolution to 15/3 km. Since V1 and V2 were maintained in parallel from 2016 to 2018, this study utilized the real-time forecasts to investigate the impact of model resolution on TC prediction. Statistical measures pointed out the superiority of the high-resolution model on TC prediction. The forecast performance was also found competitive with that of two leading global models. The case study further pointed out, with the higher resolution, the model not only advanced the prediction on the TC track and inner core structure but also improved the representativeness of the complex terrain. Overall, the high-resolution model can better handle the so-called terrain phase-lock effect and, therefore, improve the TC quantitative precipitation forecast over the complex Taiwanese terrain.

1. Introduction

Taiwan, located at the western Pacific Ocean, has an average three to four tropical cyclones (TC) or typhoons every year, posting significant threats to the civilian lives and properties [1]. To reduce the severe damage, issuing accurate and timely TC predictions is a crucial task for weather bureaus, and the Central Weather Bureau (CWB) of Taiwan is no exception. From 1970 to 2019, tropical cyclone track prediction was improved substantially (available online at https://www.nhc.noaa.gov/verification/verify5.shtml). However, the prediction of TC structure change and its intensity progressed much less [2,3]. Results showed that the reduction of track forecast errors was an order greater than the intensity forecast. This disparity can arise from the scarce in situ observations near the TC inner core, insufficient model resolution, complex multi-scale processes, and atmosphere–ocean interactions. Therefore, there is potential to improve TC intensity prediction by considering the issues mentioned above.
CWB’s operational regional numerical weather prediction (NWP) system was constructed based on the ARW WRF model [4] in November 2007. Apart from the deterministic operational forecast, TWRF (Typhoon WRF) system, which specifically targeted at TC prediction over East Asia was operational at CWB since 2010 and was run operationally four times a day (initialized at 0000/0600/1200/1800 UTC). Based on the operational deterministic forecast system, TWRF additionally employed TC initialization scheme, including the relocation and synthetic vortex bogus [5].
The impact of the initial condition on TC forecast in TWRF was also investigated [6]. Firstly, the development of the outer loop in WRF three-dimensional variational (3DVAR) data assimilation system utilized more observations with the iteration procedure. Secondly, applying the partial cycling strategy, which begins with a cold start from the analysis of Global Forecast System in National Centers for Environmental Prediction (NCEP GFS) at 12-h prior to the analysis time and follows by two data assimilation cycles at 6-h interval, provided a better initial condition by mitigating model spin-up time. Here, the cold start could effectively mitigate the model-accumulated errors, particularly errors over the observation-sparse West Pacific area. At the same time, two full cyclic assimilations can reduce the model spin-up issue.
To further ameliorate model accumulated error, the blending scheme formulated on an incremental spatial filtering scheme proposed by Yang (2005) [7] was implemented. In TWRF, the blending analysis is obtained by combining large-scale patterns (wavelength > 1200 km) of the NCEP global analysis and finer structure (wavelength < 1200 km) of the high-resolution TWRF every six hours. Hsiao et al. (2015) [8] demonstrated the benefits of adding a blending technique in TWRF; not only did it remove systematic errors resulting from cycles, but it also improved the TC track and rainfall prediction over Taiwan. Apart from the benefits mentioned above, the blending strategy could tackle errors from lateral boundary conditions [7,9,10,11].
The High-resolution NWP model reduces truncation errors, resolves better scale interactions, and has detailed physical parameterizations. Jin et al. (2014) [12] shows that the 3-km model better resolved the TC inner core structure, including spiral bands and secondary circulations, compared with the 9-km model. The prediction of TC evolution, such as the eyewall replacement process and the storm size, was also improved [13,14,15]. Furthermore, Done et al. (2004) and Schwartz et al. (2009) [16,17] show that convection-permitting models have higher quantitative precipitation forecast (QPF) skill than lower-resolution models with parameterized convection.
One objective of NOAA Hurricane Forecast Improvement Project (HFIP) is to investigate the potential gain of employing a high-resolution model. In particular, the Hurricane Weather Research and Forecasting (HWRF) system utilizes a larger domain with higher resolution around the inner core. The results showed that increasing horizontal resolution advanced the TC structure, track, and intensity prediction. In addition, coupling the atmospheric model with the ocean model in HWRF promotes the track and intensity prediction [18,19,20].
In this study, the impact of employed finer model grids on TWRF TC prediction, particularly focused on the TC track and intensity, was explored. With increasing computing resources at CWB, the real-time operational TWRF system migrated from 45/15/5 km (V1) to 15/3 km (V2) in 2016. Hence, all TC cases over the Western North Pacific Ocean in 2016–2018 are covered in the TWRF V1 and V2. The configuration of the TWRF system is given in Section 2. Section 3 provides results, including the general evaluation and two case studies. Summary and future plans are given in Section 4.

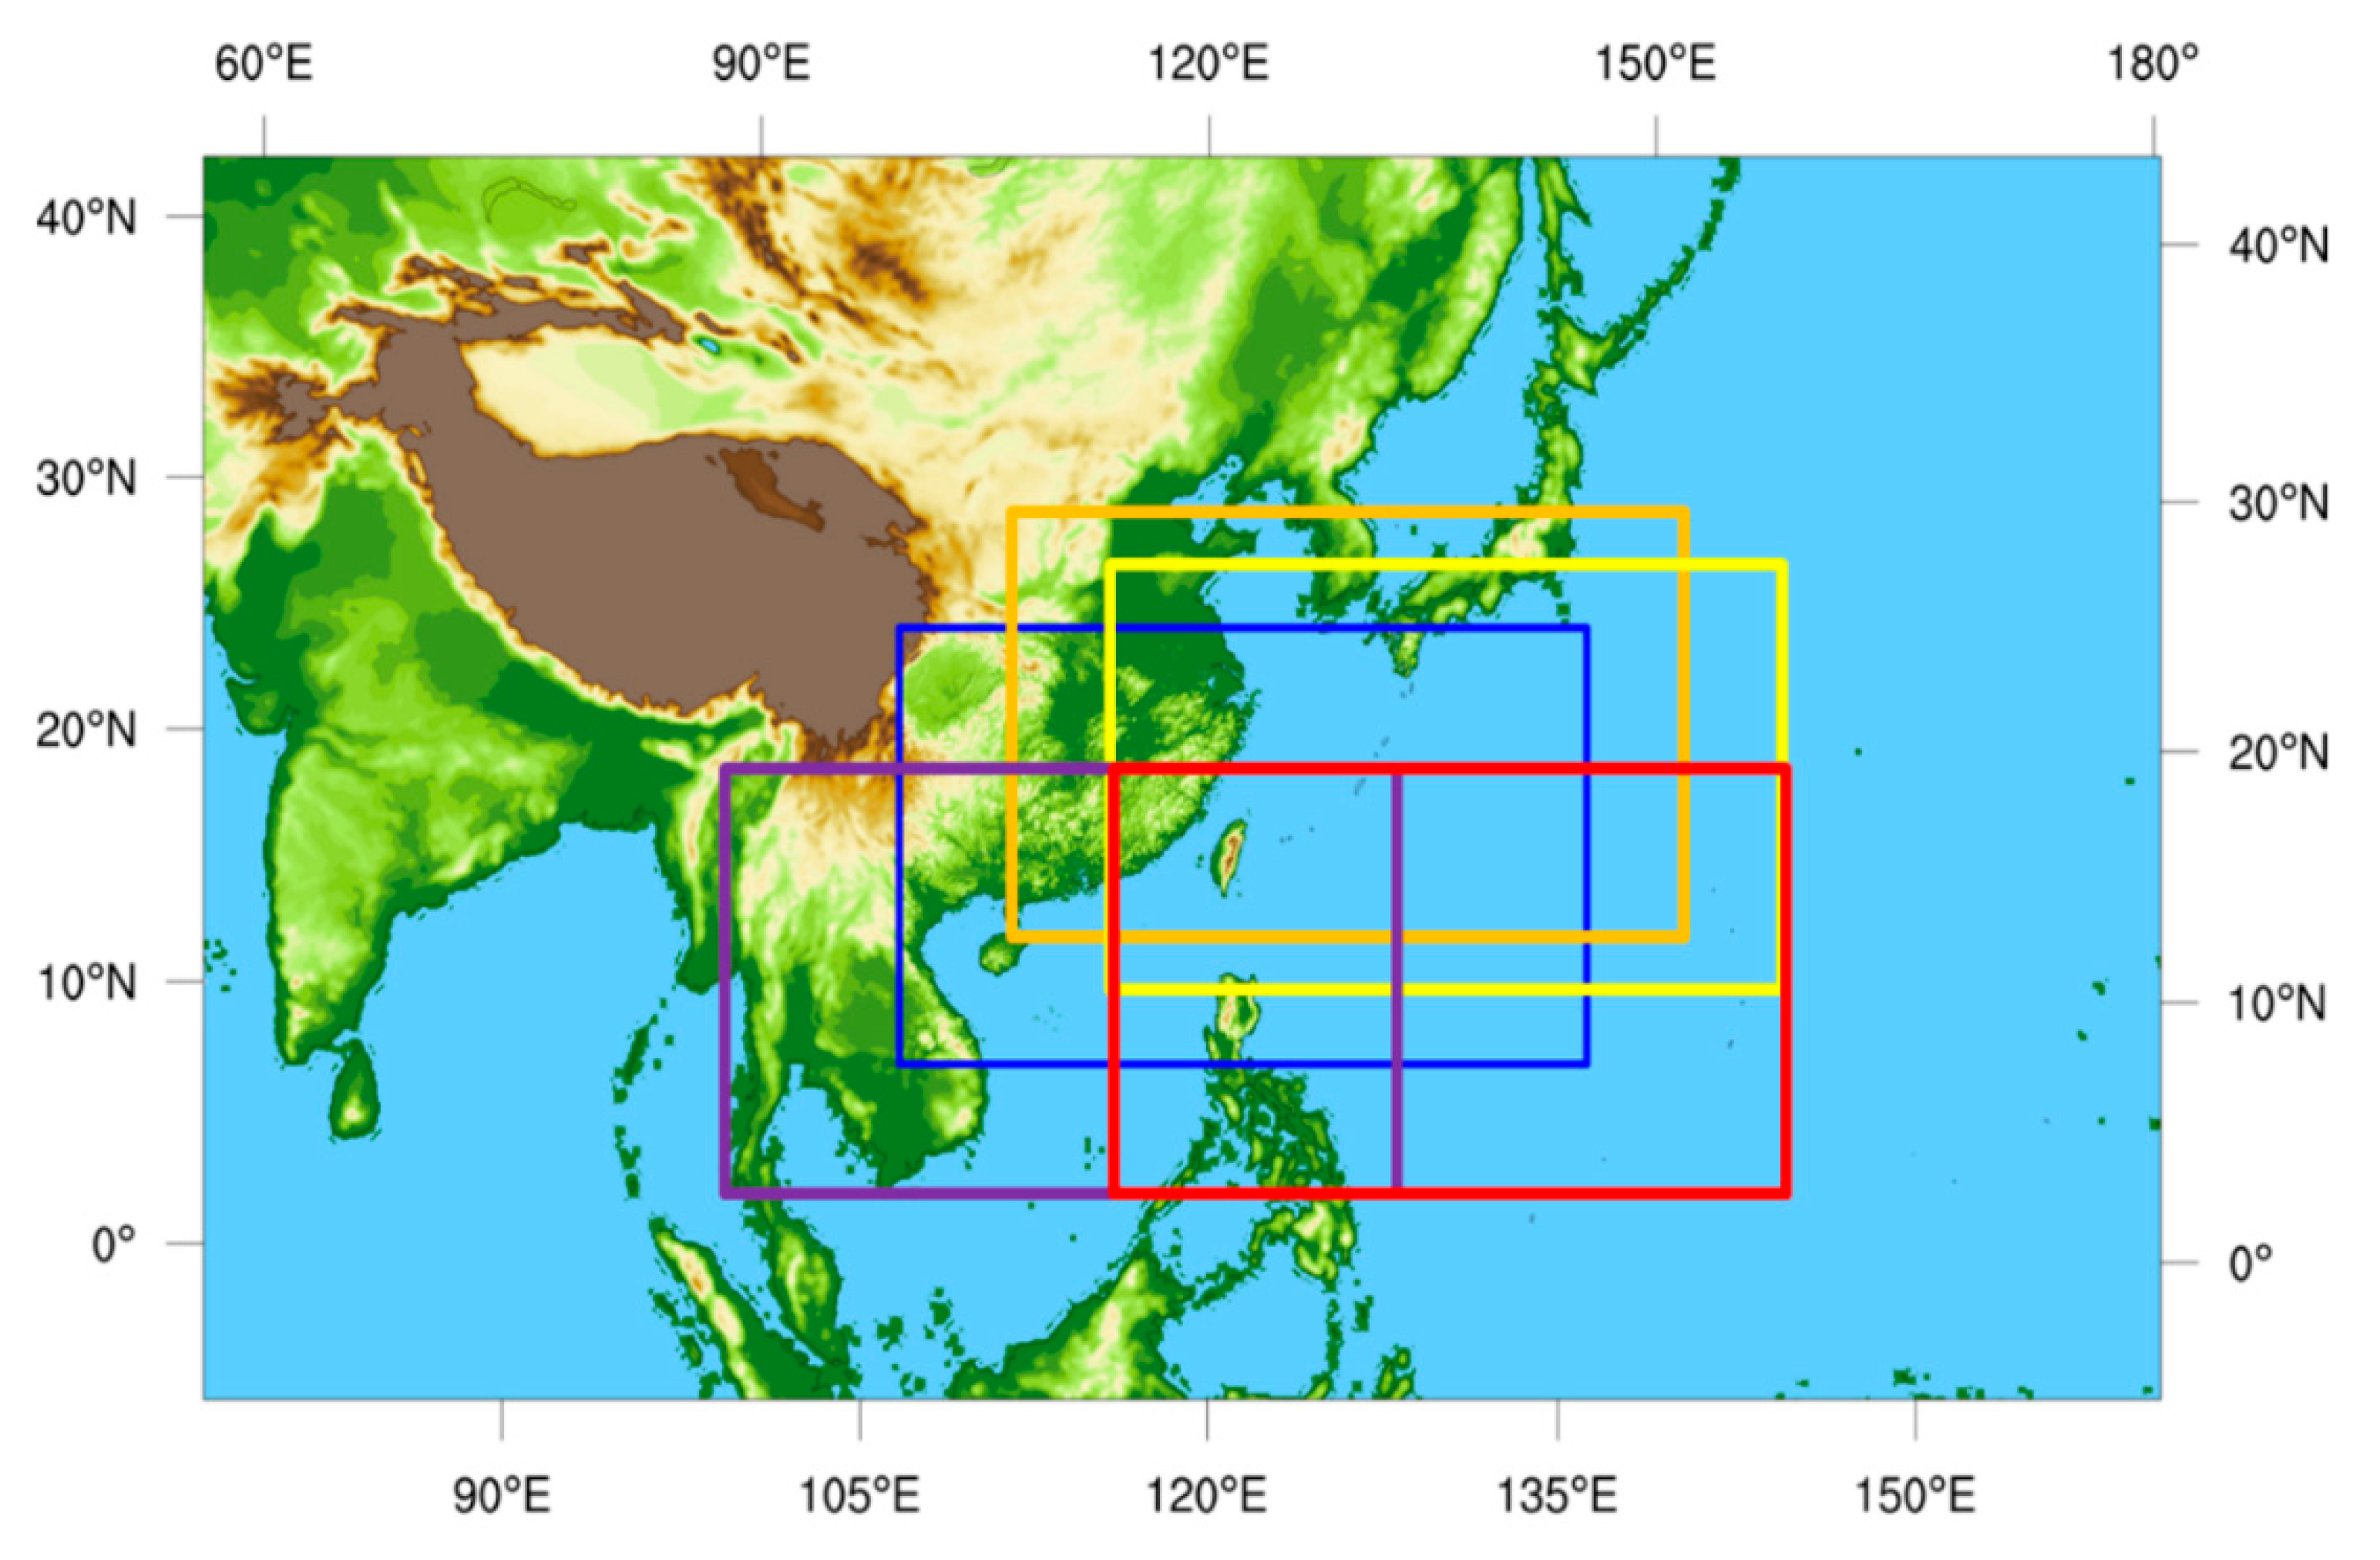
2. Configuration of the TWRF

CWB has been dedicated to constructing an operational NWP system based on the ARW WRF model [4] since 2007. As mentioned, TWRF specifically targeted at TC prediction and issued forecasts regularly in typhoon season at CWB since 2010. One major update is to increase model resolution in 2016. Therefore, the oldest TWRF system (referred to as V1) operated from 2010 to 2018, and the latest version (referred to as V2) came up in 2016. V1 and V2 both employed the same model physical schemes including Goddard microphysics scheme [21], the Kain-Fritsch cumulus parameterization scheme [22], the Yonsei University (YSU) planetary boundary layer scheme [23], the Noah land surface model [24], and the Rapid Radiative Transfer Model for Global Climate Models longwave and shortwave radiation schemes [25,26]. The initial condition for all the TWRF meshes was provided by the WRF 3DEnVAR which embedded in a partial cycling framework which consisted of a cold start from NCEP GFS analysis 12 h before the initial time and followed with two 6-h assimilation cycles.
The major revelations of the update from V1 to V2 is that it reduces the number of model domains could get the benefit of a higher horizontal and vertical model resolution. V1 has three nested meshes with a horizontal resolution of 45/15/5 km (refer to V1D1/V1D2/V1D3) with 45 vertical levels (Figure 1a). V2 decreased the domain numbers to two, but increased the horizontal resolution to 15/3 km (refer to V2D1/V2D2) and vertical resolution to 52 levels (Figure 1b). The designation of computing domains in V1 and V2 is described in Table 1. All nested domains employed one way nested function, which excludes the feedback from the finer to the coarser domain.
The mother domain of V1 and V2 has identical horizontal domain coverage, providing an opportunity to evaluate the effect of model resolution on the TC forecast from an operational point of view. Due to the increasing computing resource, the domain coverage of the finest mesh was expanded in V2. Hence, the 3-km mesh has horizontal domain coverage comparable to that of the 15-km mesh in V1. Benefits are expected from the larger 3-km domain owing to the more cloud-resolving process and avoiding the dilution from the lateral boundary condition. Moreover, it is expected that the model could resolve the topography with higher accuracy with finer horizontal resolution. This amelioration in topography is critical to represent the terrain phase-lock effect between the TC rainfall pattern and TC position [27,28,29]. As shown in Figure 1c,d, the 5-km mesh in V1 and 3-km mesh in V2 have maximum terrain height of 3015 and 3331 m over Taiwan Island, respectively.
In order to evaluate the benefits of model resolution robustly, a total of 82 TC cases in the western North Pacific Ocean from 2016 to 2018 were collected. In this study, the real-time operational track and intensity forecasts of TWRF V1 and V2 are compared. All these model forecasts and TC information could be found on the CWB website (available online at https://rdc28.cwb.gov.tw/TDB/).

3. Performance Comparison between TWRF V1 and V2

3.1. Comparison of Track and Intensity Predictions

In order to highlight the TWRF performance, the comparison among the track and intensity prediction from operational TWRF V1/V2, NCEP GFS, and European Centre for Medium-Range Weather Forecasts-Integrated Forecast System (ECMWF-IFS) were collected and verified against the CWB best-track dataset. The verification covered TC cases from 2016 to 2018, as mentioned in Section 2, and all the comparisons used homogeneous samples.
In this study, TWRF V1/V2 employed the same operational procedure, partial cycle strategy, data assimilation method, and model physic schemes, enabling a fair comparison between the two. First of all, with identical computing domain, 15-km V2D1 reduced track errors at all lead times compared with 45-km V1D1 (Figure 2a). The errors are 290 and 242 km at the 84-h lead time for V1 and V2, respectively, and up to a 16.6% averaged improvement is achieved with V2. In terms of the operational point of view, the benefits of migrating to a higher resolution model on the TC track prediction were proved robustly.
It is reasonable to speculate that the large scale environment has a dominant effect on track prediction. Therefore, using a larger high-resolution domain is helpful for improving the track forecast. However, costly computing resources are required to integrate the high-resolution model with a large domain size. Consequently, it is worthwhile to understand what benefit we can get from the nested mesh grid. Figure 2b shows, statistically, that the track errors for V1D1 and V1D2 are almost the same, though the individual case is different due to the one-way nested strategy. While the 3-km V2D2 is slightly better than the 15-km V2D1 after the 36-h forecast, only a slight track forecast improvement can be obtained from the nested domain, which may be due to the limited nested domain size. Note that the cases were collected within the inner domain so that the statistics could be homogeneously compared in Figure 2b. Therefore, the case numbers at each lead time in Figure 2b was only about a half compared with that in Figure 2a. Moreover, under the same 15-km resolution, 15-km V2D1 reduced track errors compared with 15-km V1D2 at all lead times. This improvement may be contributed from the domain size; however, V1D2 received boundary condition constantly from its 45-km mother domain, which contains larger synoptic scale forecast errors (shown in Section 3.2). This worse boundary condition may enlarge the difference of track errors between the two domains as the forecast hour increased.
In this study, TC intensity was represented by minimum sea-level pressure near the TC center. As shown in Figure 3, the higher model resolution substantially reduced the intensity errors up to 50% from 45-km V1D1 to 15-km V2D1 at an 84-h forecast with an identical computing domain (Figure 3a). Figure 3b shows that the intensity forecast was improved from 45-km V1D1 to 15-km V1D2, and 15-km V2D1 to 3-km V2D2, respectively. However, the results in 15-km V1D2 and 15-km V1D1 are comparable. Unlike the track forecast, the results show that we can get the benefit of the intensity forecast through all the lead times from the multi-resolution grids: the higher the resolution, the better the forecast performance. The results also demonstrate the significant advantage from the nested grid function to improve the TC intensity forecast and effectively reduce the computing resources. Moreover, the error characteristics are similar in the initial condition, proving the benefits of the high-resolution model integration under the partial cycle strategy.
Additionally, Figure 3b also shows that the evolution of forecast errors has a larger variant in 3-km V2D2. The finest 3-km V2D2 grid had forecast errors ranged from −4 to 4 hPa, and the coarsest 45-km V1D1 had it ranged from 16 to 19 hPa in contrast. It turned out that the 3-km V2D2 over-predicted the TC intensity after a 48-h forecast. It is reasonable to speculate that a higher horizontal resolution could resolve the TC inner core structure in more detail and tend to take further advantage of the TC intensity prediction.
In addition to the in-house comparison, we further evaluated the performance of TWRF V2 with a 9-km ECMWF and 13-km NCEP global model (Figure 4 and Figure 5). For V2D1, which has a coarser grid than both the NCEP and ECMWF models, the track errors were comparable to ECMWF up to a 36-h forecast and worse after. In contrast, TWRF V2D1 has similar track errors with NCEP GFS up to a 60-h forecast and then outperform the NCEP GFS after (Figure 4a). However, the intensity errors of V2D1 were larger than ECMWF and NCEP, which both have higher horizontal resolution and more accurate initial condition (Figure 4b). For V2D2, which has a finer grid than both NCEP and ECMWF model, the 72-h track prediction skill was comparable to ECMWF and better than NCEP, except for the first 12-h (Figure 5a). In addition, the intensity errors of V2D2 had the smallest bias compared with the other two (Figure 5b). Note that the cases from NCEP, ECMWF, and TWRF were collected within the V2D2 domain, so that the statistics could be homogeneously compared in Figure 5b. Due to the twice daily data sets from the ECMWF, the case numbers at each lead time in Figure 5b was only about a half compared with that in Figure 3b.
To conclude, results from TWRF V2 suggested that a higher-resolution NWP system increased the predictability toward TC in terms of both its track and intensity. For a multi-resolution nested grid, benefit from higher resolution can be obtained from the intensity forecast but limited in the track forecast. While it is true that global models are not aimed at predicting TC intensity changes, good representations of TC intensity and structure are still desirable as multi-scale interactions between TCs and their environment [30,31]. On top of that, the comparison with the leading global models also suggested that TWRF V2 has competitive forecast skill.

3.2. Comparison of Synoptic-Scale Forecast
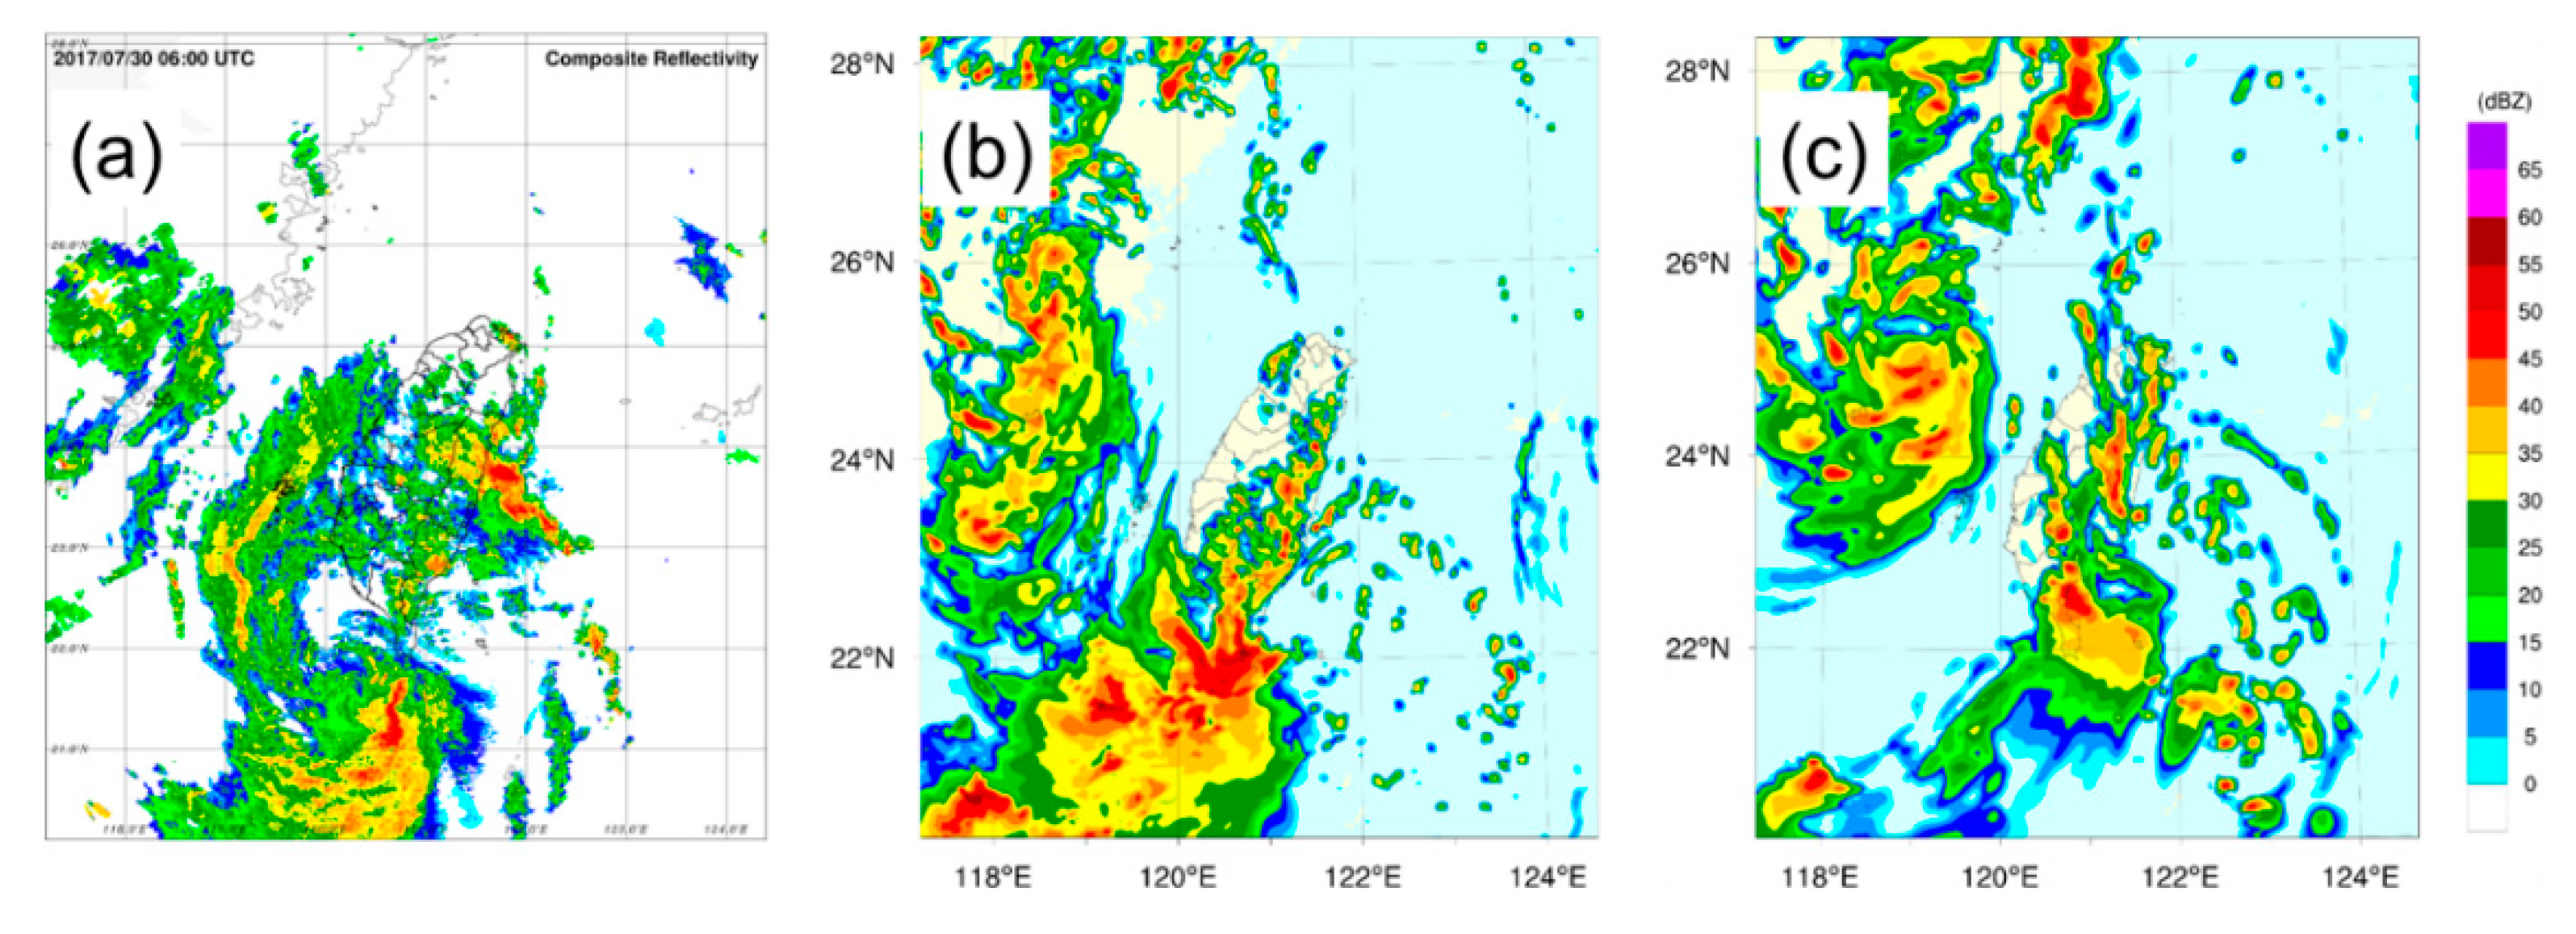
The concept of steering flow is extensively applied to account for TC motion [32,33] because of the dominant role of the environmental flow. Therefore, the synoptic-scale forecasts, including temperature, u-component wind, and relative humidity, were verified against the NCEP GFS analysis within the whole domain of V1D1/V2D1, and V1D2/V2D2 from 2016 to 2018. For both 24-h and 72-h forecasts, 15-km V2D1/3-km V2D2 had a smaller root mean square errors (RMSE) compared with 45-km V1D1/15-km V1D2 at all vertical levels (Figure 6 and Figure 7). However, the improvement is more modest in the D2 forecast, which may be due to the smaller domain coverage. Additionally, V2 had smaller analysis errors compared with V1, suggesting the benefit of employing partial cycle procedure (not shown). To conclude, V2 in general had higher synoptic forecast accuracy compared with V1, which is consistent with the improvement of the track prediction.

3.3. Case Studies

In this study, we selected two typhoon cases, Nesat and Haitang, which struck Taiwan Island in succession within 24 h. TC Nesat, with a maximum strength of 950 hPa, made landfall from the east coast of Taiwan at 1200 UTC on 29 July 2017 (Figure 8). Haitang, a weaker TC with a maximum strength of 990 hPa at 0000 UTC on 30 July, made landfall from southern Taiwan at 1200 UTC on 30 July 2017. Their combining rainfall over the Central Mountain Range and southern Taiwan resulted in economic loss over USD 2 million and caused more than 111 injuries.
To demonstrate the benefit of increasing model resolution, TC track prediction from 15-km V1D2 and 3-km V2D2 were compared (Figure 8). The model prediction was initialized at 0000 UTC on 29 July 2017. For typhoon Nesat, the impact of model resolution on the track prediction was relatively small since both models had a similar track with a landfall time 3 h earlier than the CWB best track. For typhoon Haitang, in contrast, using a high-resolution model improved both track and intensity forecast significantly. While the 15-km V1D2 failed to identify the TC after 0000 UTC 30 July since it predicted an intensity that was too weak, the 3-km V2D2 had TC structure and landfall point close to the best track. These results demonstrated the superiority of using high-resolution model for TC track prediction, particularly for weak TC.
To compare the structure of Nesat in 5-km V1D3 and 3-km V2D2, the 6-h forecast was further examined. Figure 9 shows the model-derived and observed column-maximum radar reflectivity, which was from Taiwan’s operational radar network that included four S-band and two C-band Doppler radars. The reflectivity from 3-km V2D2 exhibited a clear eyewall and spiral rain band, which matched the radar observations (Figure 9b). In contrast, the 5-km V1D3 had a disorganized eyewall and a rainfall structure that was too smooth compared with the observations (Figure 9c).
Moreover, Figure 10 displayed the azimuthally averaged of tangential and radial wind speeds, secondary circulation, temperature anomaly, and vertical velocity in the radius–height cross-section. It is not surprising that the 3-km V2D2 (Figure 10a) revealed stronger tangential wind near the surface compared with 5-km V1D3 due to its organized inner core structure (Figure 9b). In addition, it also had a stronger convergent inflow in the lower troposphere (below 3 km) and with a slightly weaker divergent outflow in the upper troposphere, leading to the secondary circulation, which had more organized updrafts. Furthermore, Figure 10c exhibited stronger vertical velocity in the eyewall region and warm core with a maximum of 7 °C at about 6 km. By contrast, the 5-km V3D3 had a disorganized and weaker inner core structure compared with 3-km V2D2, implying the critical role of model resolution on resolving TC structure.
On the other hand, the radar reflectivity for Haitang at 0600 UTC 30 July 2017 is shown in Figure 11a. Haitang had an asymmetric inner core structure due to its weaker intensity and destruction by the terrain. Compared with observations, the 3-km V2D2 predicted the rainfall system over the south and scattered storms over the east of Taiwan (Figure 11b). Still, the 5-km V1D3 had much scattered rain bands, which coincided with the weak TC intensity in the 15-km V1D2, as depicted in Figure 8. Overall, the detailed inner core structure was resolved in the 3-km V2D2 for both cases, again highlighting the crucial role of the high-resolution model on predicting TC structure.
As shown in Figure 12, the rainfall forecasts from TWRF V1 and V2 were compared with the observation from operational QPESUMS (Quantitative Precipitation Estimation and Segregation Using Multiple Sensors) [34]. In QPESUMS, a gridded, hourly rainfall estimation is updated every 10 min with a 1-km horizontal resolution. The rainfall is estimated using the empirical Z-R (reflectivity–rainfall) relation and corrected by rainfall measurements from Taiwan’s surface rain gauge network using a local bias correction method.
Consistent with radar observations (Figure 9), the 24-h accumulated rainfall on 28 July had two rainfall extremes associated with Nesat (Figure 12a). One in northeast Taiwan was owing to its TC inner core precipitation system during landfall, and the other over southern Taiwan was contributed by its associated outer rain band. This rainfall pattern is related to the terrain orientation in Taiwan (Figure 1) and TC position, known as the terrain phase-lock effect [27,29]. As shown in Figure 12b, 3-km V2D2 captured the position and magnitude of rainfall systems. In particular, for the rainfall extreme in the south, V2D2 had a 24-h accumulated rainfall that reached 629 mm, which was close to 606 mm in observation. Although V1 and V2 produced comparable track forecasts (Figure 8), the maximum rainfall in the 5-km V1D3 was only 360 mm. Results from 3-km V2D2 pointed out, with the higher resolution, that the model not only advanced the prediction on the TC track and inner core structure (Figure 9), but also improved the representativeness of the complex terrain (Figure 1). Combing all the above factors, the high-resolution model can better handle the so-called terrain phase-lock effect and therefore improve the TC quantitative precipitation forecast over the complex Taiwanese terrain.
On 29 July, Haitang produced rainfall amount up to 652 mm during its landfall period (Figure 12d). The 3-km V2D2 had accumulated rainfall between 200–300 mm (Figure 12e), which was less than observations, but still outperformed 5-km V1D3 (Figure 12f), which had an incorrect rainfall pattern since the TC in V1D3 had already dissipated before landfall (Figure 11c). As shown in Figure 12g–i, the two-day accumulated maximum rainfall was 1054, 898, 412 mm for observation, V2D2 and V1D3, respectively. Overall, the 3-km V2D2 outperformed the 5-km V1D3 in both cases, showing that a high-resolution model can effectively improve the model QPF skill over the complex Taiwan terrain.

4. Summary and Future Plan

Taiwan has active typhoon (tropical cyclone, TC) activities due to its geographic location in the western North Pacific (WNP); about three to four TC make landfall every year. To reduce the ensuing loss, issuing accurate and timely TC predictions is the most priority task for the weather service.
The Central Weather Bureau (CWB) of Taiwan has dedicated itself to constructing an operational NWP system based on the ARW WRF model since 2007. In 2010, A special development specifically designed for TC prediction, TWRF V1 (Typhoon WRF version 1) was first operational in CWB. During the past 10 years, several enhancements in operational TWRF has been proved to elevate the TC forecast accuracy. This success was brought by the implementation of typhoon relocation and the bogus scheme, the revision of the data assimilation technique, and the combination of the partial cycle strategy and blending technique [5,6,8]. In 2016, a succeeding model, version TWRF V2, which has a higher model resolution of 15/3 km compared with 45/15/5 km in TWRF V1, began operation.
In 2016–2018, V1 and V2 were real-time operationally maintained in parallel, in which both employed the same operational procedure, data assimilation method, and model physical schemes. Therefore, the two versions enable the opportunity to conduct a fair comparison, aiming to understand the impact of increasing model resolution on the TC prediction. In this study, a total of 82 TC cases were collected and compared using homogeneous samples. The major findings are summarized as follows.
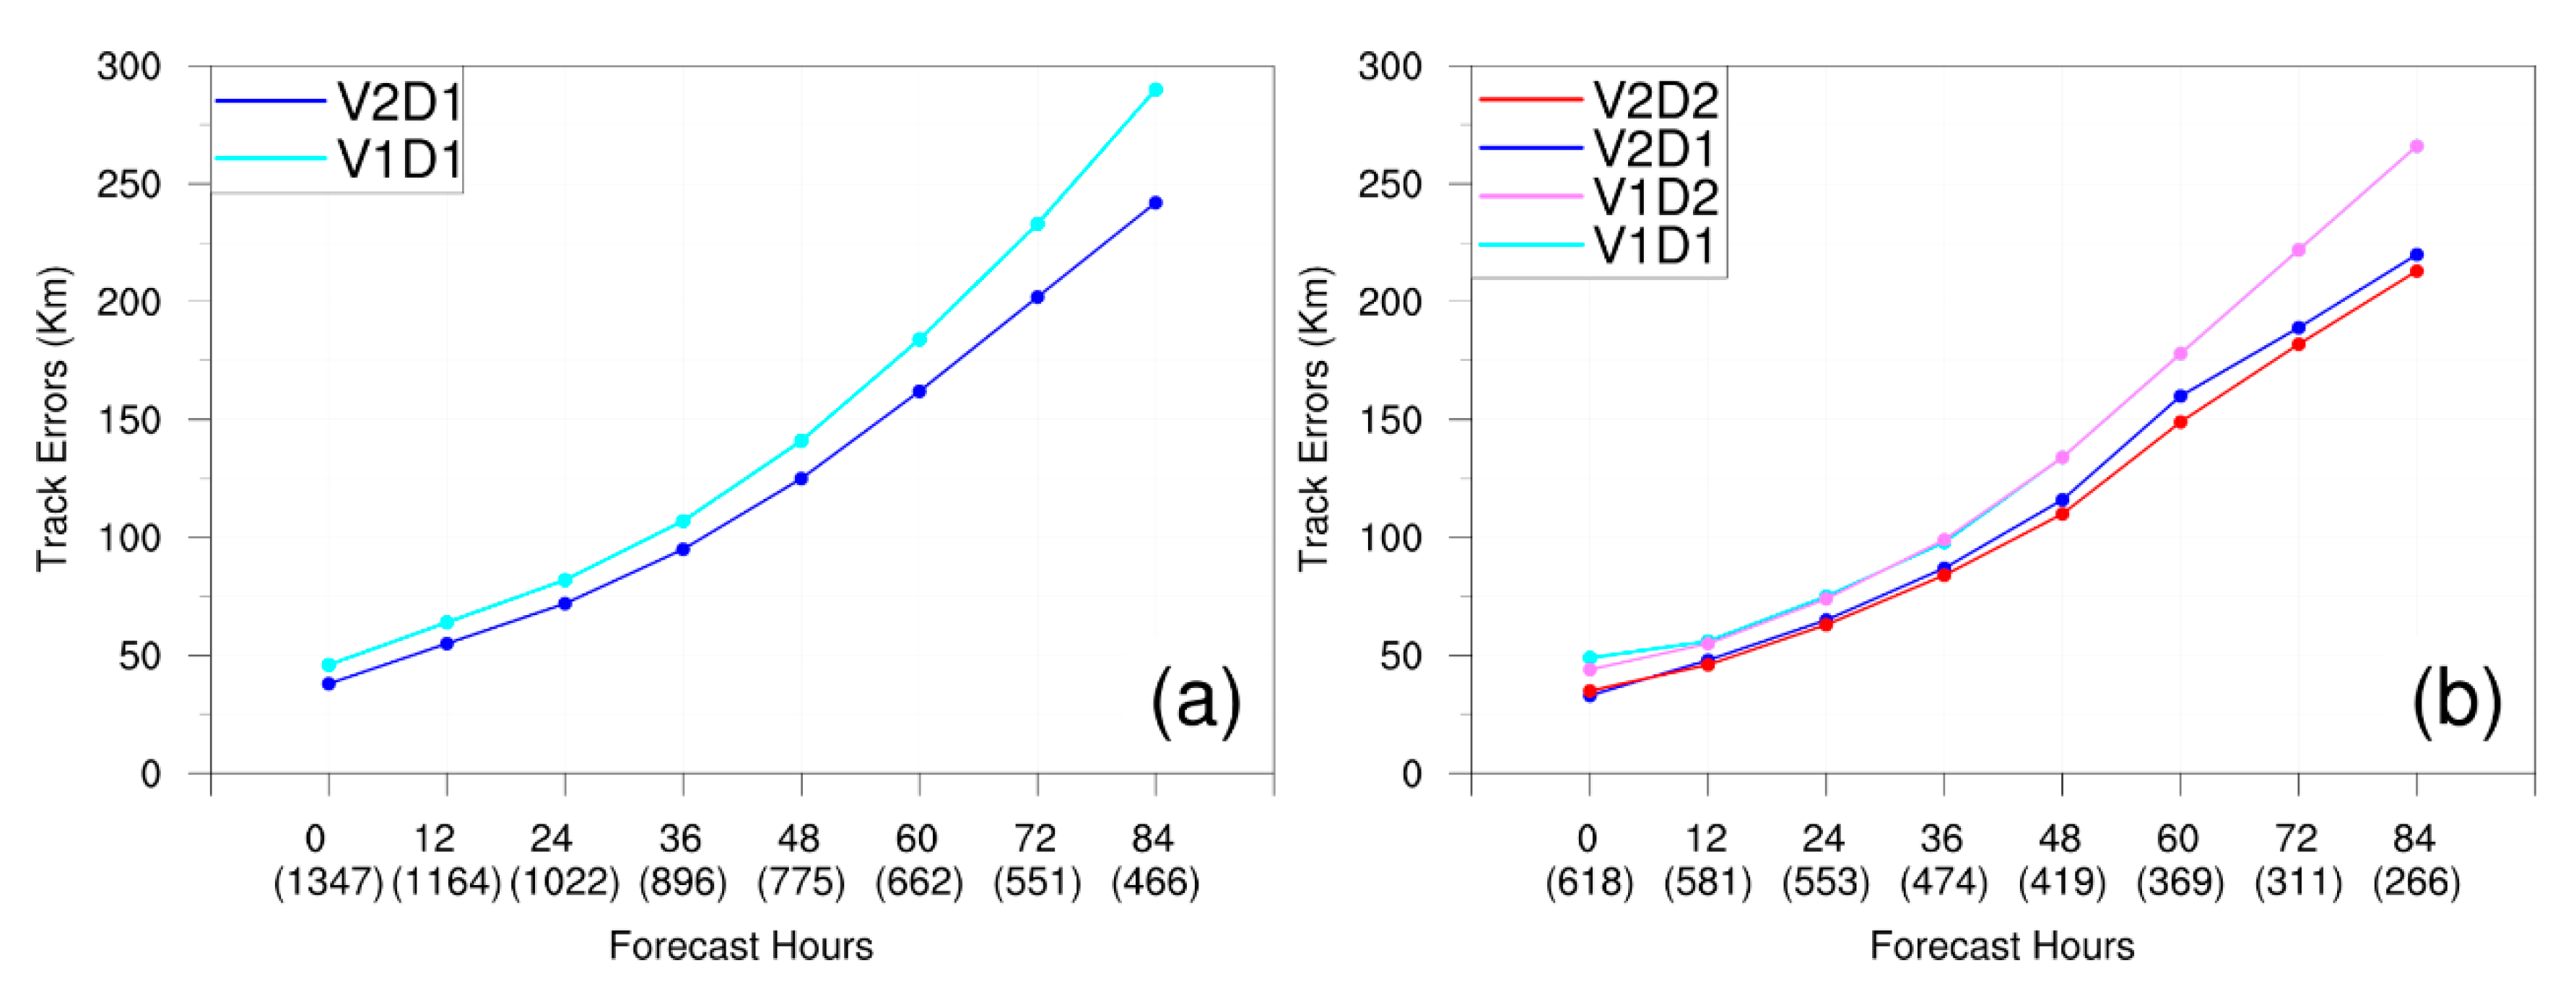
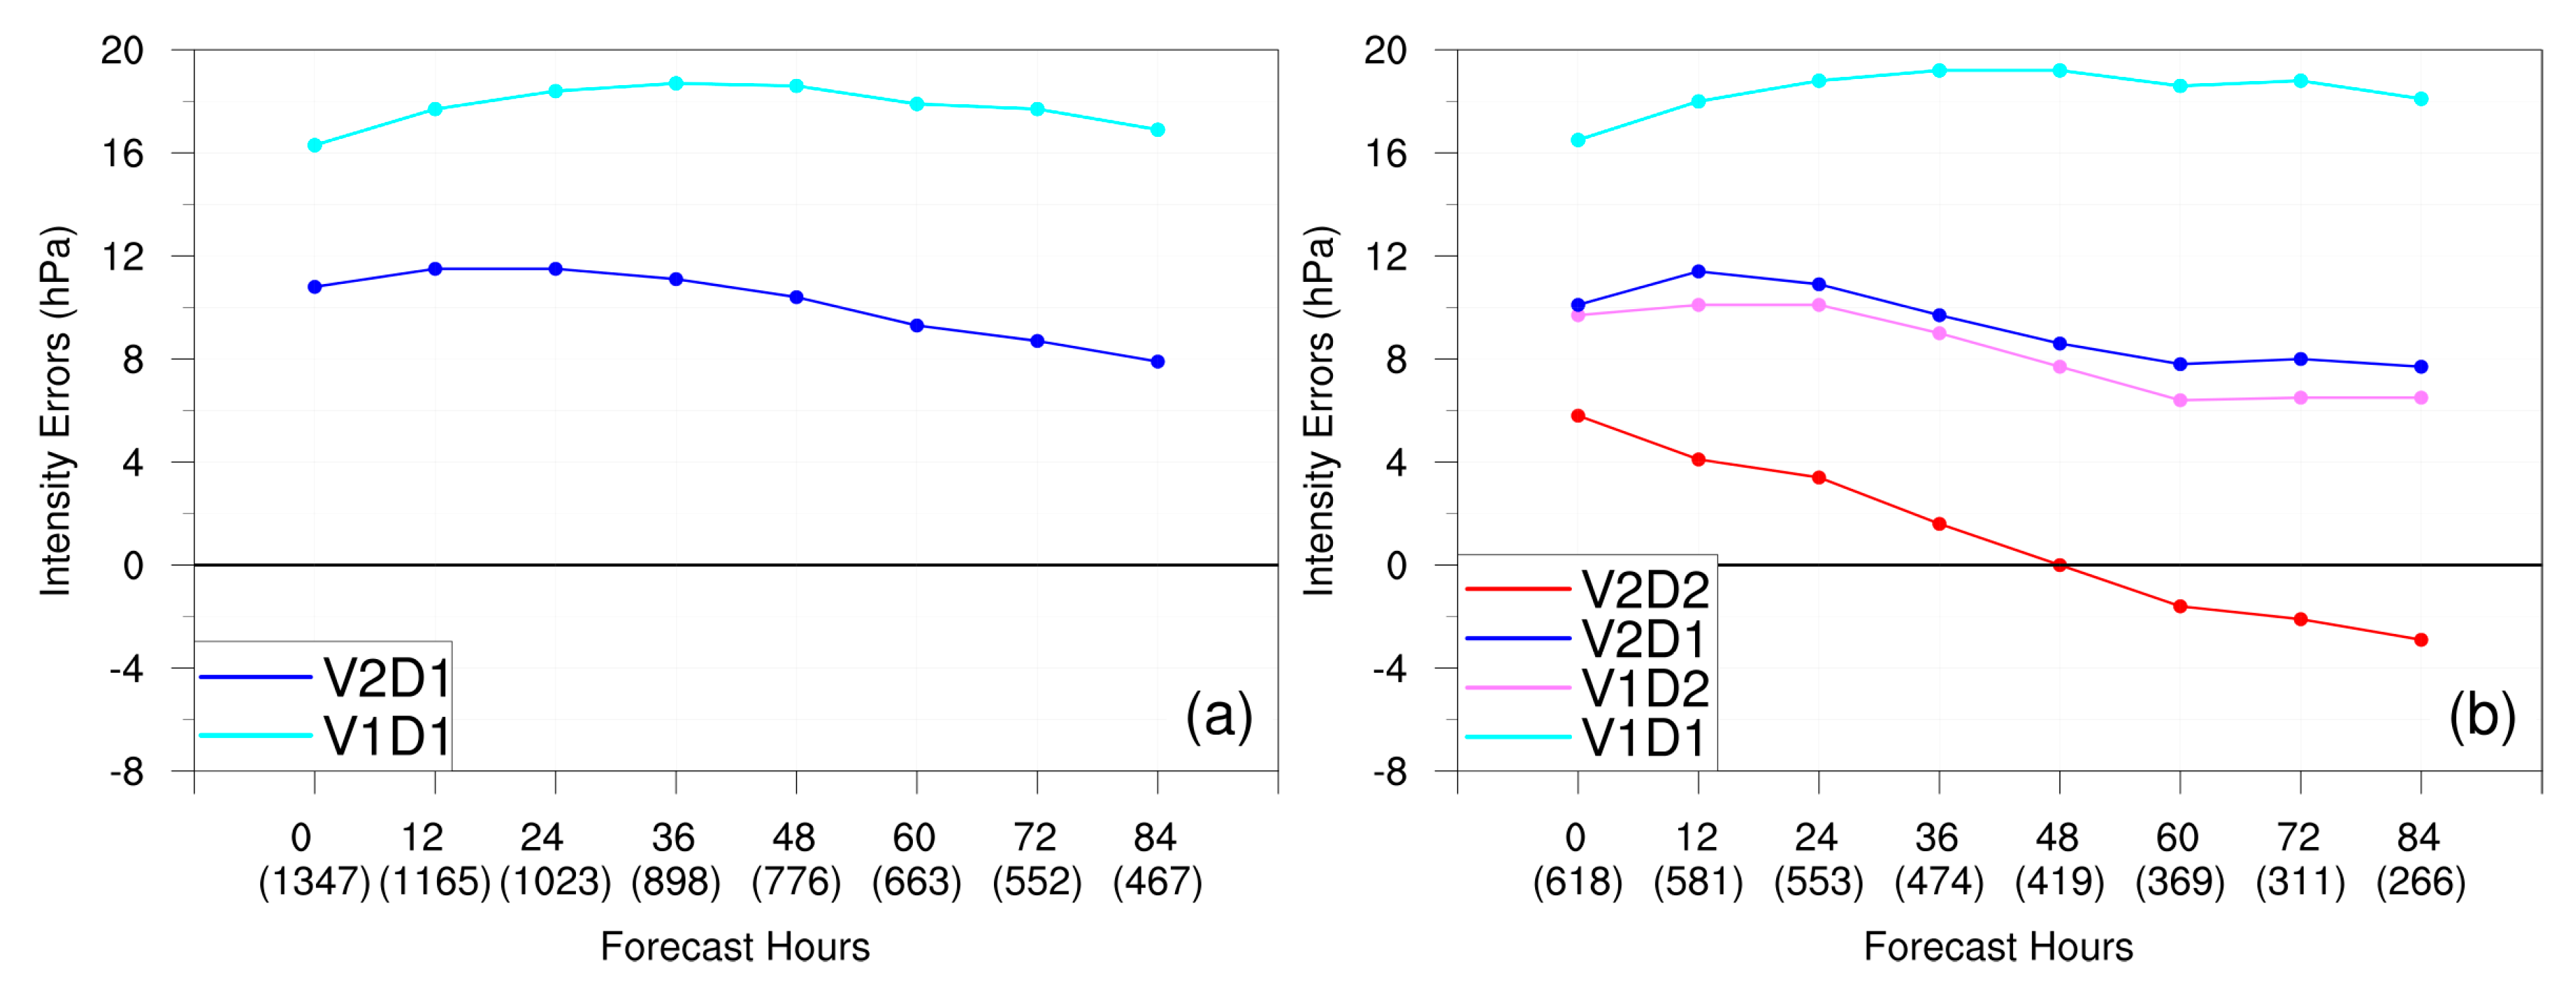
  • With identical computing domains, 15-km V2D1 reduced 16.6% of track errors and 50% of intensity errors in 45-km V1D1 at an 84-h forecast, robustly proving that employing the finer grid improved the TC forecast. In nested domains, the reduction of intensity errors was agreeing with increasing model resolution. However, the track forecast between different model resolutions was comparable, which might result from their limited domain size. Besides, the 3-km mesh had the smallest intensity errors in the initial condition, implying the benefits of high-resolution model integration under the partial cycle strategy.
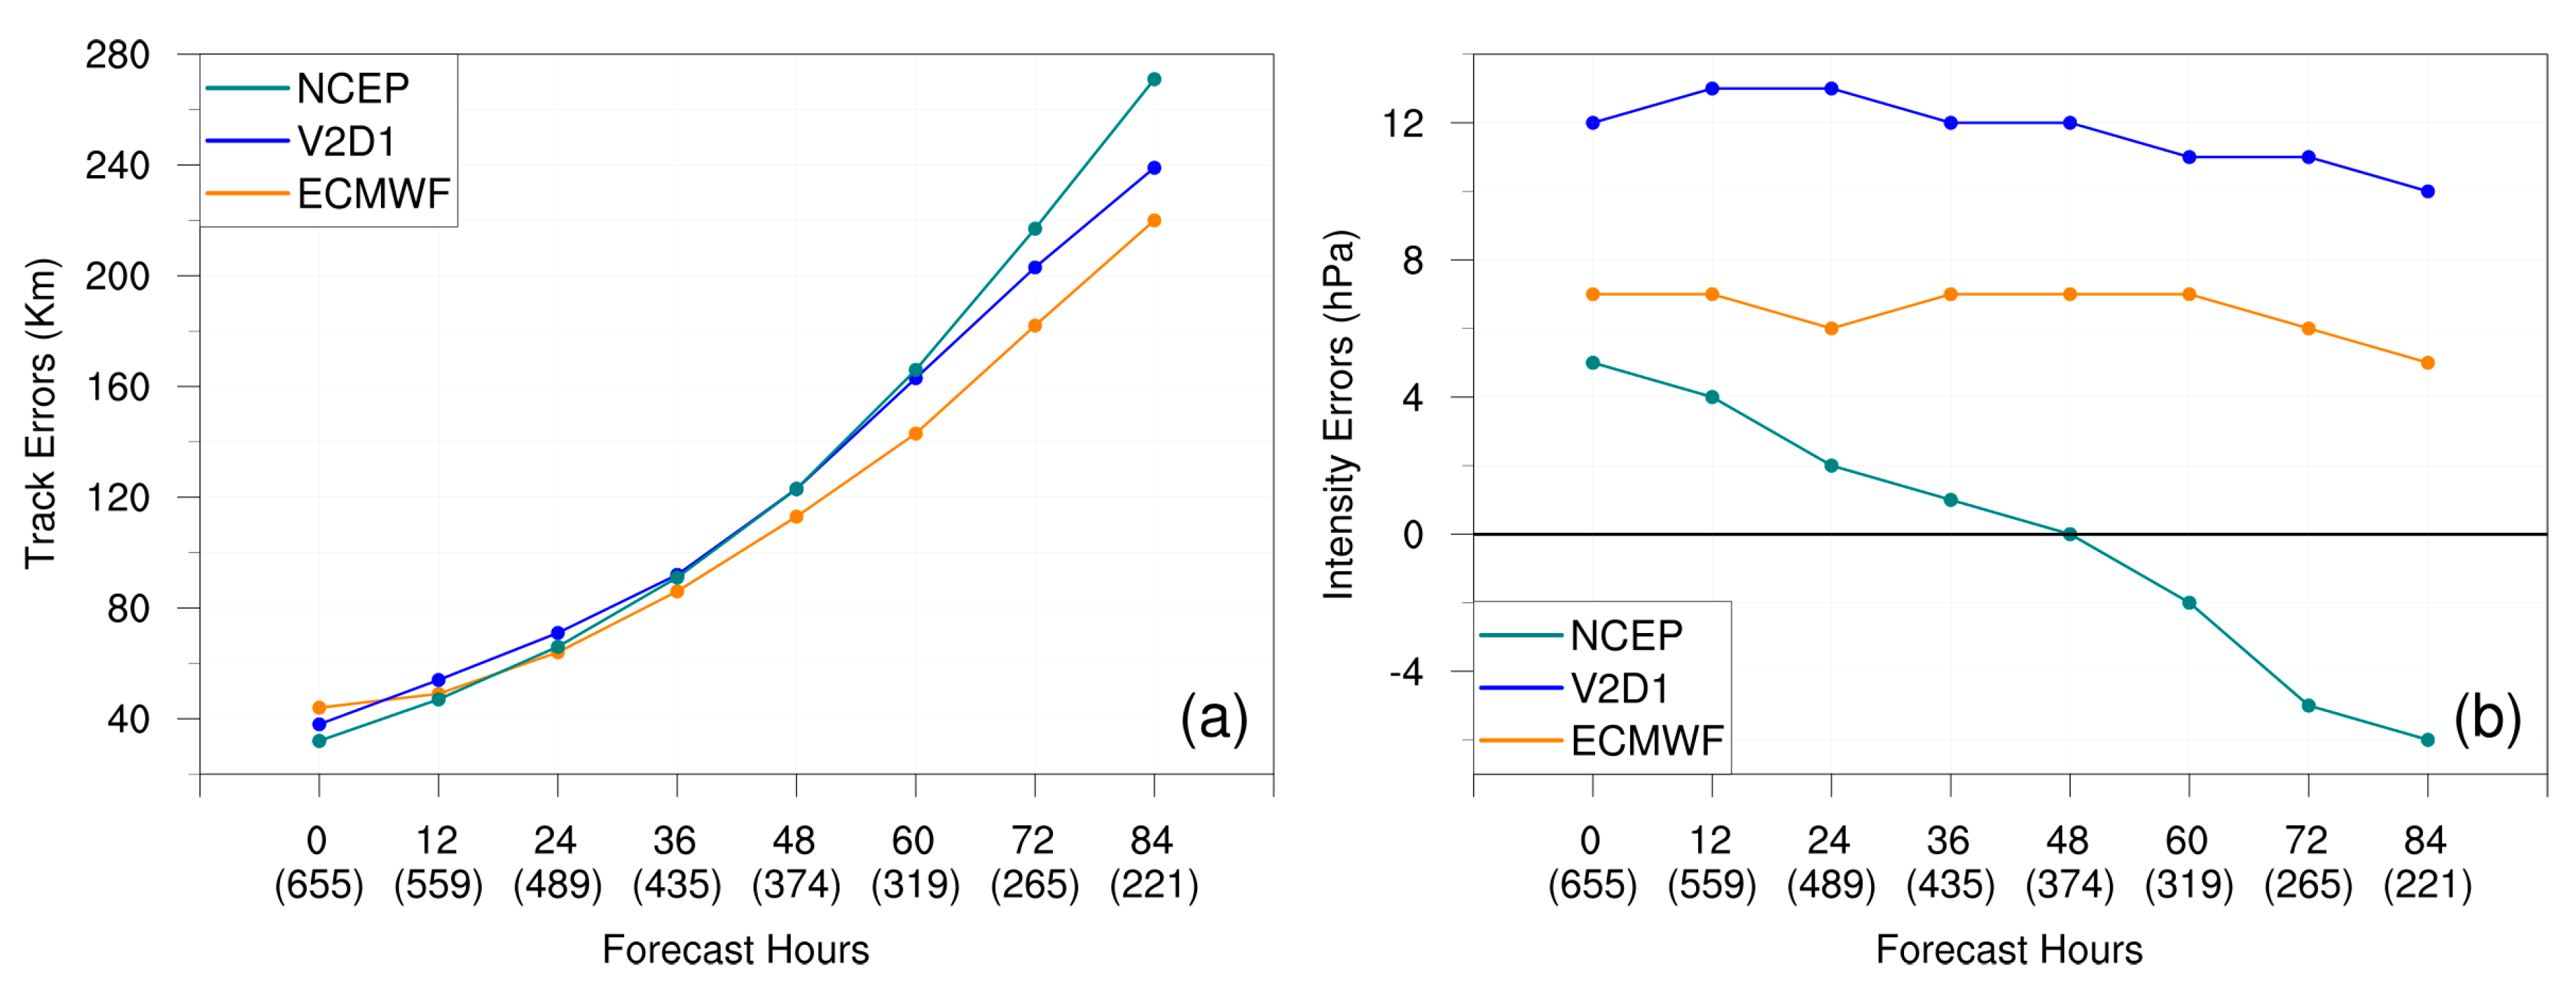
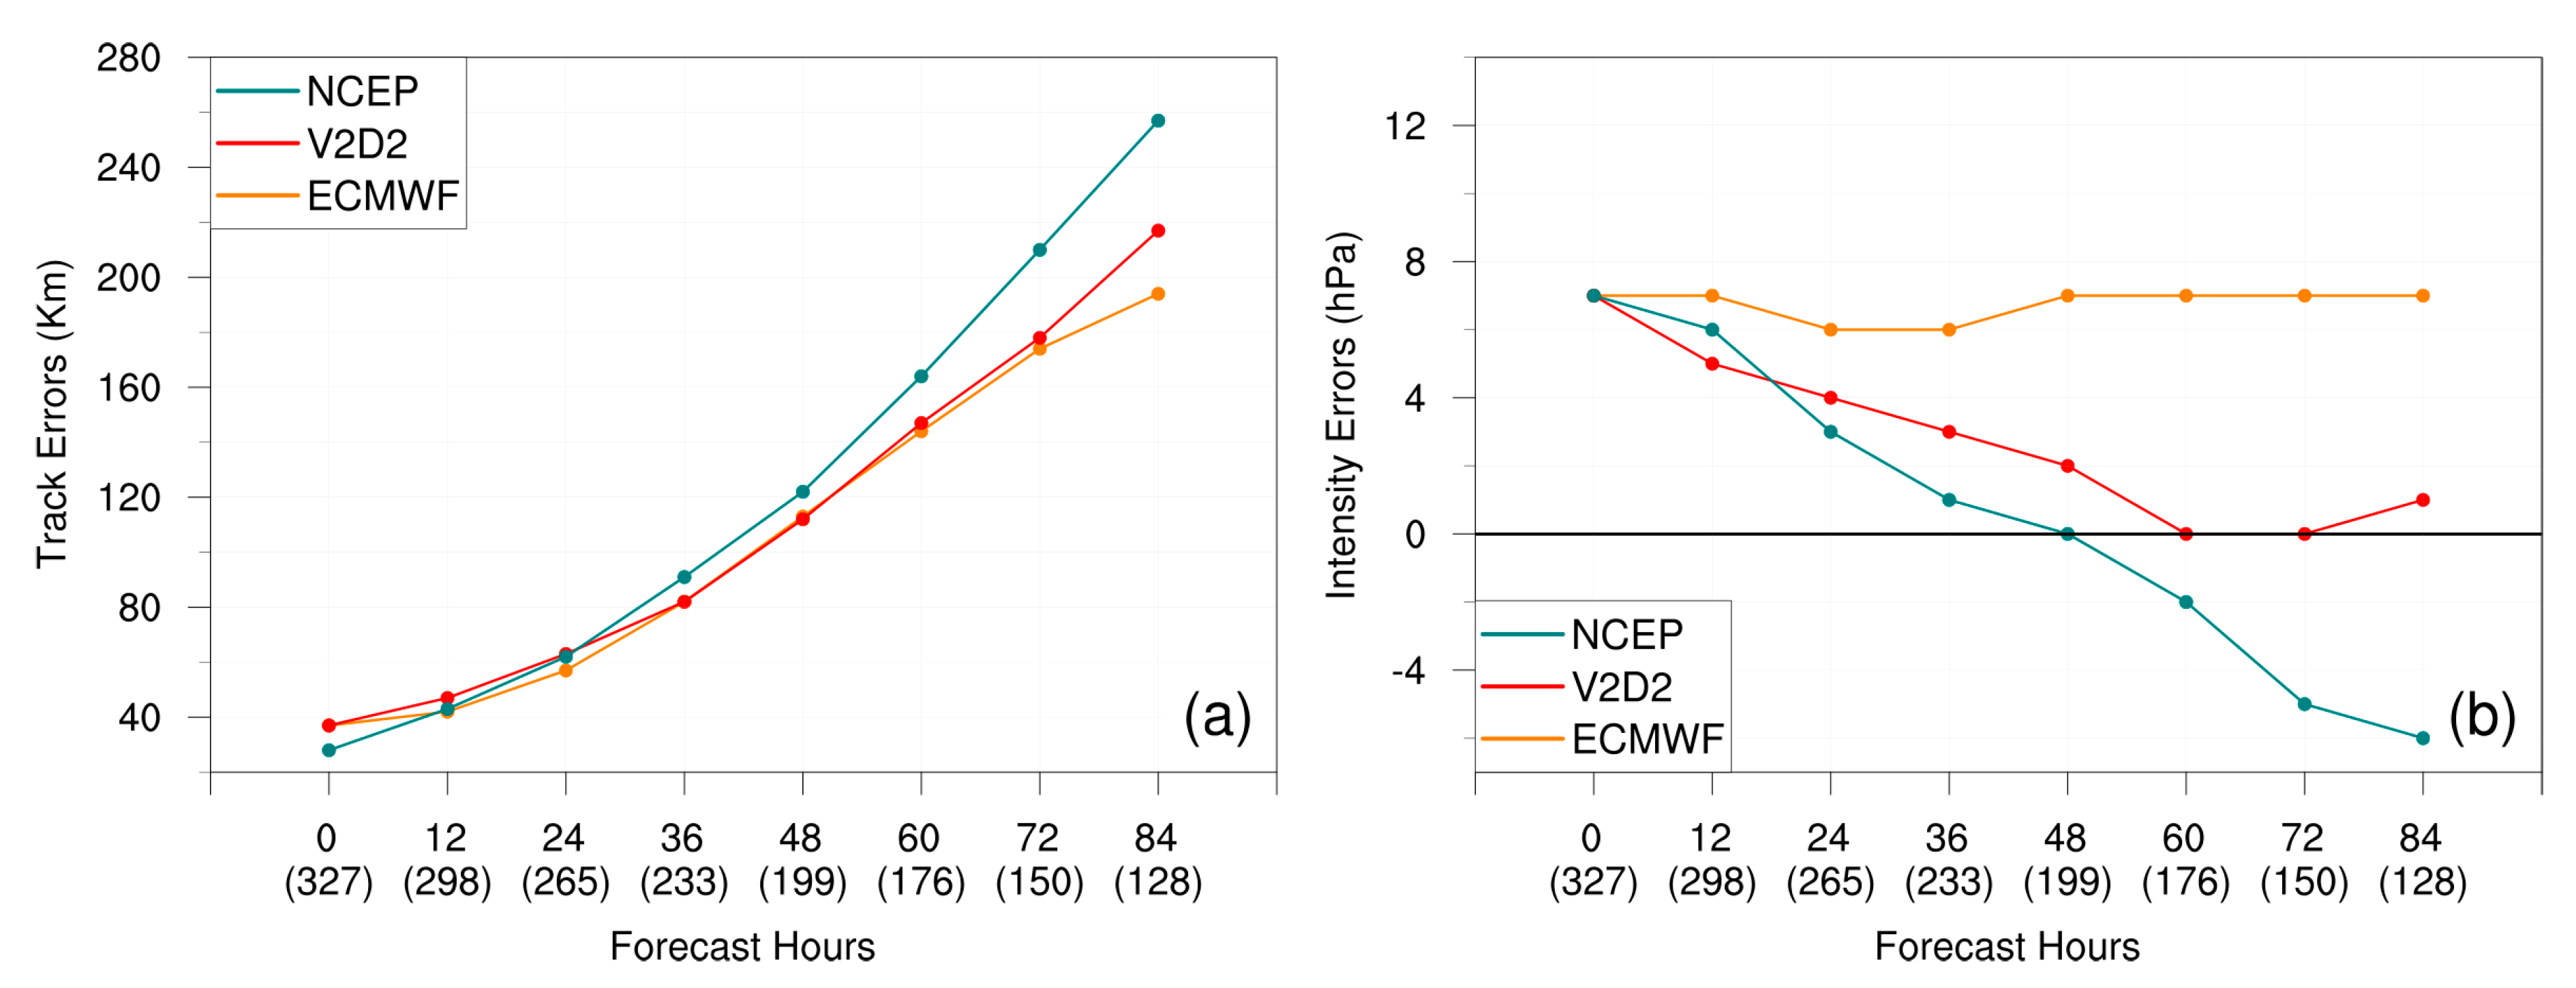
  • Apart from in-house evaluation, the comparison with the leading global models suggested that TWRF V2 has competitive forecast skill. Due to the coarser grid, 15-km V2D1 has a larger intensity errors and comparable track errors with the 13-km NCEP and 9-km ECMWF global models. With the finer grid compared with the above two global models, 3-km V2D2 had the smallest intensity bias. Furthermore, its 72-h track prediction skill was comparable to ECMWF and better than NCEP.
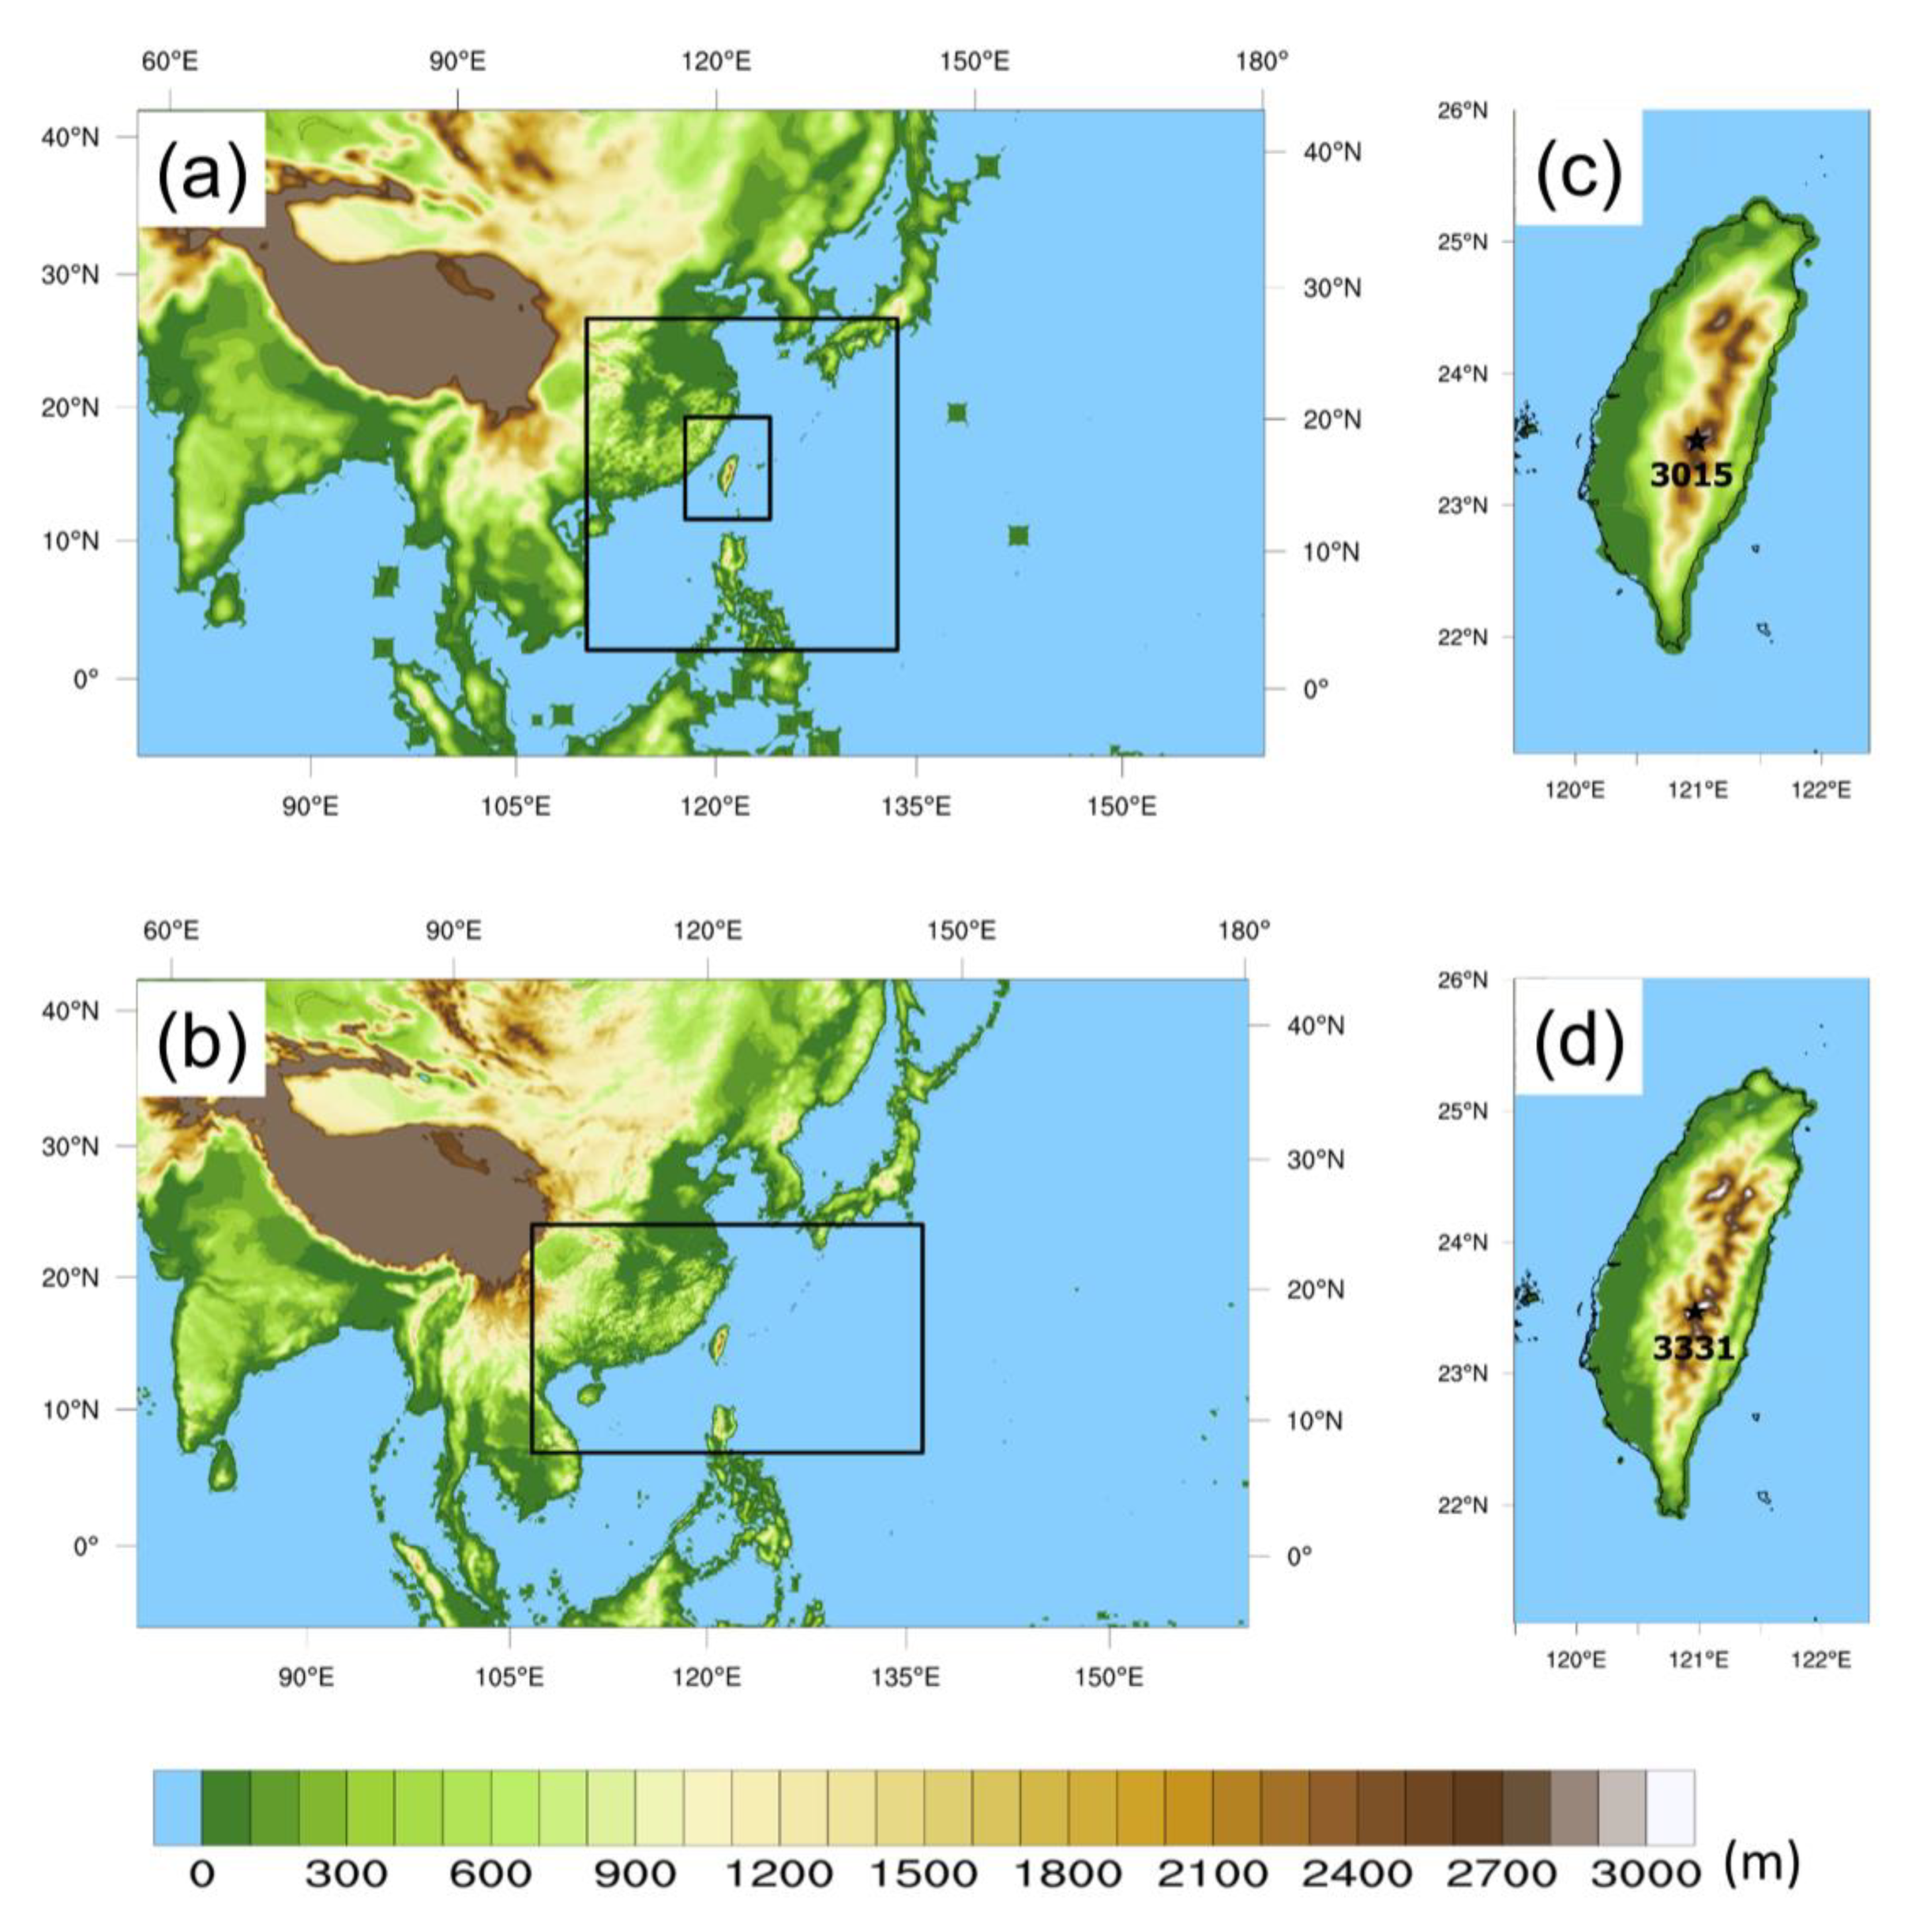
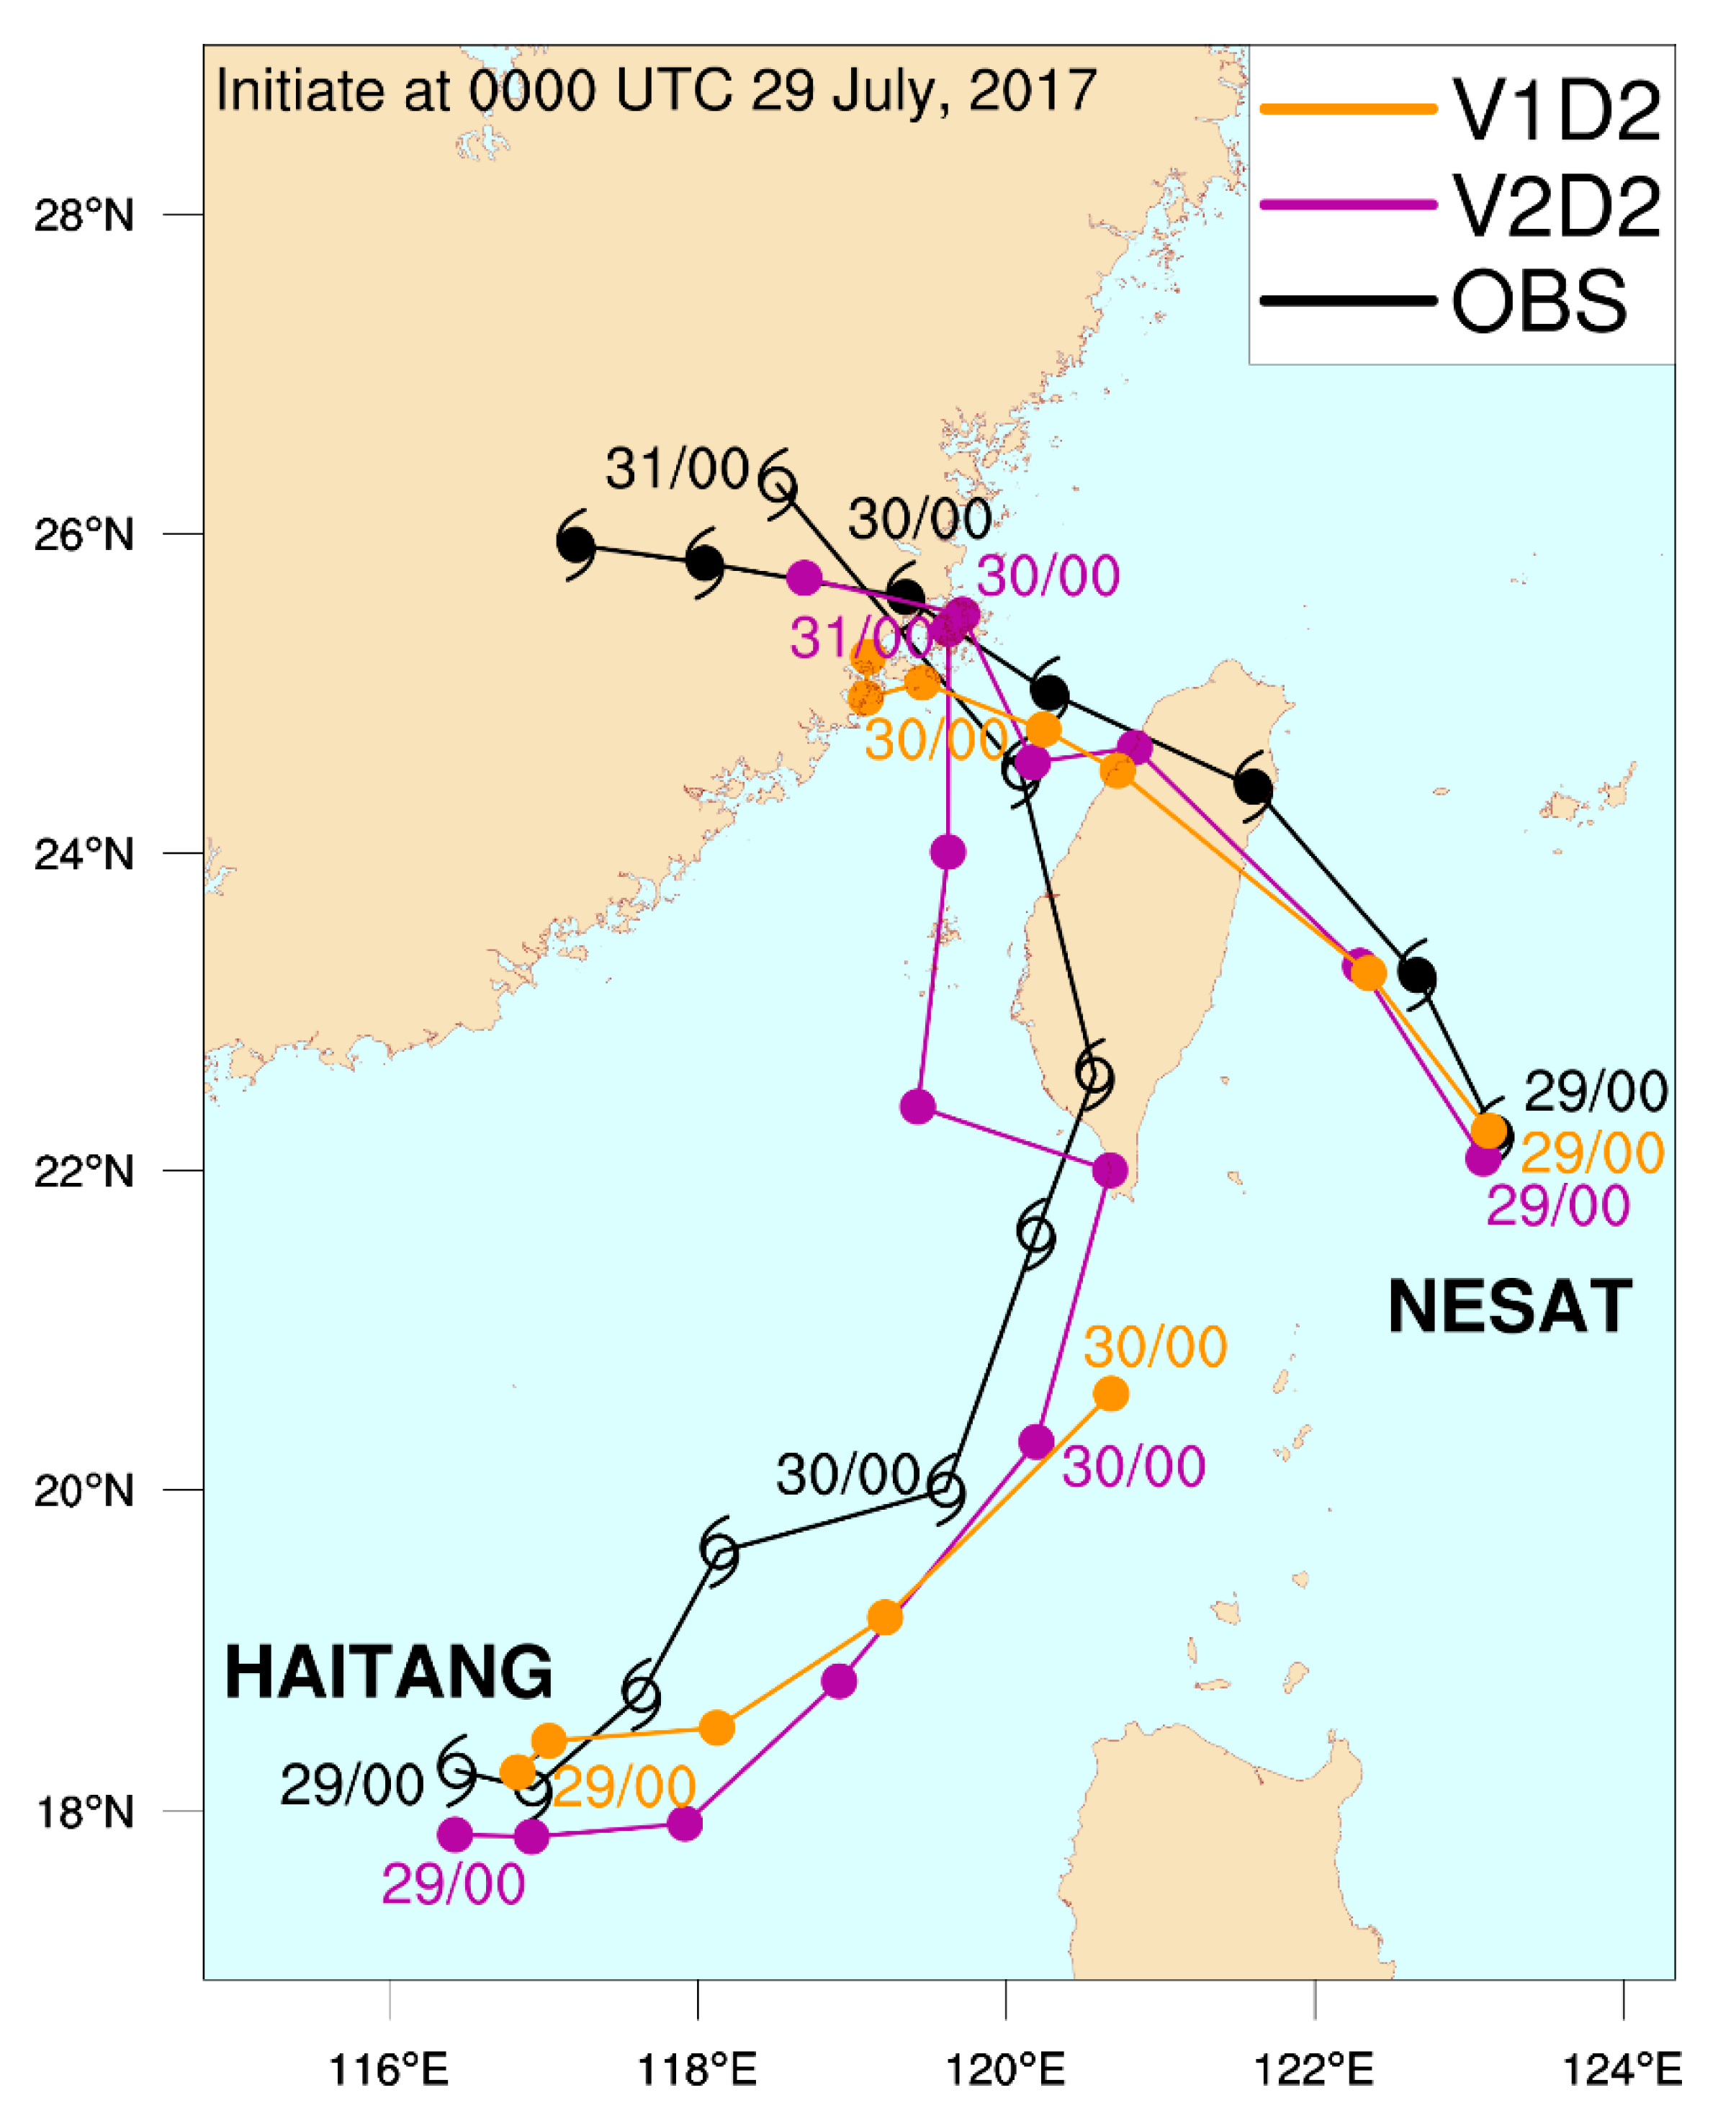
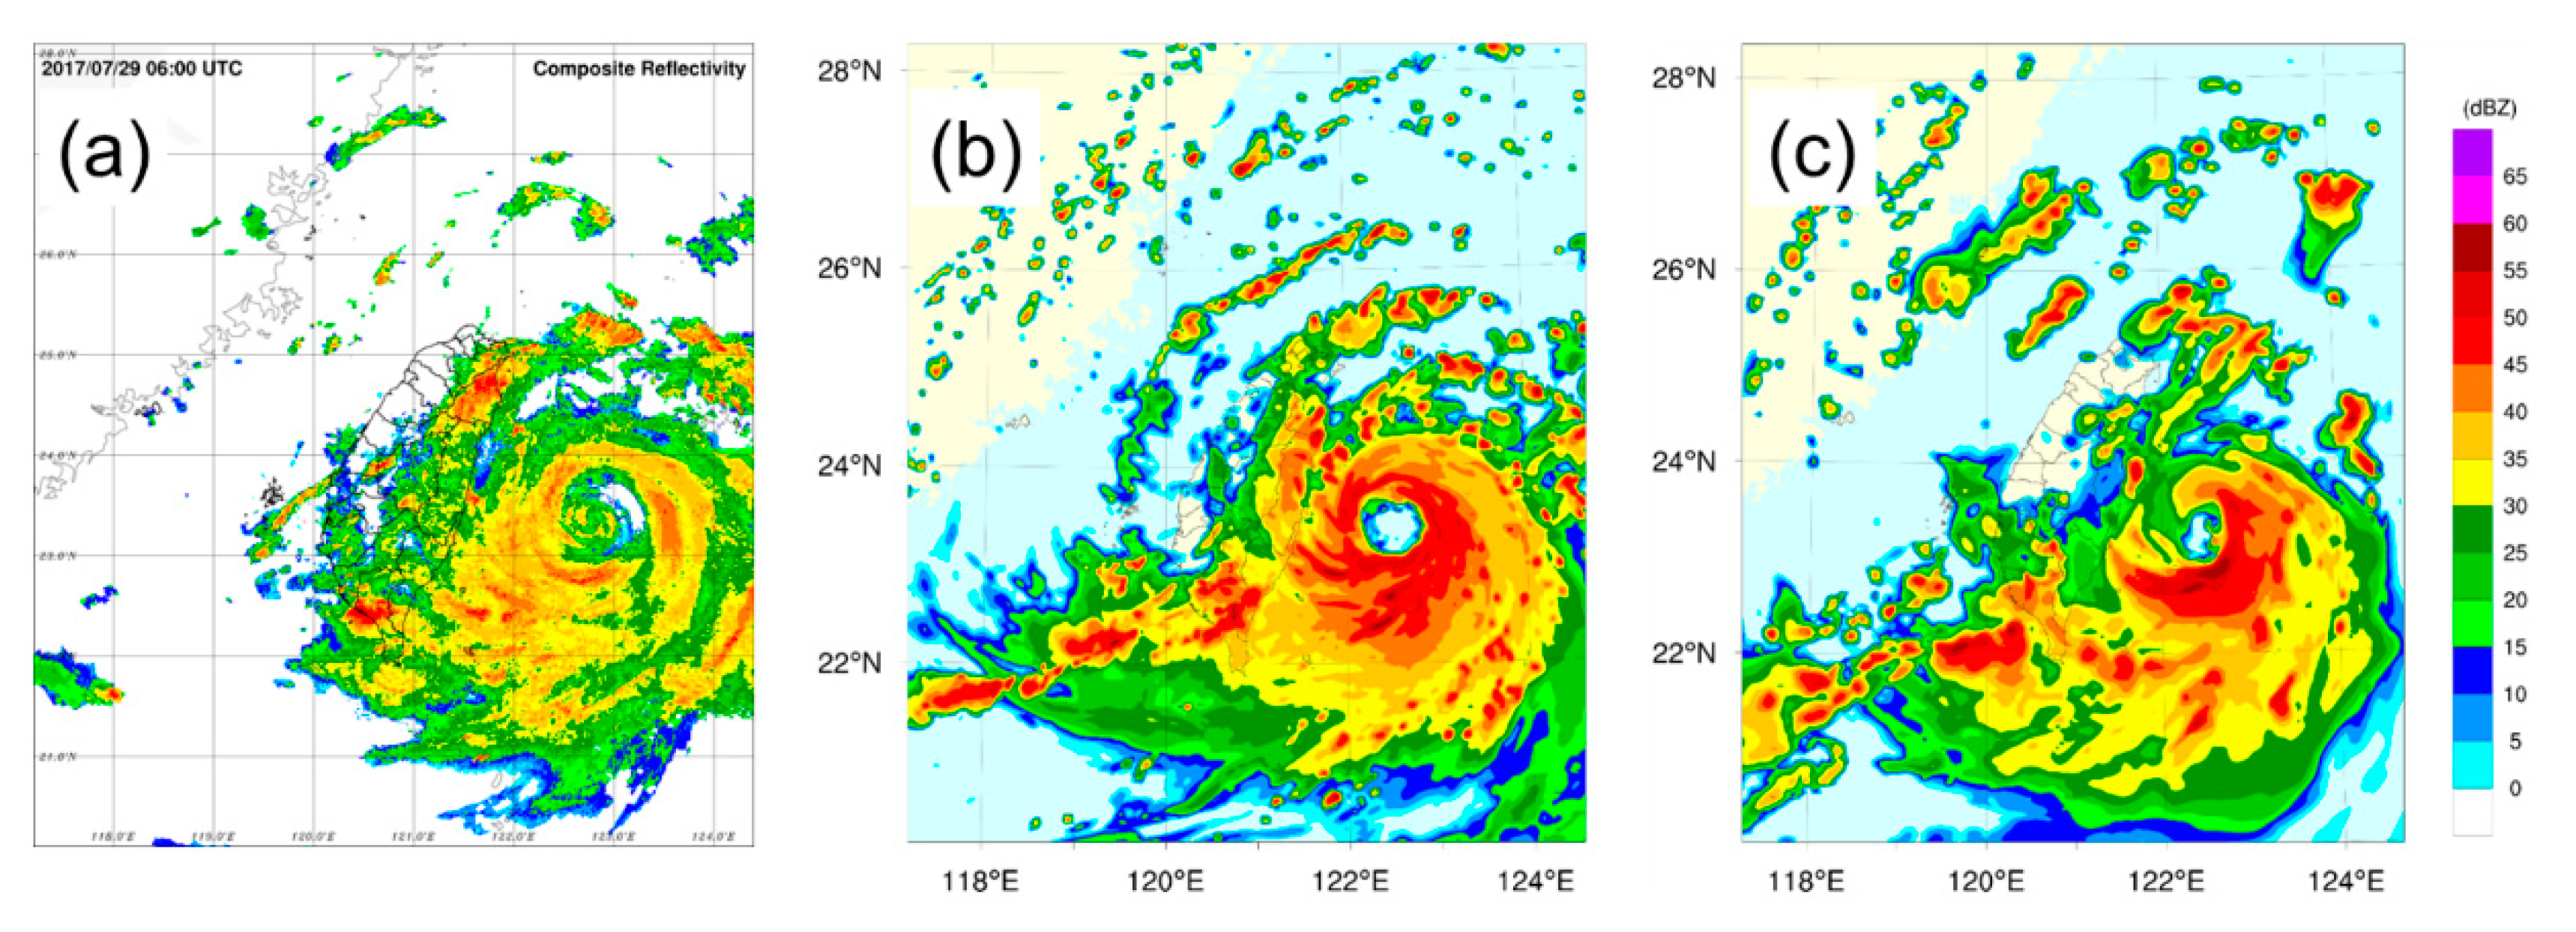
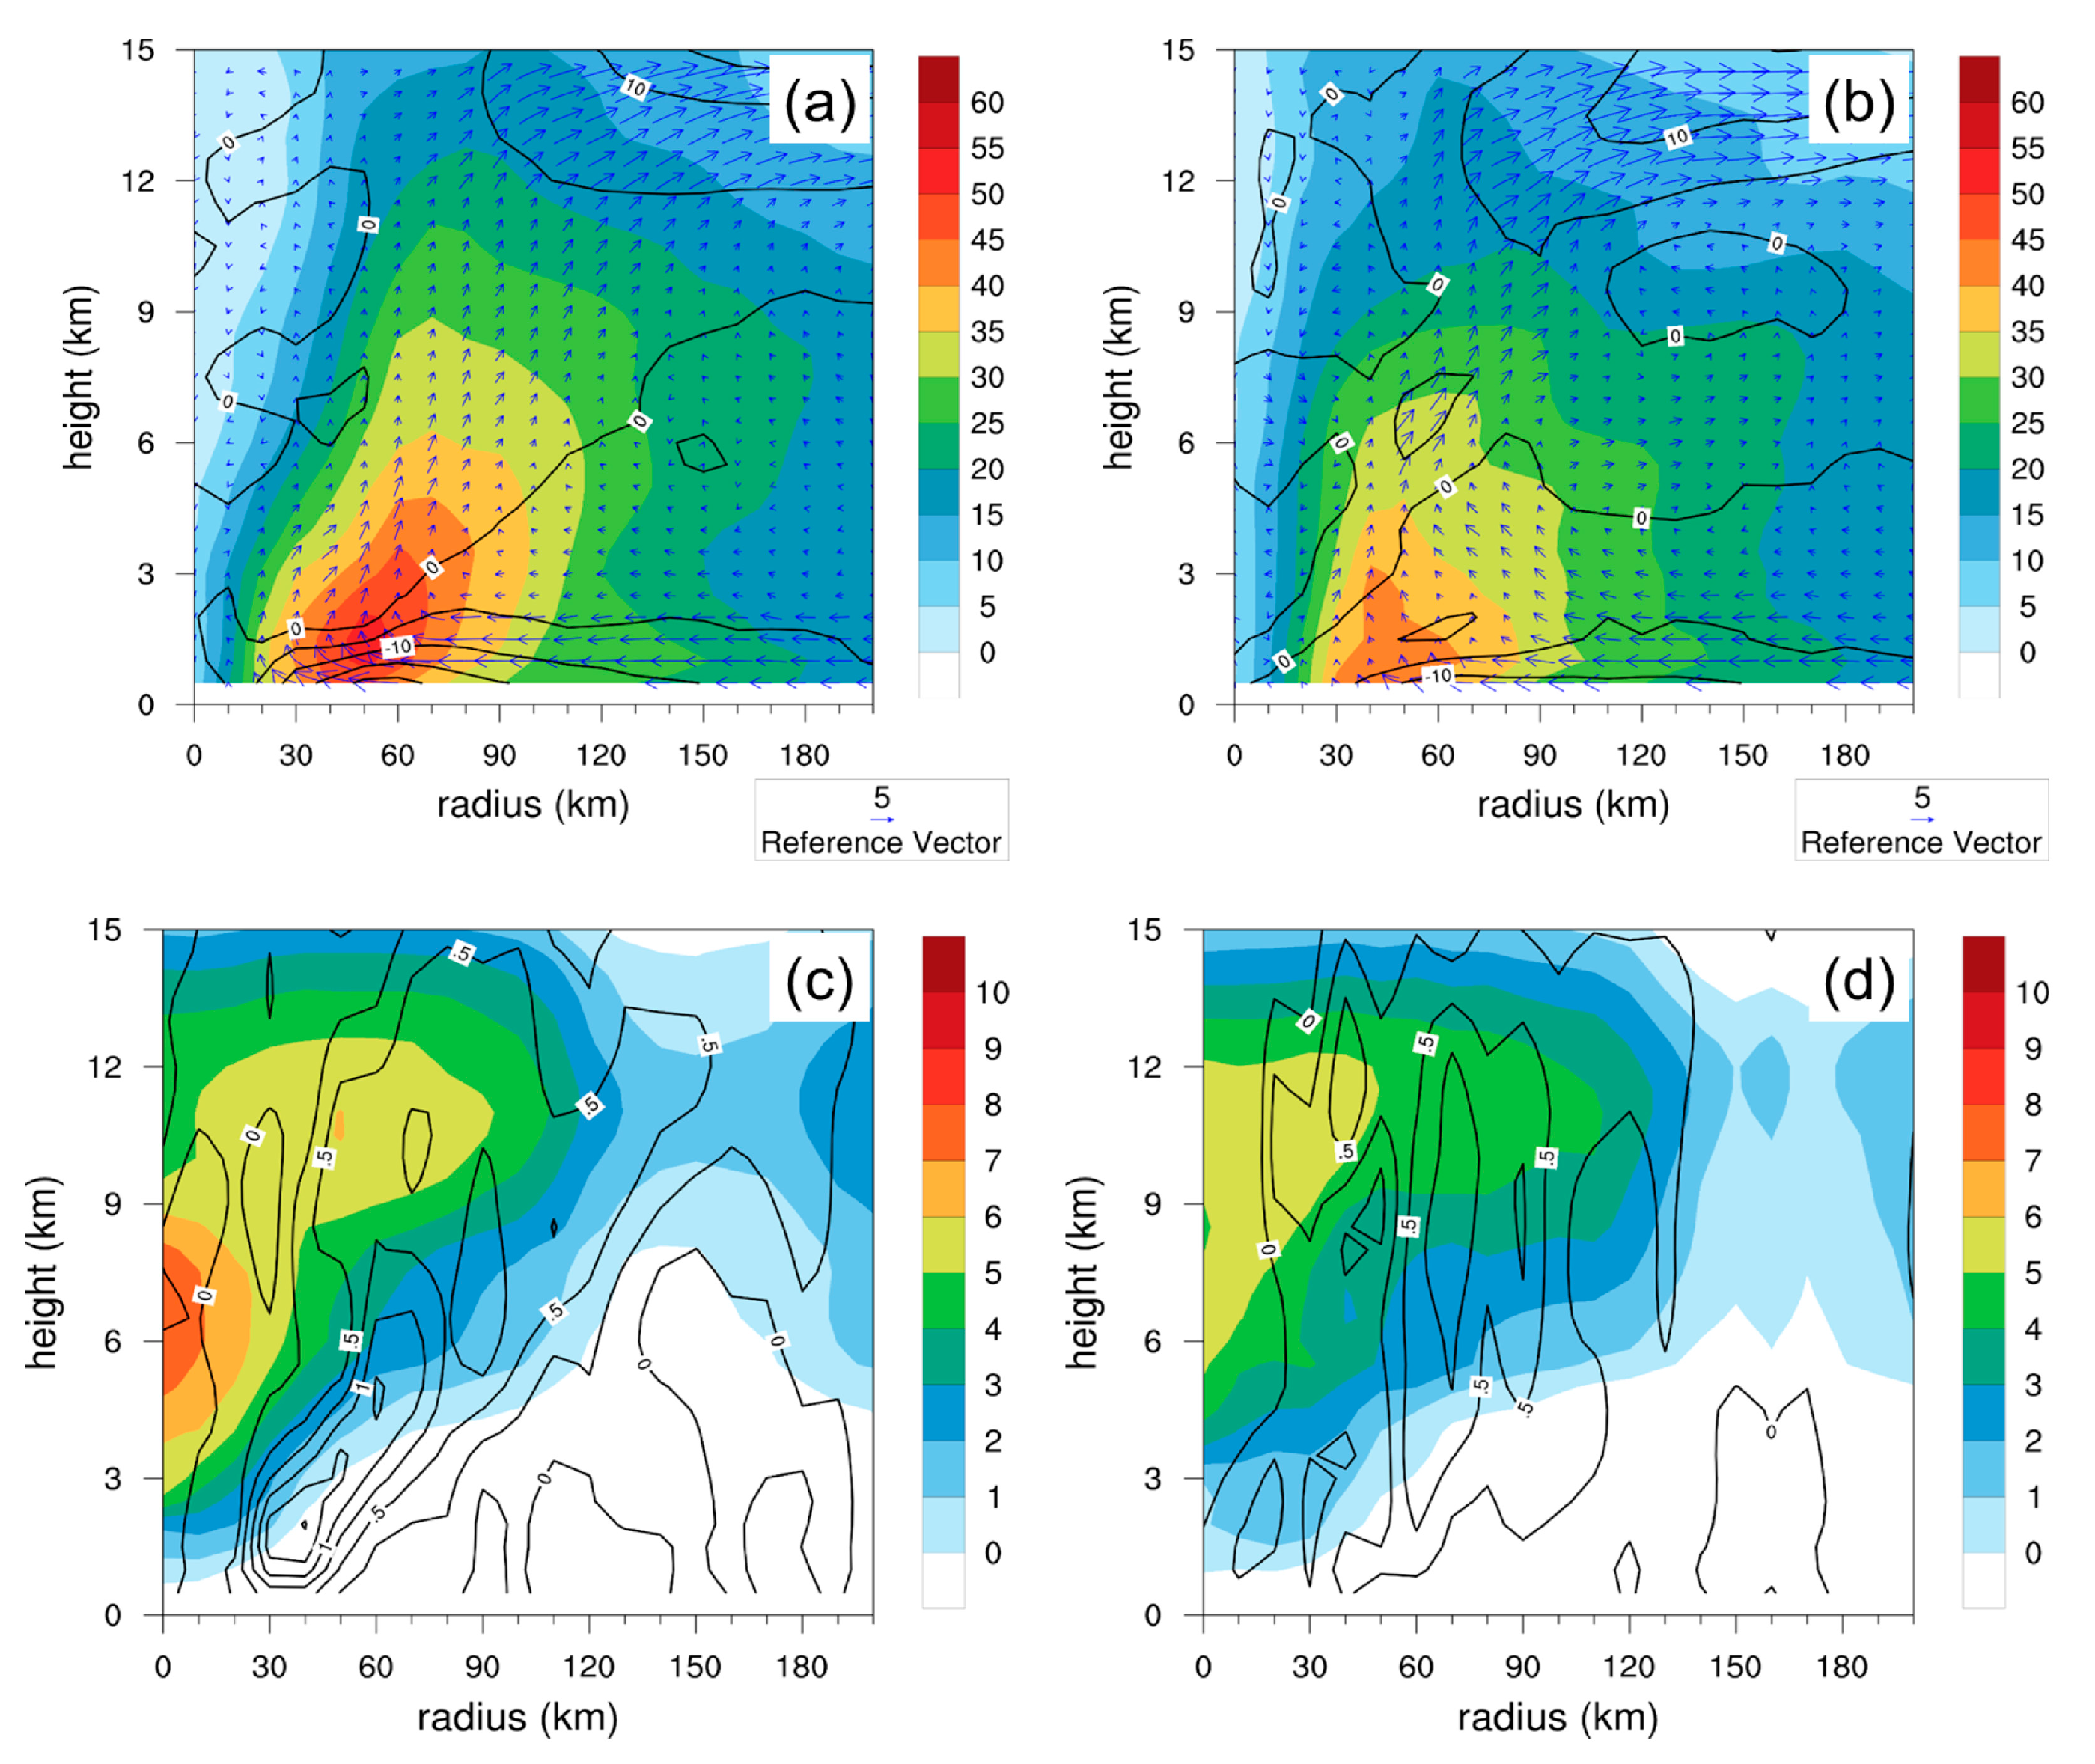
  • Case studies clearly identified the improvement of TC track, intensity, and the TC inner core structure in the high-resolution model. Further, the complex terrain in Taiwan was resolved with more details in the finer grid. As a consequence of this progress, the high-resolution model captured the terrain phase-lock effect, and therefore improved the TC quantitative precipitation forecast skill over the complex terrain.
Presently, how to effectively improve the predictability toward TC-related rainfall remains in question. In Taiwan, improving the inner core-related heavy rainfall is no doubt imperative, but how to capture the extreme rainfall resulted from distant TC due to the terrain phase locking effect is a challenging target in CWB. In particular, such distance rainfall is often enhanced by the interaction of TC outer circulation and northeasterly/southwesterly monsoons [35,36]. Under limited computing resources, the moving nested mesh in HWRF better predicted the TC intensity and inner core structure [18,19,20]. However, this strategy is not suitable for predicting TC-related rainfall in Taiwan due to the relatively small movable nested domain, particularly for the remote heavy rainfall events which TCs are far away from Taiwan.
To enclose both TC evolution and Taiwan in the high-resolution mesh under fixed computing resources, we designed a suite of inner domains (3-km D3s), which covered Taiwan Island, and selected automatically in the initialization process based on current TC location (Figure 13). Compared with the fixed operational domain, which cannot ensure cover the most TC evolution, the 3-km D3s is expected to further improve TC track, intensity, and inner core prediction since the 3-km domain covers the entire TC during its model integration. Additionally, it has the potential to resolve the multi-scale interaction between large scale weather systems, TC, and terrain lifting effect. A preliminary experiment with TC Maria, which centered outside the operational 3-km domain at the initial time (blue box in Figure 13), supports part of our assumption. The 3-km D3s strategy the decides nested domain (red box in Figure 13) based on Maria’s position at the initial time, which ensured the existence of TC in the initial condition, reduced model track errors (Figure 14). It is, therefore, a strategic design to leverage up the advantage of the high-resolution model on QPF over Taiwan under the limited computing resources. In order to have a comprehensive evaluation, more case studies and various verification are in progress.

Author Contributions

L.-F.H., D.-S.C., and J.-S.H. conducted the real-time results, plotted the figures, and wrote the original manuscript. T.-C.Y. and C.-T.F. reviewed and edited the manuscript. All authors have read and agreed to the published version of the manuscript.

Funding

This work was supported by Central Weather Bureau.

Acknowledgments

We are grateful to help from National Center for Atmospheric Research (NCAR) on the technical cooperation of WRF model. The authors thank Melinda S. Peng and I-Han Chen, and the anonymous reviewers for their constructive comments and suggestions on this manuscript. This study was supported by the Ministry of Science and Technology of the ROC under Grants MOST 107-2625-M-052-003.

Conflicts of Interest

The authors declare no conflict of interest.

References

  1. Wu, C.-C.; Kuo, Y.-H. Typhoons Affecting Taiwan: Current Understanding and Future Challenges. Bull. Am. Meteorol. Soc. 1999, 80, 67–80. [Google Scholar] [CrossRef]
  2. DeMaria, M.; Knaff, J.; Sampson, C. Evaluation of long-term trends in tropical cyclone intensity forecasts. Theor. Appl. Clim. 2007, 97, 19–28. [Google Scholar] [CrossRef]
  3. DeMaria, M.; Sampson, C.R.; Knaff, J.; Musgrave, K.D. Is Tropical Cyclone Intensity Guidance Improving? Bull. Am. Meteorol. Soc. 2014, 95, 387–398. [Google Scholar] [CrossRef] [Green Version]
  4. Skamarock, W.C.; Klemp, J.B.; Dudhia, J.; Gil, D.A.; Barker, D.M.; Duda, M.G.; Huang, X.Y.; Wang, W.; Powers, J.G. Description of the Advanced Research WRF Version 3; National Center for Atmospheric Research: Boulder, CO, USA, 2008.
  5. Hsiao, L.-F.; Liou, C.-S.; Yeh, T.-C.; Guo, Y.-R.; Chen, D.-S.; Huang, K.-N.; Terng, C.-T.; Chen, J.-H. A Vortex Relocation Scheme for Tropical Cyclone Initialization in Advanced Research WRF. Mon. Weather Rev. 2010, 138, 3298–3315. [Google Scholar] [CrossRef]
  6. Hsiao, L.-F.; Chen, D.-S.; Kuo, Y.-H.; Guo, Y.-R.; Yeh, T.-C.; Hong, J.-S.; Fong, C.-T.; Lee, C.-S. Application of WRF 3DVAR to Operational Typhoon Prediction in Taiwan: Impact of Outer Loop and Partial Cycling Approaches. Weather Forecast. 2012, 27, 1249–1263. [Google Scholar] [CrossRef]
  7. Yang, X. Analysis Blending Using a Spatial Filter in Grid-Point Model Coupling; Hirlam Newsletter 48, available from the Hirlam-6 Project, c/o Per Undén; The Royal Netherlands Meteorological Institute: Utrecht, The Netherlands, 2005; pp. 49–55. [Google Scholar]
  8. Hsiao, L.-F.; Huang, X.-Y.; Kuo, Y.-H.; Chen, D.-S.; Wang, H.; Tsai, C.-C.; Yeh, T.-C.; Hong, J.-S.; Fong, C.-T.; Lee, C.-S. Blending of Global and Regional Analyses with a Spatial Filter: Application to Typhoon Prediction over the Western North Pacific Ocean. Weather Forecast. 2015, 30, 754–770. [Google Scholar] [CrossRef]
  9. Durand, Y.; Bougeault, P. ‘L’analyse Objective PERIDOT’; Note de travail 193; Direction de la Météorologie Nationale/EERM: Toulouse, France, 1987. [Google Scholar]
  10. Ajjaji, R.; Issara, S. Introduction de l’analyse CANARI du modeglobalARPe≤globalARPEGEdans le mode≤e≤a domaine limit’e ALADIN’. Master’s Thesis, Ecole Nationale de la M´et´eorologie, Toulouse, France, 1994. [Google Scholar]
  11. Feng, J.; Sun, J.; Zhang, Y. A Dynamic Blending Scheme to Mitigate Large-Scale Bias in Regional Models. J. Adv. Model. Earth Syst. 2020, 12, 001754. [Google Scholar] [CrossRef] [Green Version]
  12. Jin, H.; Peng, M.S.; Jin, Y.; Doyle, J.D. An Evaluation of the Impact of Horizontal Resolution on Tropical Cyclone Predictions Using COAMPS-TC. Weather Forecast. 2014, 29, 252–270. [Google Scholar] [CrossRef]
  13. Zhang, X.; Quirino, T.; Yeh, K.-S.; Gopalakrishnan, S.; Marks, F.; Goldenberg, S.; Aberson, S. HWRFx: Improving Hurricane Forecasts with High-Resolution Modeling. Comput. Sci. Eng. 2010, 13, 13–21. [Google Scholar] [CrossRef]
  14. Gopalakrishnan, S.G.; Marks, F.; Zhang, X.; Bao, J.-W.; Yeh, K.-S.; Atlas, R. The Experimental HWRF System: A Study on the Influence of Horizontal Resolution on the Structure and Intensity Changes in Tropical Cyclones Using an Idealized Framework. Mon. Weather Rev. 2011, 139, 1762–1784. [Google Scholar] [CrossRef]
  15. Gopalakrishnan, S.G.; Goldenberg, S.; Quirino, T.; Zhang, X.; Marks, F.; Yeh, K.-S.; Atlas, R.; Tallapragada, V. Toward Improving High-Resolution Numerical Hurricane Forecasting: Influence of Model Horizontal Grid Resolution, Initialization, and Physics. Weather Forecast. 2012, 27, 647–666. [Google Scholar] [CrossRef]
  16. Done, J.; Davis, C.A.; Weisman, M. The next generation of NWP: Explicit forecasts of convection using the weather research and forecasting (WRF) model. Atmos. Sci. Lett. 2004, 5, 110–117. [Google Scholar] [CrossRef]
  17. Schwartz, C.S.; Kain, J.S.; Weiss, S.J.; Xue, M.; Bright, D.R.; Kong, F.; Thomas, K.W.; Levit, J.J.; Coniglio, M.C. Next-Day Convection-Allowing WRF Model Guidance: A Second Look at 2-km versus 4-km Grid Spacing. Mon. Weather Rev. 2009, 137, 3351–3372. [Google Scholar] [CrossRef]
  18. Tallapragada, V.; Kieu, C.; Kwon, Y.; Trahan, S.; Liu, Q.; Zhang, Z.; Kwon, I.-H. Evaluation of Storm Structure from the Operational HWRF during 2012 Implementation. Mon. Weather Rev. 2014, 142, 4308–4325. [Google Scholar] [CrossRef]
  19. Tallapragada, V.; Kieu, C.; Trahan, S.; Zhang, Z.; Liu, Q.; Wang, W.; Tong, M.; Zhang, B.; Strahl, B. Forecasting Tropical Cyclones in the Western North Pacific Basin Using the NCEP Operational HWRF: Real-Time Implementation in 2012. Weather Forecast. 2015, 30, 1355–1373. [Google Scholar] [CrossRef]
  20. Tallapragada, V.; Kieu, C.Q.; Trahan, S.; Liu, Q.; Wang, W.; Zhang, Z.; Tong, M.; Zhang, B.; Zhu, L.; Strahl, B. Forecasting Tropical Cyclones in the Western North Pacific Basin Using the NCEP Operational HWRF Model: Model Upgrades and Evaluation of Real-Time Performance in 2013. Weather Forecast. 2016, 31, 877–894. [Google Scholar] [CrossRef]
  21. Tao, W.-K.; Simpson, J.; Baker, D.; Braun, S.; Chou, M.-D.; Ferrier, B.; Johnson, D.; Khain, A.; Lang, S.; Lynn, B.; et al. Microphysics, radiation and surface processes in the Goddard Cumulus Ensemble (GCE) model. Theor. Appl. Clim. 2003, 82, 97–137. [Google Scholar] [CrossRef]
  22. Kain, J.S. The Kain–Fritsch convective parameterization scheme: An update. J. Appl. Meteorol. 2004, 43, 170–181. [Google Scholar] [CrossRef] [Green Version]
  23. Hong, S.-Y.; Noh, Y.; Dudhia, J. A New Vertical Diffusion Package with an Explicit Treatment of Entrainment Processes. Mon. Weather Rev. 2006, 134, 2318–2341. [Google Scholar] [CrossRef] [Green Version]
  24. Chen, F.; Dudhia, J. Coupling an advanced land-surface/hydrology model with the Penn State/NCAR MM5 modeling system. Part I: Model description and implementation. Mon. Weather Rev. 2001, 129, 569–585. [Google Scholar] [CrossRef] [Green Version]
  25. Mlawer, E.J.; Taubman, S.J.; Brown, P.D.; Iacono, M.J.; Clough, S.A. Radiative transfer for inhomogeneous atmospheres: RRTM, a validated correlated-k model for the longwave. J. Geophys. Res. Space Phys. 1997, 102, 16663–16682. [Google Scholar] [CrossRef] [Green Version]
  26. Iacono, M.J.; Delamere, J.S.; Mlawer, E.J.; Shephard, M.W.; Clough, S.A.; Collins, W. Radiative forcing by long-lived greenhouse gases: Calculations with the AER radiative transfer models. J. Geophys. Res. Space Phys. 2008, 113. [Google Scholar] [CrossRef]
  27. Wu, C.-C.; Yen, T.-H.; Kuo, Y.-H.; Wang, W. Rainfall Simulation Associated with Typhoon Herb (1996) near Taiwan. Part I: The Topographic Effect. Weather Forecast. 2002, 17, 1001–1015. [Google Scholar] [CrossRef]
  28. Chien, F.-C.; Kuo, H.-C. On the extreme rainfall of Typhoon Morakot (2009). J. Geophys. Res. Space Phys. 2011, 116. [Google Scholar] [CrossRef] [Green Version]
  29. Hong, J.-S.; Fong, C.-T.; Hsiao, L.-F.; Yu, Y.-C.; Tzeng, C.-Y. Ensemble Typhoon Quantitative Precipitation Forecasts Model in Taiwan. Weather Forecast. 2015, 30, 217–237. [Google Scholar] [CrossRef]
  30. Harr, P.A.; Anwender, D.; Jones, S.C. Predictability Associated with the Downstream Impacts of the Extratropical Transition of Tropical Cyclones: Methodology and a Case Study of Typhoon Nabi (2005). Mon. Weather Rev. 2008, 136, 3205–3225. [Google Scholar] [CrossRef]
  31. Reynolds, C.A.; Peng, M.S.; Chen, J.-H. Recurving Tropical Cyclones: Singular Vector Sensitivity and Downstream Impacts. Mon. Weather Rev. 2009, 137, 1320–1337. [Google Scholar] [CrossRef]
  32. Fujiwhara, S.; Sekiguchi, K. Estimated 300 m isobars and the weather of Japan. J. Meteorol. Soc. Jpn. 1919, 38, 254–259. (In Japanese) [Google Scholar]
  33. Brand, S.; Buenafe, C.A.; Hamilton, H.D. Comparison of Tropical Cyclone Motion and Environmental Steering. Mon. Weather Rev. 1981, 109, 908–909. [Google Scholar] [CrossRef] [Green Version]
  34. Zhang, J.; Howard, K.; Chang, P.-L.; Chiu, P.T.-K.; Chen, C.-R.; Langston, C.; Xia, W.; Kaney, B.; Lin, P.-F. High-Resolution QPE System for Taiwan; Springer Science and Business Media LLC: Berlin/Heidelberg, Germany, 2009; pp. 147–162. [Google Scholar]
  35. Cheung, K.K.; Huang, L.-R.; Lee, C.-S. Characteristics of rainfall during tropical cyclone periods in Taiwan. Nat. Hazards Earth Syst. Sci. 2008, 8, 1463–1474. [Google Scholar] [CrossRef]
  36. Wu, C.-C.; Cheung, K.K.; Lo, Y.-Y. Numerical Study of the Rainfall Event due to the Interaction of Typhoon Babs (1998) and the Northeasterly Monsoon. Mon. Weather Rev. 2009, 137, 2049–2064. [Google Scholar] [CrossRef]
Figure 1. (a) Domains of the three-nested grids in the TWRF V1 version. The resolution is 45/15/5 km for the three grids; (b) Domains of the two-nested grids in the TWRF V2 version. The resolution is 15 km for the outer grid and 3 km for the inner grid, respectively. (c,d) display the terrain height with resolutions in the inner-most domain of V1 and V2, respectively. The digital numbers in (c,d) denote the maximum terrain height which occurred at the position marked as a star sign.
Atmosphere 11 00657 g001
Figure 2. Homogeneous comparisons of track errors with TWRF at 0~84-h lead times (a) V1D1 and V2D1 (b) V1D1, V1D2, V2D1 and V2D2 domains from 2016 to 2018. The numbers in parentheses along the x-axis denote the case numbers.
Atmosphere 11 00657 g002
Figure 3. Same as in Figure 2, except for (a,b) the cases with intensity (minimum center sea-level pressure) errors.
Atmosphere 11 00657 g003
Figure 4. Multi-model comparisons among NCEP, ECMWF, and TWRF V2D1 include (a) track, (b) intensity (minimum center sea-level pressure) errors for 2016–2018 with a homogeneous sample. Note that the first two systems are global models. The numbers in parentheses along the x-axis denote the case numbers.
Atmosphere 11 00657 g004
Figure 5. Same as in Figure 4, except for (a,b) the cases with V2D2.
Atmosphere 11 00657 g005
Figure 6. Vertical profile of the RMSE of temperature (T), U-component wind (U), and the relative humidity (RH) at the 24-h (dashed lines), and 72-h (solid lines) forecasts in V1D1 (blue lines) and V2D1 (red lines), verified against NCEP analysis. Composites were made for 2016 and 2018.
Atmosphere 11 00657 g006
Figure 7. Same as in Figure 6 except for the V1D2 and V2D2.
Atmosphere 11 00657 g007
Figure 8. The CWB best tracks and TWRF predicated tracks for Nesat and Haitang starting on 0000 UTC 29 July 2017. Black line with filled typhoon symbols is the observation for Nesat, and open typhoon symbols is for Haitang. The orange lines are the predicted tracks from V1D2, and the purple lines are from the V2D2.
Atmosphere 11 00657 g008
Figure 9. Radar reflectivity (dBZ) for TC Nesat at 6-h forecast (valid for 0600 UTC 29 July 2017) from (a) observation, (b) V2D2 and (c) V1D3.
Atmosphere 11 00657 g009
Figure 10. The azimuthally averaged: (a) tangential (shaded; ms−1) and radial (contour; ms−1) wind speeds, and secondary circulation (vectors, ms−1), (c) temperature anomaly (shaded; °C) and vertical velocity (contour; ms−1) for the V2D2 domain. (b,d) as in (a,c) but for the V1D3 domain, respectively. Results are for a 6-h forecast starting on 0000 UTC 29 July 2017.
Atmosphere 11 00657 g010
Figure 11. Same as in Figure 9 (ac), but for TC Haitang at 30-h forecast (valid for 0600 UTC 30 July 2017).
Atmosphere 11 00657 g011
Figure 12. The 0~24-h accumulated rainfall (mm) from (a) observed, (b) V2D2, and (c) V1D3 initiated at 0000 UTC 29 July 2017. (di) as in panels (ac), except for the 24~48-h and 0~48-h accumulated rainfall, respectively. The digital numbers denote the maximum rainfall which occurred at the position marked as a star sign.
Atmosphere 11 00657 g012
Figure 13. Future plan for the design of choice of multiple inner domains. The blue box is the current operational domain as shown in Figure 1b.
Atmosphere 11 00657 g013
Figure 14. Tracks of Maria in every 6 h from the CWB best track (black line), the blue and red line represented for the forecast track from the original TWRF operation V2D2 (blue line with the blue box in Figure 13) and the 3-km D3s strategy decided nested domain (red line with the red box in Figure 13) for a 102-h forecast starting from 0600 UTC 7 July 2018.
Atmosphere 11 00657 g014
Table 1. The designation using different TWRF versions (V) and resolutions in each domain (D).
DesignationTWRF VersionDomainResolution
V1D1V1outer-most domain45 km
V1D2V1middle domain15 km
V1D3V1inner-most domain5 km
V2D1V2outer domain15 km
V2D2V2inner domain3 km

