Article

Comparison of Assimilating All-Sky and Clear-Sky Satellite Radiance for Typhoon Chan-Hom and Nangka Forecasts

College of Meteorology and Oceanography, National University of Defense Technology, Nanjing 211101, China
*
Author to whom correspondence should be addressed.
Atmosphere 2020, 11(6), 599; https://doi.org/10.3390/atmos11060599
Submission received: 8 May 2020 / Revised: 2 June 2020 / Accepted: 5 June 2020 / Published: 7 June 2020
(This article belongs to the Section Meteorology)

Abstract

:
The impacts of assimilating all-sky satellite radiance from the Advanced Microwave Scanning Radiometer 2 (AMSR2) on typhoon Chan-hom and Nangka are evaluated over traditional clear-sky radiance assimilation. Results show that more AMSR2 radiance data around typhoon core area are assimilated in all-sky experiment than clear-sky, which improves the utilization of satellite radiance data. Community Radiative Transfer Model (CRTM) brightness temperature simulation under all-sky conditions is in better agreement with observations than in the case of clear-sky conditions. In a cycle assimilation experiment, all-sky assimilation reduces typhoon track forecast errors by 14.84%, and intensity errors by approximately 16.89%. Wind, temperature and humidity analysis are clearly improved in all-sky assimilation, as evaluated using the European Center for Medium-Range Weather Forecasts (ECMWF) reanalysis data. All-sky assimilation better captures the structures of typhoons, with a stronger warm core and tighter circulation around the typhoon eye. This study explores the contributions to the improvements in all-sky assimilation. These improvements are attributed to the enhancements in initial geopotential height, temperature and moisture in the typhoon core areas. Moreover, assimilating cloud- and precipitation-affected radiance data improves hydrometer simulations, which leads to higher hydrometeor concentrations than clear-sky radiance and conventional data assimilation. The results demonstrate that assimilation of all-sky AMSR2 data improves the analysis and forecast of multiple typhoons.

1. Introduction

In recent decades, satellite data assimilation has led to improvements in numerical weather prediction, particularly in areas that are not well resolved by in situ measurements [1]. Satellite observations have better spatiotemporal coverage than in situ measurements. In the past, the radiative transfer model was not able to represent the scattering properties of hydrometeors well. Furthermore, because of the poor understanding and predictability of clouds and precipitation, as well as the discontinuous, nonlinear nature of moist atmospheric processes [2], satellite observations are mainly assimilated under clear-sky conditions, discarding a large number of observations in clouds and precipitation area. In infrared channels particularly, most data are rejected because of “cloud contamination” [3]. To date, many studies have applied the clear-sky assimilation method, which only considers satellite radiance data when no clouds are present. These studies have demonstrated that the application of clear-sky radiance assimilation improves weather forecasts [4,5,6,7,8,9]. However, most severe weather is associated with dense clouds and precipitation, leading to cloud area information being missing in clear-sky assimilation. Thus, the inclusion of observations affected by clouds and precipitation in data assimilation has the potential to improve severe weather forecasts.
In recent years, with the developments of the fast radiative transfer model, radiative transfers can be better simulated, even when clouds and precipitation are present [10,11,12]. This has facilitated the assimilation of cloud- and precipitation-affected radiance data, a technique known as all-sky assimilation. The European Centre for Medium-Range Weather Forecasts (ECMWF) has applied all-sky satellite radiance assimilation, directly making use of observations of clouds and precipitation which provide clearly positive effects on short-term forecasts [13,14]. To date, most operational weather forecasting centers assimilate microwave humidity soundings and imaging radiance under all-sky conditions [14,15,16]. In addition, the National Centers for Environmental Prediction (NCEP) have recently reported the assimilation of microwave temperature soundings under all-sky conditions [17].
Recently, the assimilation of infrared measurement under all-sky conditions has been performed, showing great benefits to weather forecasts [18,19,20,21,22,23].
Despite the improvement of weather forecasting, typhoon prediction has always been challenging. Since typhoons are located primarily over ocean, with little in the way of in situ observations, satellite data play an important role in typhoon forecasts. Furthermore, a large amount of data for the area around the typhoon centers, where clouds and precipitation are prevalent, are discarded in clear-sky assimilation. In that case, all-sky satellite data assimilation better utilizes satellite observations affected by clouds and precipitation, which has the potential to produce better structures in the center area of typhoons. Recently, there are increasing cases of multiple typhoons existing at the same time in the north-western area of the Pacific Ocean. The interactions among coexisting typhoons or their effects on the environment make multiple typhoons difficult to predict. Although studies have shown that all-sky assimilation improves single typhoon forecasts [24,25], few studies evaluated the performance of all-sky satellite data assimilation when more typhoons coexist. [26]. Therefore, this study uses the three-dimensional variational (3DVar) method to assimilate satellite radiance data under all-sky conditions, and compares the impact of all-sky and clear-sky assimilation on coexisting typhoon forecasts. The rest of this paper is organized as follows: Typhoon cases are introduced in Section 2. Section 3 describes the application of all-sky assimilation methodology. The results and discussions are presented in Section 4. Finally, Section 5 presents the summary of this paper.

2. Typhoons Chan-Hom and Nangka

Chan-hom and Nangka occurred in 2015 and are used for the evaluation. The precursor vortex of Chan-hom appeared on 25 June. It was defined as a tropical depression at 0000 UTC on 30 June, and was classified as a tropical storm at 1800 UTC on 30 June. At 1200 UTC on 6 July, Chan-hom was upgraded as a typhoon with a minimum sea-level pressure (MSLP) of 974 hPa and a maximum surface wind speed (MSWS) of 65 knots, and was located at (139.6° E, 17.4° N). Chan-hom moved toward the northwest until it made its first landfall near Zhoushan, Zhejiang Province, China at 0600 UTC on 11 July 2015. After that, Chan-hom turned to northeast, moving across the Yellow Sea towards the Korean Peninsula, landing on the Korean Peninsula On 13 July. During the same period of Chan-hom’s development, Nangka appeared over the middle of the Pacific Ocean as a tropical depression at 1800 UTC on 3 July. It continued to move westwards and grew to typhoon strength at 0600 UTC on 6 July 2015, and was located at (158.7° E, 11.9° N). At 0600 UTC on 9 July, Nangka quickly strengthened, becoming a super typhoon until 1800 UTC on 9 July. Initially, Nangka moved west and northwest, and then suddenly turned northward to Japan at 0600 UTC on 12 July 2015, and finally landed in Japan at 2000 UTC on 16 July, as a tropical storm. Chan-hom and Nangka coexist during the period of 3 July to 13 July, with a minimum distance of approximately 1900 km. According to Brand (1970), these two typhoons had a relatively weak interaction [27].
Figure 1 shows the best tracks of Chan-hom and Nangka from the Joint Typhoon Warning Center (JTWC).

3. All-Sky Assimilation Methodology

3.1. Quality Control

The Advanced Microwave Scanning Radiometer 2 (AMSR2) onboard the Global Change Observation Mission 1-Water (GCOM-W1) satellite is selected to assimilate in this study. As a successor to the Advanced Microwave Scanning Radiometer for the Earth Observing System (AMSR-E), the GCOM-W1 satellite with AMSR2 was launched by the Japan Aerospace Exploration Agency (JAXA) in May 2012. AMSR2 is a microwave imager that provides accurate measurements of the intensities of microwave emissions and scattering. It inherits most of the characteristics of AMSR-E, with two additional 7.3 GHz channels (horizontal and vertical polarizations) to mitigate radio frequency interference (RFI) in the C-band. AMSR2 is more spatially resolved than AMSR-E, with a scanning angle of 47.5° from ~700 km above the earth [28]. AMSR2 has 14 channels covering 7 frequencies from 6.925 to 89.0 GHz, with both horizontal and vertical polarizations [29]. The observations from AMSR2 channel 5–12, whose frequencies are between 10.65 and 36.5 GHz, are assimilated in this study. AMSR2 has a series of products at three levels. In this work, level 1 radiance data are used in the assimilation, and level 2 cloud liquid water path (CLWP) data [30] are used for quality control (QC).
The QC procedure is divided into clear-sky QC and all-sky QC. Clear-sky radiance QC includes the following [25]: (1) discarding all data over land; (2) for the 10.65 GHz channel, considering data whose ‘sun glint angles’ are <25° as bad data and discarding them; (3) for cloud detection, rejecting data that exceed the QC thresholds listed in Table 1 [25]; (4) for innovation (observation brightness temperature minus simulation brightness temperature from the background) checking and rejecting data that exceed the prescribed thresholds (Table 1); (5) rejecting data whose innovation is more than three times the observation error standard deviation (Table 2) [25]. For all-sky radiance QC, steps 3 (cloud detection) and 4 (innovation check) are omitted, so that cloud- and precipitation-affected radiance data are included in the assimilation.
After QC, data considered “bad” according to the procedure described above are discarded. Results from AMSR2 channel 10 are taken as an example (Figure 2) to demonstrate the difference between clear-sky and all-sky QC. Figure 2 gives the CRTM simulated brightness temperature for the pixels after QC procedure. At 1800 UTC on 9 July, pixels of Chan-hom and Nangka are almost entirely discarded after QC under clear-sky conditions, and only 29,489 pixels are assimilated, ~59% of the total pixels in the study area. In contrast, observations of both typhoons are retained under all-sky conditions, and 43,735 pixels are assimilated, accounting for 87.7% of the total pixels. Thus, the number of observations assimilated is greater for all-sky assimilations.
Figure 3 shows the difference in the number of pixels assimilated between the clear-sky and all-sky experiments, in which there are a total of 49,891 pixels (blue dash line in Figure 3) for each channel. Under clear-sky conditions, the number of pixels assimilated is generally between 20,000 and 30,000, with a maximum of 31,642 and a minimum of 21,725, which means that almost half of the observations are discarded during QC. The number of pixels assimilated under all-sky conditions is noticeably higher, with a maximum of 46,263 and a minimum of 34,263. On average, relative 46.1% more pixels are assimilated under all-sky conditions compared to clear-sky, improving the utilization of AMSR2 data. Furthermore, these additional pixels are primarily located in the typhoon area, and can be used to improve simulations of the structure of typhoons.

3.2. Moist Control Variable Selection

To assimilate AMSR2 radiance, the 3DVAR method of the WRFDA (Weather Research and Forecasting model’s data assimilation) system is used here. The 3DVAR cost function is defined as follows:
J ( x 0 ) = 1 2 ( x 0 x b ) T B 1 ( x 0 x b ) + 1 2 ( H ( x 0 ) y o b s ) T R 1 ( H ( x 0 ) y o b s ) ,
where x 0 is the atmospheric state vector, x b is the background state, y o b s is the observation vector, H is the observation operator, R and B are the error covariance matrices for observations and background, respectively. For the observation error of AMSR2, we follow the statistic results of Yang et al. [25] in WRFDA. Here, CRTM-2.2.3 is used for the observation operator, H [31]. The variational bias correction method (VarBC) in WRFDA is applied to correct systematic error of radiance [32], which is same for clear-sky and al-sky assimilation. Though it may be suboptimal, it works in practice [25].
In clear-sky experiment, there are five control variables in 3DVAR: the stream-function (ψ), unbalanced velocity potential ( χ u ), unbalanced temperature (Tu), unbalanced surface pressure (Ps,u), and pseudo relative humidity (RHs) [33]. The National Meteorological Center (NMC) method [34] is used to calculate the background error (BE) for clear-sky radiance assimilation.
All-sky assimilations need to include the moist control variable, which can produce the increments of hydrometers, such as cloud liquid water and rainwater. However, because of the discontinuous nature of hydrometers, this will result in errors of zero in most of the domain grid points when calculating the background error statistics using the NMC method [35]. Therefore, the total water control variable qt is used as the moist control variable instead of RHs [36], with qt defined as
q t = q v + q c + q r ,
where qv is the water vapor mixing ratio, qc is the cloud water mixing ratio and qr is the rainwater mixing ratio. By choosing qt as the control variable, we need to obtain increments of the other three variables above. The tangent linear (TL) and its adjoint (AD) from the warm-rain scheme is applied [37]. The warm-rain scheme introduces a constraint among rainwater, cloud water, moisture and temperature. When increments of qt are obtained during the 3DVAR minimization process, the increments of other variables (qv, qc and qr) can be partitioned from qt, using TL and AD (under the constraint of the warm-rain scheme) [35].

3.3. Experiment Design

In order to evaluate the impacts of all-sky AMSR2 radiance assimilation on selected typhoons case, three experiments are set up in this study. The first experiment (CON) only assimilates conventional data from NCEP [38], including aircraft, ship, sounding, buoy, GPS refractivity, and surface land reports (Synoptic and Metar). The second experiment (CLEARSKY) assimilates conventional and AMSR2 clear-sky observations. The last experiment (ALLSKY) assimilates conventional and AMSR2 all-sky observations.
The cycling forecast-analysis experiments are carried out from 0000 UTC 8 July to 1800 UTC 11 July. The analysis is generated every 6 h (at 0000, 0600, 1200, 1800 UTC), with the background of 6-h Advanced Research-Weather Research and Forecasting model (ARW-WRF) forecast initiated from the previous cycle’s analysis, except for the first time. The first analysis time is set at 0000 UTC 8 July, with the background of 6-h forecast initiated from the NCEP Global Forecast System (GFS) analysis. All data within ±3 h of the analysis time are thinned to 10 km.
In addition, 72-h forecasts are made from each analysis time using WRF 4.0 model. For example, the first forecast is made from 0000 UTC 8 July to 0000 UTC 11 July, the second from 0600 UTC 8 July, and the last from 1800 UTC 11 July. The initial field of each forecast will be the analysis after assimilation. A single domain with 10 km resolution is used, with 320 × 320 horizontal grids and 35 vertical levels, in which the top level of the model is 50 hPa. The primary physical parameterization schemes used are listed in Table 3.

3.4. Clear-Sky and All-Sky CRTM Simulations

This paper uses CRTM-2.2.3 as the observation operator. For clear-sky assimilation, the clear-sky-CRTM is employed, requiring only the primary atmospheric variables, such as temperature, pressure, and wind, without cloud or precipitation information. However, under all-sky conditions, the CRTM cloud model needs to be activated and must be provided with hydrometeor profiles (cloud water, cloud ice, rain, snow, graupel, hail) [36].
Figure 4 shows the observed and simulated brightness temperature (TB) in the CLEARSKY and ALLSKY experiments at 1800 UTC on 9 July, as Chan-hom approached Taiwan at (127° E, 24° N), and Nangka was located near (144° E, 18° N). The satellite scanned the study area twice within the assimilation window, with almost complete coverage of Chan-hom and Nangka. From the observed TB, Chan-hom is found to have a large cloud band that nearly extends from Japan in the north to Taiwan in the west. In contrast, Nangka’s cloud band is more concentrated near the typhoon center area. The TB for both typhoon areas is higher than the surrounding sea-surface, except for in the eye area. When assimilating clear-sky data (Figure 4b,e), the CRTM is not provided with cloud variables. Therefore, TB simulations differ considerably from observations, and only provide the general locations of both typhoons. For typhoon intensity, CRTM simulations without hydrometeor profiles are significantly biased and TB values in the typhoon area are lower than observations. Those pixels with large bias will be discarded through the QC procedure (Section 3.1), which are mainly located in cloud and precipitation area (Figure 2). However, when assimilating all-sky data, the CRTM includes the profiles of hydrometeors and the TB simulations are noticeably closer to observations than clear-sky assimilation. Especially in the typhoon core area, all-sky CRTM simulations obviously have a more noticeable cloud band. However, negative bias still shows outside the typhoon core area in all-sky simulation. Therefore, though the radiative transfer model is developed in the all-sky condition, there are still errors in it. Figure 2 and Figure 3 also demonstrate that not all observations are assimilated in the all-sky experiment, and those with large bias will be discarded in the QC procedure. Overall, more agreement can be found in all-sky CRTM simulations with observations. As a result, more pixels in the typhoon’s central area are assimilated (Figure 2).

4. Results and Discussions

4.1. Statistical Results from All Cycles

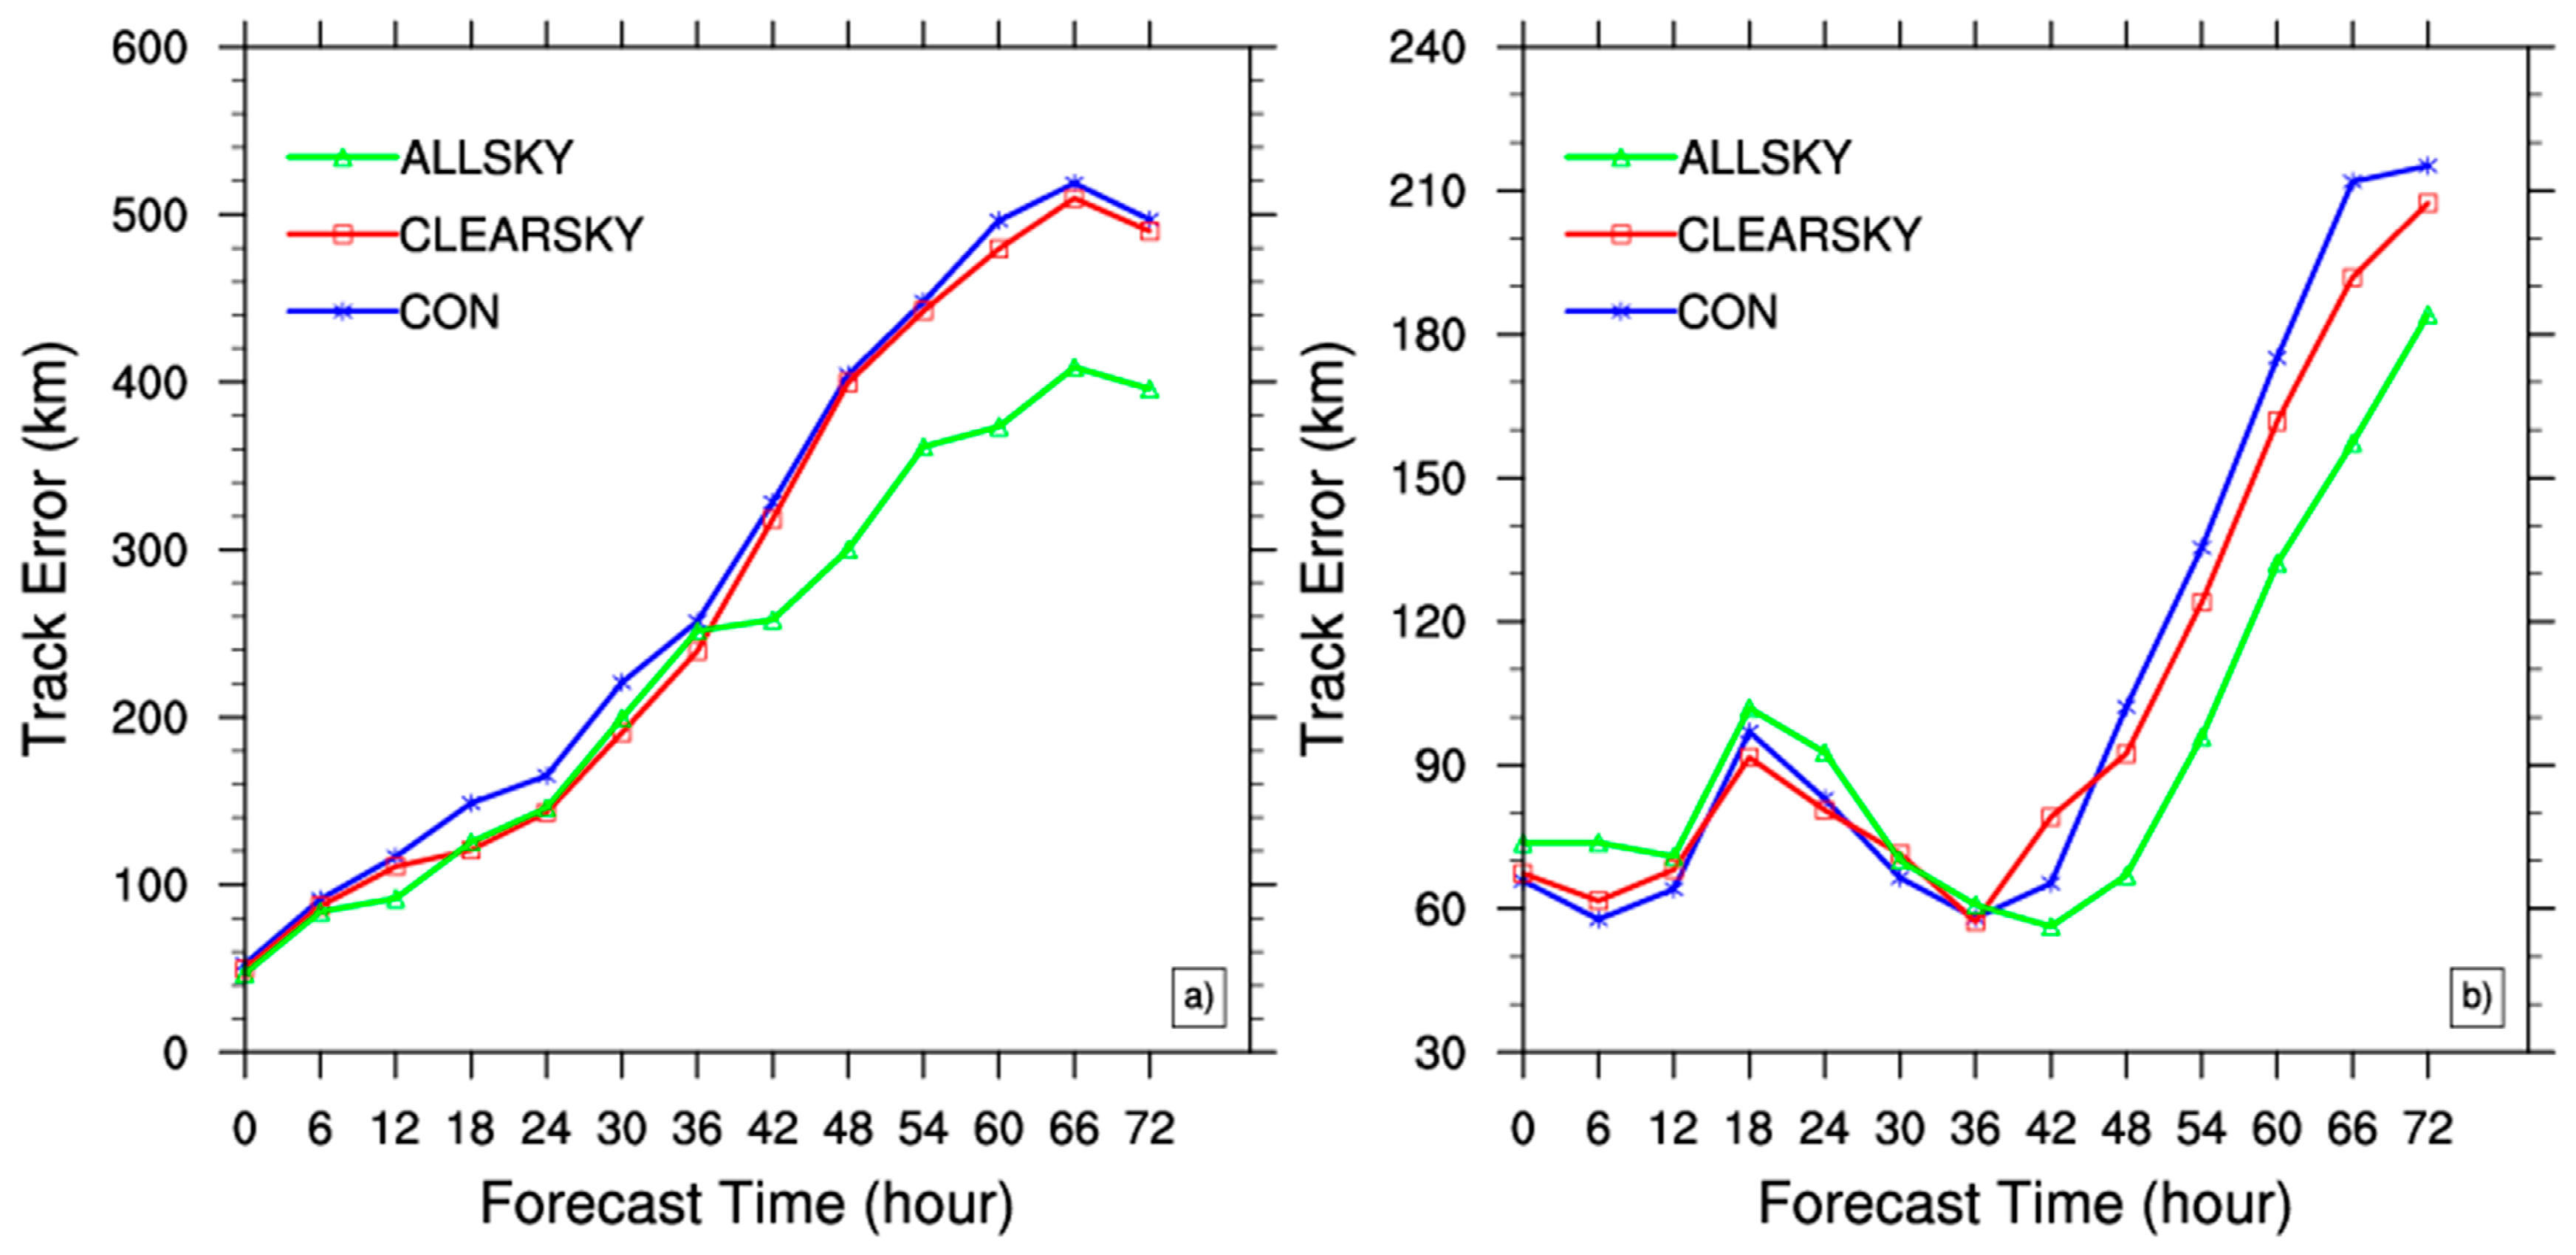
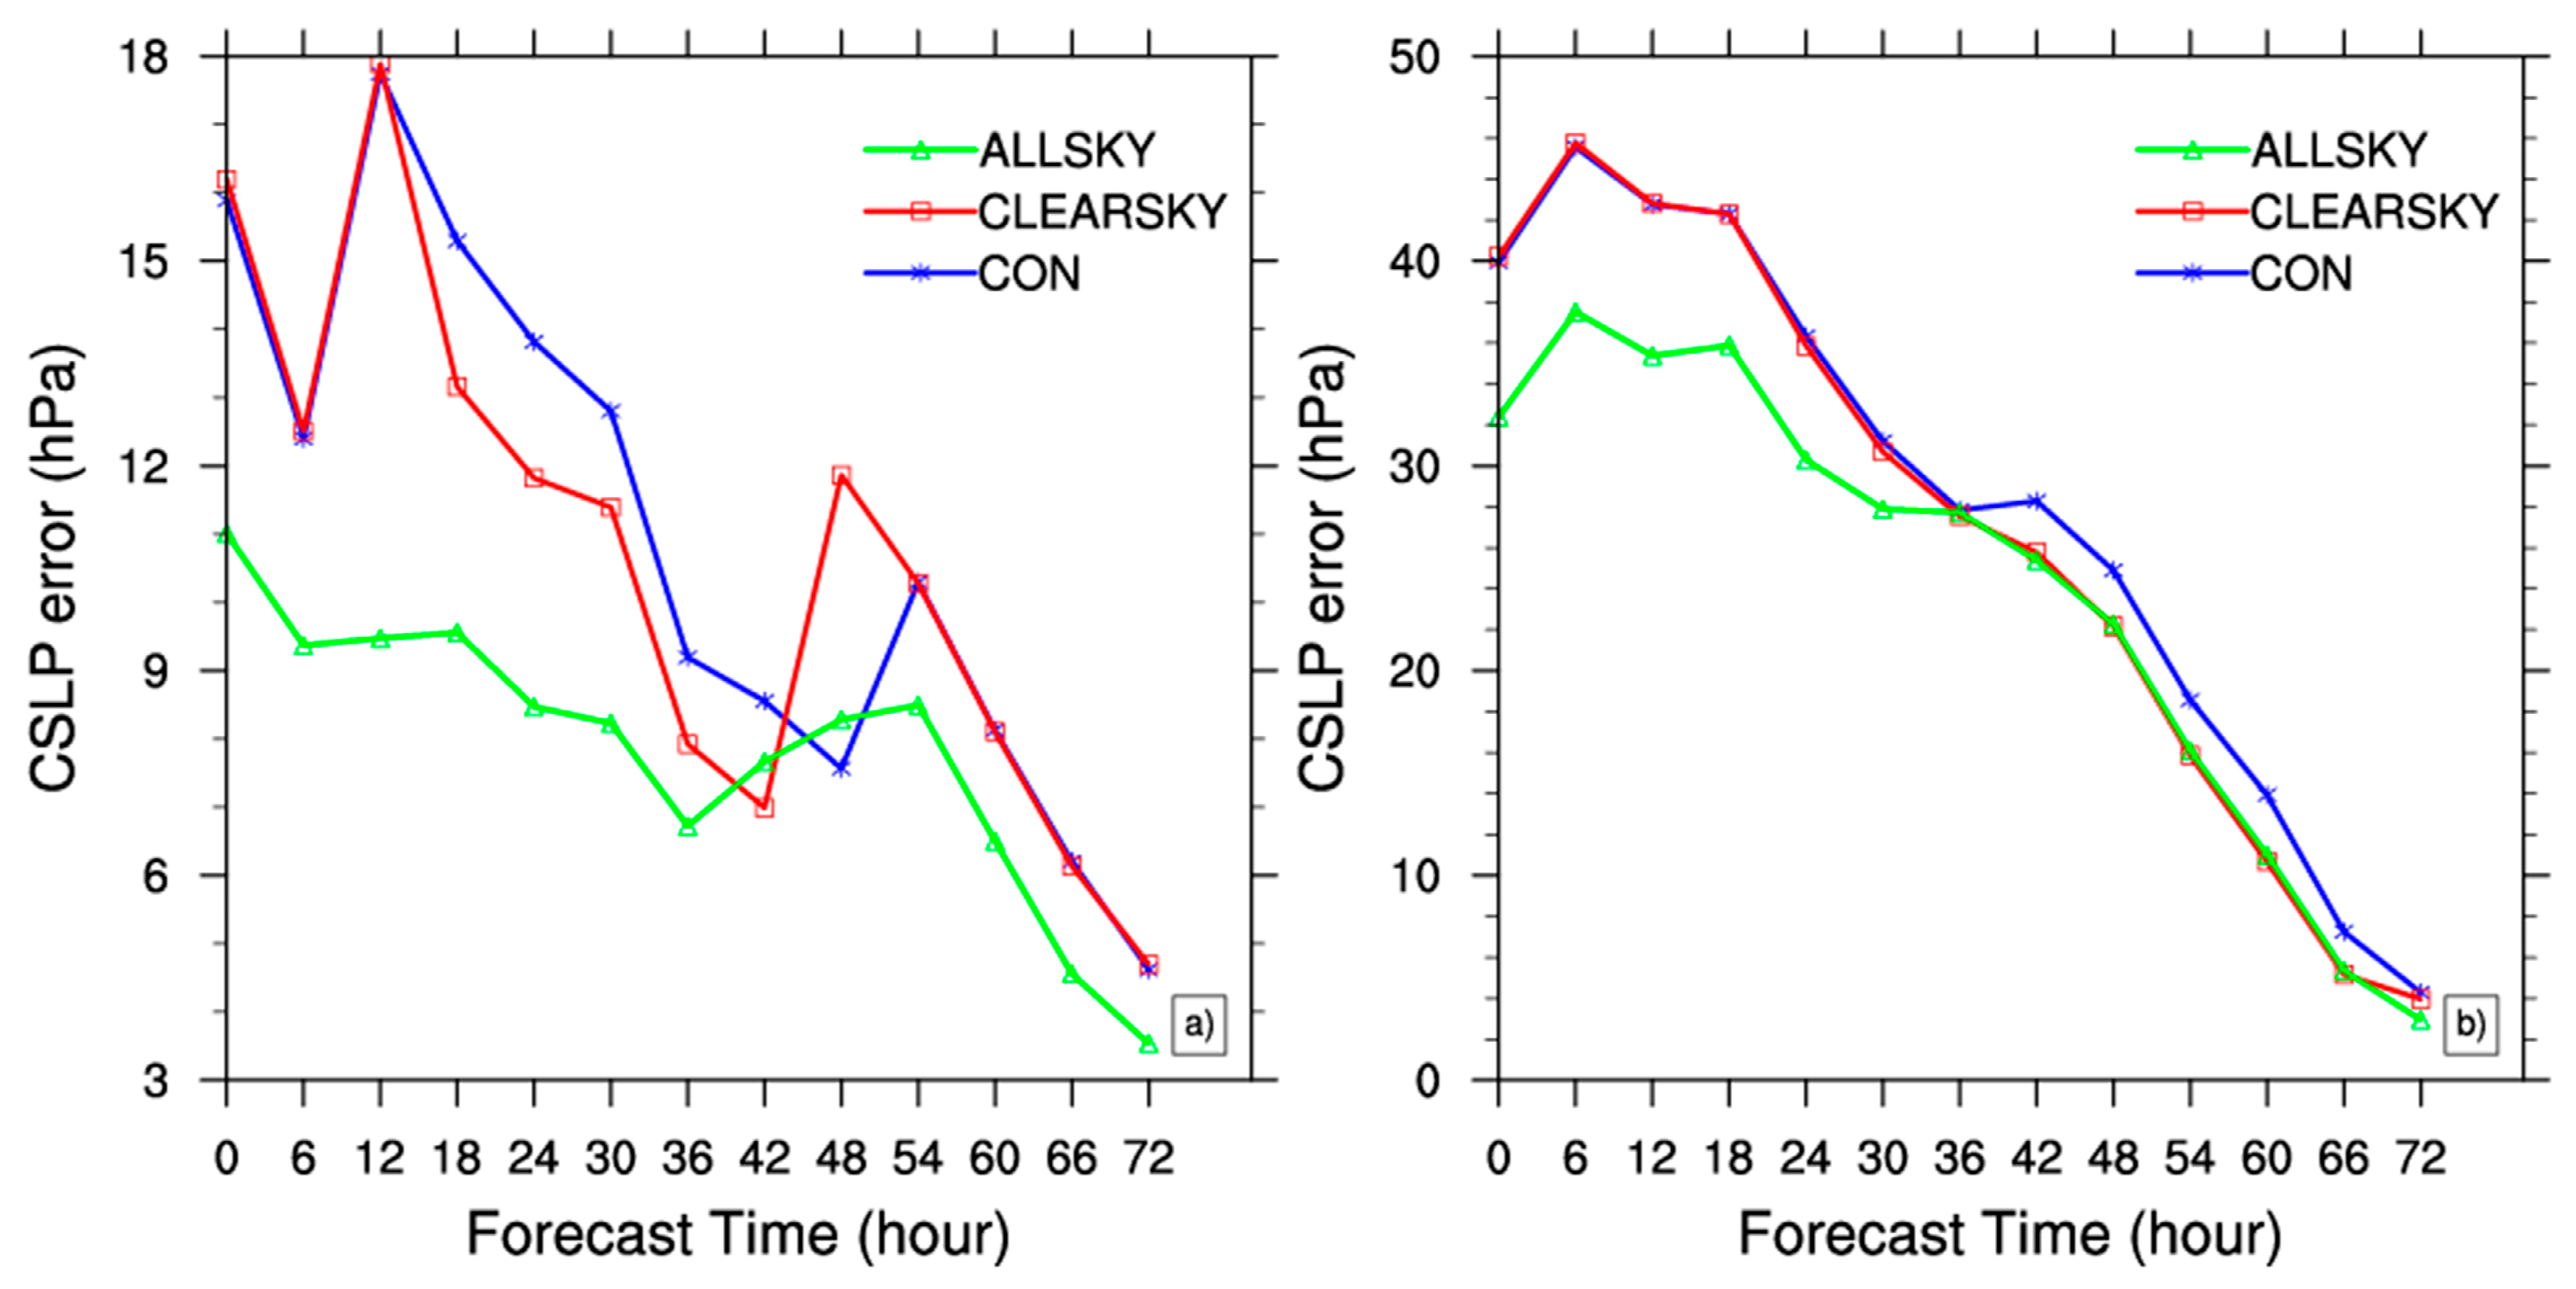
4.1.1. Impacts on Track and Intensity Forecasts

The impacts on typhoon track and intensity forecasts are evaluated by all the WRF forecasts we obtained in the cycling experiments. Figure 5 shows the averaged track errors from CON, CLEARSKY and ALLSKY experiments for Chan-hom and Nangka against JTWC best track data. The errors are averaged from all the forecasts in the cycle. We can find that the track errors increase as the forecast lead time increases. For Chan-hom, the ALLSKY experiment clearly reduces the track errors. All-sky assimilation clearly outperforms the other experiments after 36-h forecast, which improves the typhoon track significantly. Like Chan-hom, all-sky assimilation also improves the Nangka track forecast after about 36-h forecast, and then keeps the smallest track errors compared to CON and CLEARSKY experiments.
The statistical central sea level pressure (CSLP) errors are shown in Figure 6. Unlike the track errors, the CSLP errors decrease as the forecast lead time increases. For Chan-hom, the ALLSKY experiment almost maintains the lowest errors compared with CON and CLEARSKY. For Nangka, the ALLSKY experiment reduces the CSLP error significantly during the first 36 h. After that, consistent improvements are obtained in the CLEARSKY and ALLSKY experiments which are better than the CON experiment. We infer that because the typhoons were so strong, both typhoons’ CSLP were lower than 960 hPa at in the first analysis. Therefore, the typhoon intensities of all three experiments are weaker than observations made at beginning. However, as the forecast time increases, both the typhoon intensities are both improved, subsequently causing the CSLP errors to decrease later. Particularly with all-sky assimilation, a clear reduction can be found in intensity forecasts.
According to the average statistics over all the forecasts in the cycling experiments, the ALLSKY experiment reduces the track errors by 11.78% for Chan-hom, 17.89% for Nangka, and CSLP errors by 25.31% for Chan-hom and 8.64% for Nangka, when compared with the CLEARSKY experiment. Averaged on two typhoons, all-sky assimilation improves typhoons track forecast by 14.84%, and intensity forecast by 16.89%. The intensity forecasts are clearly improved in all-sky assimilation. We infer that the reason may be that all-sky assimilation better strengthens the initial typhoon intensity. The specific contribution will be discussed in the following sections. Overall, the forecast results of all-sky assimilation outperform those of clear-sky assimilation.

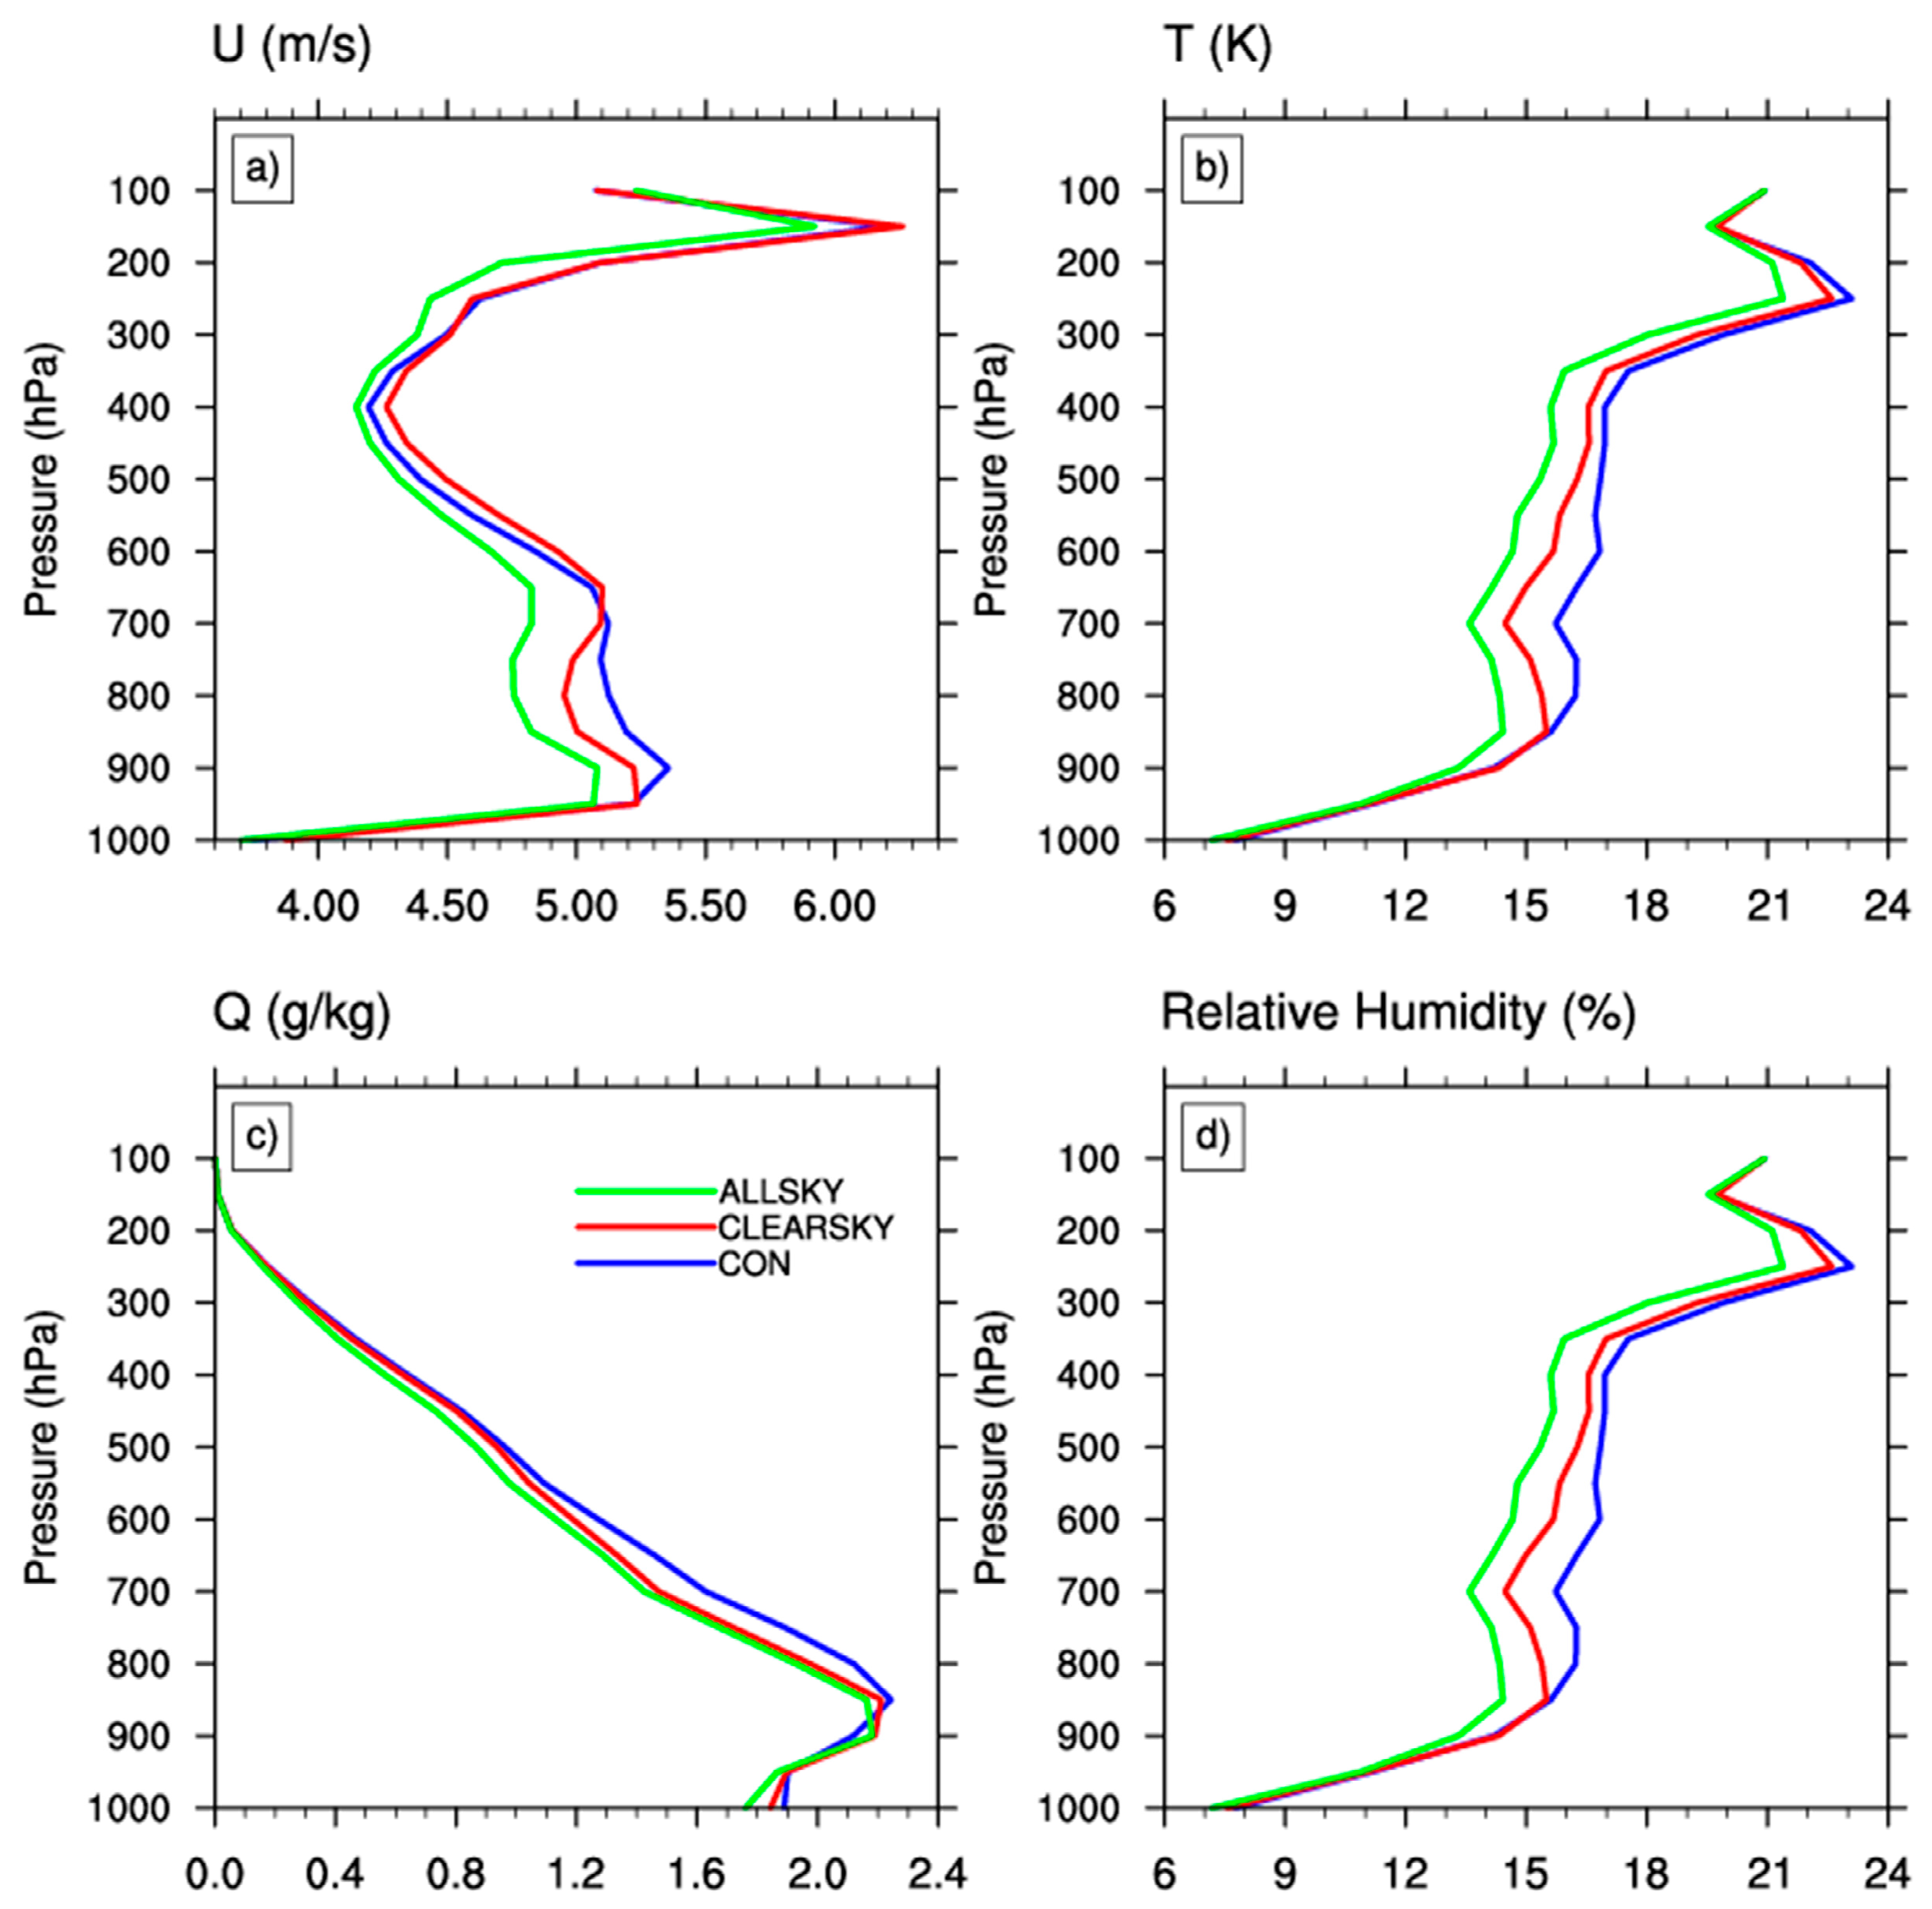
4.1.2. Impacts on the Analysis Fields

In order to quantitatively evaluate the assimilation impacts in the cycling experiment, we also calculate the average root-mean-squared error (RMSE) profiles of the analysis field. The 0.125 × 0.125° ECMWF reanalysis [39] is used for observations. Figure 7 shows the averaged RMSE for all the analyses of horizonal wind, temperature, water vapor mixing ratio and relative humidity. For the U component of horizonal wind, ALLSKY clearly outperforms the CLEARSKY and CON experiments with a range from about 950 hPa to 100 hPa and with the largest improvements found to be of around 700 hPa. For temperature, a positive impact of mostly from 850 hPa to 200 hPa is also shown in the ALLSKY experiment. Assimilation of AMSR2 radiance clearly reduces the RMSE of the water vapor mixing ratio when compared to CON. In comparison, The RMSE of all-sky assimilation is close to clear-sky assimilation, with slight improvements. For relative humidity, the ALLSKY experiment apparently shows a smaller RMSE than the CLEARSKY and CON experiments. The improvements are almost from 850 hPa to 150 hPa.
Overall, the ALLSKY experiment outperforms CLEARSKY and CON in the analysis field. The improvements in track and intensity forecast are due to the improvement in the analysis field.

4.2. Results from One Cycle

4.2.1. Track and Intensity Forecasts

Since the aggregated impacts of analysis and forecast have been evaluated with improvement on coexisting typhoons, we aim to further reveal how all-sky assimilation changes typhoons forecast through a case in the cycling experiments (1800 UTC 9 July 2015).
The typhoons track and intensity forecast results from all three experiments are verified against best-track data from JTWC (Figure 8, Figure 9 and Figure 10). The 72-h track forecasts of the two typhoons are presented in Figure 8. For Chan-hom, all the forecasts of three experiments seem to be slower than the best-track data. The best-track data indicate landfall on the Korean Peninsula, whereas Chan-hom in all three experiment approaches the Shandong Peninsula. However, assimilating AMSR2 data results in better track forecasts than the control experiment, with the ALLSKY experiment being the closest to the best-track data, compared with CON and CLEARSKY. In addition, Chan-hom noticeably shifts direction at 1600 UTC on 11 July, from northwest to northeast near Ningbo, Zhejiang Province. Of the three experiments, only the ALLSKY experiment captured this shift at the same time as the best-track data. The CON and CLEARSKY experiments both simulate the shifts six hours later than the best-track data, at a more westerly location. For Nangka, the best-track data indicate westward movement and turning northwest at the end of the experiment period. All the forecasts of the three experiments simulate the northwest turn earlier than the best-track data, and result in movement farther northward. The ALLSKY has the closest track to the best-track data. Figure 9 shows the track errors against the best-track data for the 72-h forecasts. At the beginning, the ALLSKY experiment evidently improves the typhoon position, with the lowest track errors compared to CON and CLEARSKY. The track errors of both typhoons increase noticeably with forecast time. Consistent with Figure 8, the ALLSKY experiment has the lowest track error for both typhoons throughout almost the entire study period.
Central sea-level pressure (CSLP) errors of 72-h forecasts of Chan-hom and Nangka are given in Figure 10. For Chan-hom, the ALLSKY experiment noticeably decreases CSLP errors, particularly within the 6–48 h period. The hourly averaged CSLP errors of the three experiments are 11.89 hPa, 10.91 hPa and 6.90 hPa, among which ALLSKY is the lowest. For Nangka, although there is a less obvious improvement compared with Chan-hom, the ALLSKY experiment still has the lowest CSLP errors throughout the forecast period. These results show that the ALLSKY experiment improves typhoon intensity forecasts. Overall, assimilating AMSR2 radiance data, especially under all-sky conditions, improves Chan-hom and Nangka track forecasts. Furthermore, all-sky assimilation evidently improves typhoons intensity forecasts, improving Chan-hom CSLP forecast by 36.72% relative to CLERSKY experiment, and improving Nangka CSLP forecast by 11.09%. Therefore, all-sky assimilation averagely improves the coexisting typhoon CSLP forecast by 23.91% when compared with clear-sky assimilation. In all, the improvement of typhoon Chan-hom intensity forecast is bigger than that of Nangka. From Figure 2 in Section 3.1, it is clear that AMSR2 scans twice in the model domain. Chan-hom is fully covered by the left scan, and Nangka partly covered by the right one. In this case, more AMSR2 data are assimilated for Chan-hom than Nangka. Especially with all-sky assimilation, more data in Chan-hom core area are included in assimilation, which has the potential to directly improve the typhoon structure in the central area, which will be discussed in the following sections.

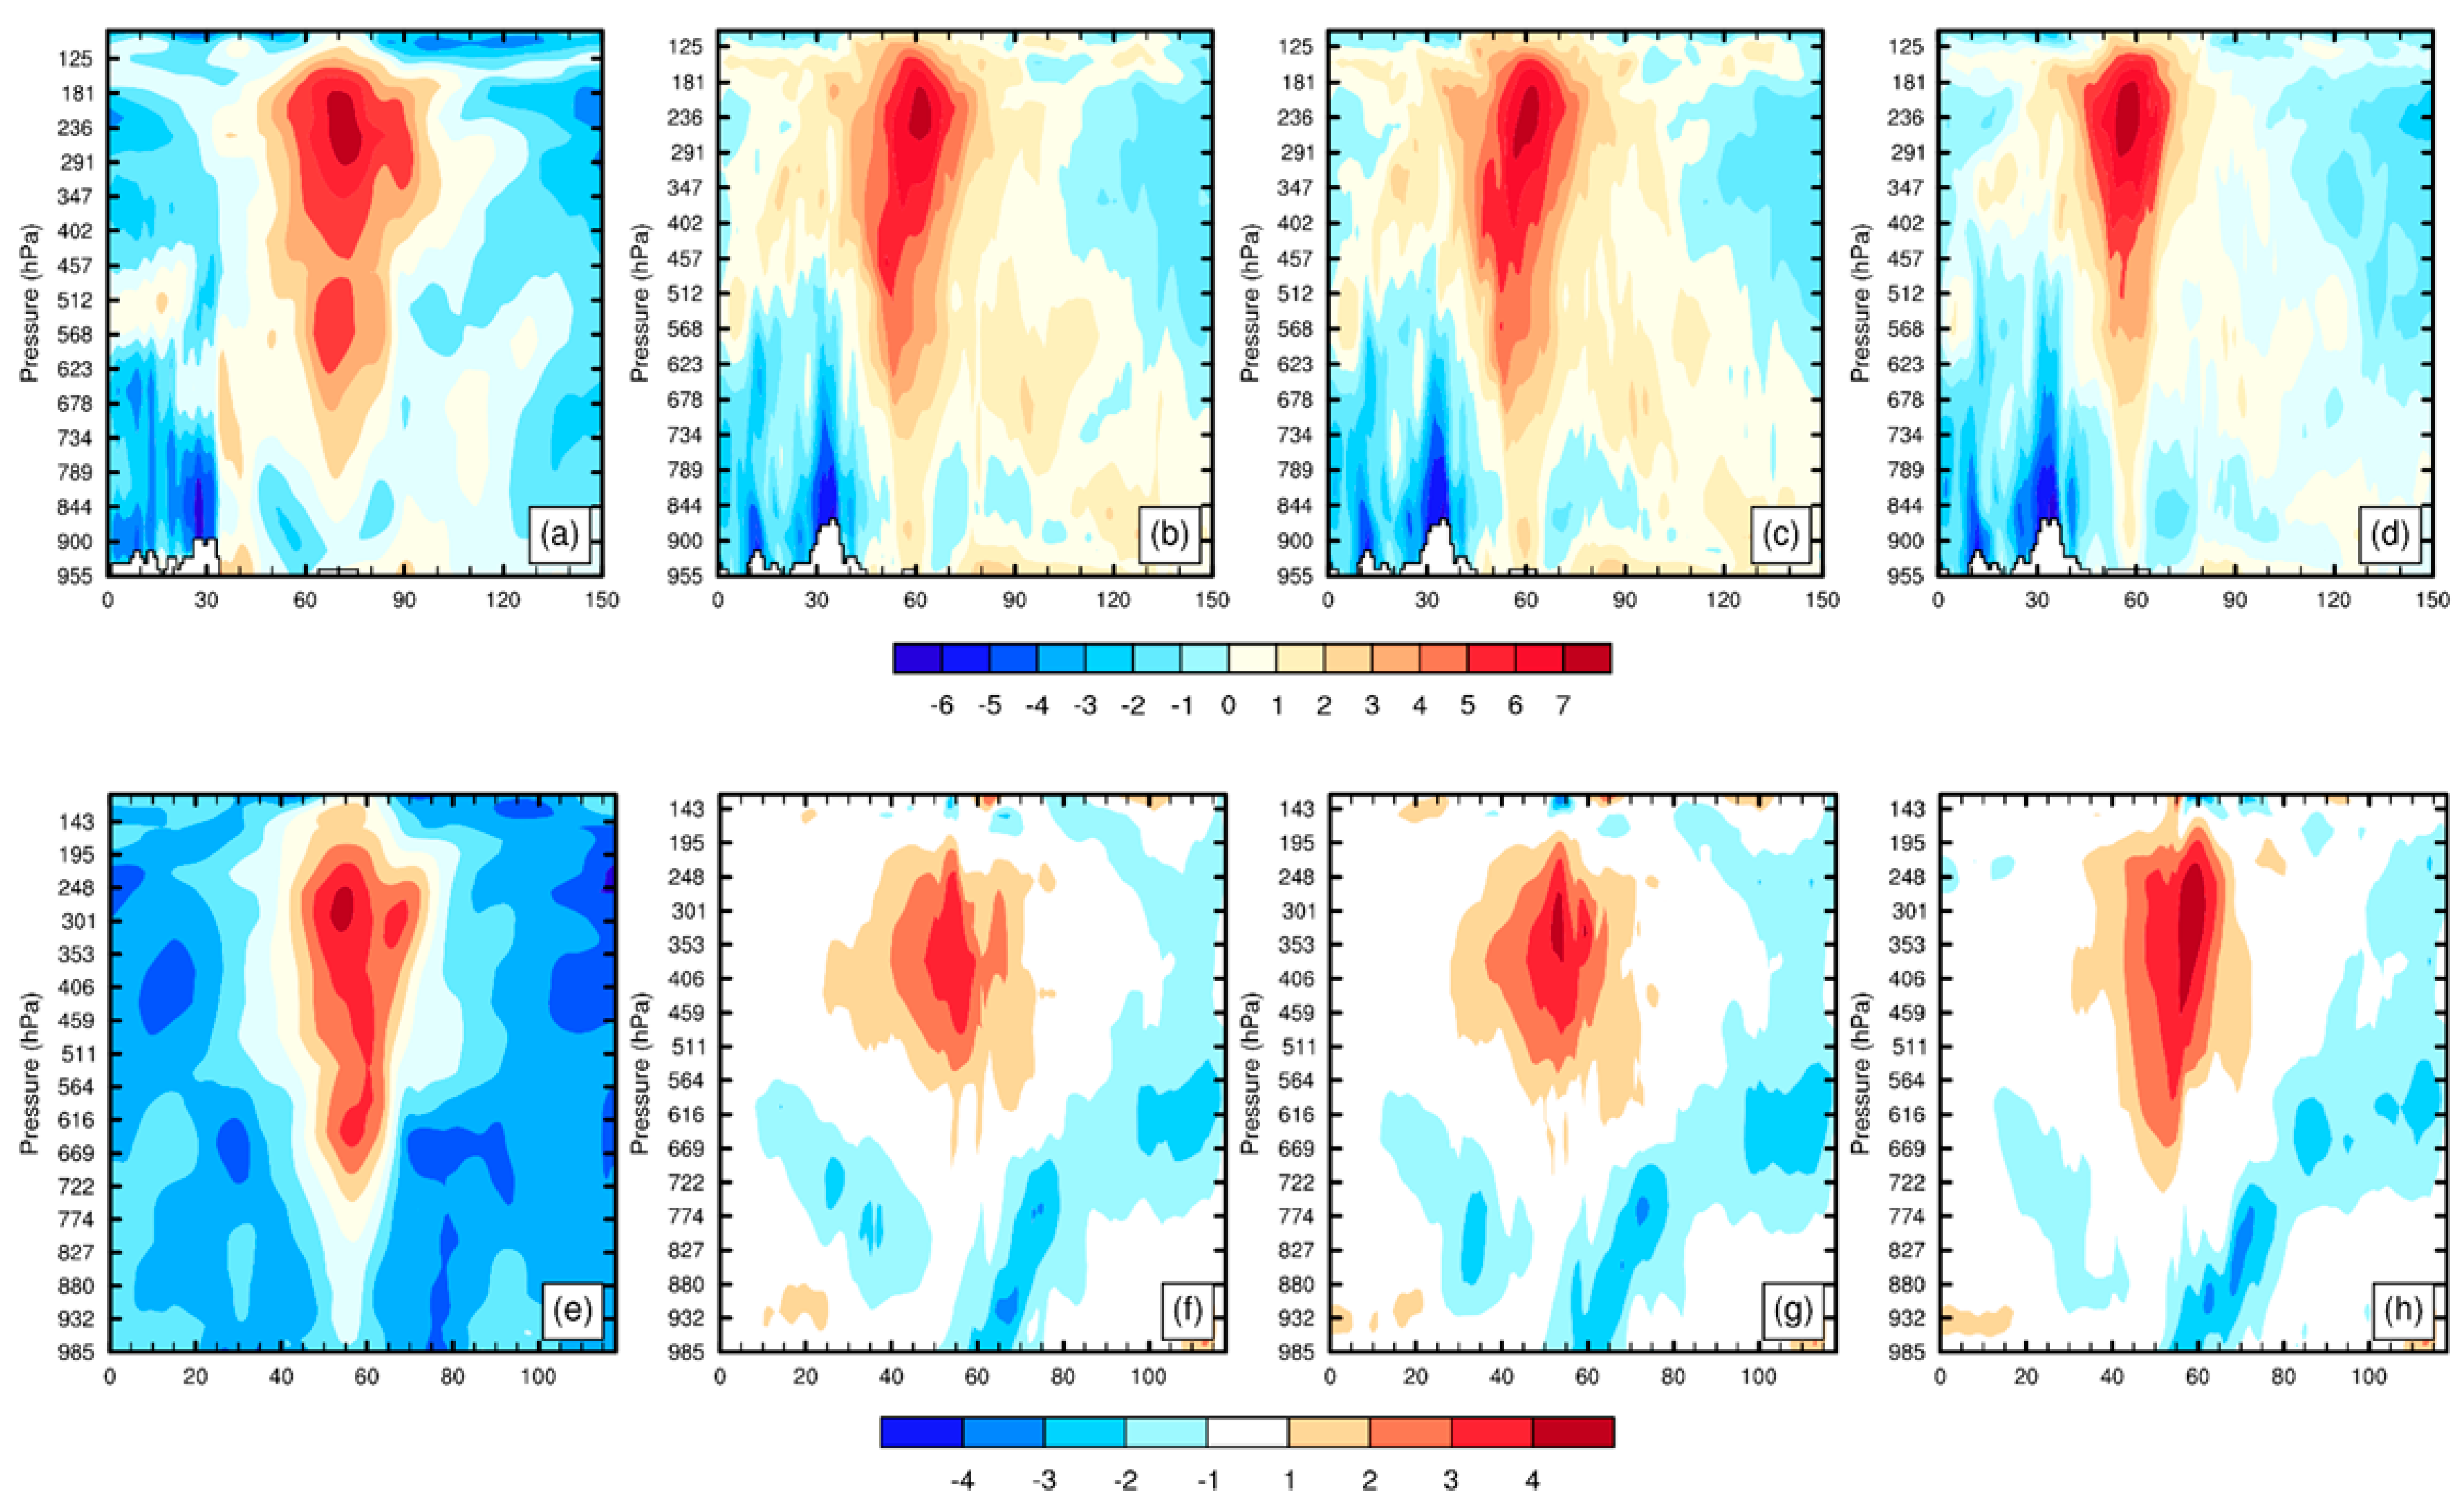
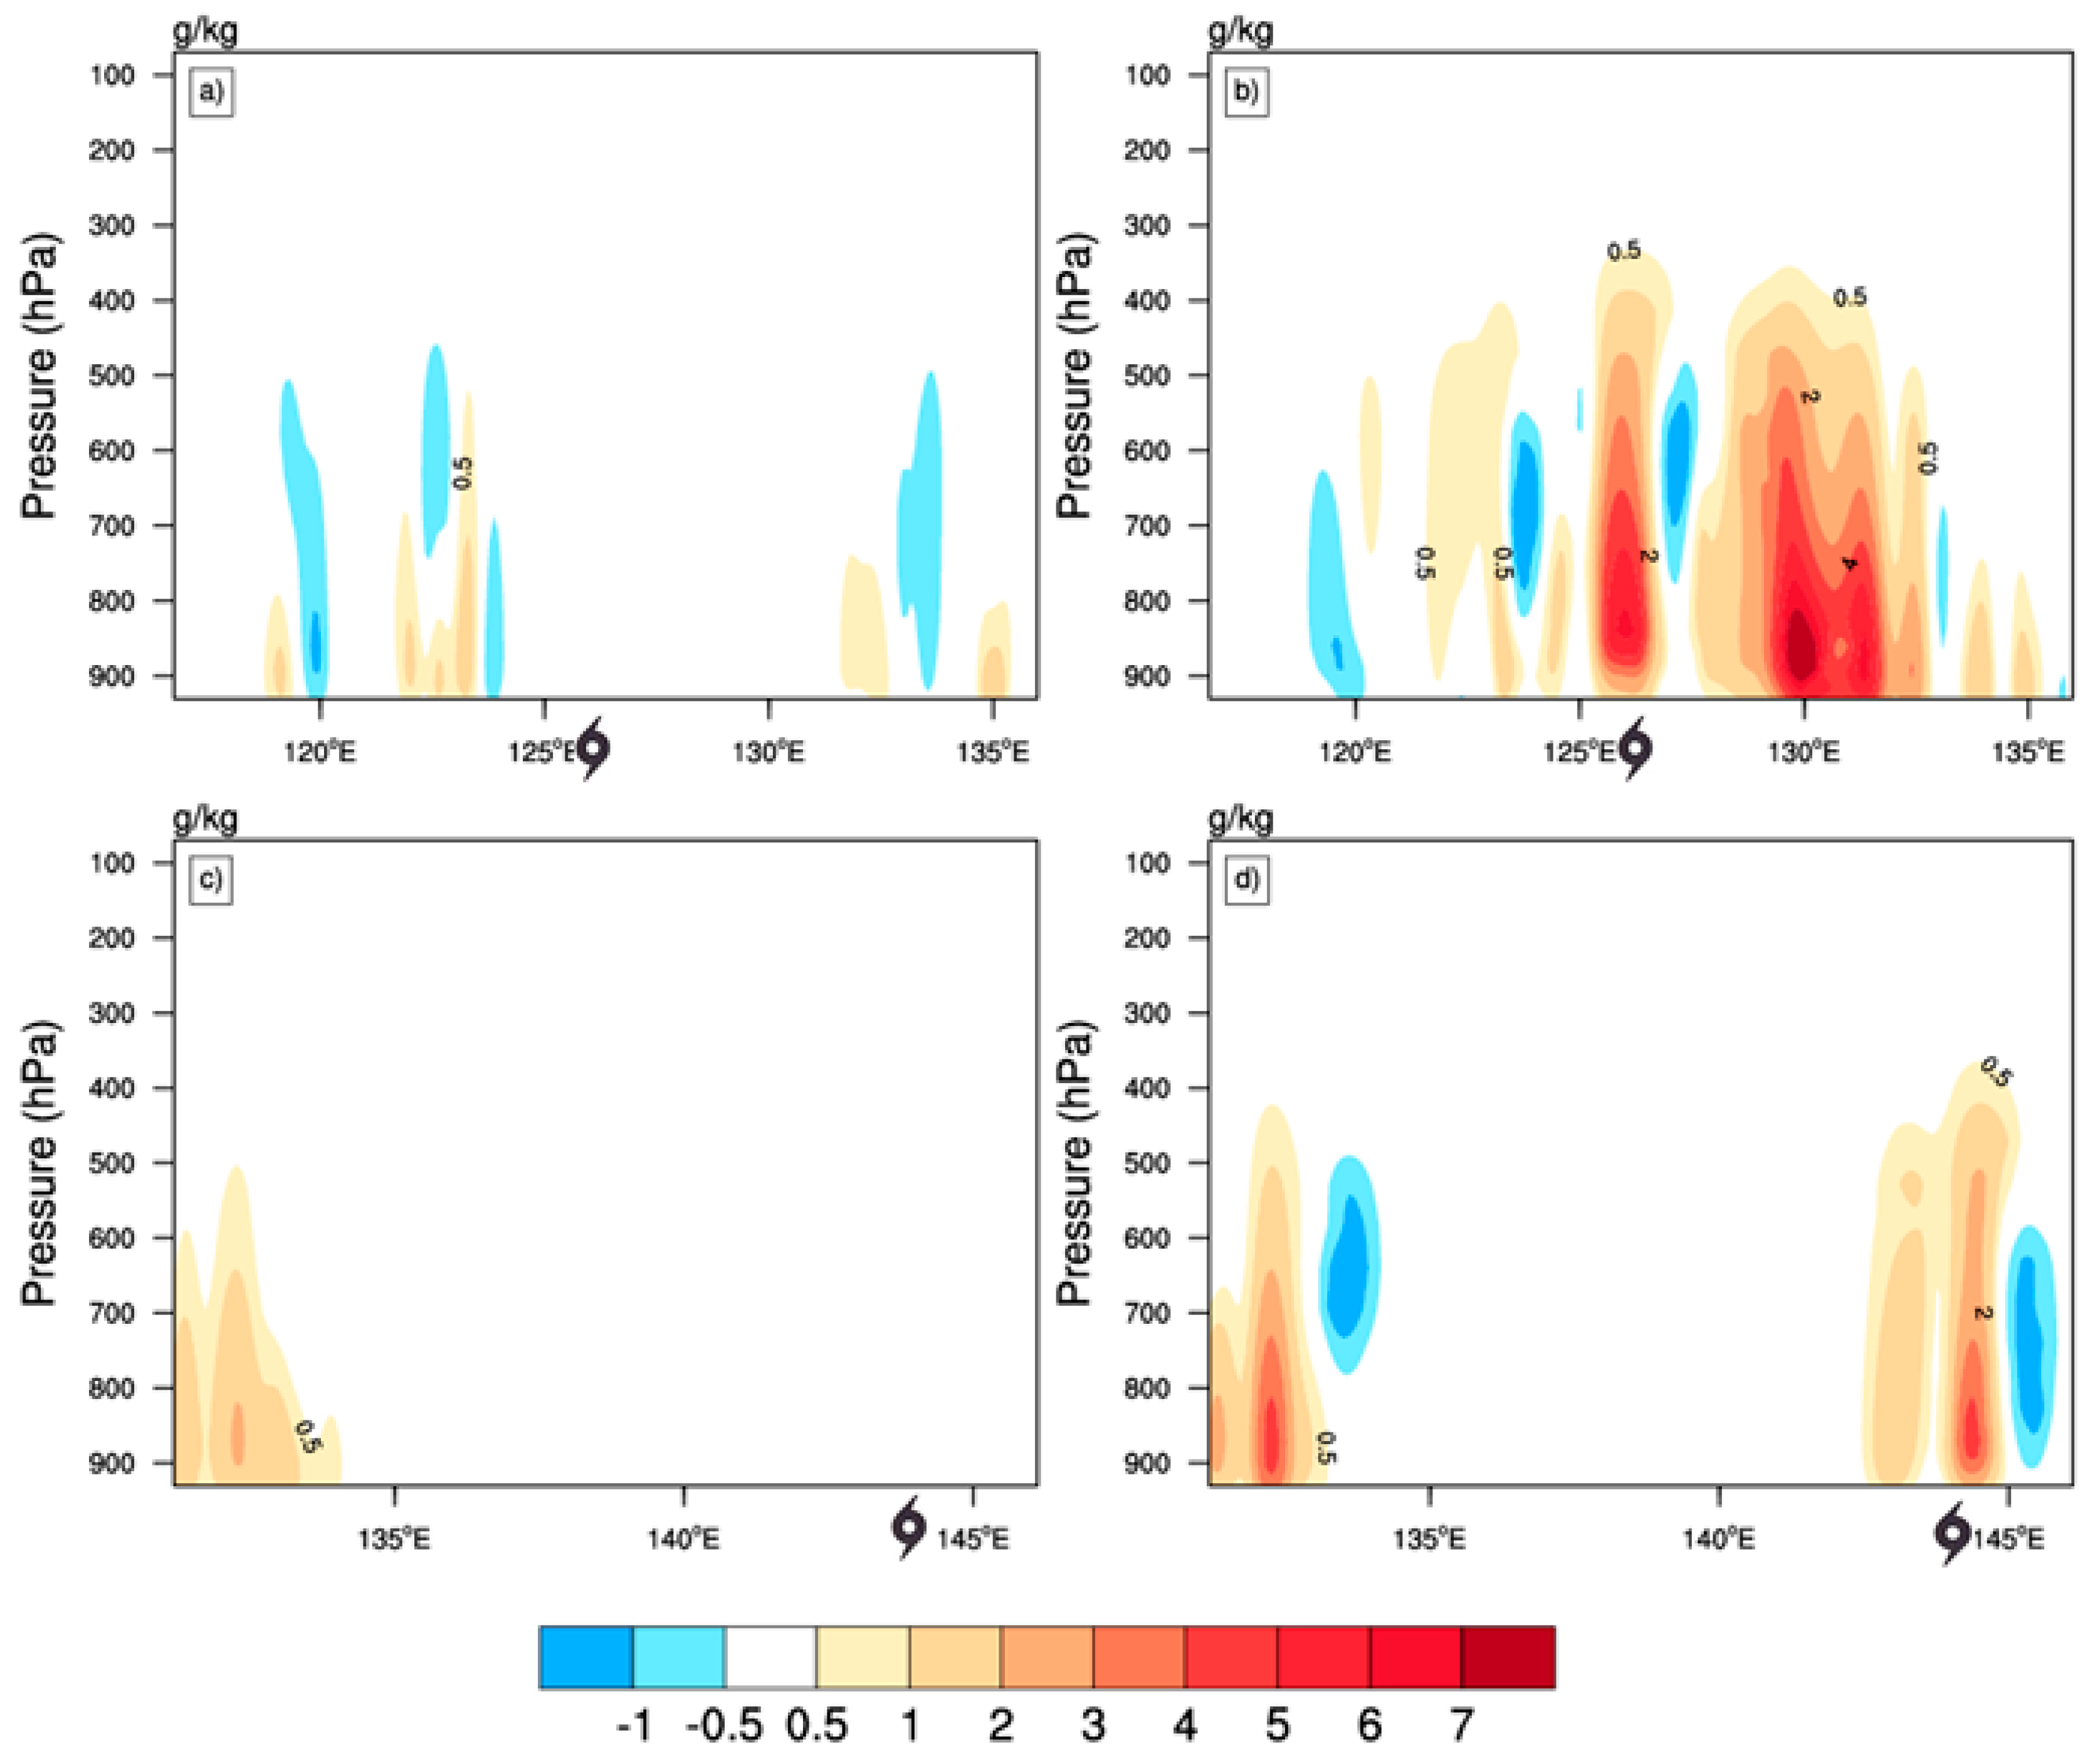
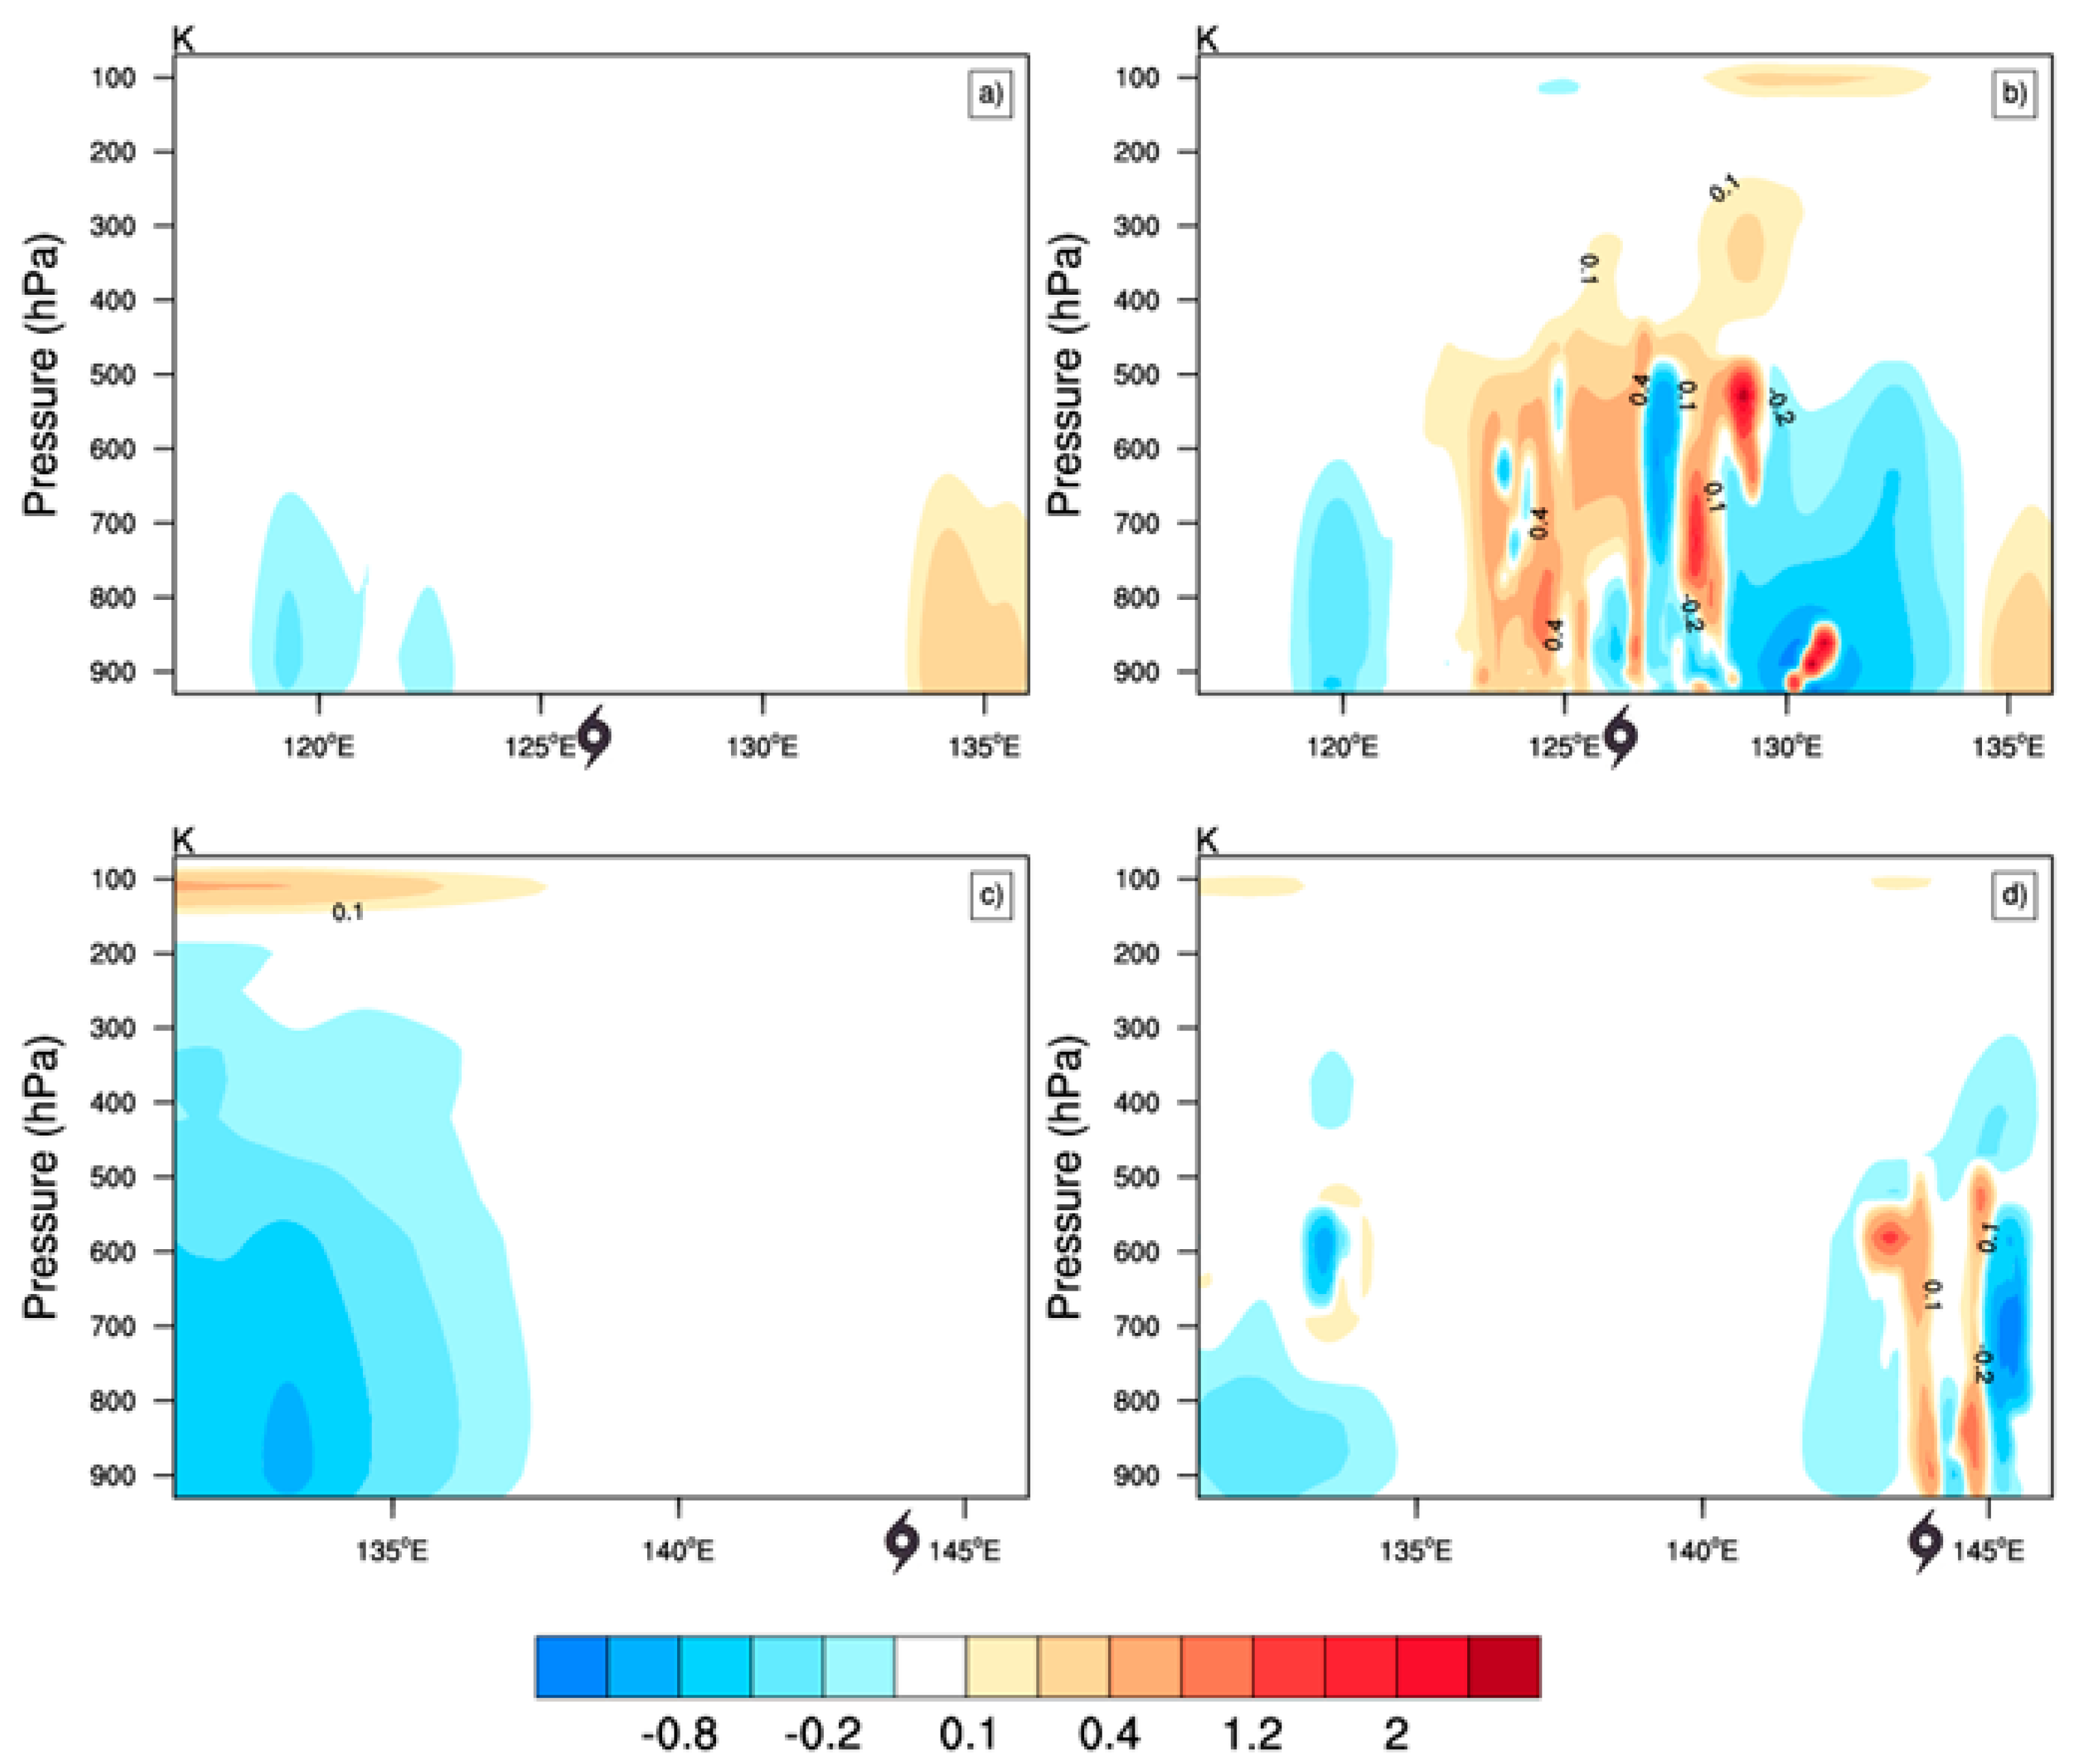
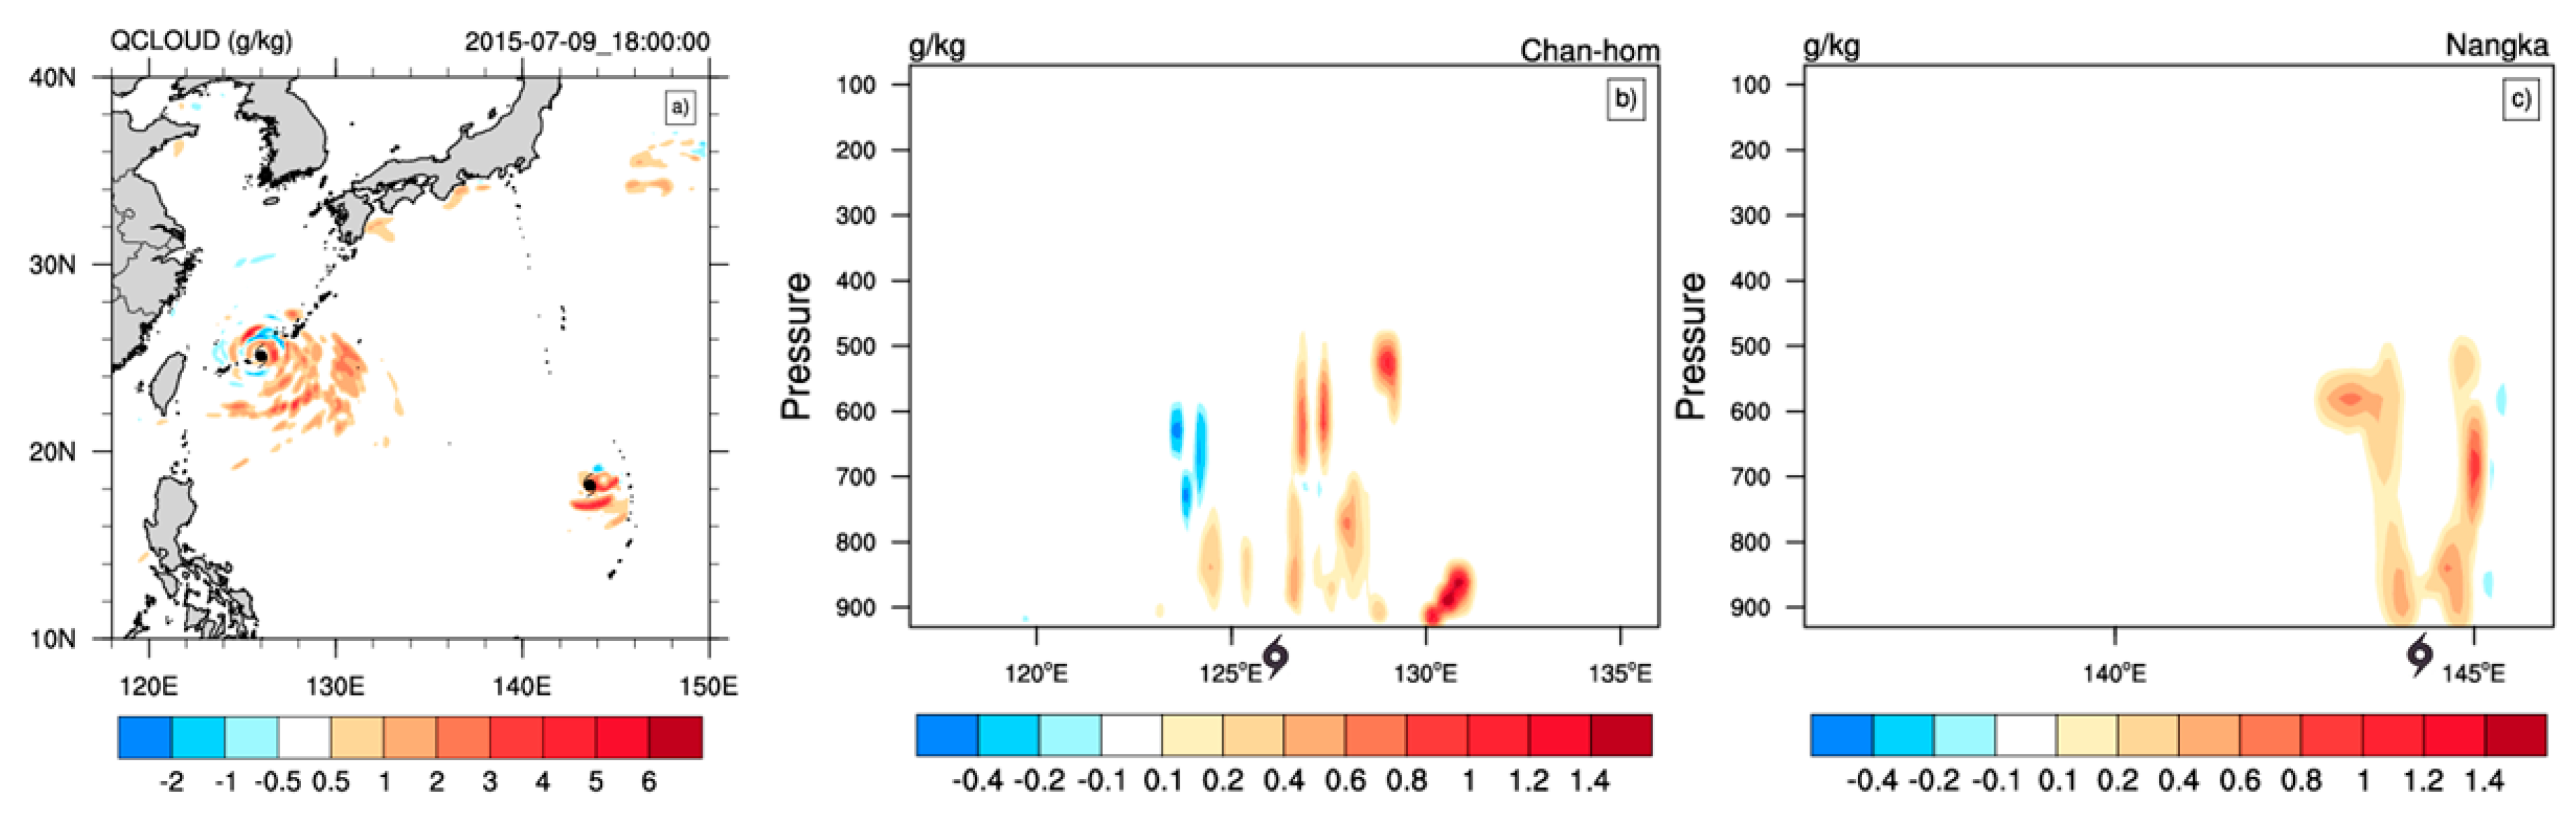
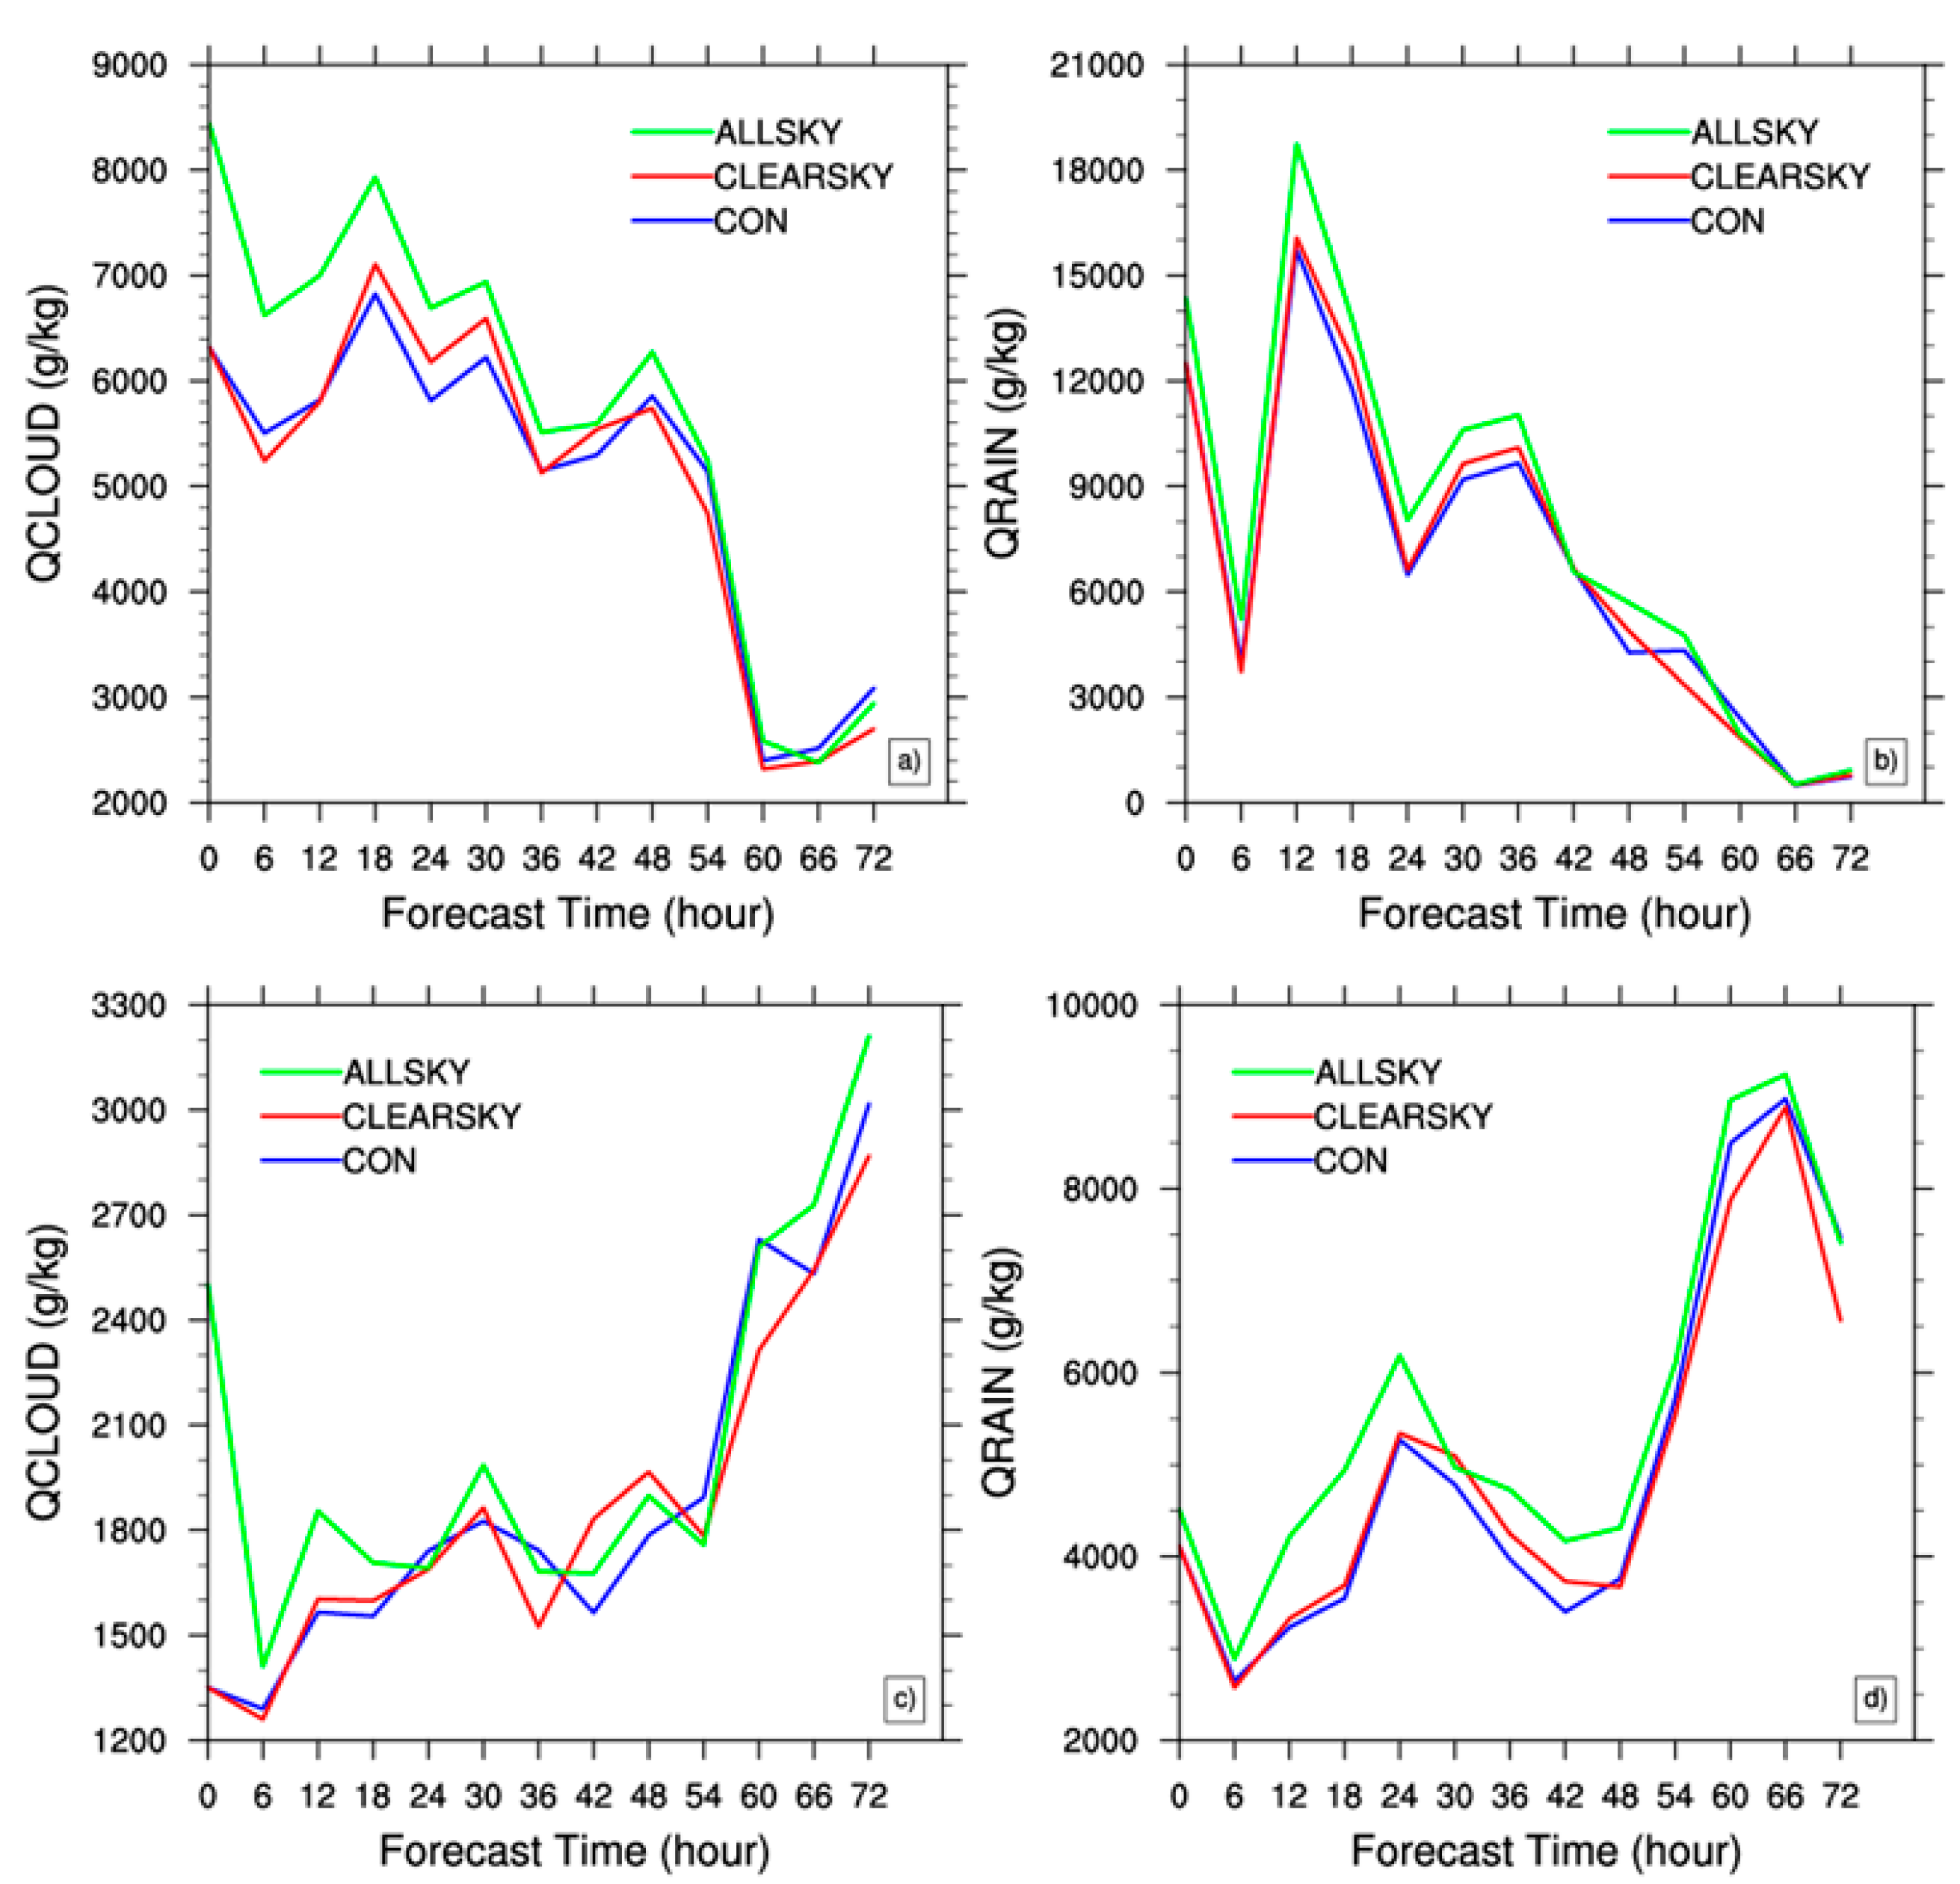
4.2.2. Vertical Structures of the Typhoons

The vertical structures of the three experiments are compared with the ERA5 reanalysis [40]. Figure 11 shows the analysis temperature anomaly in the vertical cross-sections through the vortex centers of each typhoon at 1800 UTC on 9 July 2015, which can indicate the development of the warm core of typhoon. The anomaly is calculated by subtracting average temperature, which is averaged in the domain centered at the typhoon eye, with a radius of 200 km for Chan-hom, and a radius of 100 km for Nangka. Based on the results of the ERA5 reanalysis, for typhoon Chan-hom (Figure 11a–d), the positive anomaly is from 650 hPa to 150 hPa, with the maximum of its warm core structure near 200 hPa (Figure 11a). All three experiments show positive temperature anomalies in the upper troposphere, but they are clearly weaker and smaller than the warm core in ERA5. However, with all-sky assimilation (Figure 11d), a relatively stronger and larger warm core is found at approximately 200–300 hPa when compared with CON (Figure 11b) and CLEARSKY (Figure 11c) experiments. For typhoon Nangka (Figure 11 e–h), the clear positive temperature anomaly is located from 650 hPa to 150 hPa, according to the ERA5 reanalysis (Figure 11e), with the maximum at 250 hPa. A similar tendency was found for Chan-hom in which all three experiments showed a weaker warm core than ERA5. Positive anomalies are mainly located from 500 hPa to 200 hPa in CON and CLEARSKY (Figure 11f,g). However, the ALLSKY experiment (Figure 11h) constructs a relatively stronger warm core in the upper level of the typhoon eye, from 650 hPa to 150 hPa, with the maximum near 300 hPa, which is more consistent with the ERA5 reanalysis.
Figure 12 shows the analysis horizontal wind speed and potential temperature in the vertical cross-sections through the vortex centers of each typhoon at 1800 UTC on 9 July 2015. For Chan-hom, stronger wind speed is shown outside the typhoon eye area, indicating a strong horizonal circulation pattern of the typhoon eye wall. Compared with the ERA5 reanalysis, all three experiments show a weaker wind speed of typhoon eye wall. Nevertheless, the ALLSKY experiment (Figure 12d) still yields a stronger wind speed than CON (Figure 12b) and CLEARSKY (Figure 12c) on the both sides out of typhoon eye area, which indicates a tighter circulation pattern with the all-sky AMSR2 assimilation. For Nangka, an obvious typhoon eye and eye wall structure are shown in ERA5 (Figure 12e), with a strong wind speed in the eye wall and a weak wind speed in the eye area. In the three experiments in our study, the height of strong wind in the eye wall is clearly lower than ERA5, and wind speed is also weaker. The ALLSKY experiment shows a slightly stronger horizonal wind speed with a higher height (Figure 12h) than the CON (Figure 12f) and CLEARSKY (Figure 12g) experiments, which indicates that all-sky assimilation yields tighter circulation pattern outside the typhoon eye area. Furthermore, the ALLSKY experiment has a much clearer trough of potential temperature than the CON and CLEARSKY experiments.
Overall, though all three experiments capture the vertical structure of both typhoons in the typhoon center area, their intensities are all weaker than the ERA5 reanalysis. However, including the all-sky AMSR2, the vertical structure is better established, which relatively strengthens the intensity of the typhoons.

4.2.3. Initial Fields Difference

All-sky radiance data assimilation improves coexisting typhoon track and intensity, as discussed above. To further investigate the contributions of assimilation to typhoon forecasts improvements, the difference is calculated by CLEARSKY or ALLSKY analysis minus CON, which represents the analysis change generated by assimilating clear-sky or all-sky AMSR2 observations relative to CON. The initial geopotential height, humidity, temperature and hydrometeor difference are shown in Figure 13, Figure 14 and Figure 15.
Figure 13 shows the 500 hPa geopotential height difference at 1800 UTC on 9 July 2015. When only assimilating AMSR2 data in a clear-sky condition (Figure 13a), there are few increments in the typhoon core area and spiral cloud band area for both Chan-hom and Nangka, where AMSR2 observations are excluded in clear-sky assimilation. Some positive geopotential height increments are shown near the spiral cloud band, with slight negative increments outside the cloud band. Expending AMSR2 radiance data assimilation to all-sky conditions (Figure 13b) results in noticeably larger increments than in CLEARSKY experiments, with maximum positive increments of ~150 gpm, which is almost two times the values of CLEARSKY. In the ALLSKY experiment, clear increments appear in the typhoon center area where effective AMSR2 observations exist. Thus, these increments reflect actual AMSR2 observation information in the typhoon center area. For Chan-hom, few positive increments in the eye area and clear negative increments surrounding the eye which follow the typhoon trajectory are observed. For Nangka, there are obvious positive increments in the eye area and in the south of the eye area, whereas negative increments are shown in the north. Increasing geopotential height to 500 hPa enhances air subsidence in the eye, whereas decreasing geopotential height promotes an air-rise in the spiral cloud band. Thus, only the 500-hPa geopotential height increments of the all-sky AMSR2 radiance data assimilation facilitate typhoon intensification, which promotes air subsidence in the eye area and an air-rise in the areas surrounding the eye.
The vertical structure of water vapor mixing ratio difference is shown by cutting the cross-sections along 25.261° N for Chan-hom (Figure 14a,b) and 18.517°N for Nangka (Figure 14c,d). At 1800 UTC on 9 July, the center of Chan-hom was located at about (25.261° N, 126.1° E), and the center of Nangka was located at about (18.517° N, 143.6° E). In the CLEARSKY experiment (Figure 14a,c), no obvious humidity increments appear at the typhoon Chan-hom (Figure 14a) and Nangka (Figure 14c) centers. There are only few slight increments outside the Chan-hom and Nangka center core areas under 500 hPa. Thus, the CLEARSKY experiment barely changes the humidity structure in both the typhoon core areas. However, including AMSR2 observations in the typhoon core area in the ALLSKY experiment (Figure 14b,d) improves typhoon center core humidity structure directly. For Chan-hom (Figure 14b), there are two clear parts of wet increments, one is at 900–300 hPa over 125° E–126° E, which strengthens the warm core of typhoon Chan-hom. Another is at 900–500 hPa over 129° E–132° E, which promotes the water vapor transport in the spiral cloud bands, strengthening the rotation of typhoon. Nangka (Figure 14d) is similar to Chan-hom, which increases water vapor mixing ratio in the center area at the lower layer, improving the water vapor content of the typhoon center. Therefore, including additional typhoon core area AMSR2 data in the ALLSKY experiment distinctly improves the humidity structure of both typhoons, which has a dramatic effect on the intensification of water vapor content in the typhoon center, subsequently strengthening the typhoons.
Figure 15 shows the west–east cross-sections of temperature difference for Chan-hom (Figure 15a,b) and Nangka (Figure 15c,d) from CLEARSKY (Figure 15a,c) and ALLSKY (Figure 15b,d) experiments. Similar to the water vapor mixing ratio, assimilating clear-sky AMSR2 data does not improve temperature structure in the typhoon center areas (126.1° E and 143.6° E). The ALLSKY experiment changes temperature increment distributions directly. For Chan-hom (Figure 15b), significant warm increments appear in the core area (126.1° E) from 800 hPa to 300 hPa. Outside the eye area, there are some negative increments mainly in the lower layer. For Nangka (Figure 15d), similar warm increments are shown at the same time in the Nangka core area (143.6° E). Section 4.2.2 indicates that all-sky assimilation yields a stronger warm core than conventional and clear-sky assimilation. Increasing temperature is found for Chan-hom and Nangka in the typhoon core areas. This directly strengthens the typhoon warm core, which is more consistent with the ECMWF reanalysis. Overall, the ALLSKY experiment increases the temperature of the typhoon core region, leading to warming of the typhoon warm core that enhances the typhoon vortex circulations [41] of coexisting typhoons.
Hydrometeors play an important role in the development of typhoons, influencing both dynamic and thermal processes. In the ALLSKY experiment, the increments of cloud water and rainwater can be directly obtained during the 3DVAR minimization process. Figure 16a shows the integrated difference of cloud water mixing ratio in the ALLSKY experiment. Few hydrometeor increments exist in the eye area, which is consistent with a dry center in the typhoon eye. There are clear positive increments around the eye, both for Chan-hom and Nangka. Figure 16b,c show the cross-sections of cloud water mixing ratio increments through the vortex centers of typhoon Chan-hom and Nangka. It is obvious that cloud water mixing ratio increments are mainly in the middle and low layer, under 500 hPa. There are clear positive increments in the eyewall and spiral cloud band area, where the convective motion is strong. Thus, assimilation of all-sky AMSR2 radiance data increases the initial hydrometeor content in both typhoons, and strengthens typhoon initial intensity.
In order to figure out whether increasing initial hydrometeor will maintain as the forecast time leads, the integrated hydrometeor evolution for both the typhoons’ core area is analyzed in Figure 17, in which Figure 17a,c are for cloud water mixing ratio, and Figure 17b,d are for rainwater mixing ratio. At the time of initiation, the ALLSKY experiment increases hydrometeor significantly, which shows the benefit of using all-sky assimilation. During the 72-h forecast time, the ALLSKY experiment almost shows the largest amount throughout. Cloud water and rainwater are classified as warm hydrometeors which have a clear warming effect [42]. More hydrometeor enhances the water vapor condensation and latent heating effect [43], which can better develop the warm core of a typhoon and heavy rainfall in a spiral cloud band area.
Thus, we conclude that the assimilation of AMSR2 all-sky observations can directly improve the initial typhoon structure of geopotential height, temperature, humidity and hydrometeor, which promotes the strengthening of the initial intensity of coexisting typhoons. Especially for hydrometeor, assimilating all-sky AMSR2 data enhances the typhoon core area hydrometeor concentrations through the typhoon’s lifetime until landfall. There is always a high content of hydrometeor in the typhoon system, especially in the spiral cloud band. More hydrometeor in the ALLSKY experiment helps to improve typhoon intensity during the whole forecast time, resulting in lower intensity forecast errors in the ALLSKY experiment.

5. Conclusions

Using the 3DVAR method in the WRFDA system, this study evaluated the impacts of all-sky AMSR2 radiance data assimilation on the analysis and forecast of the coexisting typhoons Chan-hom and Nangka by comparing with clear-sky assimilation.
With all-sky assimilation, more cloud- and precipitation-affected AMSR2 data can be assimilated, which better utilizes the satellite data. Improvements in brightness temperature simulations are found when more data in typhoon core areas are assimilated. A cycle assimilation experiment is carried out to evaluate the impacts of all-sky AMSR2 assimilation. Improvements are found when averaging all the forecasts in the cycle assimilation experiment. Compared with clear-sky assimilation, the all-sky assimilation reduces the track errors by 11.78% for Chan-hom and 17.89% for Nangka, and reduces CSLP errors by 25.31% for Chan-hom and 8.64% for Nangka. Analyzed wind, temperature and humidity RMSE verified against ECMWF reanalysis in the ALLSKY experiment are clearly smaller than those of CON and CLEARSKY experiments. Therefore, all-sky assimilation of AMSR2 observations has positive impacts on multiple typhoons analysis and forecast.
To further explore improved means of providing a better analysis and forecast of typhoons, a single assimilation in the cycle experiment is selected. Improvements similar to the average results are found in the track and intensity forecast. In addition, better structures are produced for both typhoons, showing a stronger warm core and a tighter circulation pattern around the typhoon eye in the ALLSKY experiment. Initial increments are analyzed at 1800 UTC on 9 July. The all-sky assimilation directly improves the initial distribution of the geopotential height, temperature and humidity in the typhoon core area, which is barely found in the CLEARSKY experiment. In addition, all-sky assimilation increases the hydrometeor intensity throughout the forecast. The improvements in temperature, moisture, and hydrometeor promote the establishment of the typhoon’s warm core, water vapor transport, and convective development. All the improvements lead to the intensification of the typhoons, which results in better forecasts results.
This study tests the impacts on two typhoons, showing that all-sky assimilation has the potential to improve the forecast of coexisting typhoons. However, more experiments are needed, especially when two typhoons interact strongly. The mechanism of all-sky assimilation on the interaction is also worth being explored in the future. In addition, other assimilation methods, such as 4DVar and hybrid variation, should be evaluated for their effects on all-sky data assimilation.

Author Contributions

The manuscript was prepared by J.W. The manuscript and experiments were designed by L.Z., and performed by J.W., M.Z. provided the technical support. J.G. contributed to the revision of the manuscript. All the authors reviewed the manuscript and contributed to improving the manuscript. All authors have read and approved the final manuscript.

Funding

We are thankful for the support of the National Natural Science Foundation of China (41975066), the Beijing Open Research Fund for Nanjing Joint Center of Atmosphere Research (NJCAR2018ZD03), and the National Natural Science Foundation of China (41775123).

Conflicts of Interest

The authors declare no conflict of interest.

References

  1. Simmons, A.; Hollingsworth, A. Some aspects of the improvement in skill of numerical weather prediction. Q. J. R. Meteorol. Soc. 2002, 128, 647–677. [Google Scholar] [CrossRef]
  2. Geer, A.J.; Baordo, F.; Bormann, N.; English, S.; Kazumori, M.; Lawrence, H.; Lean, P. The growing impact of satellite observations sensitive to humidity, cloud and precipitation. Q. J. R. Meteorol. Soc. 2017, 143, 3189–3206. [Google Scholar] [CrossRef]
  3. McNally, A.P.; Watts, P.D. A cloud detection algorithm for high-spectral-resolution infrared sounders. Q. J. R. Meteorol. Soc. 2003, 129, 3411–3423. [Google Scholar] [CrossRef]
  4. Chen, S.H.; Vandenberghe, F.; Petty, G.W.; Bresch, J. Application of SSM/I satellite data to a hurricane simulation. Q. J. R. Meteorol. Soc. 2006, 130, 801–825. [Google Scholar] [CrossRef] [Green Version]
  5. Bell, W.; English, S.J.; Candy, B.; Atkinson, N.; Hilton, F.; Baker, N.; Swadley, S.D.; Campbell, W.F.; Bormann, N.; Kelly, G. The assimilation of SSMIS radiances in numerical weather prediction models. IEEE Trans. Geosci. Remote Sens. 2008, 46, 884–900. [Google Scholar] [CrossRef]
  6. Liu, Z.; Schwartz, C.S.; Snyder, C.; Ha, S. Impact of assimilating AMSU-A radiances on forecasts of 2008 Atlantic Tropical Cyclones initialized with a limited-area ensemble Kalman filter. Mon. Weather Rev. 2012, 140, 4017–4034. [Google Scholar] [CrossRef] [Green Version]
  7. Zou, X.; Qin, Z.; Weng, F. Improved Quantitative Precipitation Forecasts by MHS Radiance Data Assimilation with a Newly Added Cloud Detection Algorithm. Mon. Weather Rev. 2013, 141, 3203–3221. [Google Scholar] [CrossRef]
  8. Ma, Z.; Maddy, E.; Zhang, B.; Zhu, T.; Boukabara, S. Impact Assessment of Himawari-8 AHI Data Assimilation in NCEP GDAS/GFS with GSI. J. Atmos. Ocean. Technol. 2017, 34, 797–815. [Google Scholar] [CrossRef]
  9. Kim, D.; Kim, H. Effect of Assimilating Himawari-8 Atmospheric Motion Vectors on Forecast Errors over East Asia. J. Atmos. Ocean. Technol. 2018, 35, 1737–1752. [Google Scholar] [CrossRef]
  10. Geer, A.J.; Bauer, P.; O’Dell, C.W. A Revised Cloud Overlap Scheme for Fast Microwave Radiative Transfer in Rain and Cloud. J. Appl. Meteorol. Climatol. 2009, 48, 2257–2270. [Google Scholar] [CrossRef]
  11. Saunders, R.; Hocking, J.; Rundle, D.; Rayer, P.; Matricardi, M.; Geer, A.; Lupu, C. RTTOV-12 Science and Validation Report; NWPSAF-MO-TV-032 v1.1; EUMETSAT NWP-SAF: 2013. Available online: https://www.google.com.sg/url?sa=t&rct=j&q=&esrc=s&source=web&cd=&cad=rja&uact=8&ved=2ahUKEwiq8Zve3e7pAhVGBKYKHdaBCsMQFjAAegQIBBAB&url=https%3A%2F%2Fnwpsaf.eu%2Fsite%2Fdownload%2Fdocumentation%2Frtm%2Fdocs_rttov12%2Frttov12_svr.pdf&usg=AOvVaw03xwGQR4p2B9kLlxcotn7L (accessed on 7 June 2020).
  12. Liu, Q. Community Radiative Transfer Model (CRTM) applications in supporting the Suomi National Polar-orbiting Partnership (SNPP) mission validation and verification. Remote Sens. Environ. 2014, 140, 744–754. [Google Scholar] [CrossRef]
  13. Bauer, P.; Geer, A.J.; Lopez, P.; Salmond, D. Direct 4D-Var assimilation of all-sky radiances. Part I: Implementation. Q. J. R. Meteorol. Soc. 2010, 136, 1868–1885. [Google Scholar] [CrossRef]
  14. Geer, A.J.; Lonitz, K. All-sky satellite data assimilation at operational weather. Q. J. R. Meteorol. Soc. 2017, 144, 1191–1217. [Google Scholar] [CrossRef]
  15. Kazumori, M. Satellite Radiance Assimilation in the JMA Operational Mesoscale 4DVAR System. Mon. Weather Rev. 2014, 142, 1361–1381. [Google Scholar] [CrossRef]
  16. Geer, A.J.; Baordo, F.; Bormann, N.; English, S. All-Sky Assimilation of Microwave Humidity Sounders. ECMWF Tech. Memo. 2014, 140, 25–32. [Google Scholar]
  17. Zhu, Y.; Liu, E.H.; Mahajan, R.; Thomas, C.; Groff, D.; van Delst, P.; Collard, A. All-sky microwave radiance assimilation in the NCEP’s GSI analysis system. Mon. Weather Rev. 2016, 144, 4709–4735. [Google Scholar] [CrossRef]
  18. Otkin, J.A. Clear and cloudy sky infrared brightness temperature assimilation using an ensemble Kalman filter. J. Geophys. Res. 2010, 115, D19207. [Google Scholar] [CrossRef] [Green Version]
  19. Zhang, F.; Minamide, M.; Clothiaux, E.E. Potential impacts of assimilating all-sky infrared satellite radiance from GOES-R on convection-permitting analysis and prediction of tropical cyclones. Geophys. Res. Lett. 2016, 43, 2954–2963. [Google Scholar] [CrossRef] [Green Version]
  20. Minamide, M.; Zhang, F. Adaptive observation error inflation for assimilating all-sky satellite radiance. Mon. Weather Rev. 2017, 145, 1063–1081. [Google Scholar] [CrossRef]
  21. Honda, T.; Miyoshi, T.; Lien, G.-Y.; Nishizawa, S.; Yoshida, R.; Adachi, S.A.; Terasaki, K.; Okamoto, K.; Tomita, H.; Bessho, K. Assimilating All-Sky Himawari-8 Satellite Infrared Radiances: A Case of Typhoon Soudelor (2015). Mon. Weather Rev. 2018, 146, 213–229. [Google Scholar] [CrossRef]
  22. Zhang, Y.; Stensrud, D.; Zhang, F. Simultaneous Assimilation of Radar and All-Sky Satellite Infrared Radiance Observations for Convection-Allowing Ensemble Analysis and Prediction of Severe Thunderstorms. Mon. Weather Rev. 2019, 147, 4389–4409. [Google Scholar] [CrossRef]
  23. Okamoto, K.; Sawada, Y.; Kunii, M. Comparison of assimilating all-sky and clear-sky infrared radiances from Himawari-8 in a mesoscale system. Q. J. R. Meteorol. Soc. 2019, 145, 745–766. [Google Scholar] [CrossRef]
  24. Shen, F.; Min, J. Assimilating AMSU-A radiance data with the WRF Hybrid En3DVAR system for track predictions of Typhoon Megi (2010). Adv. Atmos. Sci. 2015, 9, 1231–1243. [Google Scholar] [CrossRef]
  25. Yang, C.; Liu, Z.; Bresch, J.; Rizvi, S.R.; Huang, X.Y.; Min, J. AMSR2 all-sky radiance assimilation and its impact on the analysis and forecast of Hurricane Sandy with a limited-area data assimilation system. Tellus A: Dyn. Meteorol. Oceanogr. 2016, 68, 30917. [Google Scholar] [CrossRef] [Green Version]
  26. Xian, Z.; Chen, K.; Zhu, J. All-sky assimilation of the MWHS-2 observations and evaluation the impacts on the analyses and forecasts of binary typhoons. J. Geophys. Res. 2019, 124, 6359–6378. [Google Scholar] [CrossRef]
  27. Brand, S. Interaction of binary tropical cyclones of the Western North Pacific Ocean. J. Appl. Meteorol. 1970, 9, 433–441. [Google Scholar] [CrossRef]
  28. Imaoka, K.; Kachi, M.; Fujii, H.; Murakami, H.; Hori, M.; Ono, A.; Igarashi, T.; Nakagawa, K.; Oki, T.; Hond, Y.; et al. Global Change Observation Mission (GCOM) for Monitoring Carbon, Water Cycles, and Climate Change. Proc. IEEE 2010, 98, 717–734. [Google Scholar] [CrossRef]
  29. Kim, S.; Liu, Y.; Johnson, F.M. A global comparison of alternate AMSR2 soil moisture products: Why do they differ? Remote Sens. Environ. 2015, 161, 43–62. [Google Scholar] [CrossRef]
  30. AMSR2 dataset. Available online: ftp://ftp.gportal.jaxa.jp/ (accessed on 7 June 2020).
  31. Han, Y.; van Delst, P.; Liu, Q.; Weng, F.; Yan, B. JCSDA Community radiative Transfer Model (CRTM)-Version 1. NOAA Tech. Rep. NESDIS 2006, 122, 33. [Google Scholar]
  32. Dee, D.P. Variational bias correction of radiance data in the ECMWF system. In Proceedings of the ECMWF Workshop on Assimilation of High Spectral Resolution Sounders in NWP, Reading, UK, 28 June–1 July 2004. [Google Scholar]
  33. Dee, D.; da Silva, A. The choice of variable for atmospheric moisture analysis. Mon. Weather Rev. 2010, 131, 155–171. [Google Scholar] [CrossRef] [Green Version]
  34. Parrish, D.F.; Derber, J.C. The National Meteorological Center’s spectral statistical interpolation analysis system. Mon. Weather Rev. 1992, 120, 1747–1763. [Google Scholar] [CrossRef]
  35. Xiao, Q.; Kuo, Y.H.; Sun, J.; Lee, W.C.; Barker, D.M. An approach of radar reflectivity data assimilation and its assessment with the inland QPF of typhoon Rusa (2002) at landfall. J. Appl. Meteorol. Clim. 2007, 46, 14–22. [Google Scholar] [CrossRef] [Green Version]
  36. Liu, Z.; Zhang, X.; Auligne, T.; Lin, H. Variational Analysis of Hydrometeors with Satellite Radiance Observations: A simulated study. In Proceedings of the 10th WRF Users’ Workshop, Boulder, CO, USA, 23–26 June 2009. [Google Scholar]
  37. Dudhia, J. Numerical study of convection observed during the winter monsoon experiment using a mesoscale two-dimensional model. J. Atmos. Sci. 1989, 46, 3077–3107. [Google Scholar] [CrossRef]
  38. NCEP ADP Global Upper Air and Surface Weather Observations. Available online: https://rda.ucar.edu/datasets/ds337.0/ (accessed on 7 June 2020).
  39. ERA-Interim dataset. Available online: https://apps.ecmwf.int/datasets/data/interim-full-daily (accessed on 7 June 2020).
  40. Copernicus Climate Data Store. Available online: https://cds.climate.copernicus.eu/cdsapp (accessed on 7 June 2020).
  41. Xu, D.; Min, J.; Shen, F.; Ban, J.; Chen, P. Assimilation of MWHS radiance data from the FY-3B satellite with the WRF Hybrid-3DVAR system for the forecasting of binary typhoons. J. Adv. Model. Earth Syst. 2016, 8, 1014–1028. [Google Scholar] [CrossRef] [Green Version]
  42. Dong, P.; Li, W.; Huang, J.; Liu, L. Study on the Effect and Sensitivity of Water Content on the Satellite Microwave Remote Sensing. Remote Sensing Technology and Application. J. Trop. Meteorol. 2014, 30, 300–308. [Google Scholar]
  43. Li, M.; Ping, F.; Chen, J.; Xu, L. A simulation study on the rapid intensification of Typhoon Megi (2010) in vertical wind shear. Q. J. R. Meteorol. Soc. 2016, 17, 630–638. [Google Scholar] [CrossRef]
Figure 1. The best tracks from the Joint Typhoon Warning Center (JTWC) for Chan-hom (left, 0000 UTC 30 June–0000 UTC 13 July) and Nangka (right, 1800 UTC 3 July–0600 UTC 17 July), defined as tropical depression (blue), tropical storm (green), typhoon (orange), and super typhoon (red).
Atmosphere 11 00599 g001
Figure 2. Brightness temperature simulation for AMSR2 channel 10 after (a) clear-sky quality control and (b) all-sky quality control.
Atmosphere 11 00599 g002
Figure 3. The numbers of pixels assimilated under clear-sky (blue) and all-sky (yellow) condition. The dash line represents the number of 49,891.
Atmosphere 11 00599 g003
Figure 4. Brightness temperature from AMSR2: (ac) channel 8 and (df) channel 10 for (a,d) observations, (b,e) CRTM simulation without hydrometeors, and (c,f) with hydrometeors.
Atmosphere 11 00599 g004
Figure 5. The averaged absolute track errors against JTWC best tracks from the three experiments for (a) Chan-hom and (b) Nangka.
Atmosphere 11 00599 g005
Figure 6. The averaged absolute central sea level pressure (CSLP) errors against JTWC best tracks from the three experiments for (a) Chan-hom and (b) Nangka.
Atmosphere 11 00599 g006
Figure 7. The averaged root-mean-square errors of analysis for the three experiments for (a) u, (b) temperature, (c) water vapor mixing ratio and (d) relative humidity.
Atmosphere 11 00599 g007
Figure 8. The best-track data (black) and 72-h forecast track (every 6 h) from CON (blue), CLEARSKY (red), and ALLSKY (green) experiments for Chan-hom (upper left) and Nangka (lower right), starting from 1800 UTC 9 July.
Atmosphere 11 00599 g008
Figure 9. 72-h forecast track errors (experiment data minus best-track data, km) from CON (blue), CLEARSKY (red), and ALLSKY (green) experiments for (a) Chan-hom and (b) Nangka, starting from 1800 UTC 9 July.
Atmosphere 11 00599 g009
Figure 10. The same as Figure 9, but for central sea-level pressure (CSLP) error.
Atmosphere 11 00599 g010
Figure 11. The west–east cross-sections of temperature anomaly (K) through the vortex center for Chan-hom (ad) and Nangka (eh) from the analyses of ECMWF (a,e), CON (b,f), CLEARSKY (c,g) and ALLSKY (d,h) experiments. The x-axis is grid number.
Atmosphere 11 00599 g011
Figure 12. The west–east cross-sections of analyzed horizontal wind speed (shaded) and potential temperature (contours; intervals of 4K) for Chan-hom (ad) and Nangka (eh) from ECMWF (a,e), CON (b,f), CLEARSKY (c,g) and ALLSKY (d,h) experiments. The x-axis is grid number.
Atmosphere 11 00599 g012
Figure 13. 500 hPa geopotential height difference (gpm) at 1800 UTC on 9 July from (a) CLEARSKY, (b) ALLSKY experiments, with black typhoon mark for Chan-hom and Nangka.
Atmosphere 11 00599 g013
Figure 14. The west–east cross-sections along 25.261° N (a,b) and 18.517° N (c,d) of the water vapor mixing ratio difference (g/kg) at 1800 UTC on 9 July from CLEARSKY (a,c) and ALLSKY (b,d) experiments, with black typhoon mark in the x-axis for the longitude of Chan-hom and Nangka.
Atmosphere 11 00599 g014
Figure 15. The west–east cross-sections along 25.261° N (a,b) and 18.517° N (c,d) of temperature difference (K) at 1800 UTC on 9 July from CLEARSKY (a,c) and ALLSKY (b,d) experiments, with black typhoon mark in the x-axis for the longitude of Chan-hom and Nangka.
Atmosphere 11 00599 g015
Figure 16. (a)The integrated cloud water mixing ratio difference (g/kg), the west–east cross-sections of cloud water mixing ratio difference along (b) 25.261° N and (c) 18.517° N at 1800 UTC on 9 July from the ALLSKY experiment, with black typhoon mark in the x-axis for the longitude of Chan-hom and Nangka.
Atmosphere 11 00599 g016
Figure 17. 72-h time evolution of integrated (a,c) cloud water mixing ratio (g/kg) and (b,d) rainwater mixing ratio (g/kg) for (a,b) Chan-hom and (c,d) Nangka.
Atmosphere 11 00599 g017
Table 1. Quality-control thresholds.
Frequency (GHz)10.6518.723.836.5
Channel56789101112
Abs innovation (K)10106881066
CLWP (kg/m2)0.350.350.30.30.250.250.100.10
Table 2. Observation errors (K) for AMSR2 [25].
Channel56789101112
Clear-sky0.8661.1291.2271.7471.6002.6791.1792.268
All-sky21.93640.92428.30257.58812.69327.33123.24353.351
Table 3. Physical parameterization schemes.
MicrophysicsWSM6 (WRF Single-Moment 6-Class)
Cumulus parameterizationKain Fritsch (new Eta) scheme
Planetary boundary layerYSU (Yonsei University)
Surface layerMonin Obukhov
Longwave radiationRapid Radiative Transfer Model for GCMs
Shortwave radiationDudhia scheme

