Abstract
Observational and reanalysis data show that the surface air temperature (SAT) over most parts of Europe in June of 2019 broke the highest temperature on record. In this study, we investigate the factors for the formation of this record-breaking high temperature over Europe, focusing on the role of atmospheric circulation anomalies. A strong anomalous anticyclone appeared over Europe, with a quasi-barotropic vertical structure. On one hand, the downward motion anomalies associated with this anomalous anticyclone led to less cloud cover and an increase in downward shortwave radiation, which contributed to the SAT warming over Europe. On the other hand, southerly wind anomalies to the west side of the anomalous anticyclone also resulted in SAT warming via carrying warmer and wetter air northward from lower latitudes. The formation of the anticyclonic anomaly over Europe in June of 2019 was closely related to an atmospheric wave train propagating eastward from the mid-high latitudes of the North Atlantic to Eurasia. The atmospheric wave train over the North Atlantic–Eurasia region is suggested to be mainly related to the Atlantic–Eurasia teleconnection pattern. Further analysis indicates that a decrease in the local soil moisture over Europe may also have escalated the surface temperature warming through a positive land–atmosphere feedback.
1. Introduction
Extremely high temperatures during warm seasons could lead to remarkable impacts on human mortality, socioeconomic development and ecosystems [1,2,3,4]. In the context of a warming climate, Europe has suffered though increasingly frequent and intense heat events since the second half of the 20th century [5].
In regard to the factors for the heat extremes occurring in Europe, previous studies have highlighted the important role of large-scale atmospheric circulation anomalies [6,7,8,9]. Specifically, consecutive high temperature events over Europe are generally associated with the intense and persistent anticyclonic circulation anomaly which is in favor of generating local subsidence and prolonged hot conditions at the surface [10,11,12,13,14,15]. Studies have analyzed the impact of the anomalous anticyclone associated with quasi-stationary Rossby waves over the mid-high latitudes of Eurasia in contributing to the occurrence of heatwave events [6,7,8,16,17,18,19,20]. For example, Trenberth and Fasullo [6] reported that a quasi-stationary Rossby wave train extending to Europe may help support the persistent anticyclonic condition over Russia which was in favor of the Russian heatwave in 2010. Deng, Yang [8] demonstrated that the atmospheric circumglobal teleconnection during a boreal summer could act as an important bridge for heatwaves in Eastern Europe and Northern China. The increase in heatwaves in Eastern Europe and Northern China may be due to the weakened Atlantic westerly jet, which has been attributed to sea surface temperature (SST) warming in the North Atlantic [8]. Duchez, Frajka–Williams [7] suggested that the Rossby wave train over the Atlantic–Europe region initiated by preceding cold SST anomalies in the Atlantic could have caused the stationary jet stream which facilitated high pressure and led to extreme high temperatures over central Europe in the summer of 2015.
In addition to atmospheric circulation anomalies, the land–atmosphere interaction has also been suggested to be a potential factor for the occurrence of high temperatures over Europe [11,21,22]. Fischer, Seneviratne [11] examined the contribution of land–atmosphere coupling in the summer heatwaves of Europe in 2003 and pointed out that the interaction of soil moisture and temperature could prolong the duration of heatwaves and account for 50–80% of the hot days. Miralles, Teuling [21] indicated that large-scale atmospheric circulation could trigger the positive land–atmosphere feedback process, which led to the deficiency of soil moisture and enhanced surface air temperature warming over Europe.
Recent studies reported that global warming may also play a vital role in the frequent occurrence of extreme high temperature events [2,23,24,25,26,27,28,29]. Specifically, Rahmstorf and Coumou [23] demonstrated that there was approximately an 80% probability that the high temperature record of Moscow in July of 2010 would not have occurred without a global warming trend. Based on numerical simulations, van Oldenborgh, Vautard [30] emphasized the strong influence of human activity in increasing the risk of a record-breaking heatwave in June of 2019 considering the spatial scales of France and the city of Toulouse.
According to public records, a heatwave struck large parts of Europe in June of 2019. This event broke several historical records in June over many European countries, especially France, Switzerland, Austria and Germany [30]. At present, the factors for the occurrence of this record-breaking high temperature remain to be explored. This study focuses on analyzing the contribution of atmospheric circulation anomalies to this exceptionally hot June of 2019. We found that the atmospheric teleconnection pattern over the North Atlantic–Eurasia region proposed by Li and Ruan [31] was likely to be the main atmospheric circulation pattern in contributing to this exceptionally hot June of 2019. The rest of this study is organized as follows: Section 2 describes the data and methodology applied in this study. Section 3 shows observational evidence of the exceptionally hot June of 2019 in Europe and the associated atmospheric circulation anomalies. In particular, we discuss the contributions of several atmospheric teleconnection patterns to the formation of the anomalous anticyclone over Europe. Summary and discussion are shown in Section 4.
2. Data and Method
The daily surface air temperature (SAT) at 2 m, air temperature, geopotential height, horizontal winds, vertical velocity, shortwave radiations and total cloud cover (TCC) were derived from the National Centers for Environmental Prediction–National Center for Atmospheric Research (NCEP–NCAR) reanalysis spanning from January 1948 to the present [32]. Geopotential height, horizontal wind and omega were on a horizontal resolution of 2.5° × 2.5°. Shortwave radiations and TCC were on a T62 Gaussian grid. Although the NCEP–NCAR reanalysis had a significant lack of data before 1967 [33,34], it showed relatively high consistency with other reanalysis datasets in describing the SAT and atmospheric circulation anomalies in June of 2019. In particular, we also employed the surface temperature and atmospheric circulation data from the European Center for Medium Range Weather Forecasts Reanalysis 5 (ERA5) [35] to confirm the results obtained from the NCEP–NCAR reanalysis. The ERA5 dataset spans from January 1979 to the present. The results derived from the ERA5 were very similar to those obtained from the NCEP–NCAR. Hence, we have only presented the results derived from the NCEP–NCAR in the following analysis.
This study employed the wave activity flux proposed by Takaya and Nakamura [36,37] to describe the horizontal propagation of the stationary Rossby wave train. In this study, a hot day was identified when the daily maximum SAT was above the 95th percentile based on the period of 1948–2019 [38]. The monthly teleconnection indexes, including the East Atlantic/Western Russia teleconnection (EAWR) index, North Atlantic Oscillation (NAO) index and Scandinavia teleconnection (SCAND) index, were obtained from the website of the Climate Prediction Center (CPC) [39]. Following Ding and Wang [40], the circumglobal teleconnection (CGT) index was defined as region-average 200-hPa geopotential height over 35°–40° N, 60°–70° E. The Atlantic–Eurasian teleconnection (AEA) was proposed by Li and Ruan [31], which is an atmospheric teleconnection between the North Atlantic and the Eurasian continent. The AEA index was defined by 500-hPa geopotential height anomalies at five points (i.e., A (35° N, 40° W), B (52.5° N, 17.5° W), C (57.5° N, 25° E), D (72.5° N, 70° E) and E (42.5° N, 107.5° E)) based on the following equation:
where AEAI indicates the AEA index and denotes 500-hPa geopotential height anomalies at the corresponding points.
3. Results
3.1. Observations for the Exceptionally Hot June of 2019 in Europe
Figure 1a presents the spatial distribution of SAT anomalies in June of 2019. Large positive anomalies of SAT could be found over Europe (40°–60° N, 0–50° E, the black box), with an amplitude higher than 5 °C over several regions. This suggests most parts of Europe experienced an extreme high temperature event. Air temperature warming over Europe could be observed from the lower to upper troposphere over Europe, with maximum values at around 300–500 hPa (Figure not shown). Besides SAT, large positive anomalies of hot days in June of 2019 also appeared over Europe, indicating the abnormal persistency of high temperatures in Europe (Figure 1b). In addition, it was shown that positive SAT anomalies of higher than 2 °C over Europe were maintained from June 1st to 27th June (Figure 1c), which spanned nearly the whole month. Figure 1d shows the time series of SAT anomalies averaged over Europe (black box in Figure 1a). It was noted that the SAT over Europe in June of 2019 was the highest since 1948 (Figure 1d). Previous studies have demonstrated that the extremely high temperatures over Europe could be attributed to a global warming trend and the natural climate variability [15,23,41]. A significant increasing trend was observed in Figure 1d as expected, indicating the possible role of global warming. However, after removing the linear trend, the SAT anomalies in June of 2019 were still the highest ones although the magnitude was slightly weakened (blue bars in Figure 1d). This suggests that internal variabilities such as atmospheric circulations may have significant contributions to the exceptionally hot June of 2019. As a matter of fact, another record-breaking heatwave also struck Western Europe in July of 2019 [42]. However, unlike that in June, the SAT anomaly in July of 2019 over Europe did not break the July record since 1948 (Figures not shown). Thus, in this study we focused on investigating the underlying physical process of the exceptional European high temperatures in June of 2019. It was noted that the positive SAT anomalies over Europe had a high continuity during the whole of June of 2019 (Figure 1c). Therefore, we firstly used monthly data in the following analysis to analyze the factors for the extreme high temperature in June and then examined the pentad evolutions to support the conclusions.
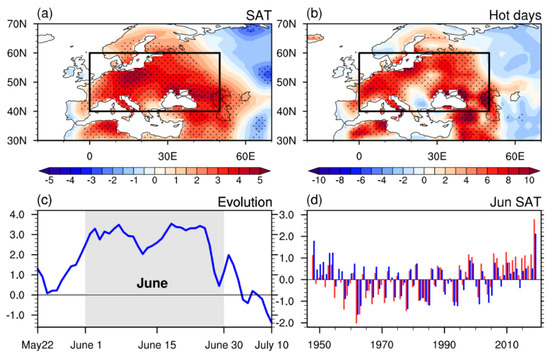
Figure 1.
(a) Anomalies of surface air temperature (SAT) (unit: °C) in June of 2019 relative to 1948–2019. (b) Anomalies of hot days in June of 2019 relative to 1948–2019. Hot days were identified when the surface maximum temperature of a day exceeded the 95% percentile. Stippling regions in (a) and (b) respectively represent SAT and hot day anomalies exceeding one standard deviation. Black boxes in (a) and (b) were employed to calculate region-mean SAT anomalies. (c) Evolution of daily SAT anomalies averaged over Europe (black box in (a,b)) from 22nd May to 10th July in 2019. (d) Time series of SAT anomalies in June averaged over Europe (black box in (a,b)) from 1948 to 2019 with (red bars) and without (blue bars) the linear trend.
3.2. Atmospheric Circulation Anomalies in June of 2019
Figure 2 displays the 850-hPa winds and 500-hPa geopotential height anomalies in June of 2019. At 850-hPa, a low-level anticyclonic anomaly was seen over Europe (Figure 2a). The southerly wind anomalies to the west side of the anomalous anticyclone transported warmer air from lower latitudes towards Europe and contributed to the SAT warming there (Figure 2a). At 500-hPa, an atmospheric wave train was obvious, extending eastward from high latitudes in the North Atlantic across Europe to the Russian Far East (Figure 2b). The geopotential height anomalies at 200-hPa (Figure not shown) were similar to those at 500-hPa, indicating the barotropic vertical structure of the atmospheric circulation anomalies in the troposphere. The positive geopotential height anomalies over Europe associated with this atmospheric wave train may have facilitated the generation of positive SAT anomalies there as indicated by previous studies [9,10,11,15]. In particular, the positive geopotential height anomalies over Europe were accompanied by significant downward motion anomalies and less TCC (Figure 3a,c), which led to an increase in downward shortwave radiation (Figure 3b) and resulted in SAT warming (Figure 1a). As demonstrated by previous studies, atmospheric circulation anomalies in association with the high temperature can enhance the deficiency of soil moisture which in turn leads to the escalation of surface air temperature warming through the positive land–atmosphere feedback [11,21]. Figure 4 displays the soil moisture anomalies in June of 2019. It is shown that positive anomalies of soil moisture were witnessed in Central Europe and negative anomalies of soil moisture appeared in Western and Eastern Europe, which matched well with the spatial distribution of omega anomalies (Figure 1a and Figure 4). The abnormal soil moisture deficiency over Eastern Europe could have been due to the downward motion anomalies induced by the anticyclonic circulation at 500-hPa and in turn contributed to the escalation of local SAT warming via a positive land–atmosphere feedback (Figure 1a, Figure 3c and Figure 4).
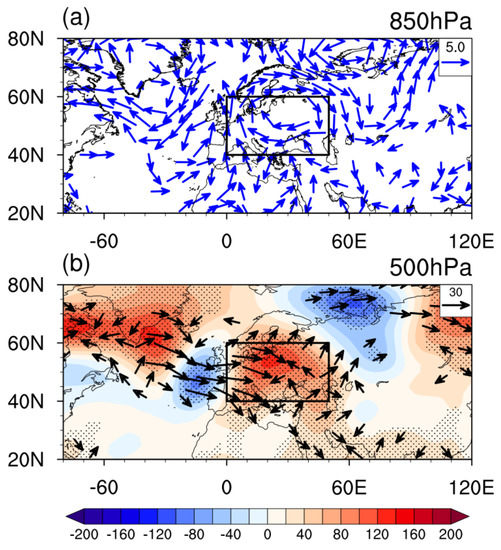
Figure 2.
(a) Anomalies of 850-hPa horizontal winds (unit: m·s−1) in June of 2019 relative to 1948–2019. Only anomalies exceeding one standard deviation are shown. (b) Anomalies of 500-hPa geopotential height (shadings, unit: gpm) and wave activity fluxes (vectors, unit: m2·s−2) derived from Takaya and Nakamura [32,33] in June of 2019 relative to 1948–2019. Stippling regions in (b) represent 500-hPa geopotential height anomalies exceeding one standard deviation.
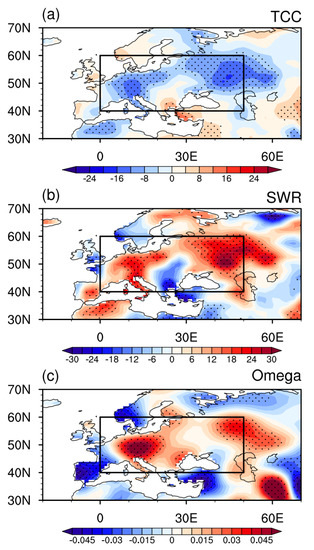
Figure 3.
Anomalies of (a) total cloud cover (TCC) (unit: %), (b) short wave radiation (SWR) (unit: W m2) and (c) 500-hPa omega (i.e., the vertical velocity under pressure coordinates) (unit: Pa·s−1) in June of 2019 relative to 1948–2019. Stippling regions in (a–c) represent TCC, SWR, and omega anomalies exceeding one standard deviation from 1948 to 2019, respectively.
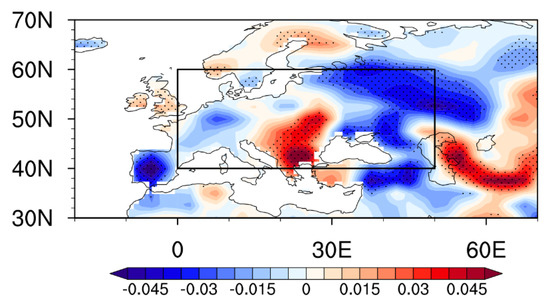
Figure 4.
Anomalies of volumetric soil moisture between 0 and 10 cm (unit: fraction) in June of 2019 relative to 1948–2019. Stippling regions represent soil moisture anomalies exceeding one standard deviation from 1948 to 2019.
3.3. Contributions of Atmospheric Teleconnections
The above analysis indicates that the abnormally high SAT over Europe in June of 2019 was mainly due to an atmospheric wave train over the mid-high latitudes of the North Atlantic and Eurasia, which led to anticyclonic anomalies over Europe. In the following, we have further examined the possible contributions of the well-known atmospheric teleconnections (which have been proposed by previous studies) over the North Atlantic and Eurasia to the formation of the atmospheric circulation anomalies in June of 2019. Figure 5 presents the spatial distribution of SAT and 500-hPa geopotential height anomalies with respect to the EAWR, AEA, CGT, NAO, and SCAND teleconnections for the period of 1948 to 2019. Notice that the linear trends of all variables have been removed in constructing Figure 5. The correlation coefficients of the region-average SAT anomalies over Europe in June with the June EAWR, AEA and CGT teleconnection indexes were 0.29, 0.39 and 0.29, respectively, all significant at a 95% confidence level. In addition, it is shown that significant positive SAT anomalies are seen over most parts of Europe in association with the EAWR, AEA and CGT, especially the AEA (Figure 5a–c). Meanwhile, the atmospheric circulation anomalies associated with the EAWR, AEA and CGT all displayed positive geopotential height anomalies over Europe (Figure 5f–h). To confirm the roles of the EAWR, AEA and CGT, Figure 6 further displays the normalized time series of the EAWR, AEA and CGT indices in June from 1948 to 2019. It is shown that the June AEA index in 2019 reached 2.5 standard deviations above the normal (blue bars in Figure 6). The CGT and EAWR indexes in 2019 were also much higher than normal, with 1.0 and 0.7 standard deviations, respectively (red and green bars in Figure 6). The above evidence indicates that the anomaly of the AEA index may have played a primary role in contributing to the formation of the SAT warming over Europe in June of 2019.
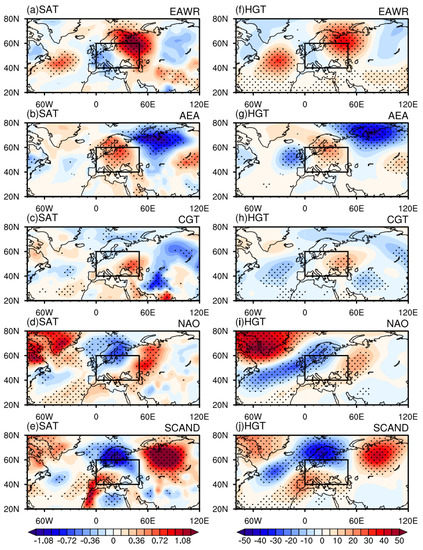
Figure 5.
Anomalies of (a–e) SAT (unit: °C) and (f–j) 500-hPa geopotential height (unit: gpm) regressed upon the EAWR, AEA, CGT, NAO and SCAND teleconnection indices. Please see Section 2 in the text for the detailed definitions of the above teleconnection indices. Stippling regions in (a–e) and (f–j) represent SAT and 500-hPa geopotential height anomalies exceeding one standard deviation, respectively.
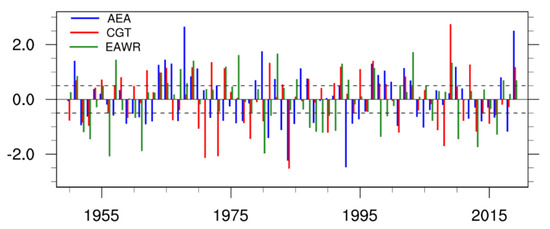
Figure 6.
Normalized time series of AEA (blue bars), CGT (red bars) and EAWR (green bars) indices in June from 1950 to 2019.
By contrast, correlations of the region-average SAT anomalies over Europe with the NAO and SCAND teleconnections indices were weak and statistically insignificant. The SAT anomalies associated with these two teleconnections did not show a coherent pattern over Europe (Figure 5d,e). In addition, spatial patterns of the atmospheric wave train related to the NAO and SCAND indexes had less consistency with that in June of 2019 (Figure 5i–j and Figure 2b). This suggests that the NAO and SCAND teleconnection patterns may have had little contribution to the occurrence of the extreme high temperature in June of 2019.
In order to further confirm the role of the atmospheric wave train in generating the SAT warming over Europe, we examined the pentad evolutions of SAT and 500-hPa geopotential height anomalies from 1st to 5th June and 26th to 30th June in 2019. It is shown in Figure 7 that from 1st to 5th June, the centers of the positive SAT anomalies mainly concentrated over Western Europe and then moved to Central Europe from 6th to 20th June. The positive SAT anomalies moved to Eastern Europe from 21st to 25th June and were replaced by negative SAT anomalies from 26th to 30th June (Figure 7). The evolution of the positive anomalies of 500-hPa geopotential height coincided well with the centers of the positive SAT anomalies over Europe (Figure 7). Therefore, the pentad evolutions of SAT and 500-hPa geopotential height anomalies further verify the important role of anticyclonic circulation anomalies associated with the upstream wave train in the formation of positive SAT anomalies over Europe.
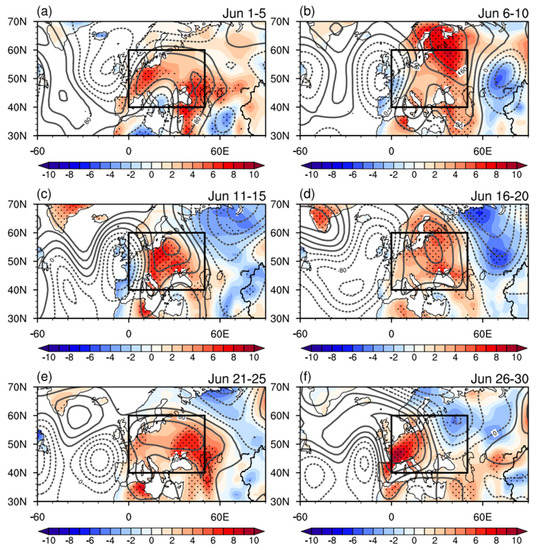
Figure 7.
Pentad evolution of SAT (shadings, unit: °C) and 500-hPa geopotential height (contours, unit: gpm) in June of 2019 relative to 1948–2019. The interval of contours is 40 gpm. Negative anomalies of 500-hPa geopotential height are denoted by the dashed contours. Stippling regions represent SAT anomalies exceeding one standard deviation from 1948 to 2019. (a–f) respectively illustrate SAT and 500-hPa geopotential height anomalies during the first pentad to the sixth pentad in June of 2019.
Furthermore, we compared the evolutions of the daily AEA index and European SAT anomalies from 1st June to 30th June (shown in Figure 8) to examine the role of AEA teleconnection. It turned out that the evolution of the AEA index showed a high consistency with the evolution of the SAT anomalies over Europe, with the former leading the latter by about 2 days. This further indicated that the daily evolution of SAT warming over Europe was closely related to the AEA teleconnection pattern.
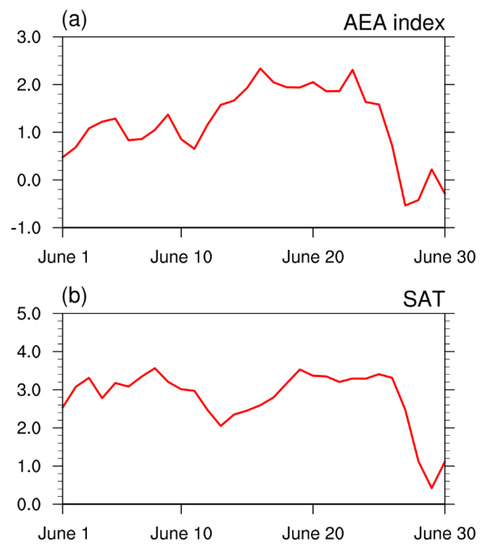
Figure 8.
Daily evolutions of (a) AEA index and (b) SAT anomalies averaged over Europe from 1st to 30th June in 2019.
4. Summary and Discussion
Observations show that the SAT in June of 2019 over Europe broke the June record since 1948. This study preliminarily investigated the role of atmospheric circulation anomalies in contributing to the exceptionally hot June of 2019. The atmospheric circulation anomalies in June of 2019 over Europe were dominated by positive geopotential height anomalies and anomalous anticyclones, which had a barotropic structure. These positive geopotential height anomalies were accompanied by downward motion and a decrease in TCC and increase in downward surface shortwave radiation, which further resulted in SAT warming over Europe. The SAT warming over Europe, especially over Eastern Europe, may have helped decrease the local soil moisture, which in turn maintained the local surface air temperature warming through a positive land–atmosphere feedback. In addition, the anomalous southerly winds to the west side of the anomalous anticyclone brought warmer and wetter air northward from lower latitudes, which also led to SAT warming. Formation of the positive geopotential height anomalies was found to be related to an atmospheric wave train extending from high latitudes in the North Atlantic eastward to Eurasia. It is suggested that the atmospheric wave train over the North Atlantic–Eurasia region associated with SAT warming over Europe can be well-described by the AEA index in the sense of both monthly mean and daily variation. The EAWR and CGT may also have had some impact on the formation of SAT warming over Europe, but their impact was relatively weaker compared to that of the AEA teleconnection.
The results of this study could help improve the understanding of the mechanism for the occurrence of extremely high temperatures over Europe and may have important implications for the seasonal prediction of European heatwaves. Previous studies indicated that the internal dynamical atmospheric processes associated with the interaction between synoptic-scale eddies and low frequency mean flow are important for the formation and maintenance of atmospheric teleconnections over mid-high latitudes [31,40,43,44,45]. In addition, studies indicated that North Atlantic and North Pacific SST anomalies can trigger atmospheric wave trains over Eurasia and impact Eurasian climate anomalies [46,47,48]. It remains to be explored whether such SST anomalies over the North Pacific and North Atlantic had a contribution to the formation of the AEA-like atmospheric wave train over the North Atlantic and Eurasia in June of 2019. These questions could be further investigated in the near future.
Author Contributions
Conceptualization, S.C. and W.Z.; methodology, S.C.; software, W.Z.; validation, N.Z., W.Z. and S.C.; formal analysis, W.Z.; investigation, W.Z.; resources, N.Z.; data curation, W.Z.; writing—original draft preparation, W.Z.; writing—review and editing, S.C. and N.Z..; visualization, W.Z.; supervision, S.C.; project administration, N.Z.; funding acquisition, N.Z. All authors have read and agreed to the published version of the manuscript.
Funding
This research was funded by National Natural Science Foundation of China, grant number 41520104008, 91637208 and 41575090, and Numerical Meteorological Center Youth Fund, grant number Q202003. The APC was funded by National Natural Science Foundation of China, grant number 41575090.
Acknowledgments
We thank three anonymous reviewers for their constructive suggestions, which helped to improve the paper.
Conflicts of Interest
The authors declare no conflict of interest.
References
- Wernberg, T.; Smale, D.A.; Tuya, F.; Thomsen, M.S.; Langlois, T.J.; de Bettignies, T.; Bennett, S.; Rousseaux, C.S. An extreme climatic event alters marine ecosystem structure in a global biodiversity hotspot. Nat. Clim. Chang. 2013, 3, 78–82. [Google Scholar] [CrossRef]
- Mitchell, D.; Heaviside, C.; Vardoulakis, S.; Huntingford, C.; Masato, G.; Guillod, B.P.; Frumhoff, P.; Bowery, A.; Wallom, D.; Allen, M. Attributing human mortality during extreme heat waves to anthropogenic climate change. Environ. Res. Lett. 2016, 11, 074006. [Google Scholar] [CrossRef]
- Baumbach, L.; Siegmund, J.F.; Mittermeier, M.; Donner, R.V. Impacts of temperature extremes on European vegetation during the growing season. Biogeosciences 2017, 14, 4891–4903. [Google Scholar] [CrossRef]
- Deng, K.Q.; Yang, S.; Ting, M.F.; Zhao, P.; Wang, Z.Y. Dominant Modes of China Summer Heat Waves Driven by Global Sea Surface Temperature and Atmospheric Internal Variability. J. Clim. 2019, 32, 3761–3775. [Google Scholar] [CrossRef]
- Meehl, G.A.; Tebaldi, C. More intense, more frequent, and longer lasting heat waves in the 21st century. Science 2004, 305, 994–997. [Google Scholar] [CrossRef]
- Trenberth, K.E.; Fasullo, J.T. Climate extremes and climate change: The Russian heat wave and other climate extremes of 2010. J. Geophys. Res. Atmos. 2012, 117, D17103. [Google Scholar] [CrossRef]
- Duchez, A.; Frajka-Williams, E.; Josey, S.A.; Evans, D.G.; Grist, J.P.; Marsh, R.; McCarthy, G.D.; Sinha, B.; Berry, D.I.; Hirschi, J.J.M. Drivers of exceptionally cold North Atlantic Ocean temperatures and their link to the 2015 European heat wave. Environ. Res. Lett. 2016, 11, 074004. [Google Scholar] [CrossRef]
- Deng, K.Q.; Yang, S.; Ting, M.F.; Lin, A.L.; Wang, Z.Q. An Intensified Mode of Variability Modulating the Summer Heat Waves in Eastern Europe and Northern China. Geophys. Res. Lett. 2018, 45, 11361–11369. [Google Scholar] [CrossRef]
- Tomczyk, A.M.; Bednorz, E. Heat waves in Central Europe and tropospheric anomalies of temperature and geopotential heights. Int. J. Climatol. 2019, 39, 4189–4205. [Google Scholar] [CrossRef]
- Black, E.; Blackburn, M.; Harrison, G.; Hoskins, B.; Methven, J. Factors Contributing to the Summer 2003 European Heatwave. Atmosphere 2004, 59, 217–223. [Google Scholar] [CrossRef]
- Fischer, E.M.; Seneviratne, S.I.; Luthi, D.; Schar, C. Contribution of land-atmosphere coupling to recent European summer heat waves. Geophys. Res. Lett. 2007, 34, L06707. [Google Scholar] [CrossRef]
- Porebska, M.; Zdunek, M. Analysis of extreme temperature events in Central Europe related to high pressure blocking situations in 2001–2011. Meteorol. Z. 2013, 22, 533–540. [Google Scholar] [CrossRef]
- Grumm, R.H. The Central European and Russian Heat Event of July-August 2010. Bull Am. Soc. 2011, 92, 1285–1296. [Google Scholar] [CrossRef]
- Tomczyk, A.M. Impact of atmospheric circulation on the occurrence of heat waves in southeastern Europe. Idojaras 2016, 120, 395–414. [Google Scholar]
- Dole, R.; Hoerling, M.; Perlwitz, J.; Eischeid, J.; Pegion, P.; Zhang, T.; Quan, X.W.; Xu, T.Y.; Murray, D. Was there a basis for anticipating the 2010 Russian heat wave? Geophys. Res. Lett. 2011, 38, L06702. [Google Scholar] [CrossRef]
- Deng, K.Q.; Yang, S.; Ting, M.F.; Tan, Y.H.; He, S. Global Monsoon Precipitation: Trends, Leading Modes, and Associated Drought and Heat Wave in the Northern Hemisphere. J. Clim. 2018, 31, 6947–6966. [Google Scholar] [CrossRef]
- Chen, S.F.; Wu, R.G. Interdecadal Changes in the Relationship between Interannual Variations of Spring North Atlantic SST and Eurasian Surface Air Temperature. J. Clim. 2017, 30, 3771–3787. [Google Scholar] [CrossRef]
- Chen, S.F.; Wu, R.G.; Liu, Y. Dominant Modes of Interannual Variability in Eurasian Surface Air Temperature during Boreal Spring. J. Clim. 2016, 29, 1109–1125. [Google Scholar] [CrossRef]
- Fragkoulidis, G.; Wirth, V.; Bossmann, P.; Fink, A.H. Linking Northern Hemisphere temperature extremes to Rossby wave packets. Q. J. R. Meteorol. Soc. 2018, 144, 553–566. [Google Scholar] [CrossRef]
- Lau, W.K.M.; Kim, K.M. The 2010 Pakistan Flood and Russian Heat Wave: Teleconnection of Hydrometeorological Extremes. J. Hydrometeorol. 2012, 13, 392–403. [Google Scholar] [CrossRef]
- Miralles, D.G.; Teuling, A.J.; van Heerwaarden, C.C.; de Arellano, J.V.G. Mega-heatwave temperatures due to combined soil desiccation and atmospheric heat accumulation. Nat. Geosci. 2014, 7, 345–349. [Google Scholar] [CrossRef]
- Hirsch, A.L.; Evans, J.P.; Di Virgilio, G.; Perkins-Kirkpatrick, S.E.; Argueso, D.; Pitman, A.J.; Carouge, C.C.; Kala, J.; Andrys, J.; Petrelli, P.; et al. Amplification of Australian Heatwaves via Local Land-Atmosphere Coupling. J. Geophys. Res. Atmos. 2019, 124, 13625–13647. [Google Scholar] [CrossRef]
- Rahmstorf, S.; Coumou, D. Increase of extreme events in a warming world. Proc. Natl. Acad. Sci. USA 2011, 108, 17905–17909. [Google Scholar] [CrossRef] [PubMed]
- Beniston, M. Entering into the “greenhouse century”: Recent record temperatures in Switzerland are comparable to the upper temperature quantiles in a greenhouse climate. Geophys. Res. Lett. 2007, 34, L16710. [Google Scholar] [CrossRef]
- Uhe, P.; Otto, F.E.L.; Haustein, K.; van Oldenborgh, G.J.; King, A.D.; Wallom, D.C.H.; Allen, M.R.; Cullen, H. Comparison of methods: Attributing the 2014 record European temperatures to human influences. Geophys. Res. Lett. 2016, 43, 8685–8693. [Google Scholar] [CrossRef]
- Stott, P.A.; Stone, D.A.; Allen, M.R. Human contribution to the European heatwave of 2003. Nature 2004, 432, 610–614. [Google Scholar] [CrossRef]
- Van Oldenborgh, G.J.; Drijfhout, S.; van Ulden, A.; Haarsma, R.; Sterl, A.; Severijns, C.; Hazeleger, W.; Dijkstra, H. Western Europe is warming much faster than expected. Clim. Past. 2009, 5, 1–12. [Google Scholar] [CrossRef]
- Wang, J.; Chen, Y.; Tett, S.; Yan, Z.W.; Zhai, P.M.; Feng, J.M.; Xia, J.J. Anthropogenically-driven increases in the risks of summertime compound hot extremes. Nat. Commun. 2020, 11, 528. [Google Scholar] [CrossRef] [PubMed]
- Christidis, N.; Jones, G.S.; Stott, P.A. Dramatically increasing chance of extremely hot summers since the 2003 European heatwave. Nat. Clim. Chang. 2015, 5, 46–50. [Google Scholar] [CrossRef]
- Van Oldenborgh, G.J.; Vautard, R.; Boucher, O.; Otto, F.; Haustein, K.; Soubeyroux, J.M.; Seneviratne, S.I.; Vogel, M.M.; Aalst, M.; Stott, P. Human Contribution to the Record-Breaking June 2019 Heat Wave in France. Available online: https://www.worldweatherattribution.org/human-contribution-to-record-breaking-june-2019-heatwave-in-france/ (accessed on 1 March 2020).
- Li, J.P.; Ruan, C.Q. The North Atlantic-Eurasian teleconnection in summer and its effects on Eurasian climates. Environ. Res. Lett. 2018, 13, 024007. [Google Scholar] [CrossRef]
- Kalnay, E.; Kanamitsu, M.; Kistler, R.; Collins, W.; Deaven, D.; Gandin, L.; Iredell, M.; Saha, S.; White, G.; Woollen, J.; et al. The NCEP/NCAR 40-year reanalysis project. Bull Am. Soc. 1996, 77, 437–471. [Google Scholar] [CrossRef]
- Greatbatch, R.J.; Rong, P.P. Discrepancies between different Northern Hemisphere summer atmospheric data products. J. Clim. 2006, 19, 1261–1273. [Google Scholar] [CrossRef]
- Inoue, T.; Matsumoto, J. A comparison of summer sea level pressure over East Eurasia between NCEP-NCAR reanalysis and ERA-40 for the period 1960–1999. J. Meteorol. Soc. Jpn. 2004, 82, 951–958. [Google Scholar] [CrossRef]
- Copernicus Climate Change Service (C3S). ERA5: Fifth Generation of ECMWF Atmospheric Reanalyses of the Global Climate. Copernicus Climate Change Service Climate Data Store (CDS). Available online: https://cds.climate.copernicus.eu/cdsapp#!/home (accessed on 1 January 2020).
- Takaya, K.; Nakamura, H. A formulation of a wave-activity flux for stationary Rossby waves on a zonally varying basic flow. Geophys. Res. Lett. 1997, 24, 2985–2988. [Google Scholar] [CrossRef]
- Takaya, K.; Nakamura, H. A formulation of a phase-independent wave-activity flux for stationary and migratory quasigeostrophic eddies on a zonally varying basic flow. J. Atmos. Sci. 2001, 58, 608–627. [Google Scholar] [CrossRef]
- Sillmann, J.; Kharin, V.V.; Zhang, X.; Zwiers, F.W.; Bronaugh, D. Climate extremes indices in the CMIP5 multimodel ensemble: Part 1. Model evaluation in the present climate. J. Geophys. Res. Atmos. 2013, 118, 1716–1733. [Google Scholar] [CrossRef]
- Climate Prediction Center. Available online: https://www.cpc.ncep.noaa.gov/data (accessed on 1 March 2020).
- Ding, Q.H.; Wang, B. Circumglobal teleconnection in the Northern Hemisphere summer. J. Clim. 2005, 18, 3483–3505. [Google Scholar] [CrossRef]
- Otto, F.E.L.; Massey, N.; van Oldenborgh, G.J.; Jones, R.G.; Allen, M.R. Reconciling two approaches to attribution of the 2010 Russian heat wave. Geophys. Res. Lett. 2012, 39, L04702. [Google Scholar] [CrossRef]
- Vautard, R.; van Oldenborgh, G.J.; Otto, F.E.L.; Vogel, M.M.; Soubeyroux, J.M.; Kreienkamp, F.; Stott, P.; van Aalst, M. Human Contribution to the Record-Breaking July 2019 Heat Wave in Western Europe. Available online: https://www.worldweatherattribution.org/human-contribution-to-the-record-breaking-july-2019-heat-wave-in-western-europe/ (accessed on 1 March 2020).
- Barnston, G.A.; Livezey, E.R. Classification, seasonality and persistence of low-frequency atmospheric circulation patterns. Mon. Weather Rev. 1987, 115, 1083–1126. [Google Scholar] [CrossRef]
- Lau, N.C.; Nath, M.J. Variability of the baroclinic and barotropic transient eddy forcing associated with monthly changes. J. Atmos. Sci. 1991, 48, 2589–2613. [Google Scholar] [CrossRef]
- Chen, S.F.; Wu, R.; Chen, W.; Hu, K.M.; Yu, B. Structure and dynamics of a springtime atmospheric wave train over the North Atlantic and Eurasia. Clim. Dyn. 2020. [Google Scholar] [CrossRef]
- Chen, S.F.; Wu, R.; Chen, W.; Yao, S.L.; Yu, B. Coherent interannual variations of springtime surface temperature and temperature extremes between central-northern Europe and Northeast Asia. J. Geophys. Res. Atmos. 2020. [Google Scholar] [CrossRef]
- Zhao, W.; Chen, S.F.; Chen, W.; Yao, S.; Nath, D.; Yu, B. Interannual variations of the rainy season withdrawal of the monsoon transitional zone in China. Clim. Dyn. 2019, 53, 2031–2046. [Google Scholar] [CrossRef]
- Chen, S.F.; Guo, J.P.; Song, L.Y.; Li, J.; Liu, L.; Cohen, J. Interannual variation of the spring haze pollution over the North China Plain: Roles of atmospheric circulation and sea surface temperature. Int. J. Climatol. 2019, 39, 783–798. [Google Scholar] [CrossRef]
© 2020 by the authors. Licensee MDPI, Basel, Switzerland. This article is an open access article distributed under the terms and conditions of the Creative Commons Attribution (CC BY) license (http://creativecommons.org/licenses/by/4.0/).