Abstract
The dispersion of particulate matter emitted by road transport to the vicinity of roads is predominantly influenced by the character of the air velocity field. The air flow depends on factors such as the speed and direction of the blowing wind, the movement of cars, and the geometries of the buildings around a road. Numerical modeling based on the control volume method was used in this study to describe the relevant processes closely. Detailed air velocity fields were identified in the vicinity of a straight road surrounded by various patterns of built-up urban land. The evaluation of the results was generalized to exponential expressions, affecting the decrease of the mass concentration of fine particles with the increasing distance from the road. The obtained characteristics of the mass concentration fields express the impact of the building geometries and configurations on the dispersion of particulate matter into the environment. These characteristics are presented for two wind speeds, namely, 2 m·s−1 and 4 m·s−1. Furthermore, the characteristics are introduced in relation to three wind directions: perpendicularly, obliquely, and in parallel to the road. The results of the numerical simulations are compared with those obtained via the in-situ measurements, for verification of the validity of the linear emission source calculation.
1. Introduction
Urban air is significantly polluted by flue gases and fine particulates. The main sources of these pollutants constitute motor vehicle traffic and local furnaces, as well as heating systems [1]. Pollutants produced by motor vehicles are released into the atmosphere in the immediate vicinity to humans present near roads, whether outdoor or in a closed environment such as an adjacent building or a means of transport. Although air pollutant emissions generated by combustion engines have been markedly reduced in recent years, car traffic has remained the most prominent single cause of air pollution in urban centers globally, exerting a critical impact on human health [2]. Such an adverse effect partially stems from long-term persistence of the pollutants in ground-level layers of the air flowing through built-up urban areas; peak mass concentration values are commonly found in close proximity to roads and their intersections [3]. Street canyons receive only limited amounts of fresh air, and this condition progressively leads to rising local ambient concentrations and long pollutant wash-out periods in built-up urban lands. Importantly, there are also certain special scenarios to be considered, including weather with very low or zero air flow velocities. The overall negative health impact of the pollution is exacerbated by the fact that the maximum rates of human presences at urban roads are reached during rush hours, namely, the time when the highest air pollutant mass concentrations are usually detected [4].
In this context, attention has been paid in recent years to particulate matter emissions with diameters less than 10 μm (PM10). With the development of measurement technology and the state of knowledge, attention was gradually paid to smaller particles. Today, PM2.5 and PM1 mass concentrations are monitored in urban areas as the standard. Czech Hydrometeorological Institute (2018) reported that 61% of fine particles identified in urban areas are generated by road transport.
For descriptive purposes we can point out that combustion-generated particles result from the complex physico-chemical transformations that constitute the combustion process [5]. Such particles then shape and are carried in the flow of waste gases emitted from automobile exhaust pipes. Other instances of particulate matter include relevant products of brake, tire, and roadway abrasion and resuspension of the particulates deposited earlier. In all size categories, the mass concentration of the particles markedly decreases with increasing distance from the road [6]. The dispersion into the environment is influenced particularly by the character of the air velocity field in locations near the roadside. The actual mass concentration is then affected by, among other aspects, the particulate deposition, resuspension, and interaction with solid surfaces and vegetation. By extension, concurrently with these processes there occurs partial physical changes in the particulate matter due to collisions between and growth of the particles; on a lesser scale, the particulates also undergo chemical and photochemical transformations.
Methods suitable for modelling of pollution dispersion were discussed from the beginning [7], while, at present, the individual factors influencing the dispersion of pollutants produced by transport are of more interest. This is caused mainly by the effort to provide the most accurate information about the behavior of pollutants from transport and to more accurately estimate the population exposure in the urban environment. Simulation of traffic induced dispersion at a high resolution using the computational fluid dynamics software, Fluidity and traffic simulation software PTV Vissim was performed to demonstrate how moving vehicles can have a significant effect on street level concentration fields and how large vehicles such as buses can also cause acute high concentration events at the roadside [8]. Influences of vehicle-induced turbulences on pollutant dispersions in a street canyon was discussed as well in [9]. The street morphology relationship with air quality was described by the authors of [10] based on six irregular real-world cases selected from America, Europe, and China using computational fluid dynamic (CFD) simulations to assess the ventilations and pollutant dispersion within street canyons with a parallel approaching wind. The results showed that the street morphology characteristics, including the street width, lateral openings, and intersections, are closely related to the air flows in street canyons. Different types of intersections were assessed as well. The octagon intersections were favorable for air flowing through the lateral openings and improved the channel flows. The oblique intersections can also greatly improve the street ventilations, mainly due to the enhanced air flows through the lateral openings and the increased turbulent diffusion through the street roofs. The effect of buildings with wedge-shaped roofs surrounding urban street canyons on buoyant wind-driven pollutant plume dispersions was presented by Zhang et al. [11]. Miao et al. [12] showed that street canyons’ morphology and air humidity were two of the most important factors affecting suspended particulate matter concentrations in urban street canyons. The Meso-NH model (atmospheric non hydrostatic research model) enhanced with an immersed boundary method (IBM) is a promising way to represent flow interactions with buildings (as a 3D shape of buildings) and orography in atmospheric models for urban applications [13].
This paper discusses in detail the dispersion of particles from a road into differently configured urban environments. Modeling via the control volume method (computational fluid dynamics, CFD) embodies the most suitable tool for detailed identification of an air velocity field in urban areas. This software approach enables the computation process to cover geometrically complex zones (such as built-up urban land) and to capture the effect of cars traveling along the road. The vehicles drag with them the air from the immediate vicinity, creating an air flow that moves in their driving direction, and they generate multiple turbulent vortices that substantially influence the dispersion of particles in the region closely adjacent to the vortices‘ source [3]. The elevated turbulence then exerts an impact on the air flow and its interaction with solid surfaces (see Figure 1).
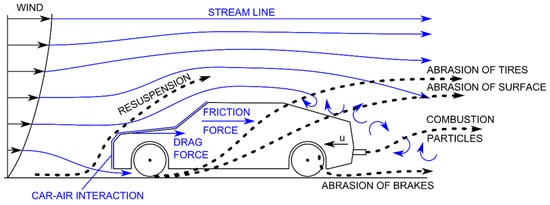
Figure 1.
The fluxes of traffic-generated fine particulate matter.
Within the article, computational modeling is employed to monitor the dispersion of particles from a straight section of a road passing through five different types of urban environments. In each of these patterns, we conducted a parametric study evaluating the influence of wind speed and wind direction on particle dispersion in the vicinity of the road. The computed mass concentration maps were generalized into 2D-rendered relationships between the PM10 mass concentrations and their distances from the road. These results will enable a quick analytical calculation of the PM10 concentrations in urban areas geometrically close to the tested areas, because the correctness of the inclusion of a linear source of emissions in the numerical model is crucial for the subsequent realistic solution of the dispersion of pollutant particles. The linear emission source calculation will be validated with the results of in-situ measurements at close vicinity to the studied road.
2. Numerical Model
2.1. Built-Up Area Geometries
In terms of forming the mathematical models, the main criterion defining the actual choice of the areas to be modelled consisted in selecting such regions that, from the perspective of their geometries, are accurately convertible into a computational mesh, with the smallest possible amount of necessary geometrical simplifications. A major complementary criterion was embodied in the steady cruising of vehicles on the roads comprised within the areas of interest; this requirement arises from the stationary character of the developed mathematical model, where the traffic dynamics would introduce undesired inaccuracies.
The research involved converting into specific numerical models five classic types of built-up urban lands adopted from various locations within the city of Brno (CZ); collectively, these sample regions occupy an area of 1000 × 1000 m2. The real land patterns are substituted with a horizontal surface. The center of each model area is intersected by a straight, four-lane road carrying two-way traffic, with two lanes in each direction. Real geometry-based buildings are assumed to be present in the vicinity of the road, and their positions correspond to the real-world layout obtained through processing the ground plan view contained in the geodetic survey map of the relevant urban district. Progressively, the following numerical models were designed (for the images, see Figure 2):
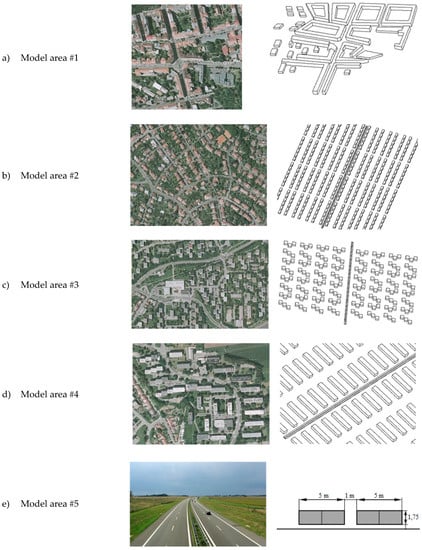
Figure 2.
Visual representation of the model areas and the building geometries embodied in the relevant numerical models.
- Model area #1: An intersection located in an urban center: a crossing of two roads that pass through a built-up area comprising lines of four-story houses (a concrete geometry from the central district of Brno).
- Model area #2: A road passing through a residential area with single-family houses; the 10-m-high units are positioned with a spacing of 15 m, the ground plan of each home equals 10 × 15 m2, six houses in a row form a regular block of buildings, there is a 15-m-wide aisle (perpendicular to the main road) separating individual blocks of houses, and 20-m-wide service roads parallel to the main road run through the urban area every two rows of houses.
- Model area #3: A road running between small-size prefabricated houses positioned at regular intervals and having the dimensions of of 20 × 20 × 20 m2. The buildings are arranged into separate groups, each of which contains three closely neighboring units.
- Model area #4: A road passing through an area containing prefabricated houses configured into longitudinally oriented 15-m-high blocks that are positioned at regular intervals of 50 m and invariably exhibit the ground plan dimensions of 17 × 90 m2.
- Model area #5: A road in a free space: an almost ideally straight road running through an open landscape, with no barriers in the immediate vicinity. This model item is included to compare the built-up and the open-space pollutant dispersion scenarios.
2.2. Mathematical Description and Boundary Conditions
In a step-by-step, consecutive manner, computational models were created to capture accurately the geometries of the solved model areas. The process involved detailed modeling of the buildings, roads, and their positions. The model area is filled with a computational grid of hexagonal control volumes. The solution domain includes the space above the road and all the space outside the buildings. Volume elements of approximately 0.25 m3 with the shortest element side of 0.5 m were used at the vicinity of the ground surface. The size of the volume elements filling the space between buildings is in the range of 1 m3 to 3 m3. More abundant volume elements are used above the roofs of the buildings. Their size increases with increasing height above the buildings. The canopy layer of the atmosphere with a height of 200 m is included in the solution. Control volumes of 20 m3 are used in the highest air layer of the model.
In all cases, the straight road simulation encompassed the impact of moving cars, this being a factor that markedly influences the air flow above and on the sides of the road. To facilitate the procedure, we adopted the method proposed by the authors of [3]. The effect of the vehicles was included via setting the resistive force in the volume elements passed through by the vehicles, as shown in Equation (1).
where CD is the aerodynamic characteristic of the car, Acar is car front area, is the air density, is the car speed, and is the air velocity.
Moreover, the same effect was considered within the source term in the formula describing the turbulence kinetic energy production (see Equation (2)). As it is known, moving objects induce a kinetic energy of turbulence that should be added as the additional source Sk to the k-equation. From different studies [14,15,16], it follows that turbulence is induced mainly in the wake behind the vehicle. Therefore, the additional source Sk [7] was added only along the trajectory that cars follow.
where Cc is the model constant, Ucar is the car speed, U∞ is the air velocity, and Qcar is the traffic rate in cars/s.
Such an approach seems to embody one of the most appropriate options for substituting the vehicular motion in a numerical model that exploits a stationary computational mesh.
To perform the actual solution, we utilized the control volume method, where equations expressing the law of conservation of energy, mass, and momentum are solved on predefined volume elements of the computational mesh. The solution was implemented for a steady compressible air flux, exploiting the k-ε RNG turbulence model.
At the inlet wall of the computational model, we set the air velocity profile corresponding to the tested wind speed (see Figure 3). The wind velocity for the neutrally stable atmosphere is determined from the equation of the logarithmic wind velocity profile.
where k is the von Karman constant (~ 0.4), u0 is the specified air velocity at the height z0, and u is the air velocity at the height z. The velocity profile is taken just from the ground surface.
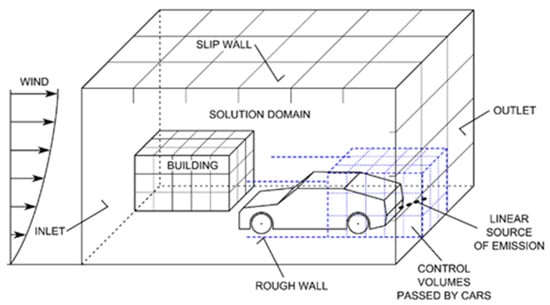
Figure 3.
Schematic illustration of the modeled area and the assigned boundary conditions.
In all of the areas, the relevant speeds equaled 2 m·s−1 and 4 m·s−1, invariably at the height of 10 m above the ground. Using these speed values, we progressively directed the wind parallel, perpendicularly, and obliquely (45°) to the road. The upper wall of the numerical model was assigned the boundary condition “slip wall”, while the bottom wall, which represented the ground, was assigned “wall with friction”. The same boundary condition was applied to all other solid surfaces (road surface, walls, and roofs of buildings). Due to the roughness of the surfaces, a boundary layer is formed along each surface. The computational grid is sufficiently detailed and allows to identify air velocity fields in street canyons
The side walls of the computational domain, through which the air leaves the model area, were described with “outlet” boundary conditions (see Figure 3).
The physical properties of the air assumed in the computations equaled those of an ideal mixture, namely, one composed of 88% N2 and 21% O2, without considering humidity. At the inlet wall of the model area, a zero concentration of dust particles (particulate matter) was assumed. The computed mass concentration maps indicate how the monitored road contributes to the air pollutant concentration within the area. All of the modeled area’s particulates are generated exclusively by the traffic on the road. The source of the dust particles (particulate matter) was entered as an air pollution line source positioned in the center of the monitored straight road at the height of 0.5 m above its surface. Generally, in a given road, the dust (particulate matter) production intensity depends on the traffic rate, categories and weight of the vehicles, and traveling speeds. For the purposes of the numerical models, the parameters are accounted for within the emission factor. In all of the model areas solved, the emission factor per vehicle corresponded to Ef = 0.25387 g·km−1 (see Table 1), a value computed from the dynamic composition of the sample group of cars observed along road I/42 (Brno, Žabovřeská) [17].

Table 1.
Determination of the total emission factor of one car by EMEP methodology, according to emission standards and fuel type.
Within the numerical model, the dispersion of fine particulates was solved via the Eulerian approach. In this context, we did not monitor the trajectories of individual particles but followed within balance equations the particle mass percentages in the volume elements of the computational mesh. Such a procedure enables the computations to be executed significantly more quickly and with less intensive hardware requirements. The deposition velocity of fine particles is very small, often smaller than that of Brownian motion; thus, the fine particles in the models were substituted with passive scalars.
2.3. Numerical Simulation Results
All of the five model areas were solved by using a single computational procedure. In the straight central road, we assumed two-way traffic of vehicles traveling at 50 km·h−1, with the traffic intensity of 720 car·h−1 in each direction. Utilizing the StarCD software platform, we obtained the relevant 3D fields of air velocity, static pressure, and PM10 particle mass concentration.
Figure 4 displays the computed PM10 mass concentration fields acquired in a horizontal plane running at 1.5 m above the ground; such a height corresponds to the human breathing level. The mass concentration fields are specified for the perpendicular and oblique (45°) wind directions, assuming the wind speed of 2 m·s−1.
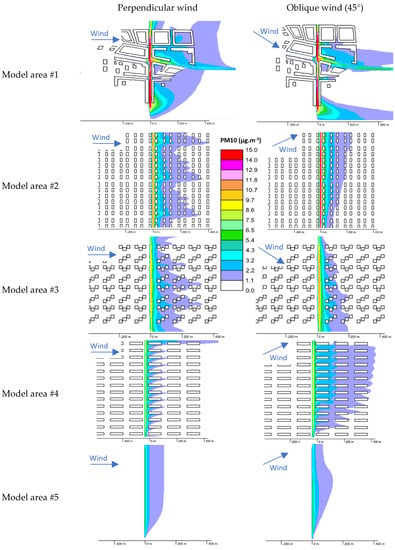
Figure 4.
The PM10 mass concentration fields related to the height of 1.5 m above the ground for the wind velocity 2m·s−1 perpendicular and oblique wind directions.
The maximum particulate mass concentrations are detected immediately above the road; in its near vicinity, the concentration rates drop significantly, but the intensity of the decline weakens with increasing distance from the road. At greater distances, the actual concentration is influenced decisively by advective transport of the particles. Interestingly, the presence of the buildings enables diverse air volumes at the ground-level layers of the atmosphere to blend together, thus helping to reduce the highest particulate mass concentrations; at the same time, however, the houses interfere with and slow down the air flow at the ground levels. Which of the two processes eventually prevails depends on the geometric parameters of particular buildings and land surfaces. As is obvious from the results in Figure 4, smaller-sized houses located within regular intervals from each other (model areas #2 and #3) markedly impair the speed of the air flow above the ground; consequently, higher particulate mass concentrations can be observed even at considerable distances from the road. In long, continuous lines of houses (model area #4), the situation nevertheless differs, because the perpendicularly oriented wind embodies a favorable precondition for fast air motion between the buildings. The particles are then dispersed into the environment more intensively, and the mass concentration decrease intensifies with the growing distance. In the model area #1, the computation result is characterized by difficult predictability of the concentration field shape. It is then apparent that the continuous formations of houses retain highly concentrated particulates in the street canyons; depending on the instantaneous air flow direction, there occur strips of high-particulate concentrations, which, in the urban patterns, disperse only slowly. Moreover, the results for such areas cannot be generalized: Geometrically atypical regions will always require individual geometric modes to facilitate the actual solution procedures. The model area #5 provides results that correspond to the dispersion of particles generated at a straight road in an open landscape.
3. Generalizing the Results
The areal mass concentration maps displayed in Figure 4 were utilized as the source data, allowing the results to be generalized for different configurations. The mass concentration maps that correspond to the traffic intensity 720 car·h−1 in each direction, denoted as the specific mass concentration of PM10. To yield the real PM10 mass concentrations appropriate to an arbitrary traffic density, the specific concentration of PM10 is multiplied by the ration of real and specific traffic intensity of the line source. The following processing step involves the creation of 2D relationships to express the connection between the ambient mass concentration of the PM10 pollutant and the distance from the road. This purpose was achieved by evaluating the mass concentration in slices perpendicular to the central road. The relationship acquired via the slice with the maximum range of a significant concentration of PM10 is denoted as cmax; the other relationship was obtained in the slice with the minimum range of the concentration, denoted as cmin. These two relationships then define the region of mass concentrations that will most probably contain the real values of the road’s contribution. In Figure 5, the relationships cmax and cmin are expressed for the perpendicular and oblique wind directions. The graphical representation of the relationships is complemented with a relevant mathematical expression, delivered by utilizing the exponential function
where x is distance from the road, and the factors a is calculated by Equation (6) and b are obtained from a line that is a result of the least squared method Equation (5):
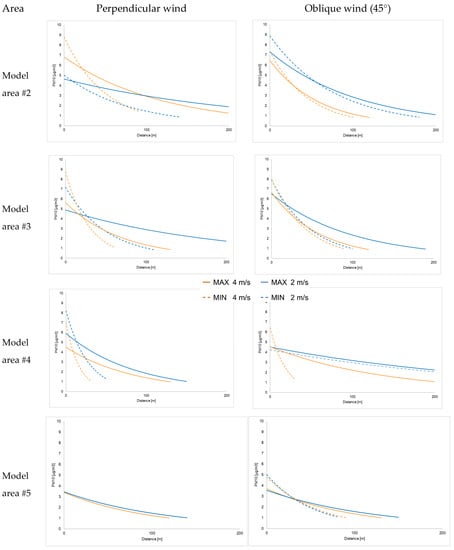
Figure 5.
The relationship between the specific mass concentration of PM10 and the distance from the road, assuming the perpendicular and oblique (45°) wind directions and traffic intensity 720 car·h−1 in each traffic direction.

Table 2.
Coefficients of the exponential expression of PM10 limiting mass concentrations for Equation (4).
In the parallel wind, applicable relationships were not formed, as—with respect to the character of the mass concentration fields—their patterns are not representative enough to justify further use.
4. Comparing the Numerical Prediction with the In-Situ Measurements
The correctness of the inclusion of a linear source of PM10 emissions in the numerical model is crucial for the subsequent realistic solution of the particle dispersion. The validity of the emission factor was verified via the results of in-situ measurements at close vicinity of the studied road. To verify the correctness of the linear emission source calculation, the numerical predictions were compared with concentrations acquired via the in-situ measurements performed to determine the concentrations of the PM10 at the central district of Brno. The measurement spot was located in close proximity to a convenient portion of the city’s ring road (see Figure 6). On the side opposite to this spot, the road runs along a continuous formation of five-storey buildings; on the measurement side, however, the main urban element is a city park with lawns, shrubbery, and sparsely planted trees.
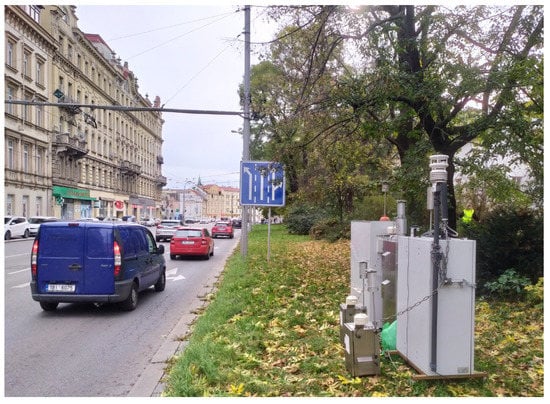
Figure 6.
In-situ measurements of PM10 concentrations in urban roads.
The measurements were conducted between 8 November 2019, 0:00 and 25 November 2019, 23:59:00; the apparatus was an Airpointer (Recordum Messtechnik GmbH, Wiener Neustadt, Austria) whose PM module exploits the nephelometry principle. The obtained mass concentrations of PM10 were calibrated by means of the gravimetric method, following 24-h sampling with a Leckel MVS 6 (Leckel Ingenierbüro, Berlin, Germany) small filter device and weighing the captured particles on Mettler Toledo MX5/A microbalances. During the measuring cycle, the values of the PM10 pollutant concentration were recorded in the ambient air (at the height of 1.5 m above the road and at the distance of 1 m from its edge), together with the data relating to the traffic intensity and the weather conditions. The subsequent processing phase yielded, for the monitored wind directions (perpendicular and oblique at 45°), the mean values of the PM10 pollutant concentration and the corresponding average traffic intensity. The evaluation used the knowledge of hourly concentrations of PM10. From the set of experimentally obtained data during the measurement, the values corresponding to the monitored wind direction (in the range of ±15°) and the specific wind speed (±0.3 m·s−1) were filtered by subsequent processing. From the selected data, the average value of the PM10 concentration was calculated for the studied wind conditions, which was used for comparison with the calculated results. The mass concentration was evaluated when the wind was blowing from the apparatus towards the road; the rate established at that moment was utilized as the road’s background concentration. By subtracting the background concentration from the mean concentration in the ambient air, we obtained the measured contribution of the road to the ambient mass concentration of PM10. The background concentration was identified separately for each combination of wind direction and speed. The background concentration value was obtained by filtering and averaging the experimental data corresponding to particular a wind speed and wind direction. The dependence of the background concentration on the wind direction and speed reflects the real conditions in the evaluated area. The numerically computed and in-situ measured contributions of the road are compared in Table 3.

Table 3.
Comparison of the computed and the measured values of the road’s contribution to the concentration of PM10 in the ambient air.
Predicted particle concentration varied in the range of 8.3 until 15.8 μg·m−3 depending on the wind direction and wind speed. The results show that the numerical modeling overestimated the mass concentration of PM10 in the case of a perpendicular wind direction to the road by ca 50%. For the oblique wind direction (45°), numerical predictions and in-situ measurements indicate similar PM10 mass concentration values with fluctuations of deviation in both sides up to 40%. The dispersion of pollutants solved with utilizing computational code StarCD has been verified by numerous authors before [18]. In the framework of this study, it was verified by comparison with real measurements whether the mentioned method of calculating the emission flow from the traffic road corresponds to real conditions because the emission flow from a line source most significantly affects the resulting concentration field of PM10 emissions. The calculated mass concentration is strongly dependent on the way the line source is entered into the volume elements above the road. Furthermore, in this position, all mathematical simplifications in involving the movement of cars are strongly reflected. The results reached and main commented trends are in accordance with the conclusions of a study [19] that also looked at the dispersion of pollutants from the transport roads in urban areas. The correctness of the inclusion of a linear source of PM10 emissions in the numerical model was confirmed with sufficient accuracy.
5. Conclusions
The computational modeling procedures used in solving the dispersion of polluting substances allowed us to capture in detail most of the relevant physical processes. Despite the marked progress within SW and HW tools, CFD-based modeling still requires a demanding presetting of the mesh and relies on time-intensive computations. Thus, detailed numerical modeling finds use in only a limited number of concrete cases involving mass concentration maps of pollutants. This paper discusses the dispersion of traffic-generated PM10 particulates into the vicinity of a straight road that passes through different types of built-up urban areas; in this context, among other problems, a procedure is presented to generalize a narrow amount of modeling results for further practical analytical applications. The research confirmed that the factors having the greatest impacts on the final shape of the PM10 mass concentration field rest are the wind direction and velocity. Another major parameter is the built-up area geometry, which substantially influences the air flow velocity in the ground-level layers of the atmosphere. Higher numbers of smaller-sized houses positioned in regular intervals apparently do not affect the wind flow direction but slow down considerably the ground-level air layers, resulting in major mass concentrations of pollutants within 200 m from the road. Where the urban pattern consists of long, continuous housing blocks, the air flow direction is altered in a noticeable manner. However, with parallel winds, the ground-level air does not slow down excessively, allowing the emissions to be more diluted and the quantity of PM10 in the ambient air to be reduced. The results acquired from areas characterized by recurring building distribution patterns facilitated the generalization of the outcomes and their confrontation with the in-situ measurements; this generalization then yielded the region of the probable value of the PM10 particulate mass concentration in the direction perpendicular to the road. The region of probable concentrations is limited by the curves of the lowest and the highest PM10 mass concentrations established via the numerical calculations. Urban areas exhibiting random arrangements of the built-up patterns do not allow generalizations of the results but rather necessitate individual solutions and testing of the evaluated configurations. Further refinement of the created analytical tool will require another validation and refinement of the model using a large number of experimental measurements obtained at different distances from the road.
The main result of the presented study is the definition of generalized dependences of PM10 concentrations at a vicinity of direct road passing through five characteristic types of urban areas. These results allow a quick analytical calculation of the PM10 concentrations in urban areas geometrically close to the tested areas. The performed experimental measurements confirmed that the used calculation of the emission factor and subsequent quantification of the linear source of particles is usable with sufficient accuracy for the needs of dispersion models in the vicinity of direct roads.
Future research activities should focus on a similar examination of other types of typical urban areas and experimental verification numerical predictions at greater distances from the road.
Author Contributions
Methodology, J.P., J.H., and R.L.; software, J.P.; validation, J.H. and R.L.; formal analysis, J.P., J.H., and R.L.; investigation, J.P. and J.H.; resources, M.S.; writing—original draft preparation, J.P. and M.S.; visualization, M.S.; and supervision, J.P. All authors have read and agreed to the published version of the manuscript.
Funding
This research was supported by the project “Computer Simulations for Effective Low-Emission Energy Engineering” funded as project No. CZ.02.1.01/0.0/0.0/16_026/0008392 by Operational Programme Research, Development and Education, Priority axis 1: Strengthening capacity for high-quality research. This research was further funded by Ministry of Education, Youth and Sports of Czech Repubic within the National Sustainability Programme I, project of Transport R&D Centre (LO1610), on the research infrastructure acquired from the Operation Programme Research and Development for Innovations (CZ.1.05/2.1.00/03.0064).
Conflicts of Interest
The authors declare no conflicts of interest. The funders had no role in the design of the study; in the collection, analyses, or interpretation of data; in the writing of the manuscript; or in the decision to publish the results.
References
- Santibáñez-Andrade, M.; Quezada-Maldonado, E.M.; Osornio-Vargas, Á.; Sánchez-Pérez, Y.; García-Cuellar, C.M. Air pollution and genomic instability: The role of particulate matter in lung carcinogenesis. Environ. Pollut. 2017, 229, 412–422. [Google Scholar] [CrossRef] [PubMed]
- Appel, J.; Bockhorn, H.; Frenklach, M. Kinetic modeling of soot formation with detailed chemistry and physics: Laminar premixed flames of C2 hydrocarbons. Combust. Flame 2000, 121, 122–136. [Google Scholar] [CrossRef]
- Jicha, M.; Katolicky, J.; Pospisil, J. Dispersion of pollutants in a street canyon and street intersection under traffic-induced flow and turbulence using a low Re κ-ε model. Int. J. Environ. Pollut. 2002, 18, 160–170. [Google Scholar] [CrossRef]
- Jiang, Y.-Q.; Ma, P.-J.; Zhou, S.-G. Macroscopic modeling approach to estimate traffic-related emissions in urban areas. Transp. Res. Part D Transp. Environ. 2018, 60, 41–55. [Google Scholar] [CrossRef]
- Tissari, J.; Hytönen, K.; Sippula, O.; Jokiniemi, J. The effects of operating conditions on emissions from masonry heaters and sauna stoves. Biomass Bioenergy 2009, 33, 513–520. [Google Scholar] [CrossRef]
- Pospisil, J.; Katolicky, J.; Jicha, M. A comparison of measurements and CFD model predictions for pollutant dispersion in cities. Sci. Total Environ. 2004, 334–335, 185–195. [Google Scholar] [CrossRef] [PubMed]
- Holmes, N.S.; Morawska, L. A review of dispersion modelling and its application to the dispersion of particles: An overview of different dispersion models available. Atmos. Environ. 2006, 40, 5902–5928. [Google Scholar] [CrossRef]
- Woodward, H.; Stettler, M.; Pavlidis, D.; Aristodemou, E.; ApSimon, H.; Pain, C. A large eddy simulation of the dispersion of traffic emissions by moving vehicles at an intersection. Atmos. Environ. 2019, 215, 116891. [Google Scholar] [CrossRef]
- Zhang, Y.; Gu, Z.; Wah Yu, C. Large eddy simulation of vehicle induced turbulence in an urban street canyon with a new dynamically vehicle-tracking scheme. Aerosol Air Qual. Res. 2017, 17, 865–874. [Google Scholar] [CrossRef]
- Shen, J.; Gao, Z.; Ding, W.; Yu, Y. An investigation on the effect of street morphology to ambient air quality using six real-world cases. Atmos. Environ. 2017, 164, 85–101. [Google Scholar] [CrossRef]
- Zhang, X.; Zhang, Z.; Su, G.; Tao, H.; Xu, W.; Hu, L. Buoyant wind-driven pollutant dispersion and recirculation behaviour in wedge-shaped roof urban street canyons. Environ. Sci. Pollut. Res. 2019, 26, 8289–8302. [Google Scholar] [CrossRef] [PubMed]
- Miao, C.; Yu, S.; Hu, Y.; Bu, R.; Qi, L.; He, X.; Chen, W. How the morphology of urban street canyons affects suspended particulate matter concentration at the pedestrian level: An in-situ investigation. Sustain. Cities Soc. 2020, 55, 102042. [Google Scholar] [CrossRef]
- Auguste, F.; Lac, C.; Masson, V.; Cariolle, D. Large-eddy simulations with an immersed boundary method: Pollutant dispersion over urban terrain. Atmosphere 2020, 11, 113. [Google Scholar] [CrossRef]
- Eskridge, R.E.; Hunt, J.C. Highway modeling. Part I: Prediction of velocity and turbulence fields in the wake of vehicles. J. Appl. Meteor. 1979, 18, 387–400. [Google Scholar] [CrossRef]
- Sedefian, L.; Trivikrama Rao, S.; Czapski, U. Effects of traffic-generated turbulence on near-field dispersion. Atmos. Environ. (1967) 1981, 15, 527–536. [Google Scholar] [CrossRef]
- Sini, J.-F.; Mestayer, P.G. Traffic-induced urban pollution: A numerical simulation of street dispersion and net production. In Air Pollution Modeling and Its Application XII; Springer: Boston, MA, USA, 1998; pp. 369–377. [Google Scholar]
- EMEP/EEA Air Pollutant Emission Inventory Guidebook 2019. Available online: https://www.eea.europa.eu/publications/emep-eea-guidebook-2019/part-b-sectoral-guidance-chapters/1-energy/1-a-combustion/1-a-3-b-i/view (accessed on 30 March 2020).
- Labovský, J.; Jelemenský, L. Verification of CFD pollution dispersion modelling based on experimental data. J. Loss Prev. Process Ind. 2011, 24, 166–177. [Google Scholar] [CrossRef]
- Tsai, M.Y.; Chen, K.S. Measurement and three-dimensional modeling of air pollutant dispersion in an urban street canyon. Atmos. Environ. 2004, 38, 5911–5924. [Google Scholar] [CrossRef]
© 2020 by the authors. Licensee MDPI, Basel, Switzerland. This article is an open access article distributed under the terms and conditions of the Creative Commons Attribution (CC BY) license (http://creativecommons.org/licenses/by/4.0/).