Abstract
NOx emissions from vehicles have been a substantial cause for concern due to their impact on urban air quality. In particular, despite reducing levels of permitted emissions legislatively, such reductions have not been observed in the real world. In this work, NOx emissions from three vehicles—a Euro 5 car, a Euro V hybrid bus, and a Euro VI—bus have been measured in real driving conditions (and in the case of the buses—in full passenger service). A recently developed high spatio-temporal resolution technique combining very fast (10 ms) NOx measurement with differential GPS accurate to 1 cm allows these emissions to be resolved to a distance of less than 10 cm (worst-case—dependent on vehicle speed). The results show that acceleration events for the vehicles play a significant part in their total NOx emissions. In addition, standard events such as a speed bump and a bus stop are analysed. The temperature of any aftertreatment (catalytic converter) to reduce NOx emissions is also observed to be of substantial significance. At idle, the passenger car was observed to near-double its NOx emissions when the air conditioning was switched on. Finally, the real driving conditions are compared to the legislative compliance cycles for the certification of the buses, and those results used to further understand the observed NOx emissions.
1. Introduction
Urban air quality is an issue of current concern worldwide, notably urban levels of particulate matter and oxides of nitrogen (NOx). In Europe, urban air quality is regulated by the Ambient Air Quality Directive [1], which mandates “not to exceed” levels of pollutants. These levels are regularly exceeded across Europe [2]. Buses form a significant contribution to urban NOx; the London Atmospheric Emissions Inventory (LAEI) estimated that buses contributed 33% of the total road transport NO2 emissions in central London on average [3]. In certain areas, this proportion is as high as 85% [4].
NOx emissions from heavy duty vehicles including buses are typically controlled using a number of techniques, both in-engine and in-exhaust after-treatment. Among the most effective is Selective Catalytic Reduction (SCR), an exhaust after-treatment method; in SCR, NOx reacts catalytically with ammonia to form non-pollutants nitrogen and water [5]. SCR requires a certain exhaust gas temperature to decompose the urea solution to ammonia and also to convert the NOx; typically, the urea decomposition reaction stops below exhaust temperatures of 180 °C. Injecting urea at temperatures below this can result in unwanted deposits, although there are techniques enabling conversion at temperatures as low as 150 °C on the most modern systems [6].
Buses are certified in Europe under the so-called Euro emissions legislation [7]. Relevant to this work is the Euro V legislation, in force from 2008. Euro V certification requires engine testing under two cycles: the European Stationary Cycle (ESC) and the European Transient Cycle (ETC); these typically require a relatively high engine power, minimal idling, and do not include a cold-start portion. Euro VI certification, superseding Euro V, has been in force since 2014, uses new cycles—the World Harmonized Steady-state Cycle (WHSC) and the World Harmonized Transient Cycle (WHTC), which are more representative of real driving conditions, include urban driving, and include a cold start test. In addition, there are in-service compliance (ISC) standards associated with Euro VI. Euro 5 passenger cars are certified over the New European Drive Cycle (NEDC), which does include a cold-start, but there is no ISC requirement [8].
In addition to the European test procedures noted in the previous paragraph; since 2009, buses in the UK have also been homologated over defined test cycles as part of the Ultra Low Emission Bus accreditation scheme (ULEB). This has been used to approve the use of public funding via grants for retrofitting of SCR systems for bus upgrades. Until 2018 the Millbrook London Transport Bus test cycle (MLTB) was used for this; this cycle was developed using real speed-time data from a bus driving London route 159 from Streatham to Baker Street (the route in the 1990s). The MLTB speed-time trace is shown in Figure 1.
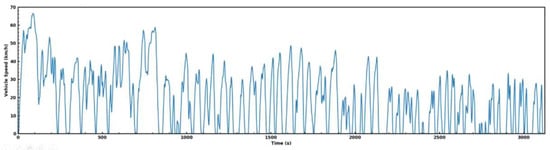
Figure 1.
Millbrook London Transport Bus (MLTB) test cycle speed-time profile.
From 1 November 2018, the MLTB has been replaced by the UK Bus test cycle (UKBC). This uses the MTLB to reflect city driving, and adds a new section representative of rural driving. The rural section was devised using a VECTO simulation tool that was developed by the EU Commission to calculate emissions from HGVs. The UKBC speed-time trace is shown in Figure 2.
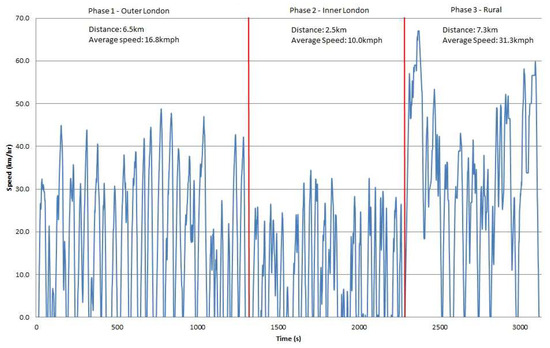
Figure 2.
UK Bus test cycle (UKBC) speed-time profile.
It is interesting to note that the test procedure allows for a “prep cycle” which effectively helps to bring the engine and aftertreatment system up to operating temperature and thus the cold start is, again, unaccounted for. Indeed, the preparation cycle may be as long as is perceived to be required by the tester and manufacturer, with the guidance stating: “Warm-up of the vehicle will be done using the rural cycle phase to ensure the vehicle is stabilised prior to test. Manufacturers and test houses can determine any additional warm-up requirements but the final element should be the rural phase”.
Emissions testing of buses on chassis dynamometers can never represent fully what is happening during real driving. Real Driving Emissions (RDE) testing of buses has been undertaken more recently. Spreen et al. found that NOx emissions from an in-service single deck Euro VI bus in the Netherlands varied depending on the bus route, and were particularly sensitive to low engine load conditions [9]. Spreen et al. also observed a ~40% reduction in measured NOx with a Euro VI bus compared to a Euro V bus operating the same route. Söderena et al. conducted both chassis dynamometer and RDE measurements of Euro VI buses in Finland. Their chassis dynamometer tests showed NOx emissions under 100 ppm and the RDE testing illustrated a significant amount of variability between different bus routes and different days [10]. In particular, Söderena et al. observed that the exhaust system temperature had a significant effect on the measured NOx emissions [10].
Recently, ultra-fast response gas analysers have been used to provide high spatio-temporal resolution RDE data from vehicles [11,12]. Such analysers, which have a response time of a few milliseconds, have been used for a long time in engine development, for example in cyclically resolved engine measurements [13,14], cold start [15,16], and emission reduction [17,18]. Their use in RDE enables correlations of vehicle emissions to manoeuvres by the vehicle, for example pulling away from traffic lights, joining a motorway, or going over a speed-bump.
This work presents, for the first time, high spatio-temporal measurements of NOx emissions from two in service buses, and contrasts them from those of a typical diesel family car. In particular, standard bus operating manoeuvres, such as pulling away from traffic lights and bus stop events, are analysed.
2. Experimental Methodology
A Cambustion CLD500 Fast NOx analyser was used to measure the NOx emissions from the vehicles [16,19]. The analyser was configured to pass the exhaust sample through a NOx converter (based on the stainless steel method of NO2 to NO conversion), to measure total NOx (here defined as NO + NO2)—and allowing for this conversion the analyser has a τ10–90% response time of 10 ms. In order to accommodate the RDE test environment, a few modifications were made to the standard analyser set-up—as described in [11]—and, additionally, the sample probe was substantially longer, to allow measurement of the tailpipe NOx from within the bus cabin. The NOx sample point on all three vehicles tested was located roughly in the centre of the exhaust flow, after all of the exhaust aftertreatment (specified in Table 1), and a short distance before the exhaust exit, in order to ensure that the samples were taken without any risk of atmospheric dilution. The sample point on the Euro VI bus is shown in Figure 3 as an example.

Table 1.
Test vehicle specification
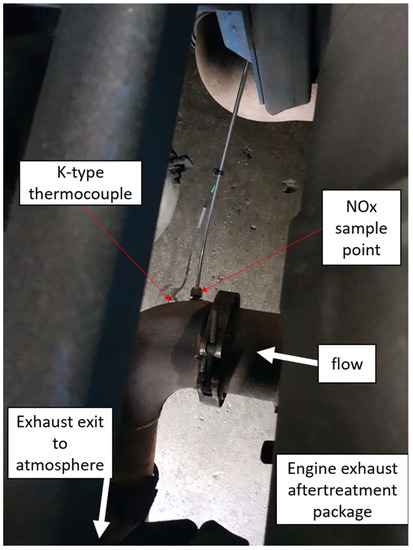
Figure 3.
NOx sample point and thermocouple location on the Euro VI bus.
Additionally, the Euro VI bus was fitted with a k-type thermocouple adjacent to the NOx sample point (see Figure 3), in order to provide an indication of the exhaust temperature immediately downstream of the SCR catalyst. This was done as a result of the learning acquired from the measurements from the Euro V bus, which revealed that such data would be helpful in interpreting the results.
Differential GPS measurements [20], accurate to 1 cm, were logged from all vehicles at a frequency of 14 Hz. Combining the accuracy of the GPS with the time response of the NOx analysers, our spatial resolution on emissions is approximately 10 cm, assuming a vehicle speed of 48 km/h (higher at lower vehicle speeds and vice-versa) and a minimum of four continuously tracked satellites (after initialisation). ‘Dashcam’ video footage was also recorded to enable an understanding of the road and traffic conditions.
Unfortunately, J1939 (the on-board diagnostic protocol for buses [21]) access was not available on the buses tested. This means that exhaust mass flow rate or high frequency engine speed data from the bus ECUs was not available. Without this, it is not possible to measure NOx mass; the analyser reports the volume concentration of NOx as ‘parts per million’ (ppm). All legislative tests present a NOx mass standard, and so without mass data it is not possible to compare the buses performance to the legislative requirements and the tests are not compliant with the legislative requirements. In addition the test routes do not meet the standards required for the Euro VI ISC tests—again another difference between this work and a legislatively compliant test.
Furthermore, the purpose of these tests was not to test for compliance or non-compliance, but to investigate the possible causes of transient NOx emissions and their resulting air quality NOx ‘hot spots’ caused by the candidate vehicles.
2.1. Test Vehicles
Three different diesel vehicles have been tested in this work: a Euro 5 diesel car, a Euro V diesel hybrid double deck bus, and a Euro VI diesel double deck bus. All three vehicles were used in typical use prior to these tests, and have no notable previous histories. The Euro 5 car is typical of those used as taxis or private hire vehicles. The buses tested were selected at random from their fleet sub groups. The Euro V bus is a full parallel hybrid vehicle, the Euro VI bus was certified to Euro VI stage A. Key information about each of the vehicles tested is shown in Table 1—all aftertreatment was original from the OEM—no retrofits had been performed on these vehicles. All three vehicles were fitted with a diesel particulate filter (DPF). The vehicles were run on standard diesel available from the depot. No warning lights or other remarkable indicators were evident.
2.2. Test Routes
The tests were undertaken on in-service vehicles (i.e., loading and unloading passengers at bus stops), and so final control of the route was with the bus company according to their needs; however, the routes were selected to provide a spread of driving conditions including urban portions and some highway driving.
The Euro V bus ran a series of routes through the day with a break in the middle of the day. The routes were: the Oxford Bus Company 35A route from Kennington to Matthew Arnold School (and back), the Oxford Bus Company X3 route from Abingdon to Oxford City Centre, and the Oxford Bus Company 13 route from Oxford City Centre to the John Radcliffe hospital. There were numerous portions of empty running from the bus garage to the start of the route, and from one route end to another route start. The payload on the bus varied from near empty (four occupants + 100 kg of measurement equipment) to full at different times of the day. The outside air temperature on the day of the Euro V bus tests was 17 °C. The full routes taken are shown in Figure 4 and Figure 5.
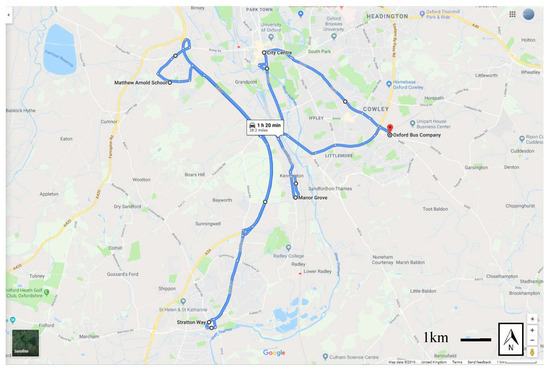
Figure 4.
Routes taken by Euro V bus in the first part of the day (map data © Google).
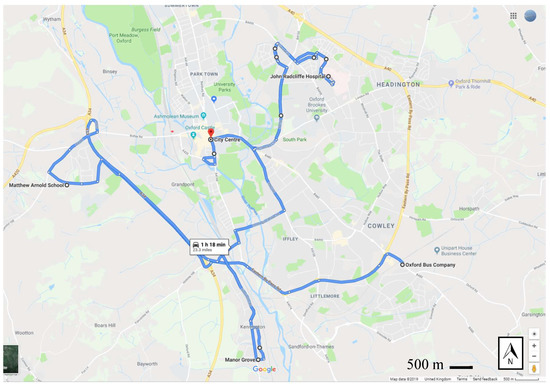
Figure 5.
Routes taken by Euro V bus in the second part of the day (map data © Google).
The Euro VI bus was running the Oxford Bus Company City 5 route. This route runs from Oxford Rail Station to Blackbird Leys and return. It is approximately 5.6 m (9 km) each way all on congested urban routes. On a typical day it is the most congested bus route in Oxford. Again, additionally the bus drove a short distance at the start of the day from the bus garage to the start of the route. The payload on the bus varied from near empty (four occupants + 100 kg of measurement equipment) to full at different times of the day. The outside air temperature on the day of the Euro VI bus tests was 26 °C. The route is shown in Figure 6.
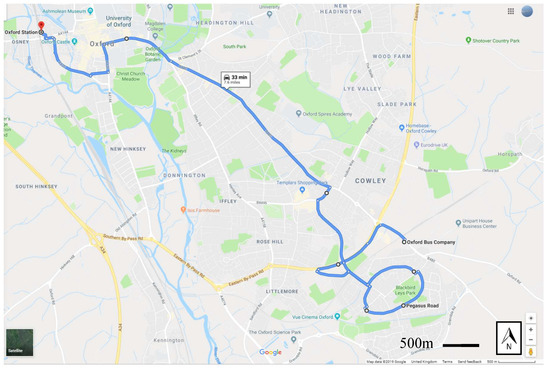
Figure 6.
Route taken by Euro VI bus (map data © Google).
The Euro 5 car routes were chosen to mimic those taken by the buses to provide as close a comparison as possible. However, in central Oxford there are numerous restrictions for cars and modal filters meaning that the exact route was not able to be followed. A close approximation, imagining a bus passenger instead taking a taxi to a final destination was followed—the car did not stop at any bus stops. The car’s payload was two occupants and the same emissions measurement equipment. The outside air temperature on the day of the Euro 5 car tests was 29 °C. The route is shown in Figure 7.
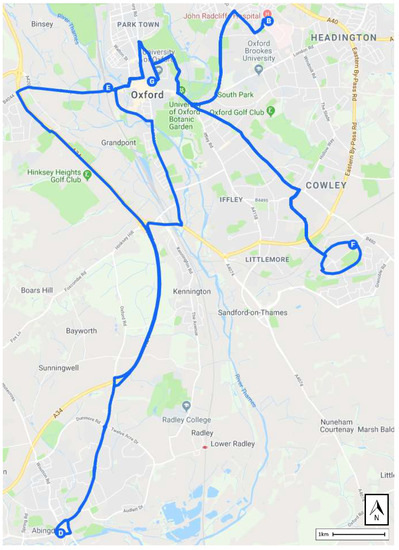
Figure 7.
Route taken by Euro 5 diesel car (map data © Google).
3. Results and Discussion
As noted in the methodology section, the authors were unable to obtain exhaust mass flow rate or high frequency engine speed data from the bus ECUs, so throughout the results in this section will be presented as ppm by volume (ppmv) values, rather than by mass. The RDE tests undertaken in this work do not represent any legislatively compliant tests. That said, the ppmv values clearly provide a useful indicative and comparative data set and comparisons will be drawn. Anecdotally, the authors understand that a compliant bus usually emits no more than 120 ppm as a peak value on the MLBC. The results will show values far in excess of this.
3.1. Idling Engines
At idle, assuming a constant engine rpm and no engine boosting it is possible to calculate NOx mass from the ppmv data using the equation [22]
where u is the ratio between the density of the NOx and the density of the exhaust gas (taken as 0.001587 [22]), c is the ppmv of NOx measured in the exhaust, and qexh is the exhaust mass flow rate. qexh must be estimated by the following equation (the contribution to the mass flow rate of exhaust of the fuel is neglected)
where V is the engine capacity, rpm is the engine rotational speed, is the volumetric efficiency of the engine (conservatively assumed to be 0.9), and the density of air.
The estimates of the idling NOx mass emission are shown in Table 2. It is observed that the Euro V bus has the highest NOx mass emission at idle, the Euro VI bus emits less than a third of the NOx of the Euro V and the Euro 5 car less still. When accounting for the maximum number of passengers which can be carried however, the Euro VI bus emits less than a fifth of the NOx per passenger compared to the Euro 5 car. An interesting idling feature with the Euro 5 car was that turning the air conditioning on increased the idle NOx emitted from 8 g/h to 15 g/h. This is likely due to the increased hotel load on the engine from the air conditioning compressor and associated equipment.
Table 2.
Idling NOx mass emissions estimate.
Under certain conditions at idle with the Euro V bus, a sudden increase in NOx emission was observed while still at idle reminiscent of that experienced in the car when the air conditioning was switched on. Two examples are shown in Figure 8. Here the NOx can be seen to increase from around 350 ppm ‘standard idle’ condition to 800 ppm or even 1200 ppm idle. It should be stressed that the vehicle is stationary throughout this, and there is no throttle demand (the engine is not being revved). It is thought that this increase in NOx is due either to the onboard air compressor (used for the brake, suspension, and door systems), a cooling system being activated or the hybrid system, but it was not possible to ascertain the exact cause.
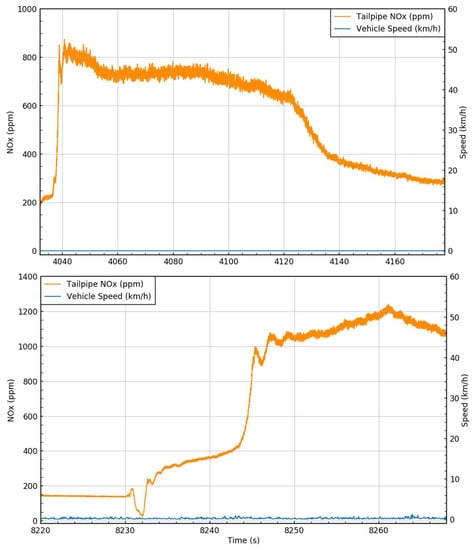
Figure 8.
Increase in NOx emissions at idle from the Euro V bus—outside school (T), and in town centre (B).
3.2. Pulling Away
The NOx emission profiles for various pulling away events (whether from a bus stop, traffic lights, or other stop event) were remarkably consistent. Figure 9 and Figure 10 each show two pulling away events for the Euro V and the Euro VI buses respectively. It can be seen that for both vehicles there is a large NOx emission associated with the initial increase in velocity from stationary. However, once the velocity was constant, the NOx emissions decreased substantially—it is almost exclusively the accelerations that are responsible for the NOx emissions. This data shows that, in order to reduce emissions from these vehicles, keeping them at constant speed and avoiding accelerations would have a substantial effect in reducing their NOx emissions.
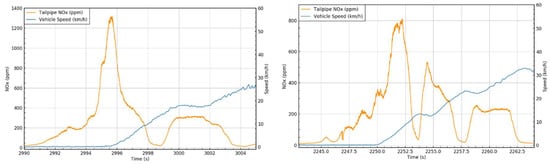
Figure 9.
Two pulling away events in the Euro V bus, showing the short ‘spike’ in NOx emissions associated with the initial pull away.
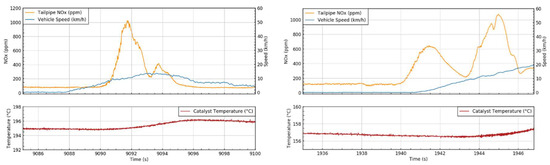
Figure 10.
Two pulling away events in the Euro VI bus, showing the short ‘spike’ in NOx emissions associated with the initial pull away.
One feature that can be observed in Figure 10 (the right hand part), is a large secondary increase in NOx emission after the initial emission associated with the pulling away. This feature was observed consistently from the Euro VI vehicle, and is shown in more detail in Figure 11. Subsequent investigation showed that it is associated with the gear change from third to fourth (top—the vehicle was fitted with a four-speed gearbox) gear. This transition happened at relatively low vehicle speeds, and although this ‘early’ transition into top gear will reduce fuel consumption and CO2 emissions, the effect on the engine emissions is also clear, there is a very large NOx emission observed associated with this change.
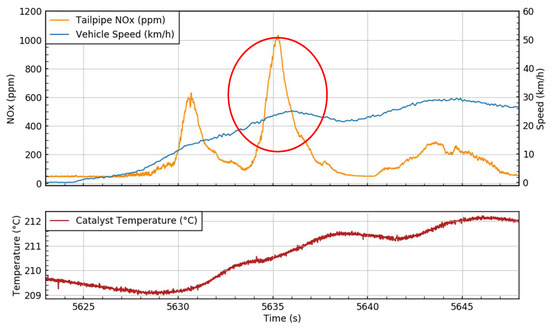
Figure 11.
NOx emission from the Euro VI bus, showing the large spike (circled in red) associated with the gear change from third to fourth gear.
3.3. Speed Bump
Previous work measuring emissions from both a Euro 4 gasoline and a Euro 5 diesel car have shown that speed bumps can cause substantial emissions of NOx [12]. Similar trends were seen from the Euro V bus in this work. Figure 12 shows the NOx emission from the Euro V bus as it manoeuvres over a series of speed bumps. A speed bump has a dual effect on the NOx emission; firstly, the deceleration before the speed bump may shut the engine fueling off, and subsequently cool the SCR, then a low-speed but high load acceleration, with an associated gear change follows, which produces large amounts of engine-out NOx—as demonstrated in the ‘pulling away’ section previously. This ‘pulling away’ emission is less likely to be able to be controlled by the cooled SCR. There is a good correlation between speed bump location and the resulting high concentration of emitted NOx released by the bus.
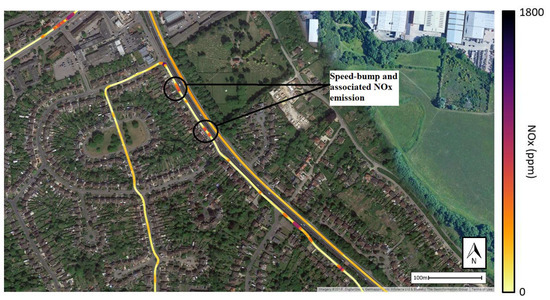
Figure 12.
NOx emissions from the Euro V bus going over speed bumps. Not all speed-bumps are circled for clarity (more clearly visible to the south-west).
3.4. Bus Stop Event
In a sense, a bus stop event is an elongated speed bump event. The bus decelerates to stop, with the associated catalyst cooling. The bus may then dwell at the stop for a number of seconds or even minutes as passengers embark and disembark. Unless the bus automatically switches off its engine, it generally idles—a low load and low exhaust temperature condition—which again suppresses the exhaust temperature and SCR effectiveness. Subsequently, the bus will pull away from the bus stop—as in the ‘pulling away’ section, but with a cooled SCR which may not be able to control the NOx. An example of this is shown in Figure 13. It is worth observing that the pull away NOx emission is located very close to the bus stop where passengers may be waiting for other services.
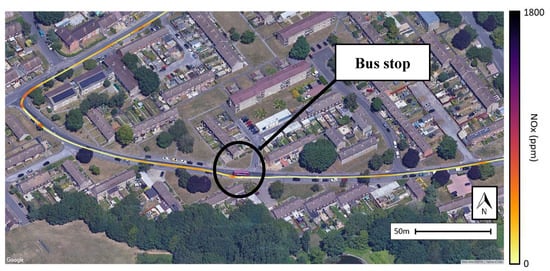
Figure 13.
A bus stop event with the Euro VI bus.
3.5. Periods of Effectively Zero NOx Emission
There were a number of periods when all vehicles tested experienced zero or effectively zero (sub-5 ppm—the noise level of the instrument) NOx emissions. Perhaps obviously, during deceleration, engine fuelling is shut-off and hence there are no notable emissions. On occasion this can last for some period of time, for example when the vehicle is going downhill. It should be noted that this fuel shut-off also leads to some catalyst cooling, as the engine does not produce any heat when no fuel is burned. In fact, the fuel shut-off associated with deceleration draws cold air through the SCR system and very actively cools it. Therefore, if the SCR falls below its conversion temperature in this event, the subsequent NOx emissions will be higher when the engine restarts and during the subsequent transients until an appropriate temperature for SCR activity is restored.
In the Euro V bus, periods when the engine was producing high levels of torque led to zero (or very low) NOx emissions observed. It is hypothesised that this is because the SCR was at its optimum operating temperature during these periods. For example Figure 14 shows a comparison between the Euro V bus and the Euro 5 car heading uphill. In both cases, the engine is producing a high level of torque to propel the vehicle up a steep hill. However there are clear differences between the two NOx emissions: in the case of the bus, the effect of going uphill is to heat the SCR well, and the NOx emission is near zero. In the case of the car, without SCR and only EGR NOx control, very high (>800 ppm) levels of NOx emissions are observed going up the hill.
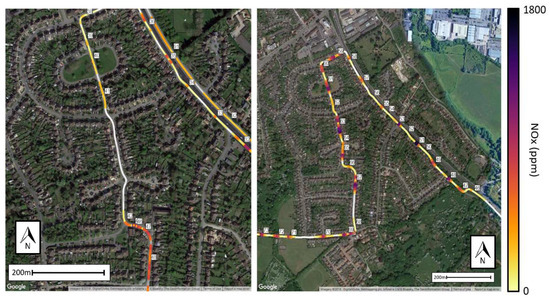
Figure 14.
Comparison between the Euro V bus (L) and the Euro 5 car (R) going uphill.
Similarly, Figure 15 shows the Euro V bus at its maximum speed on the A34—a fast highway with a 113 km/h speed limit (the bus was doing its maximum speed of ~80 km/h). Again, the engine is operating at steady-state conditions and is producing a lot of heat, keeping the SCR system above its conversion temperature and its conversion efficiency is clearly high—leading to low levels of NOx emissions.
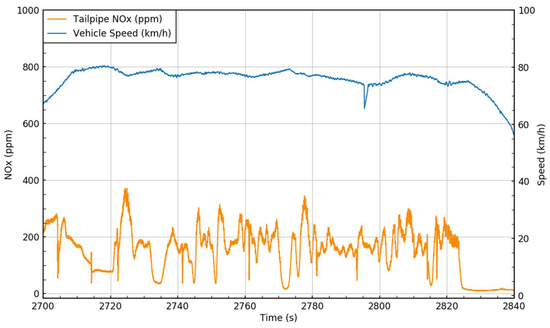
Figure 15.
NOx emissions from the EUV bus at high speeds on the A34.
3.6. Effect of Exhaust System Temperature
The dependency of the NOx emissions from the buses on exhaust temperature is noted in a number of the previous sections. The Euro VI bus was fitted with a thermocouple just downstream of its after-treatment package to attempt to capture this effect. Figure 16 shows the NOx emissions from Euro V and Euro VI buses as they leave the bus garage—just after start with cold catalysts. High levels of NOx emissions are observed, particularly from the Euro V vehicle. The Euro VI bus is also fitted with EGR as well as SCR for NOx control, and it is clear that this is partially effective when the catalyst is cold, although not as effective as warm SCR. The EGR is able to control the NOx emissions at relatively steady engine conditions, but unable during engine transients such as a gear change.
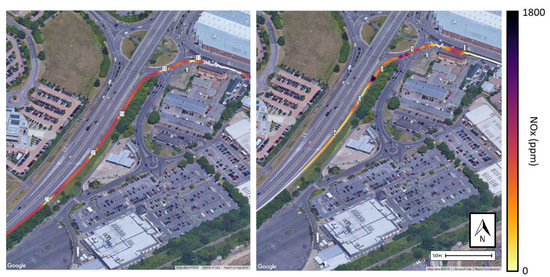
Figure 16.
NOx emissions from the Euro V (L) and Euro VI (R) buses at the start of journey—showing high NOx emissions associated with low catalyst temperatures. The effectiveness of EGR on controlling the NOx emissions can be seen from the Euro VI bus.
Figure 17 shows measured exhaust temperatures and NOx emissions from two identical portions of the City 5 route, run by the Euro VI bus. The first (on the left) is the first run of the day, when the measured exhaust temperature is low, and the second run (on the right) when the measured exhaust temperature is at the typical steady state values observed from this vehicle. The effect of the measured exhaust temperature on the NOx emissions is clear; when the exhaust temperature is cold, the NOx emissions are poorly controlled (only by EGR) and some very high (>1500 ppm) peak values are observed. In contrast, once the exhaust temperature has reached its steady state level, the NOx emissions are controlled well by the combination of SCR and EGR.
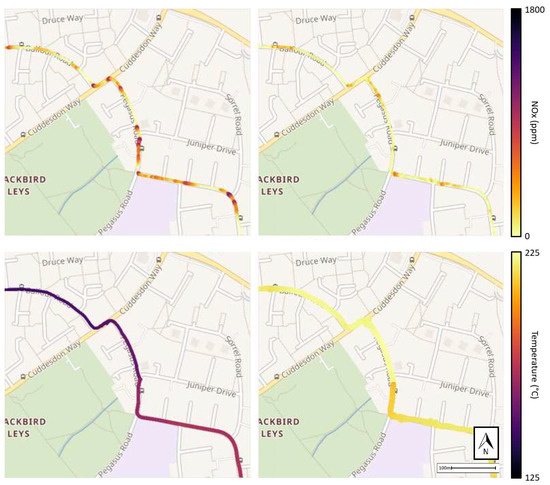
Figure 17.
Comparison of two repeats of the same route when the measured exhaust temperature was low (L) and high (R) showing NOx emissions (upper) and exhaust temperature (lower).
Figure 18 ties together a number of these events in quick succession. It shows the NOx emissions from the Euro V bus around a school at the top of a hill. Heading up the hill, the exhaust temperature is high and zero NOx emissions are measured. At the top of the hill, the bus has to manoeuvre around a number of parked cars and other obstructions which have NOx emissions associated with them. The bus then drives up to the school, passing over a number of speed bumps placed outside the school for road safety—each of these has a NOx emission associated with it—and this NOx emission is concentrated right outside the school. Subsequently the bus leaves the school and heads downhill. Here, the fuel is shut off from the engine as no torque is required heading downhill and again zero NOx emissions are measured (although the SCR will be cooling at this point).
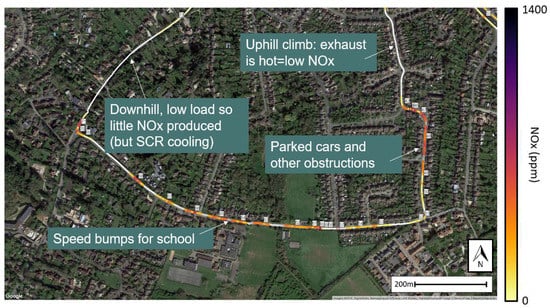
Figure 18.
Euro V bus drop off at a school with associated NOx emission events.
3.7. Comparison between RDE and Test Cycles
It is interesting to compare the RDE routes undertaken in this work to the MLTB and UKBC test cycles which are used for bus certification in the UK. The Euro VI RDE route (the City 5 route from an Oxford suburb to the railway station) was mainly a congested urban route, with only a short section of highway driving travelling to the first bus stop from the bus garage at the start of the day. As a result, it would be expected that the average speeds would be low and stop times long.
Table 3 and Figure 19 show histograms of the stop times, and average stop times for the UKBC, MLTB, and RDE routes. It is clearly seen that the RDE has longer stop times—around 40% higher than MLTB or the UKBC on average. In particular, the MLTB and UKBC have no stops longer than 45 s, whereas the RDE had a large number of stops in excess of 45 s. The effect of having these longer stops is that there is more catalyst cooling time which means during the subsequent acceleration away from the stop, the SCR is less likely to be able to control the emitted NOx.
Table 3.
Average rolling stop time and average speed of the routes.
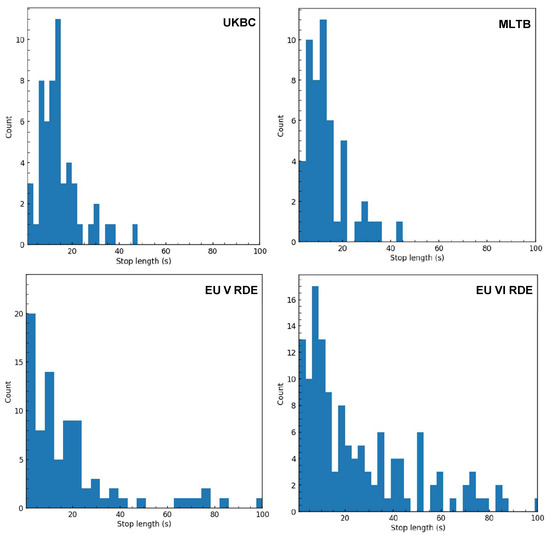
Figure 19.
Comparison in stop lengths between UKBC, MLTB, Euro V, and Euro VI bus RDE.
Table 3 and Figure 20 show a histogram of the journey maximum speed and average speeds for the UKBC, MLTB, and RDE routes. A journey is defined as vehicle speed rising above 0.5 km/h and then returning to below 0.5 km/h, for example between two bus stops. It can be seen that the distributions of RDE maximum speeds include more lower maximum speed events than those of the MLTB and UKBC (20–30 km/h, occasionally reaching 45 km/h in the RDE) even when the mean speeds are similar (at least for the Euro VI bus). There is only one ‘high-speed’ event in the Euro VI RDE, which occurred at the very start of the tests, which is representative of events in the UKBC. Given the lower speed of the RDE route, it is likely that there will be less catalyst heating opportunity compared to the MLTB or UKBC cycles.
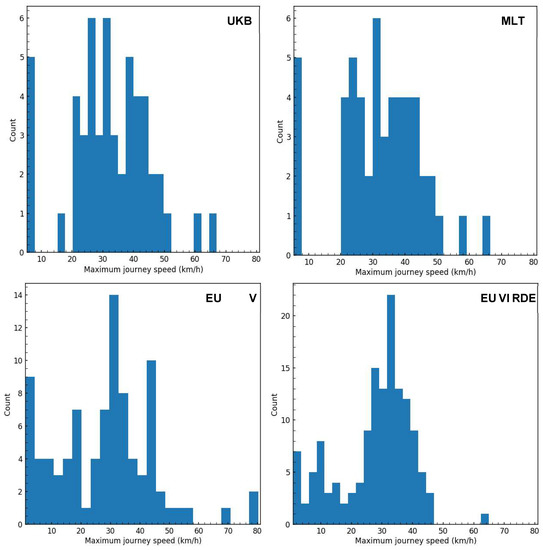
Figure 20.
Comparison in maximum journey speeds between UKBC, MLTB, Euro V, and Euro VI bus RDE.
4. Conclusions
Three vehicles: a Euro 5 car, a Euro V hybrid bus, and a Euro VI bus have been tested in service and their NOx emissions measured under real driving conditions. A number of features of the NOx emissions from the vehicles have been observed due to real driving conditions, such as spikes associated with pulling away, and bus stop events. Repeatability of these NOx emissions inevitably depends on the road conditions, but general conclusions can nevertheless be drawn:
- In general, as would be expected, the Euro VI bus generally has lower emissions than the Euro V bus.
- In general, the Euro 5 car had the highest emissions (per passenger assuming a fully loaded vehicle), this is attributable to its NOx control exclusively using EGR, and not being fitted with any aftertreatment catalyst such as SCR, which both of the buses were fitted with.
- The Euro VI bus has particularly noticeable NOx emissions associated with the gear change from third to fourth gear.
- Exhaust temperature (measured on the Euro VI bus, and able to be inferred on the Euro V bus) plays a significant part in the NOx emissions from the vehicle. For example, when the engine was generating a lot of torque (and hence a lot of heat) when going uphill or at high speed, the SCR was hot and very low NOx emissions were observed. Conversely, where a vehicle’s engine was switched off—for example at the end of a route—the SCR cooled, and there was a substantial NOx emission upon the pull away following the restart. Forced SCR cooling during decelerations has a significant adverse effect on SCR performance on emissions from any transients following re-start.
- The NOx emissions from the Euro 5 car at idle were nearly doubled by switching on the air conditioning.
- The real driving that was undertaken in this work was compared to the certification cycles for buses, and was found to be more ‘challenging’ for the aftertreatment than the certification cycles. In particular, longer stop lengths and lower maximum speeds result in catalyst temperatures expected to be lower in general than in real driving, and hence the efficacy of the aftertreatment in reducing NOx emissions would be reduced.
Author Contributions
Conceptualization, F.C.P.L. and M.S.P.; Data curation, F.C.P.L. and M.J.H.; Formal analysis, F.C.P.L., M.S.P., and M.J.H.; Funding acquisition, M.S.P.; Investigation, F.C.P.L.; Methodology, F.C.P.L. and M.J.H.; Project administration, F.C.P.L. and M.S.P.; Resources, M.S.P.; Supervision, M.S.P.; Visualization, M.J.H.; Writing—original draft, F.C.P.L.; Writing—review and editing, F.C.P.L., M.S.P., and M.J.H. All authors have read and agreed to the published version of the manuscript.
Funding
This research received no external funding.
Acknowledgments
The authors thank Cambustion Ltd. for funding this work. The authors would like to thank the Oxford Bus Company, and Oxford City Council for their support of this work. In particular, the authors thank the Oxford Bus Company engineering team and the drivers of the buses in service for technical support.
Conflicts of Interest
The authors declare no conflict of interest.
References
- Ambient Air Quality and Cleaner Air for Europe, European Parliament Directive 2008/50/EC; EC: Brussels, Belgium, 2008.
- Hopke, P.K.; Harrison, R.M.; de Leeuw, F.; Querol, X. Chapter 1—Current State of Particulate Air Quality. In Non-Exhaust Emissions; Amato, F., Ed.; Academic Press: Cambridge, MA, USA, 2018; pp. 1–19. [Google Scholar]
- London Atmospheric Emissions Inventory. 2016. Available online: https://data.london.gov.uk/air-quality/ (accessed on 27 June 2019).
- Carslaw, D.C.; Priestman, M.; Williams, M.L.; Stewart, G.B.; Beevers, S.D. Performance of optimised SCR retrofit buses under urban driving and controlled conditions. Atmos. Environ. 2015, 105, 70–77. [Google Scholar] [CrossRef]
- Stone, R. Introduction to Internal Combustion Engines; Springer: Berlin/Heidelberg, Germany, 2012; Volume 4. [Google Scholar]
- Johnson, V.T.; Joshi, A. Chapter 1 Review of deNOx Technology for Mobile Applications. In NOx Trap Catalysts and Technologies: Fundamentals and Industrial Applications; The Royal Society of Chemistry: London, UK, 2018; pp. 1–35. [Google Scholar]
- Commission Regulation (EU) No 582/2011; EC: Brussels, Belgium, 2011; pp. 1–168.
- Regulation (EC) No 715/2007; EC: Brussels, Belgium, 2007; pp. 1–16.
- Spreen, J.; Vonk, W.; Robin, V. NOx and PM emissions of a Mercedes Citaro Euro VI bus in Urban Operation; TNO: Delft, The Netherlands, 2014. [Google Scholar]
- Söderena, P.; Nylund, N.-O.; Pettinen, R.; Mäkinen, R. Real Driving NOx Emissions from Euro VI Diesel Buses. SAE Tech. Pap. Ser. 2018. [Google Scholar] [CrossRef]
- Duckhouse, M.P.G.; Peckham, M.; Bradley, H.; Irwin, M.; Hammond, M. On Board Fast Measurement of Vehicle NOx Emissions. SAE Tech. Pap. Ser. 2018. [Google Scholar] [CrossRef]
- Irwin, M.; Bradley, H.; Duckhouse, M.; Hammond, M.; Peckham, M.S. High spatio-temporal resolution pollutant measurements of on-board vehicle emissions using ultra-fast response gas analyzers. Atmos. Meas. Tech. 2018, 11, 3559–3567. [Google Scholar] [CrossRef]
- Leach, F.; Davy, M.; Peckham, M. Cyclic NO2:NOx ratio from a diesel engine undergoing transient load steps. Int. J. Engine Res. 2019. [Google Scholar] [CrossRef]
- Leach, F.; Davy, M.; Peckham, M. Cycle-to-Cycle NO and NOx Emissions from a HSDI Diesel Engine. J. Eng. Gas Turbines Power 2019, 141. [Google Scholar] [CrossRef]
- Henein, N.; Tagomori, M.; Yassine, M.; Asmus, T.; Thomas, C.; Hartman, P. Cycle-by-Cycle Analysis of HC Emissions During Cold Start of Gasoline Engines. SAE Trans. 1995, 104, 1152–1170. [Google Scholar]
- Reavell, K.S.J.; Collings, N.; Peckham, M.; Hands, T. Simultaneous Fast Response NO and HC Measurements from a Spark Ignition Engine. SAE Tech. Pap. Ser. 1997. [Google Scholar] [CrossRef]
- Hagena, J.R.; Assanis, D.N.; Filipi, Z. Cycle-resolved measurements of in-cylinder constituents during diesel engine transients and insight into their impact on emissions. Proc. Inst. Mech. Eng. Part D J. Automob. Eng. 2011, 225, 1103–1117. [Google Scholar] [CrossRef]
- Peckham, M.S.; Finch, A.; Campbell, B. Analysis of Transient HC, CO, NOx and CO2 Emissions from a GDI Engine using Fast Response Gas Analyzers. SAE Int. J. Engines 2011, 4, 1513–1522. [Google Scholar] [CrossRef]
- Schurov, S.; Collings, N.; Hands, T.; Peckham, M.; Burrell, J. Fast Response NO/HC Measurements in the Cylinder and Exhaust Port of a DI Diesel Engine. SAE Tech. Pap. Ser. 1998. [Google Scholar] [CrossRef]
- Parkinson, B.W.; Enge, P.; Axelrad, P.; Spilker, J.J.J. Differential GPS. Glob. Position. Syst. Theory Appl. 1996, 2, 3–50. [Google Scholar]
- Serial Control and Communications Heavy Duty Vehicle Network, SAE J1939_201002; Society of Automotive Engineers: Warrendale, PA, USA, 2010; p. 521. [CrossRef]
- UNECE. Measuring Procedure for the Determination of Nitrogen Dioxide Emissions from Diesel Engines Fitted with Particulate Reduction Systems; UNECE: Geneva, Switzerland, 2011. [Google Scholar]
© 2020 by the authors. Licensee MDPI, Basel, Switzerland. This article is an open access article distributed under the terms and conditions of the Creative Commons Attribution (CC BY) license (http://creativecommons.org/licenses/by/4.0/).