Effects of UV-A Light Treatment on Ammonia, Hydrogen Sulfide, Greenhouse Gases, and Ozone in Simulated Poultry Barn Conditions

 , ,
, ,  , , , and
Abstract
1. Introduction
2. Methods
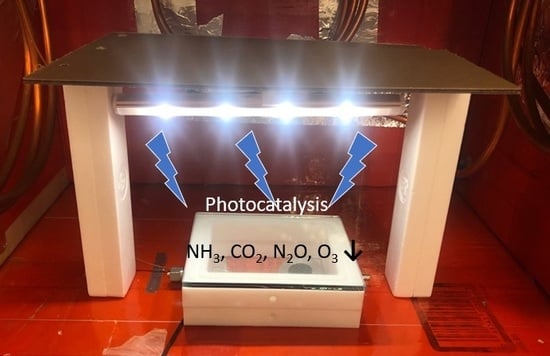
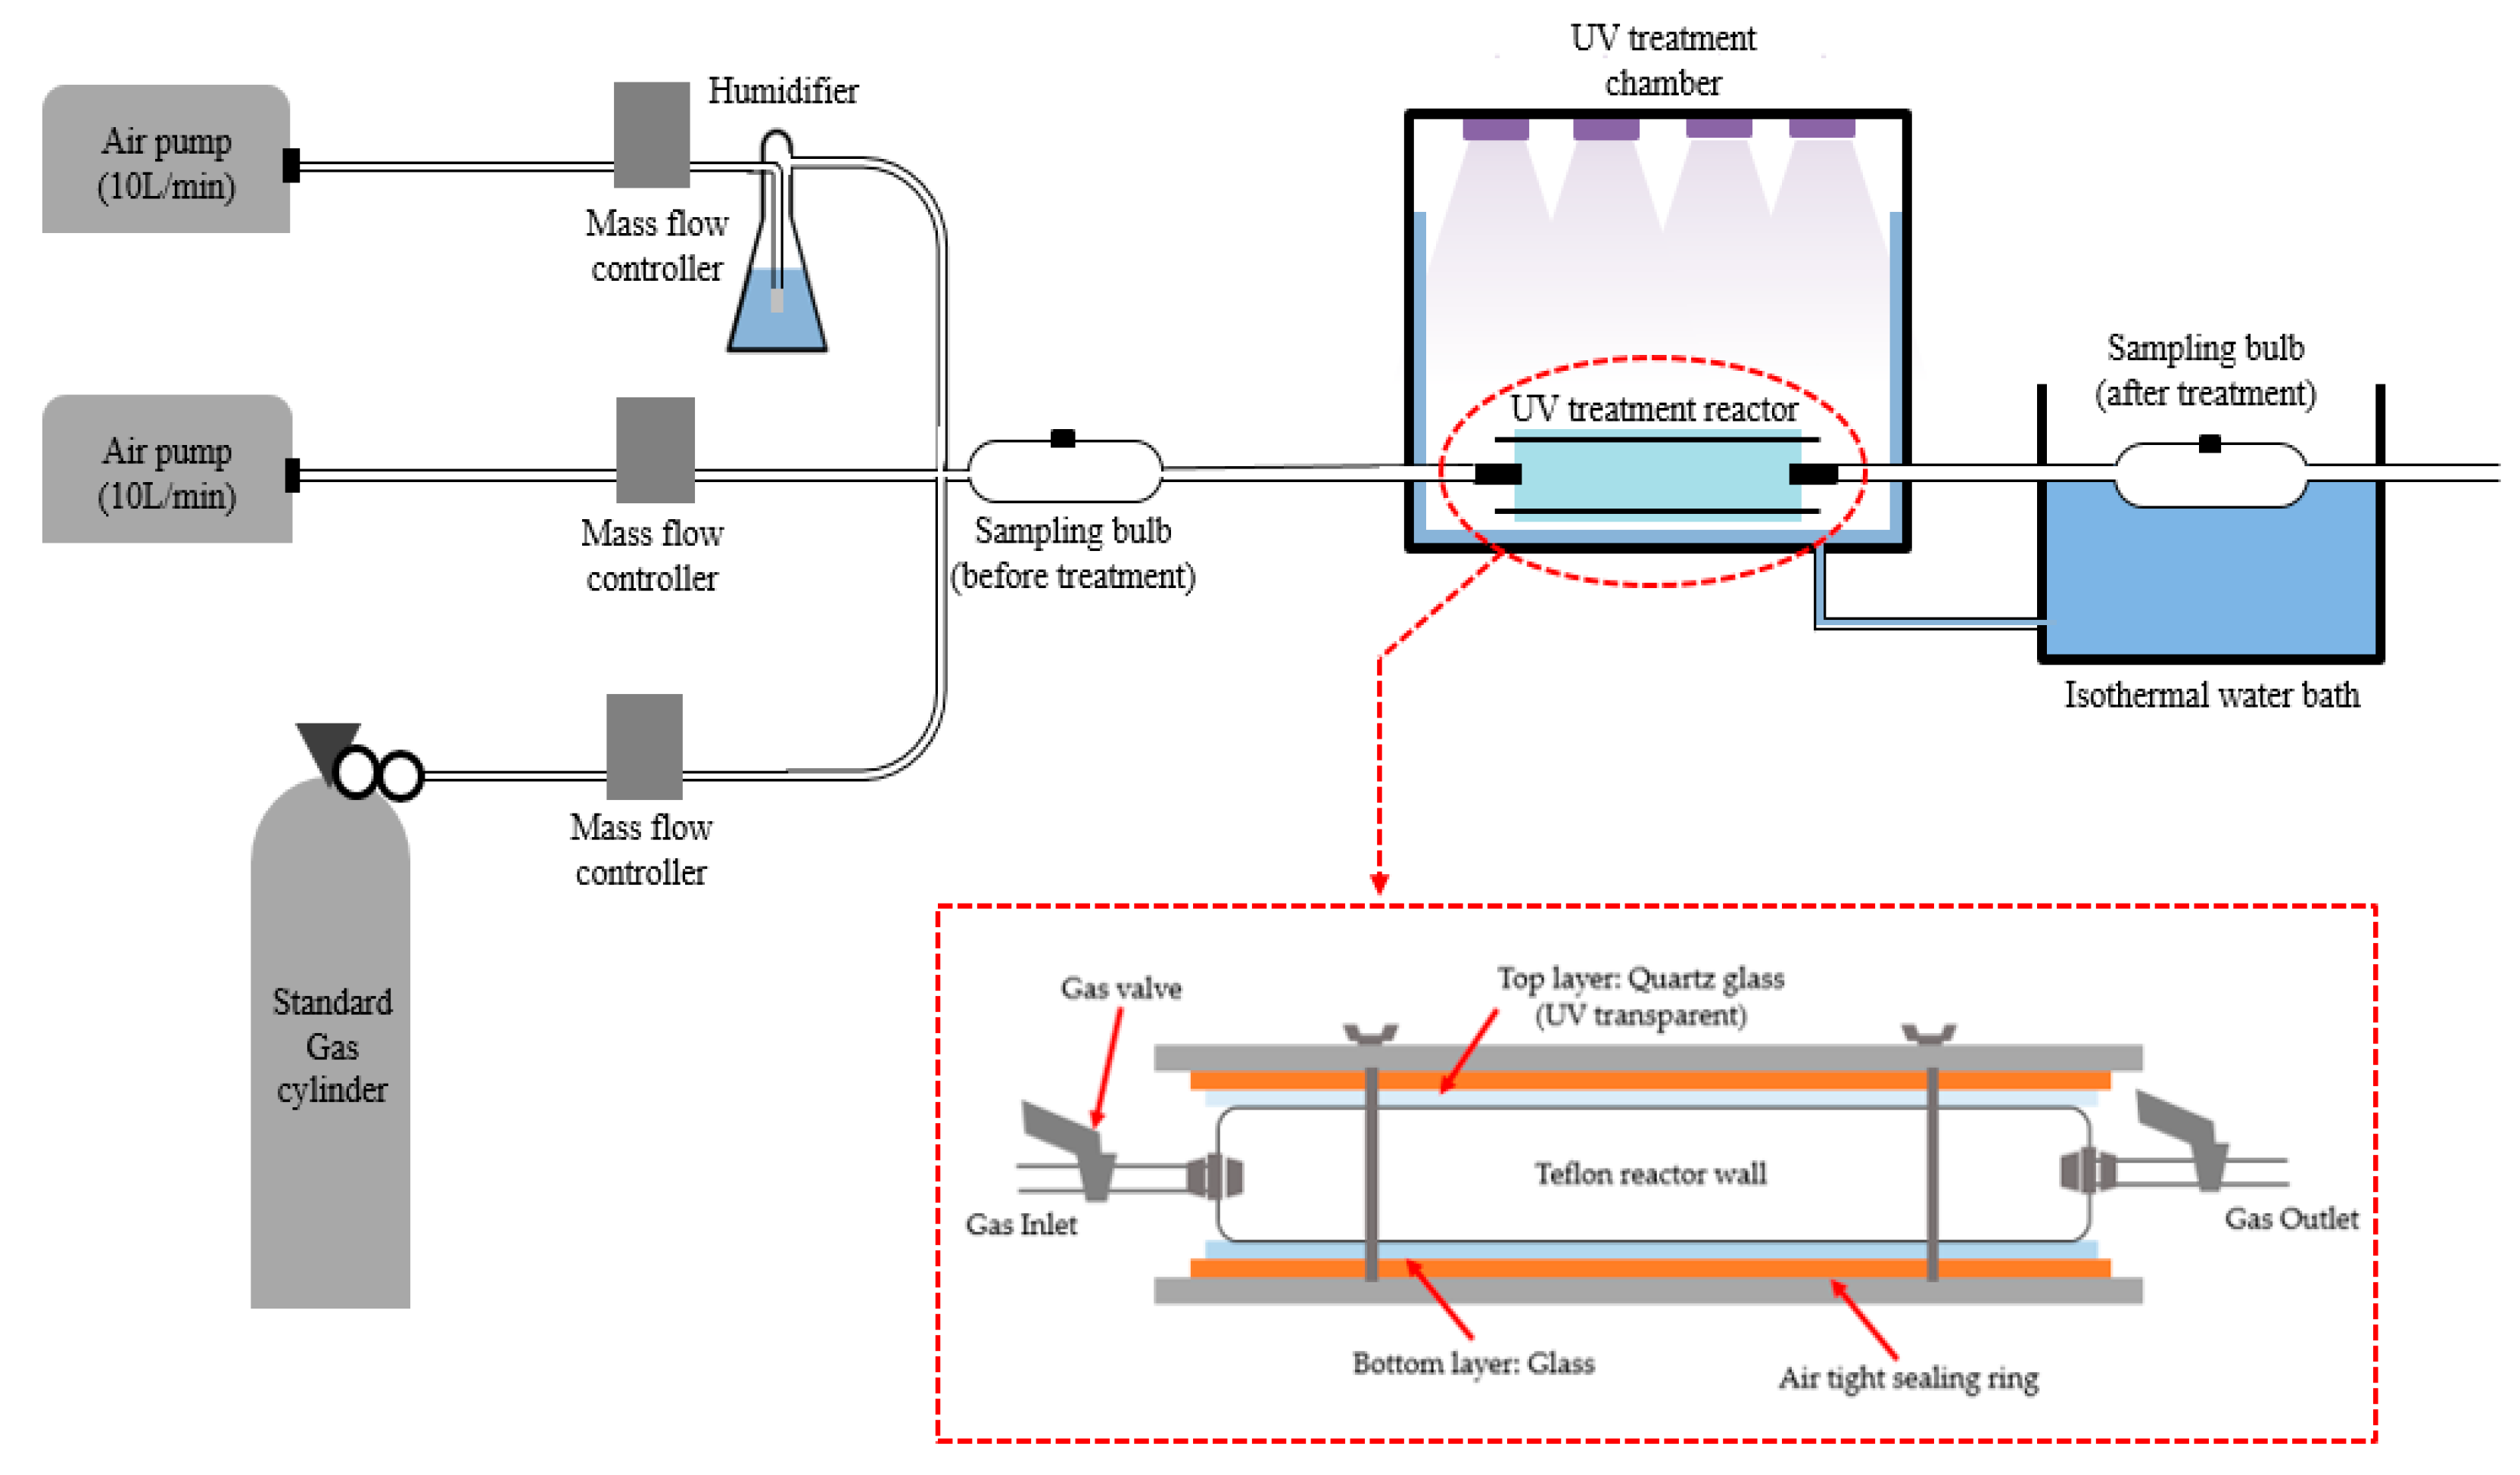
2.1. Experimental System
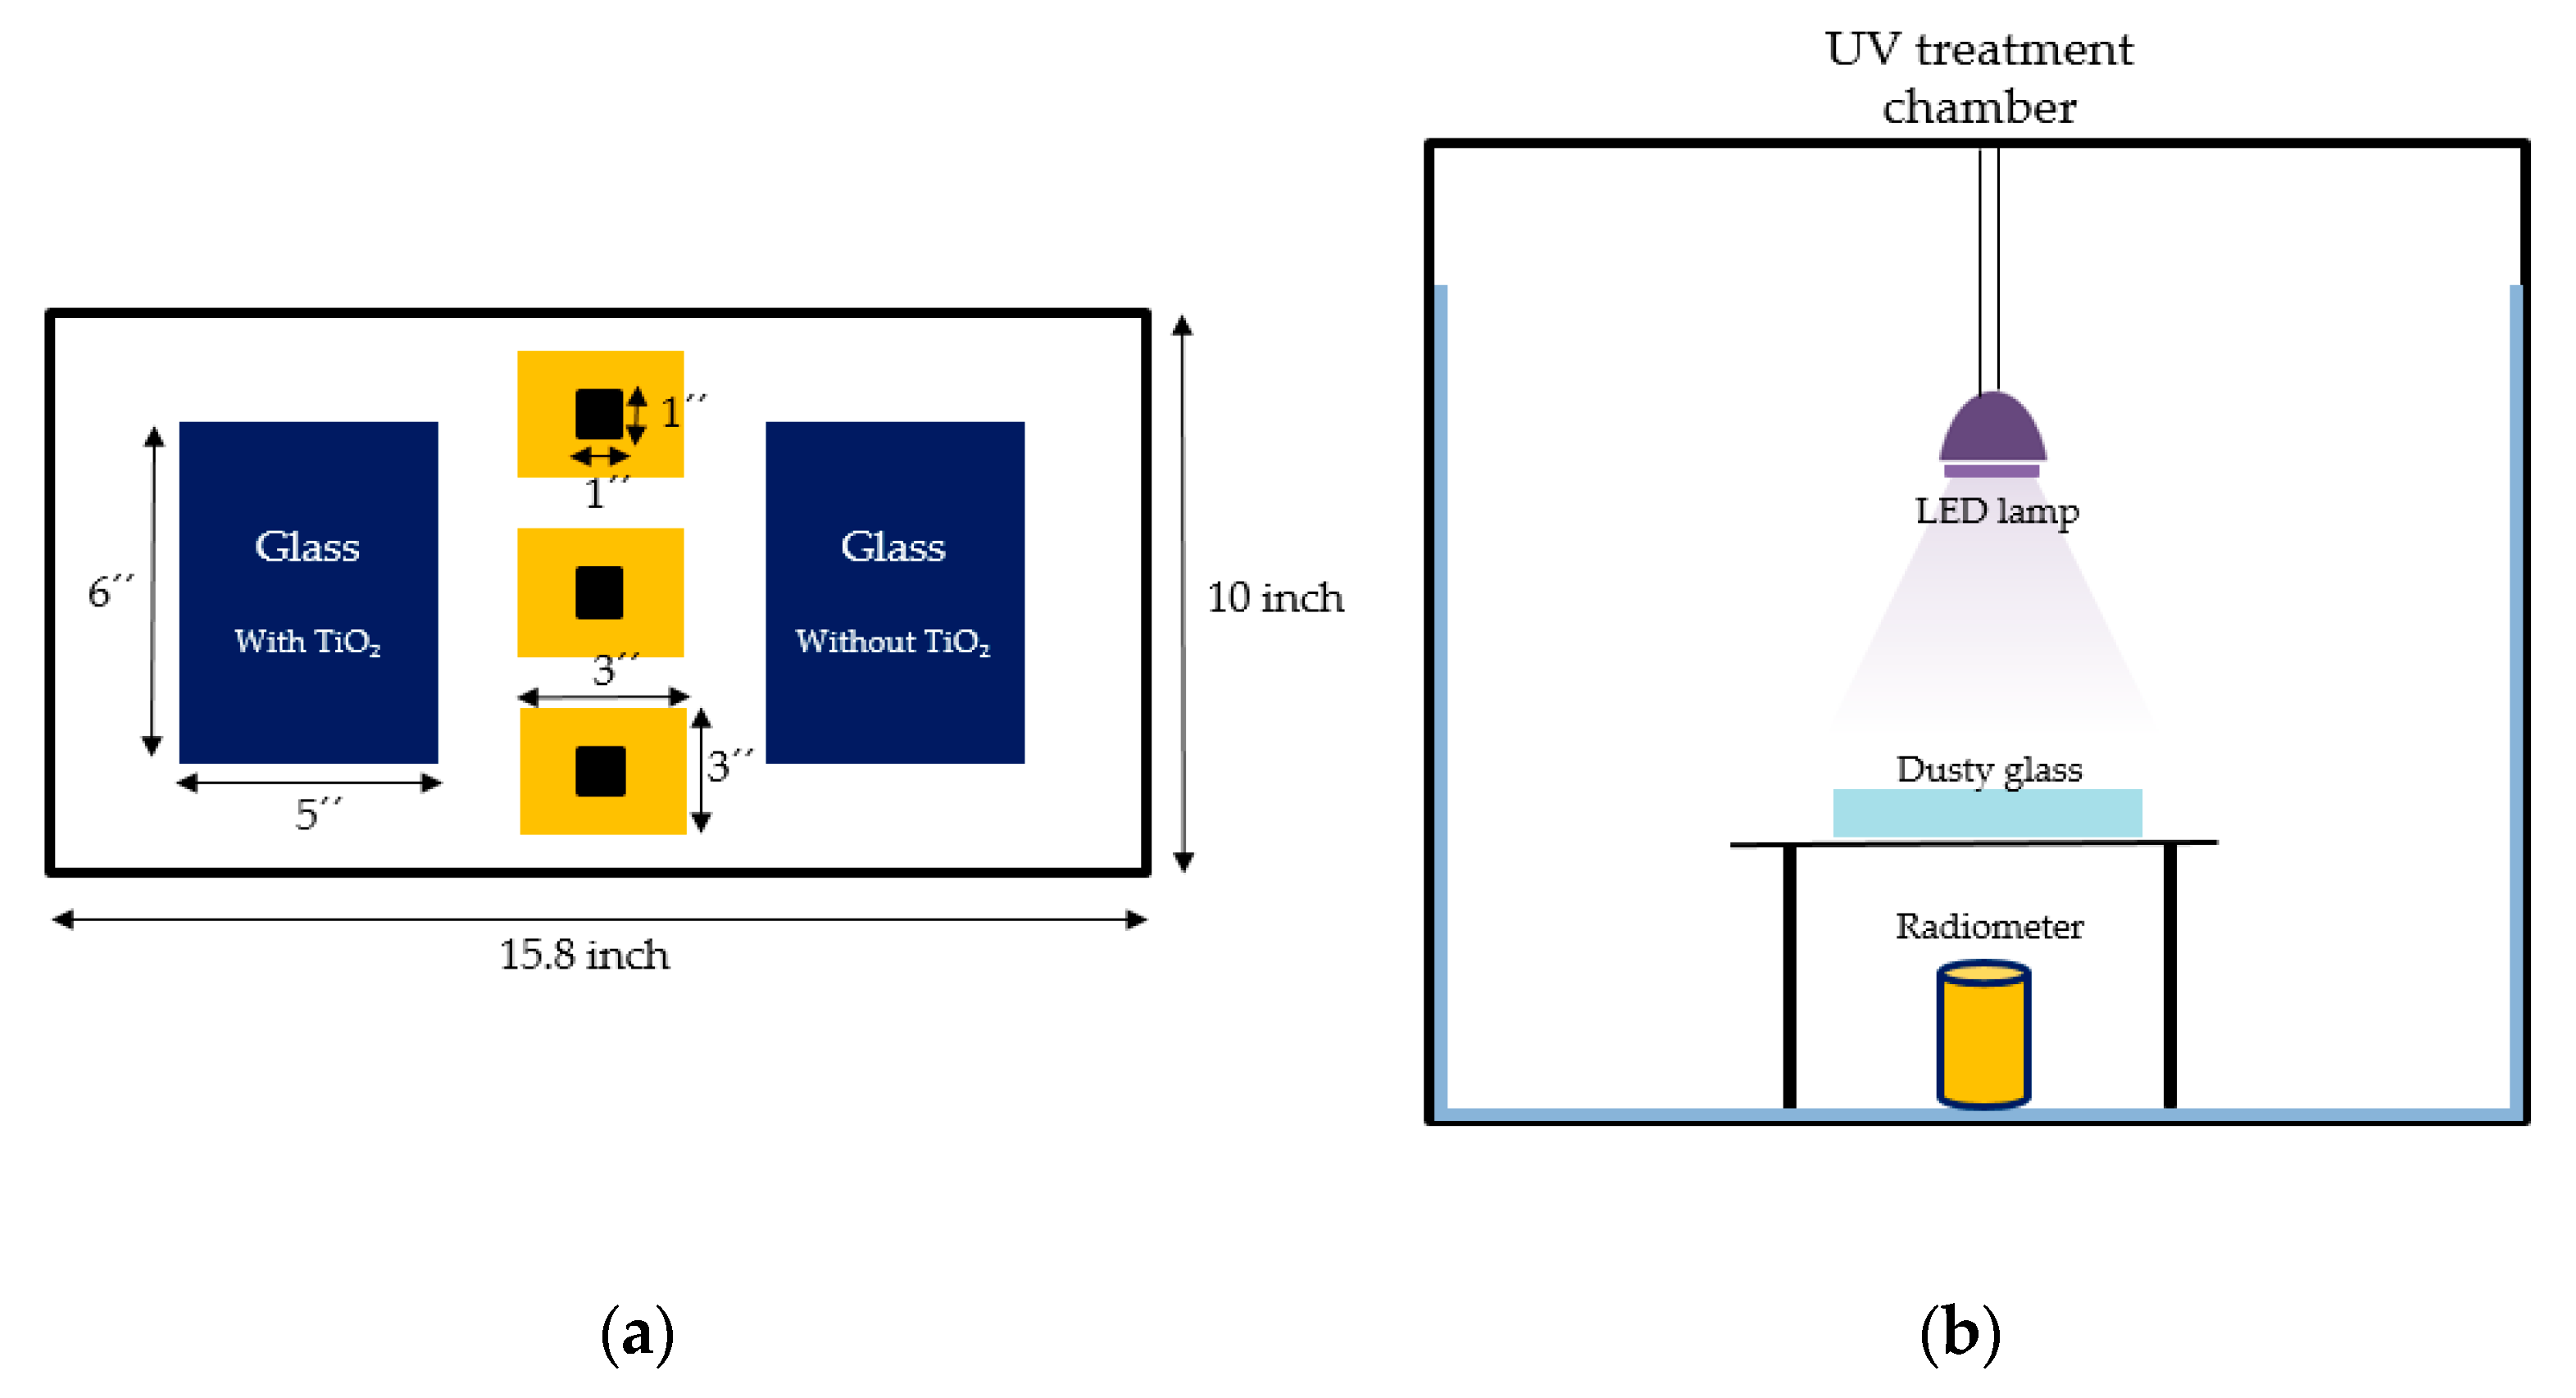
2.2. UV-A Irradiation Sources
2.3. Ammonia and Hydrogen Sulfide
2.4. Greenhouse Gases
2.5. Ozone
2.6. Dust Collection in A Poultry Barn
2.7. Data analysis, Accounting for Sample Losses Due to Adsorption
2.8. Statistical Analysis
3. Results
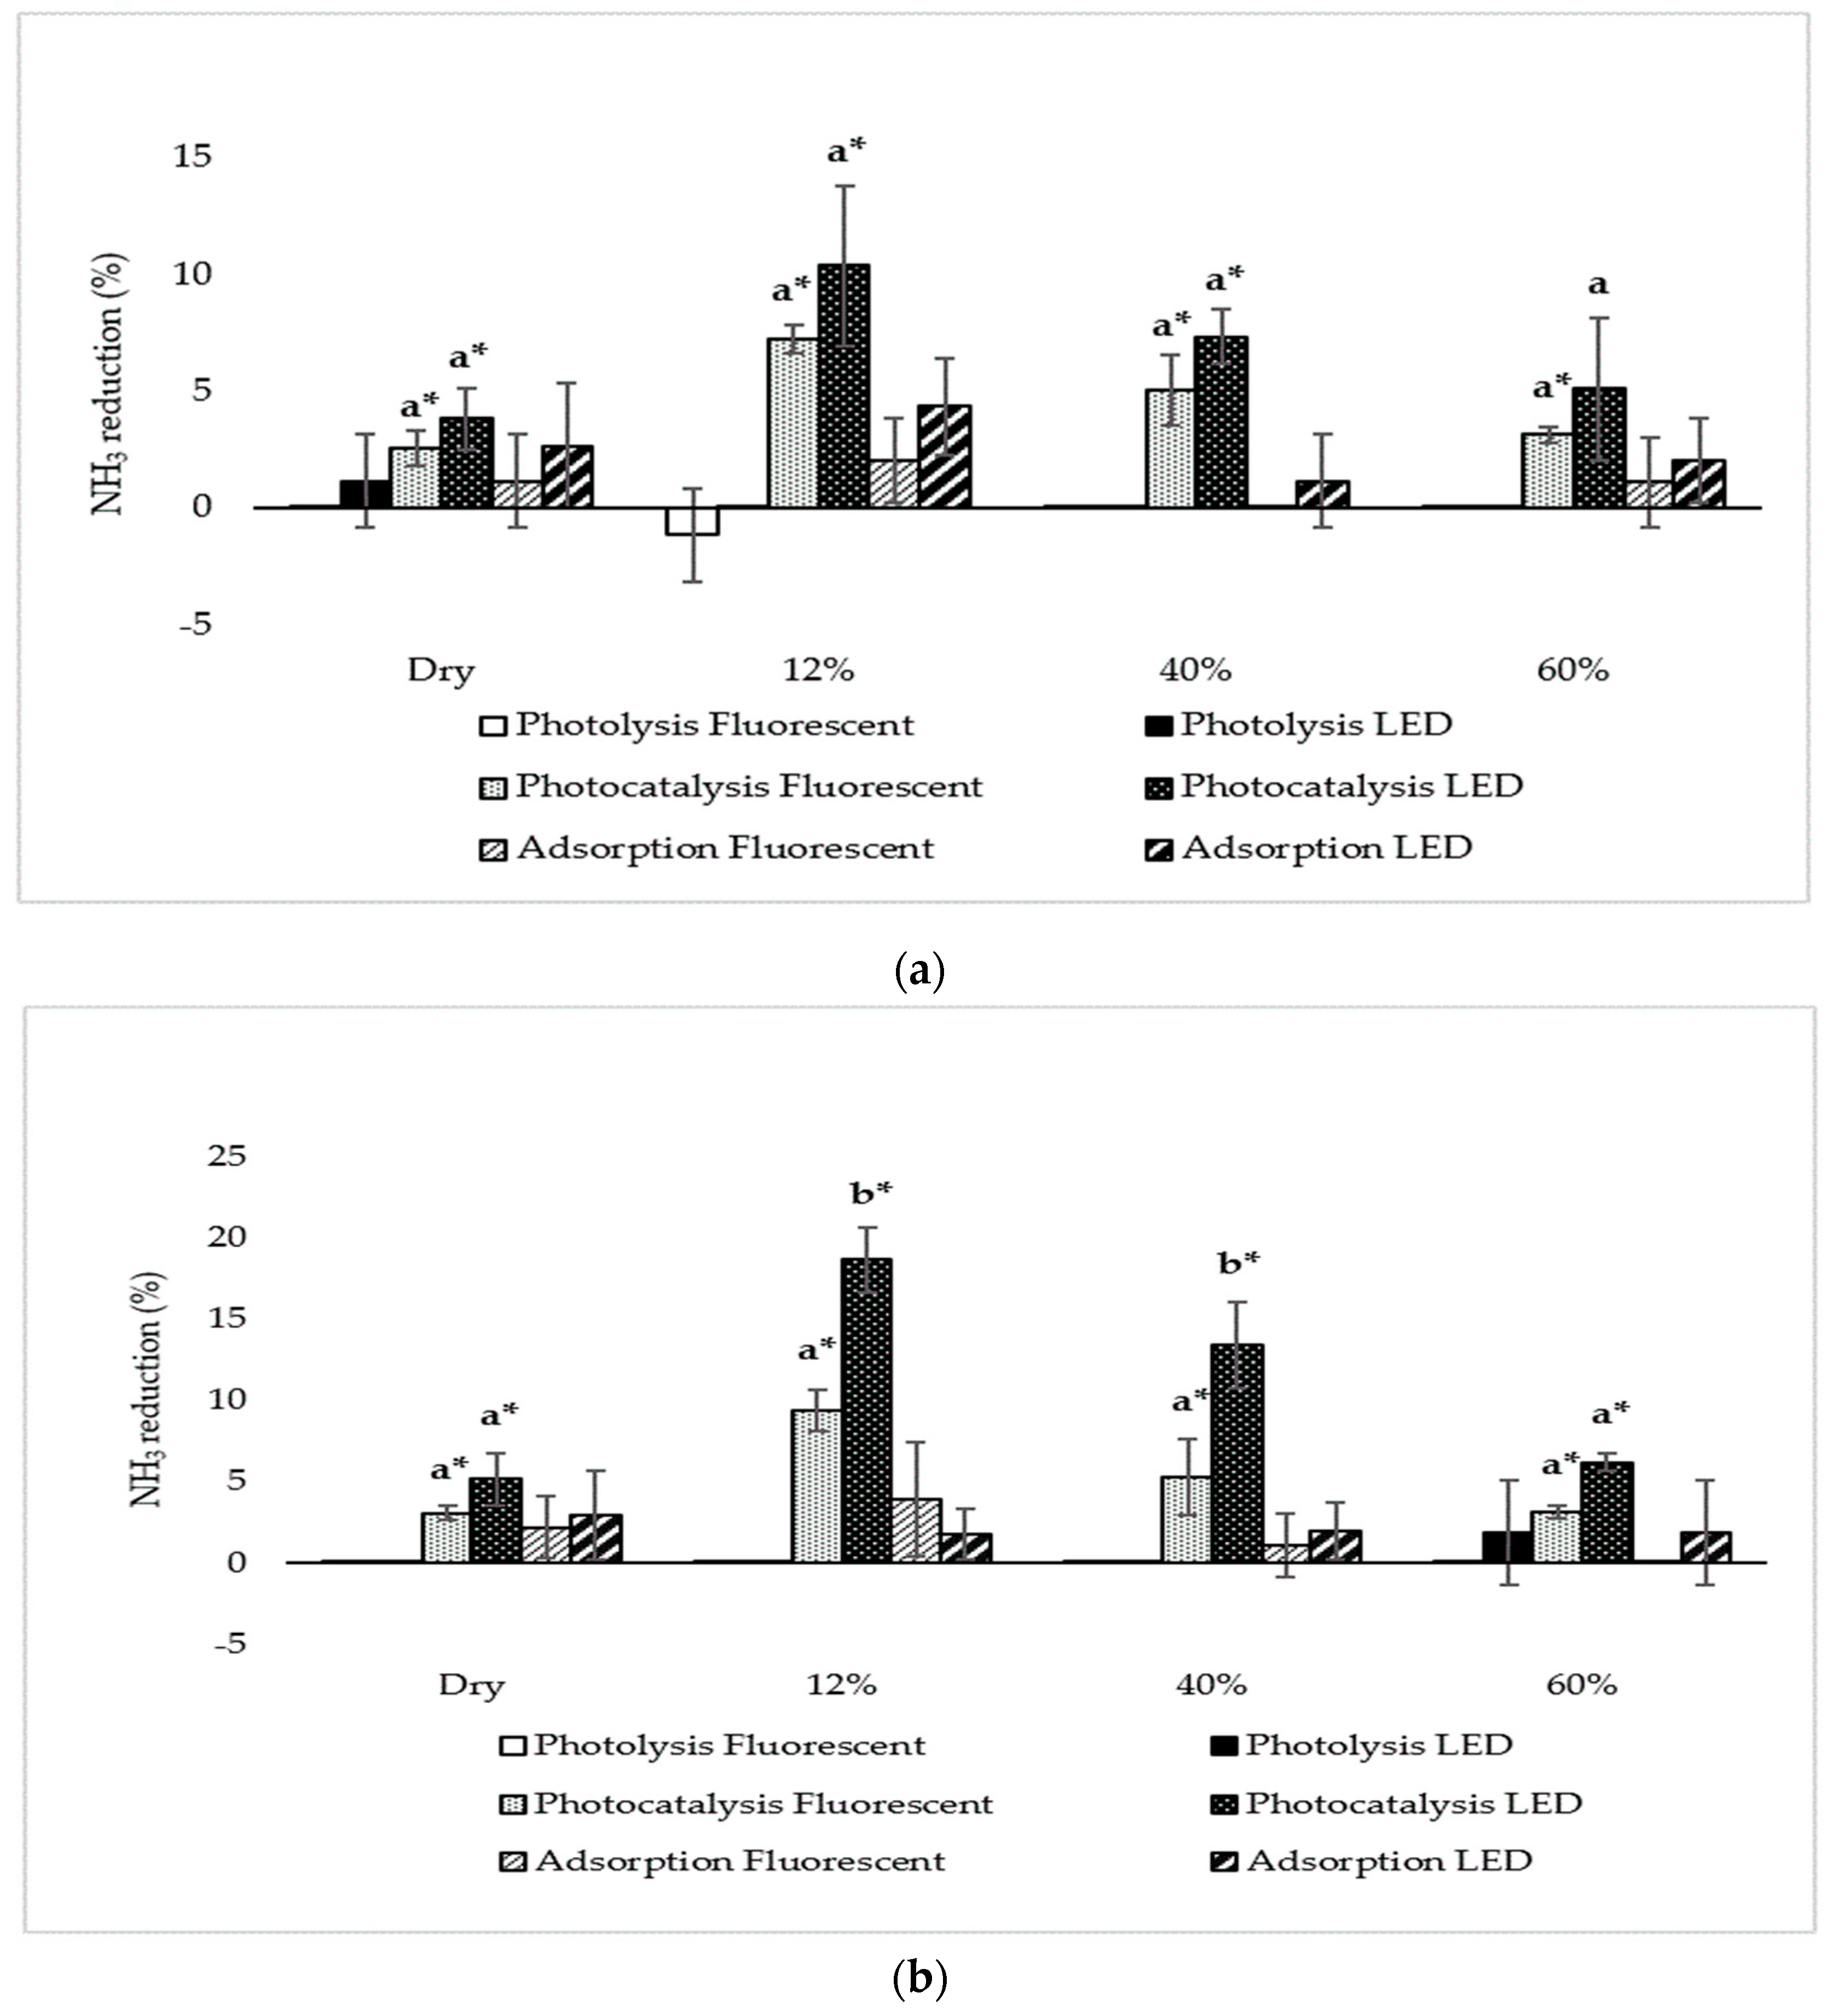
3.1. Ammonia
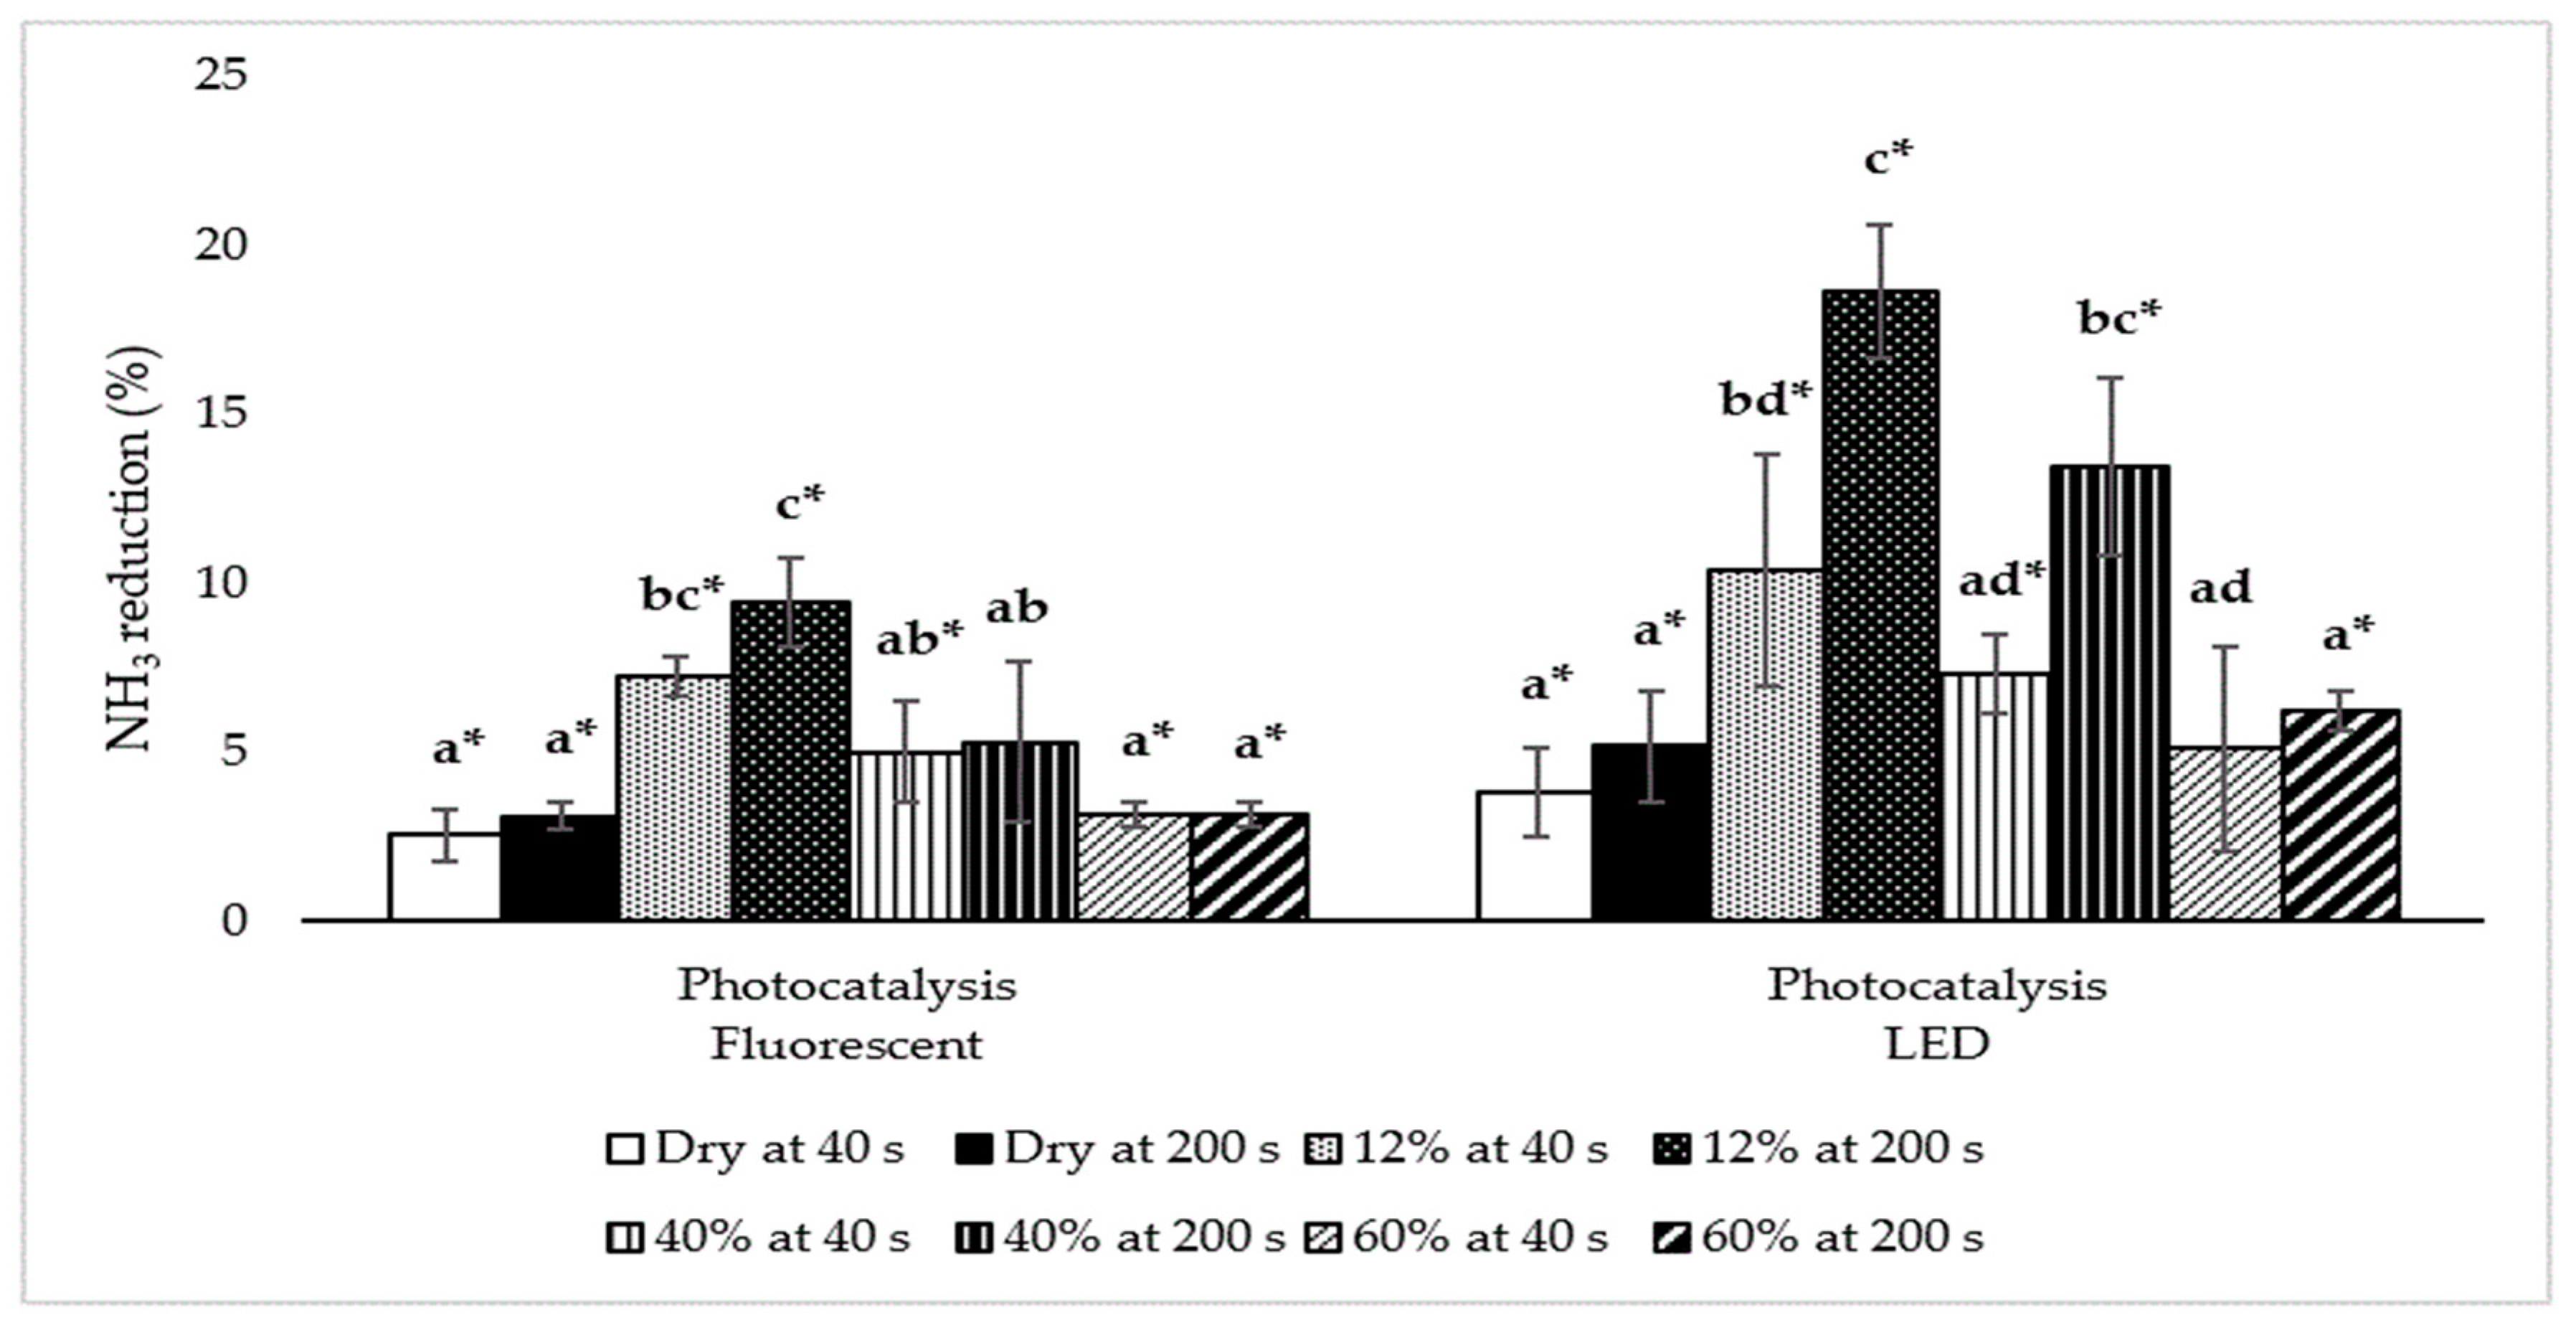
3.1.1. Effect of the Photocatalyst, Relative Humidity, Light Intensity, and Treatment Time
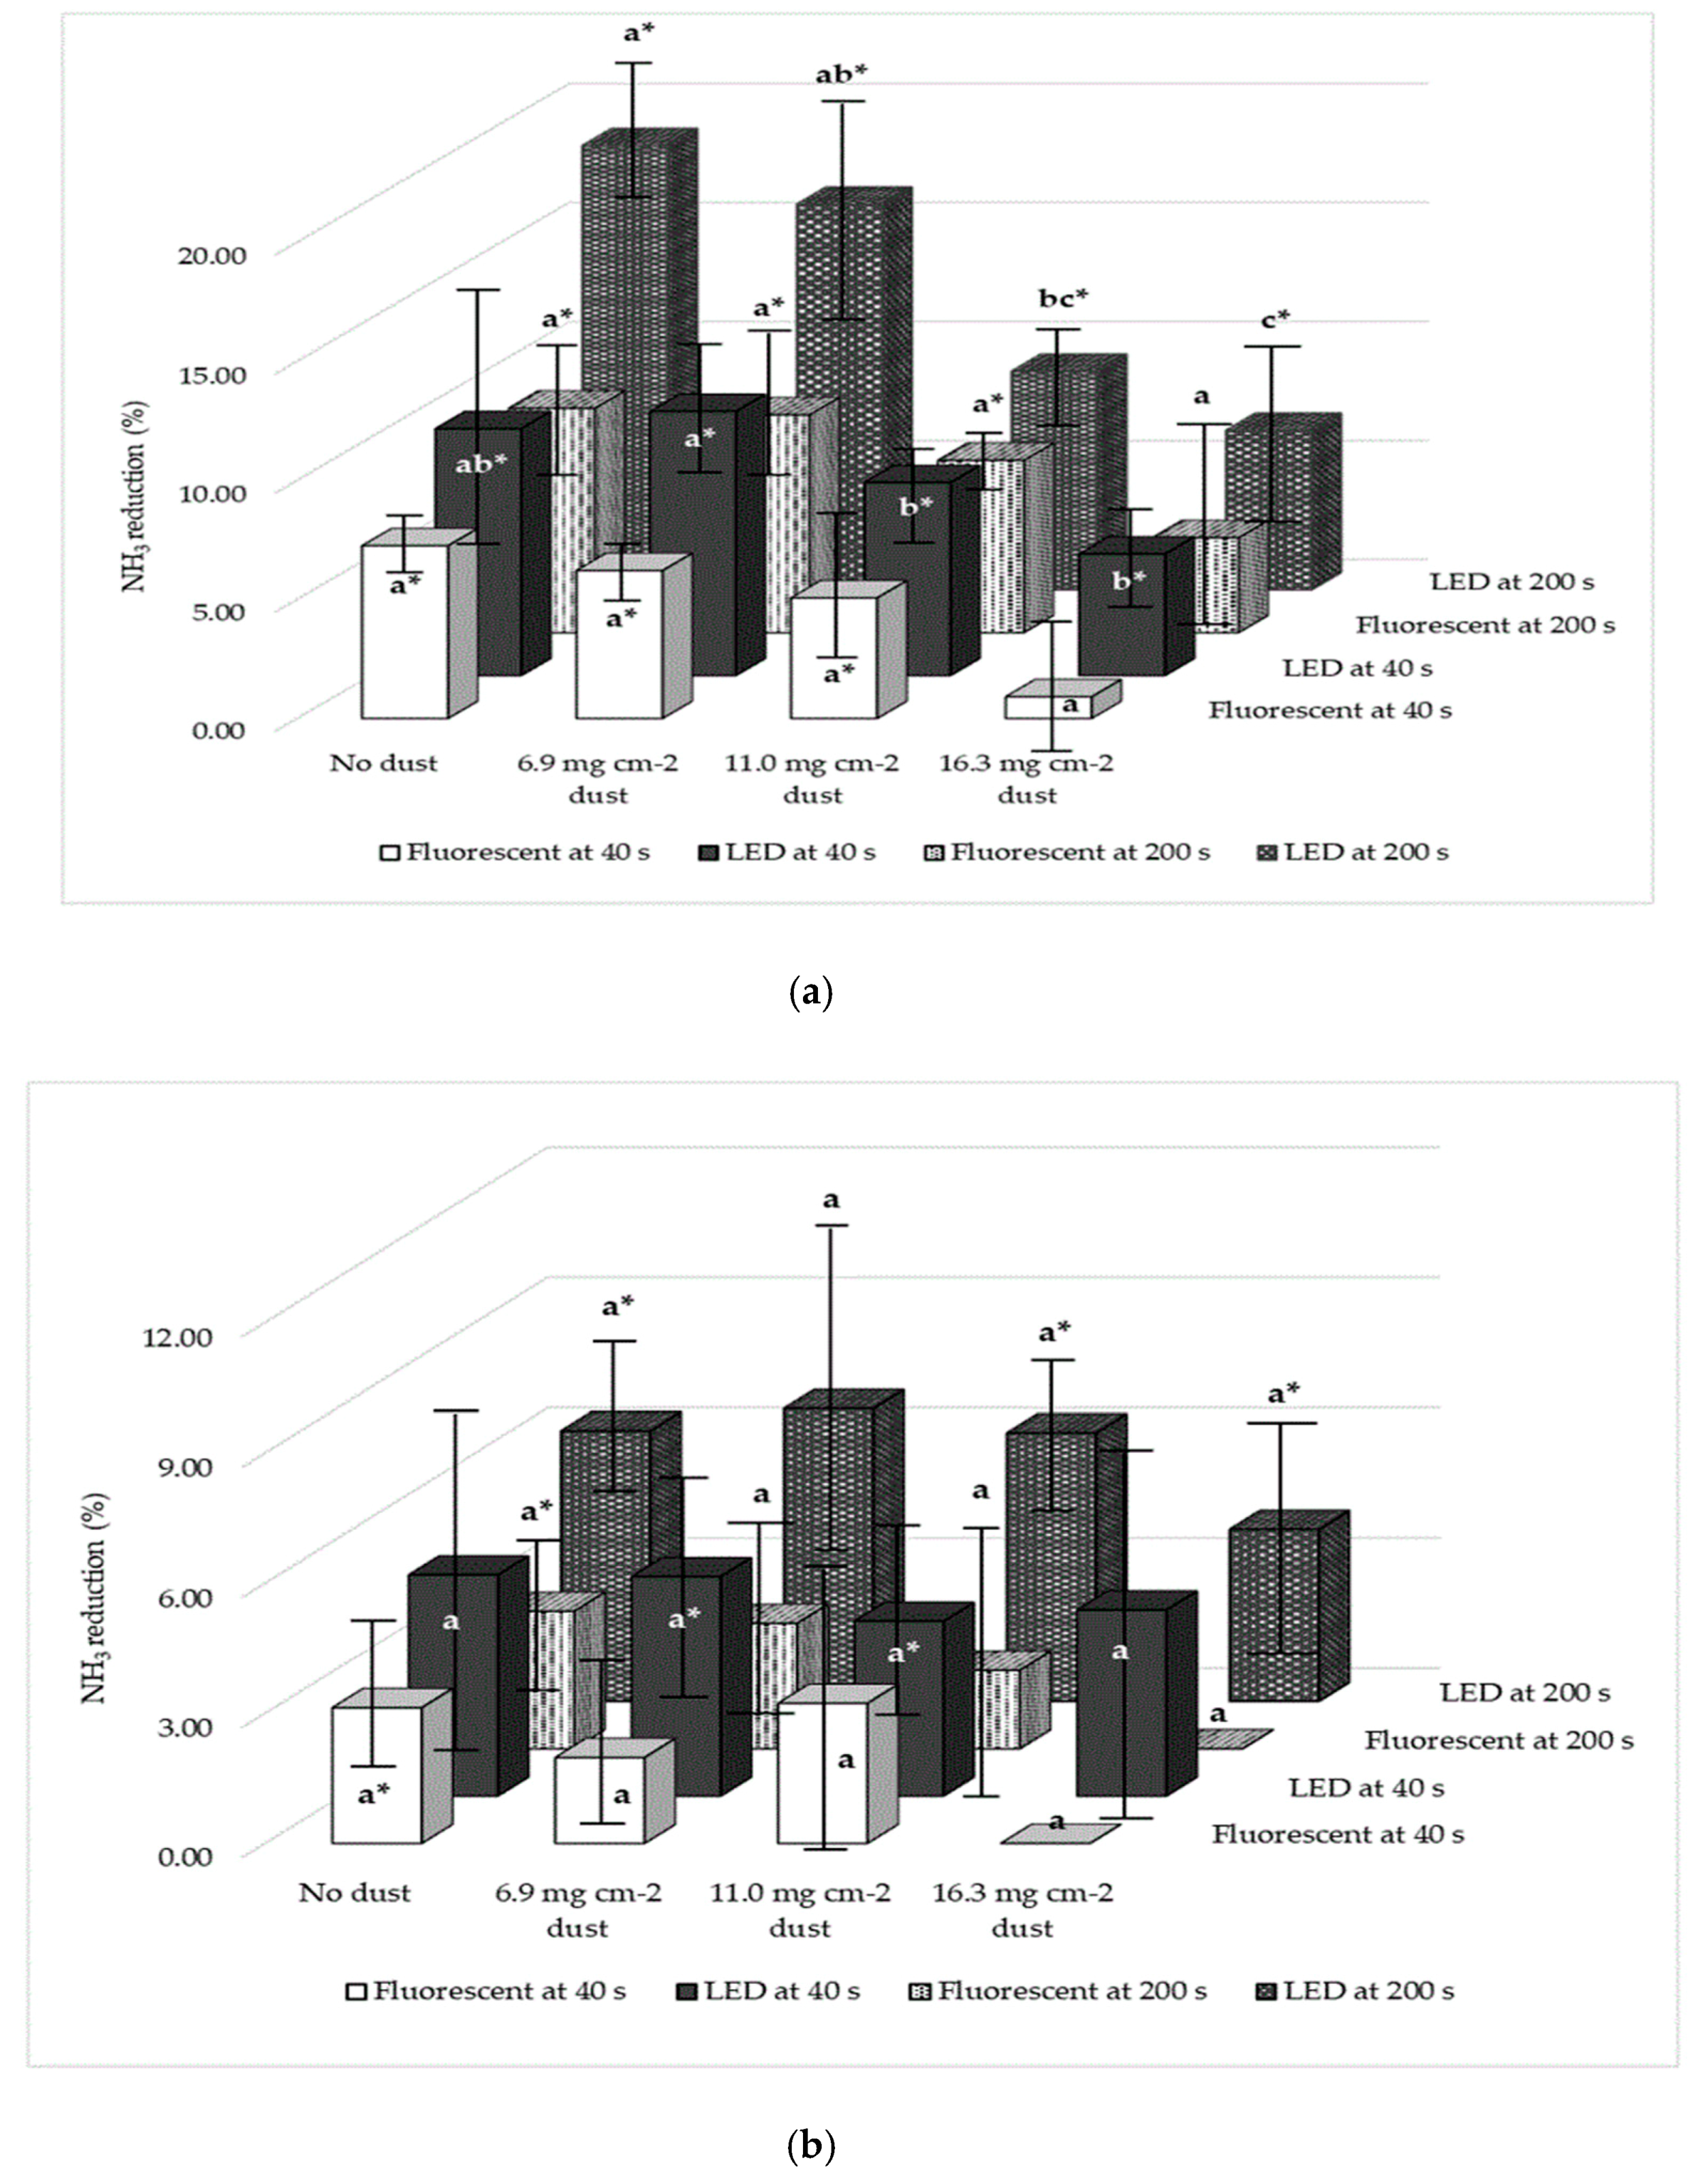
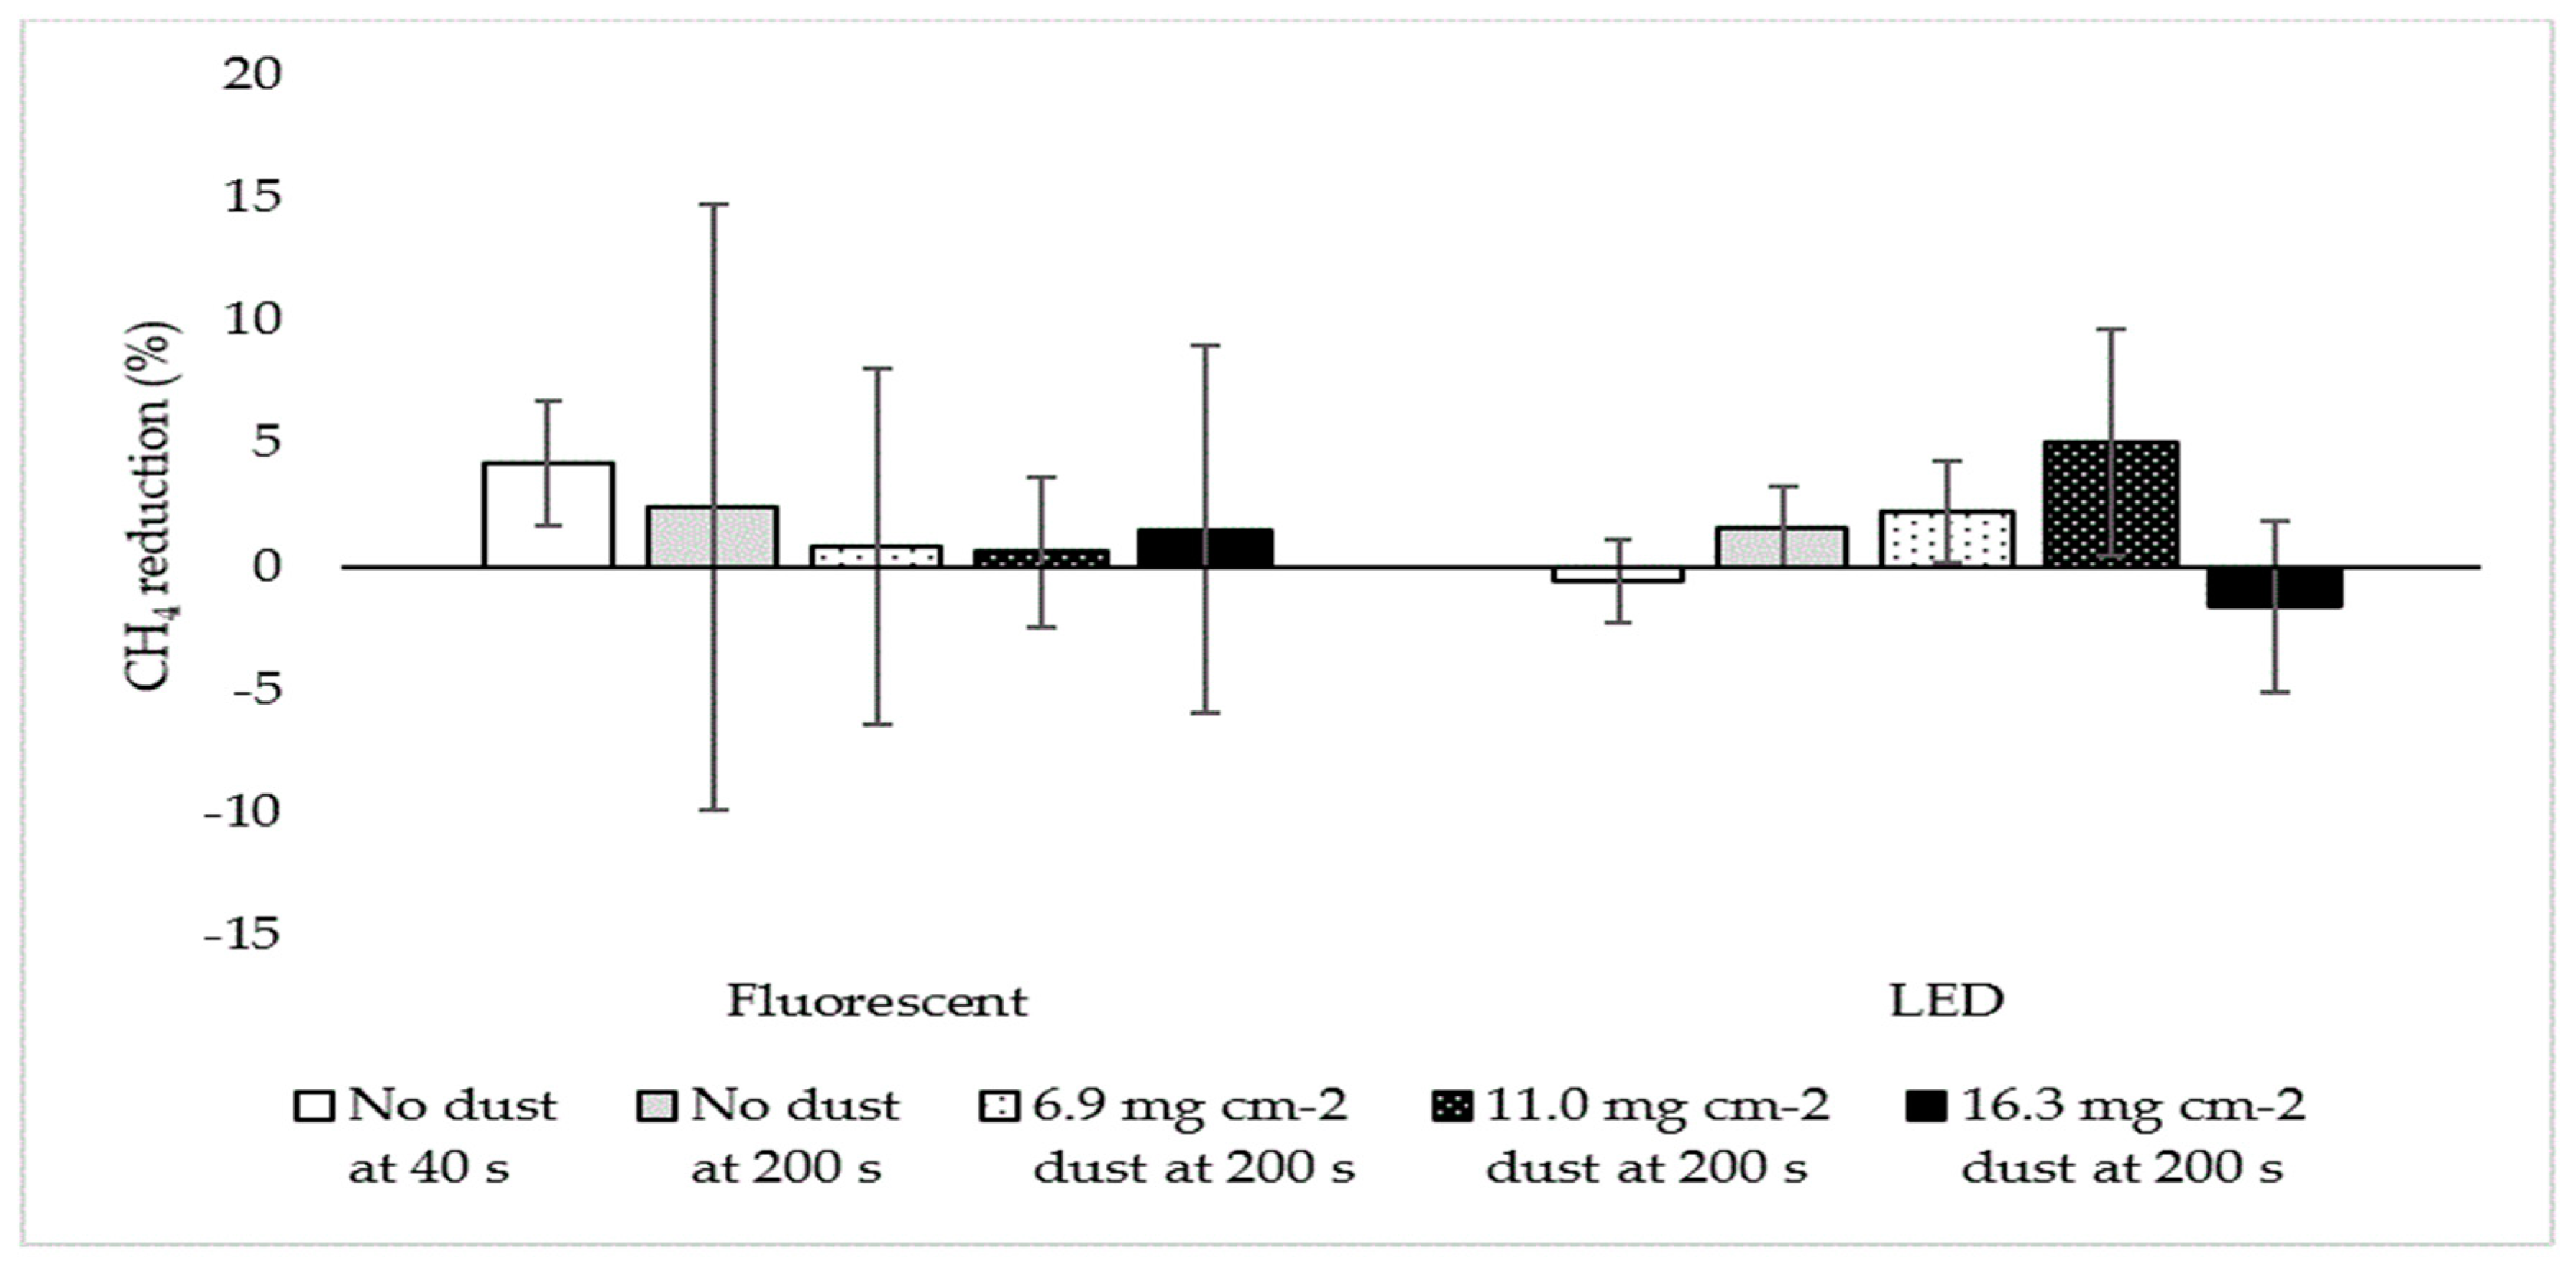
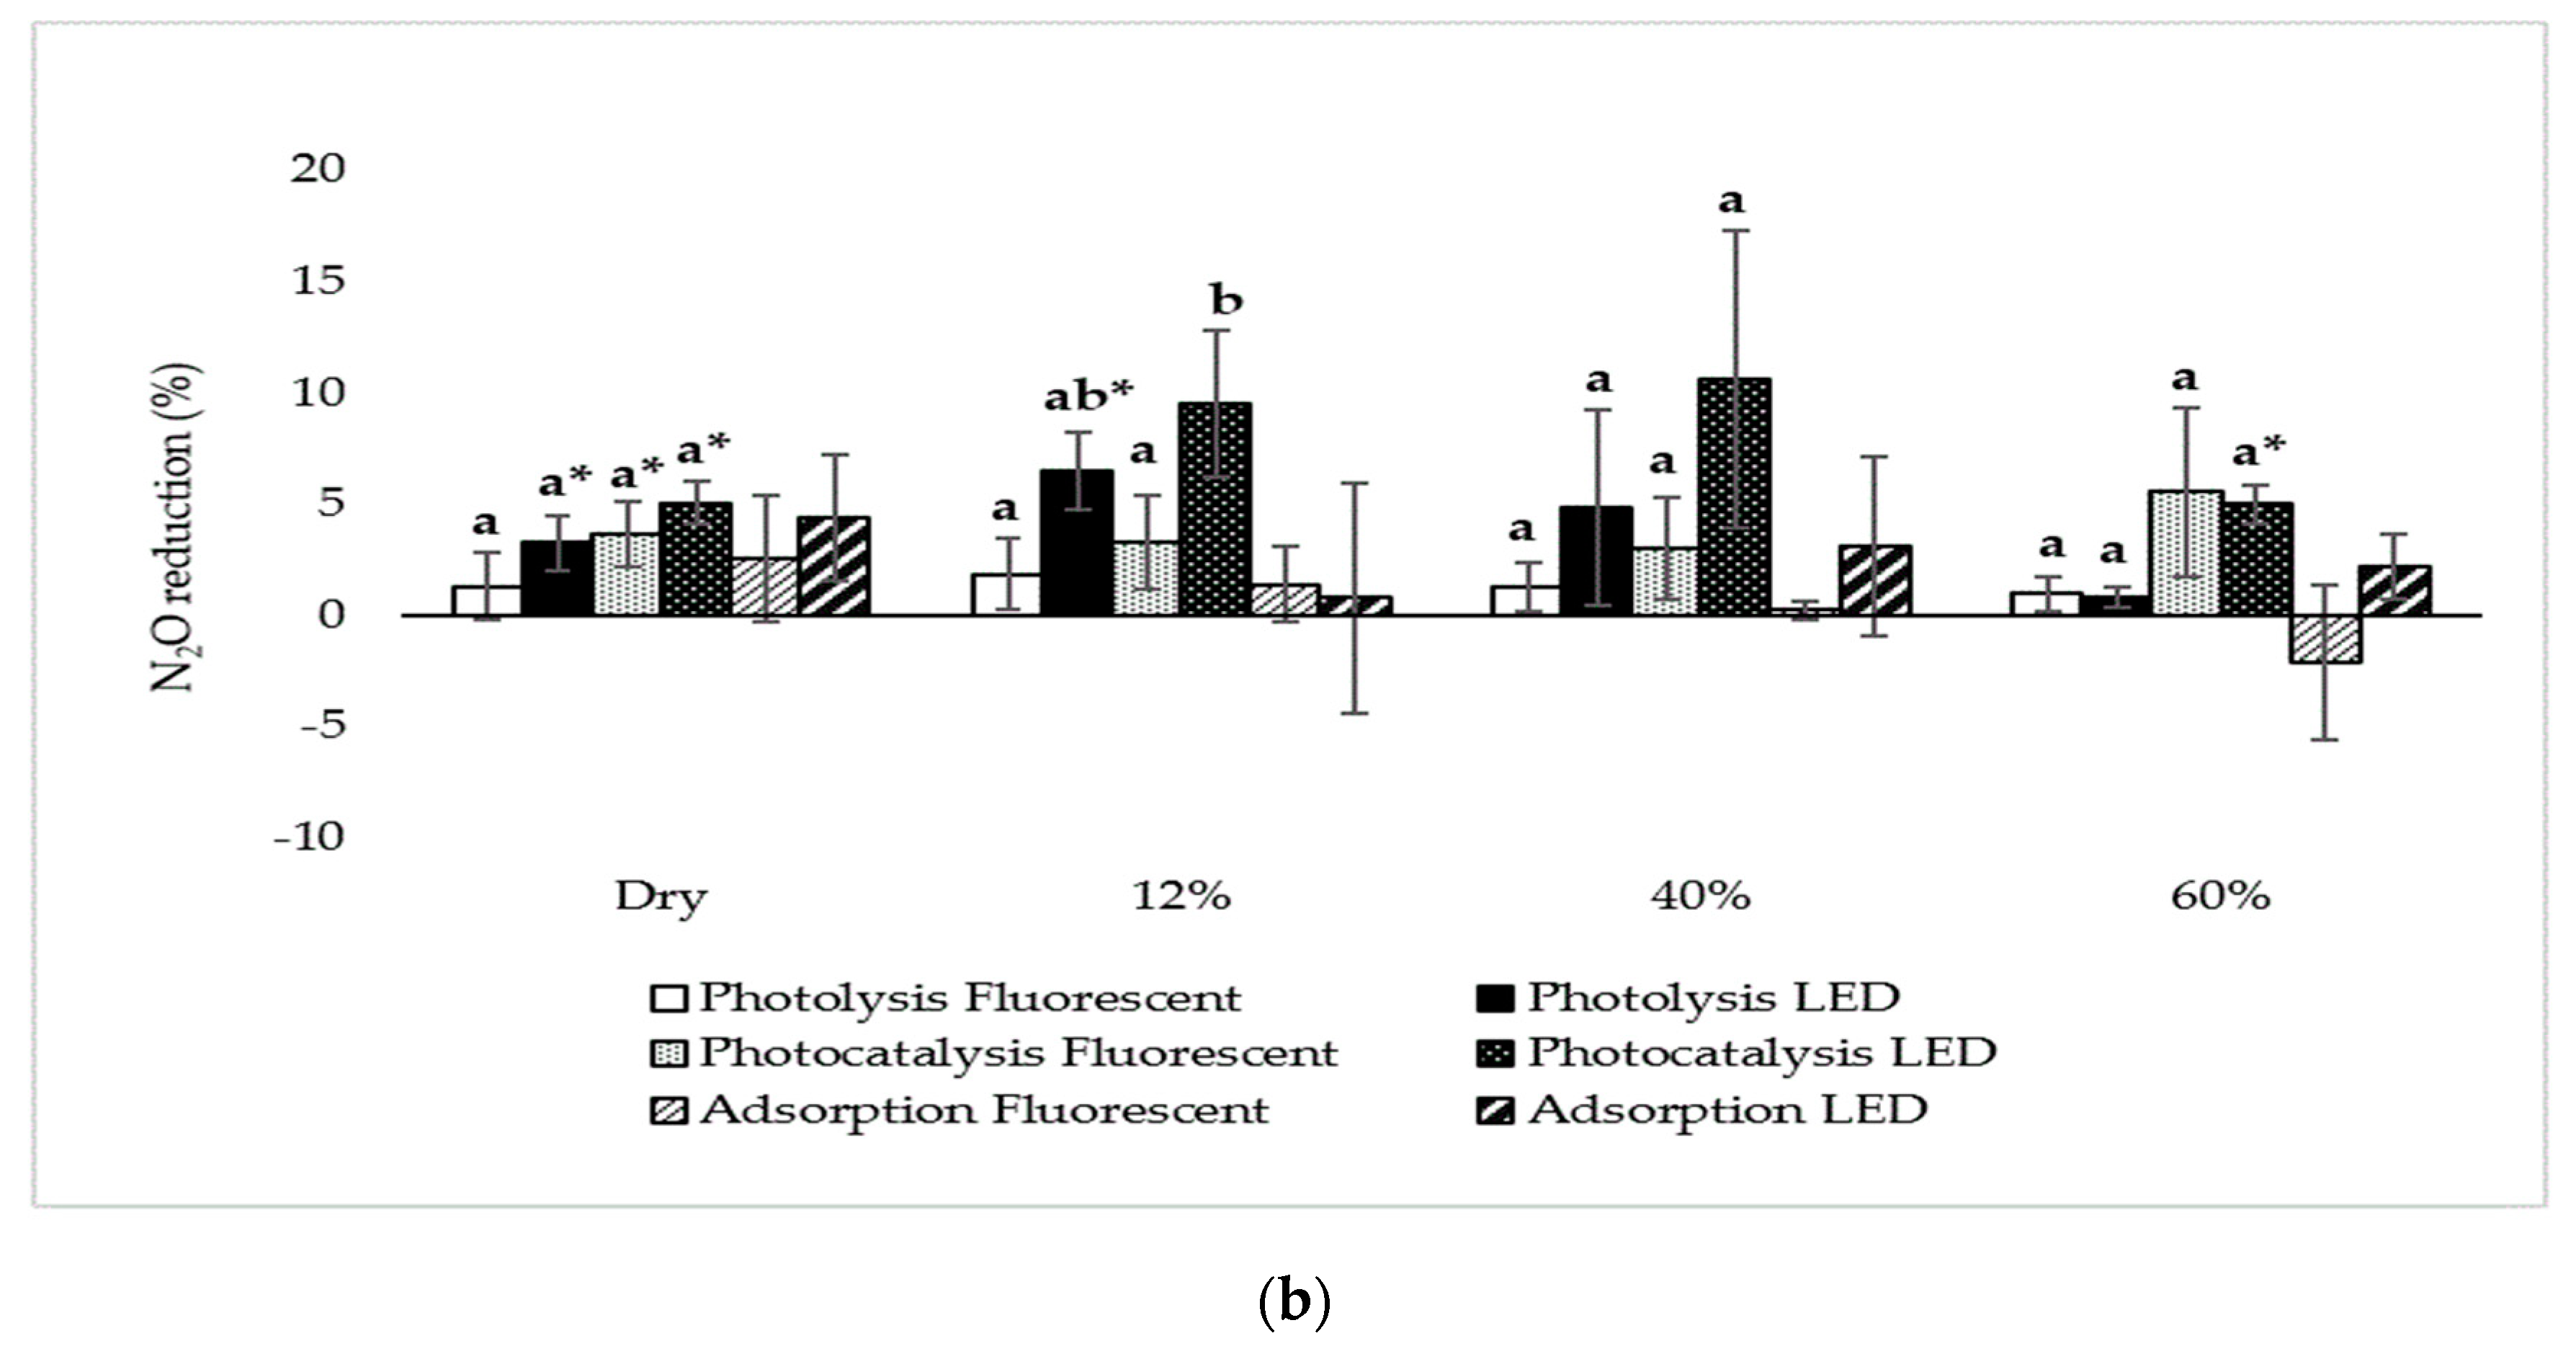
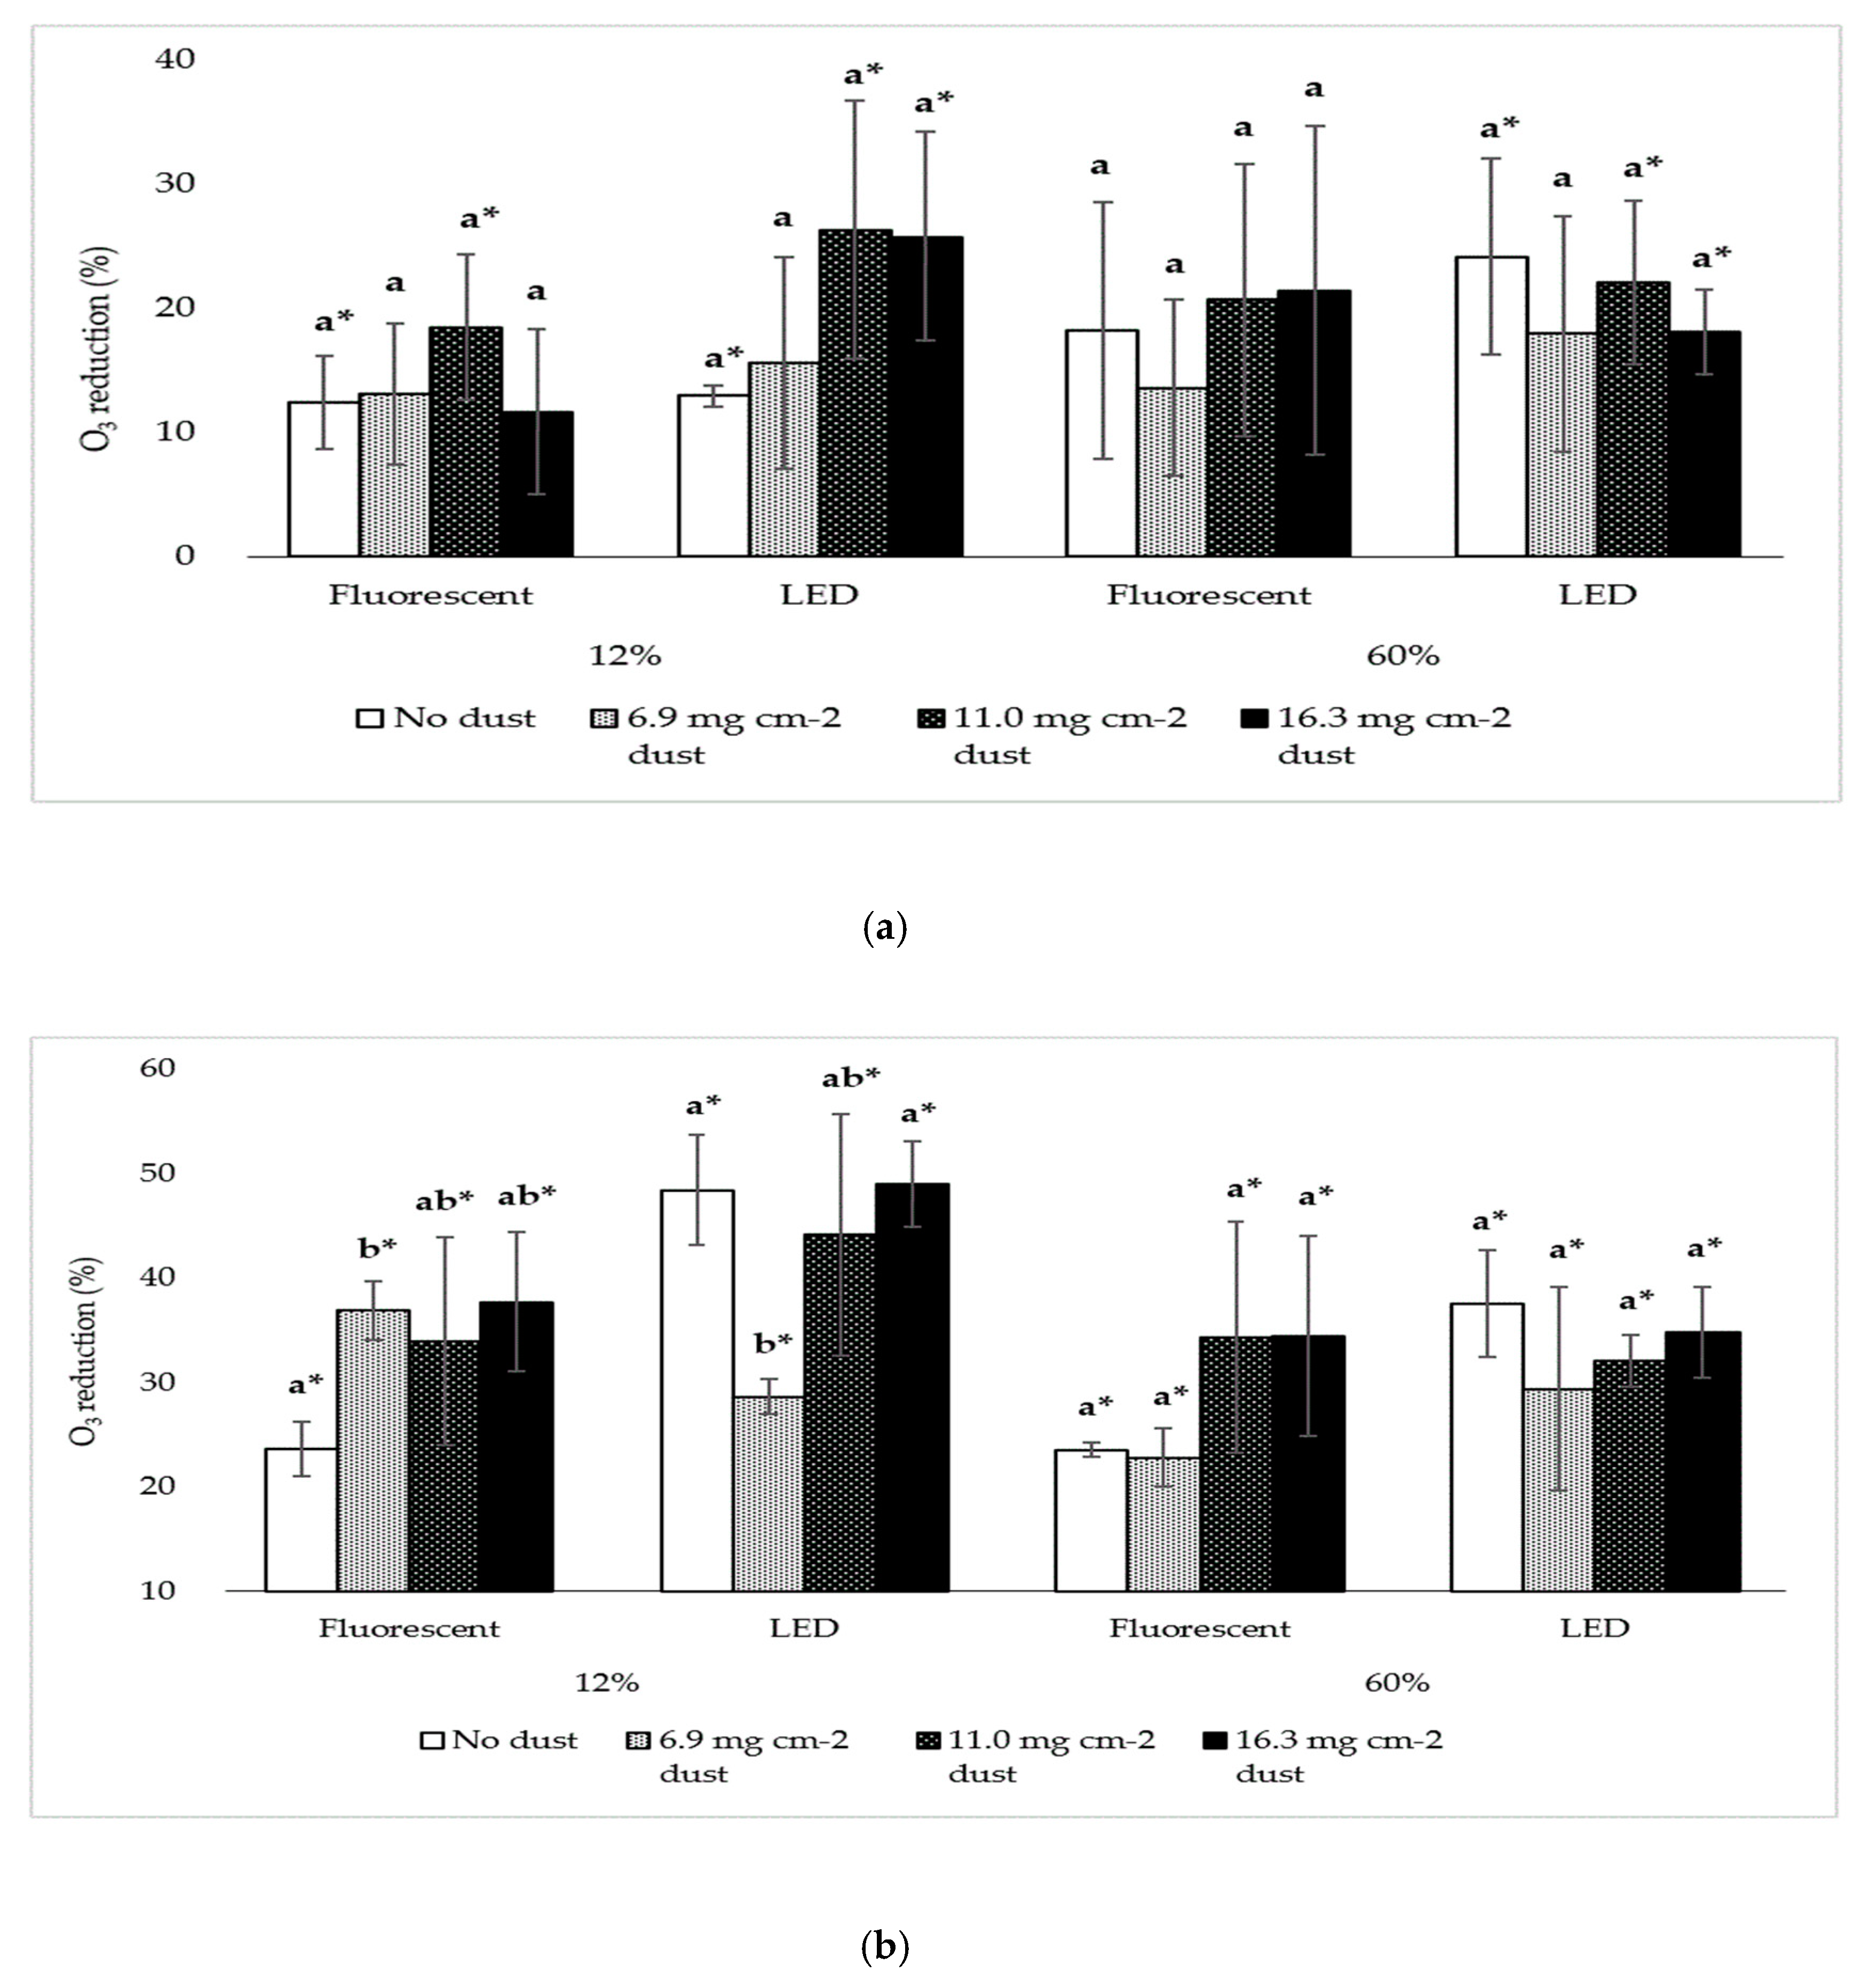
3.1.2. Effect of Poultry Dust
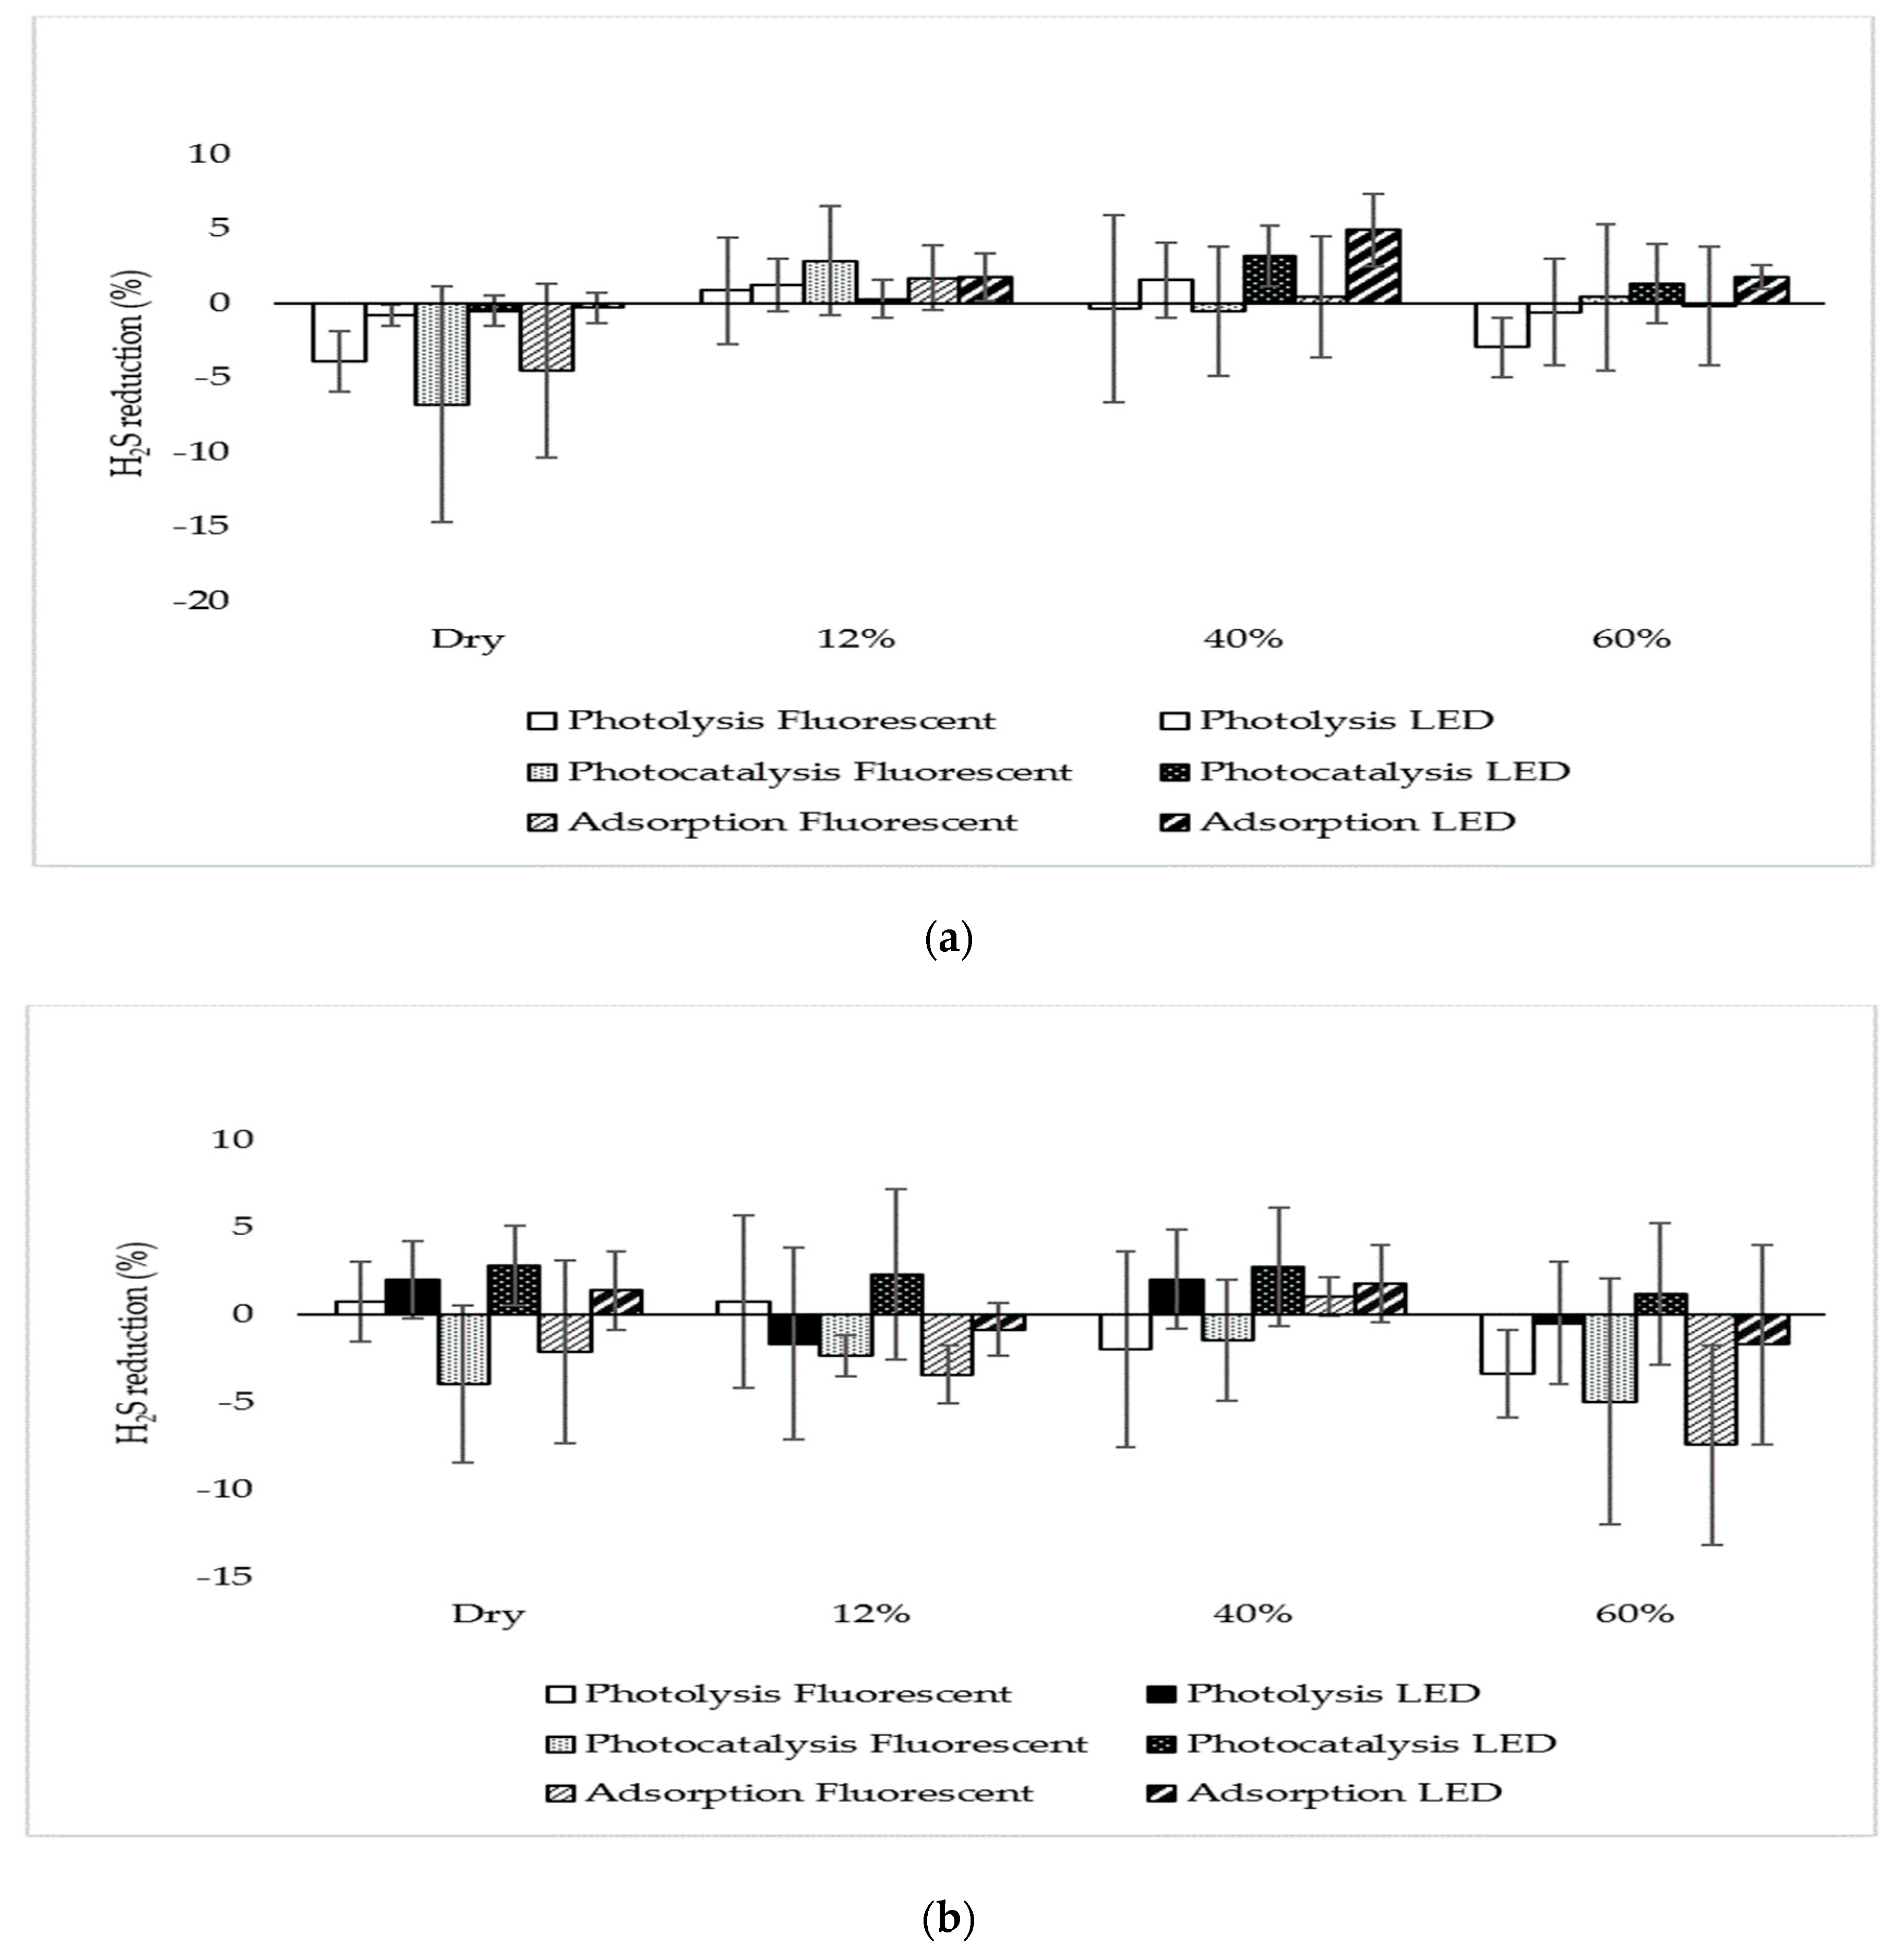
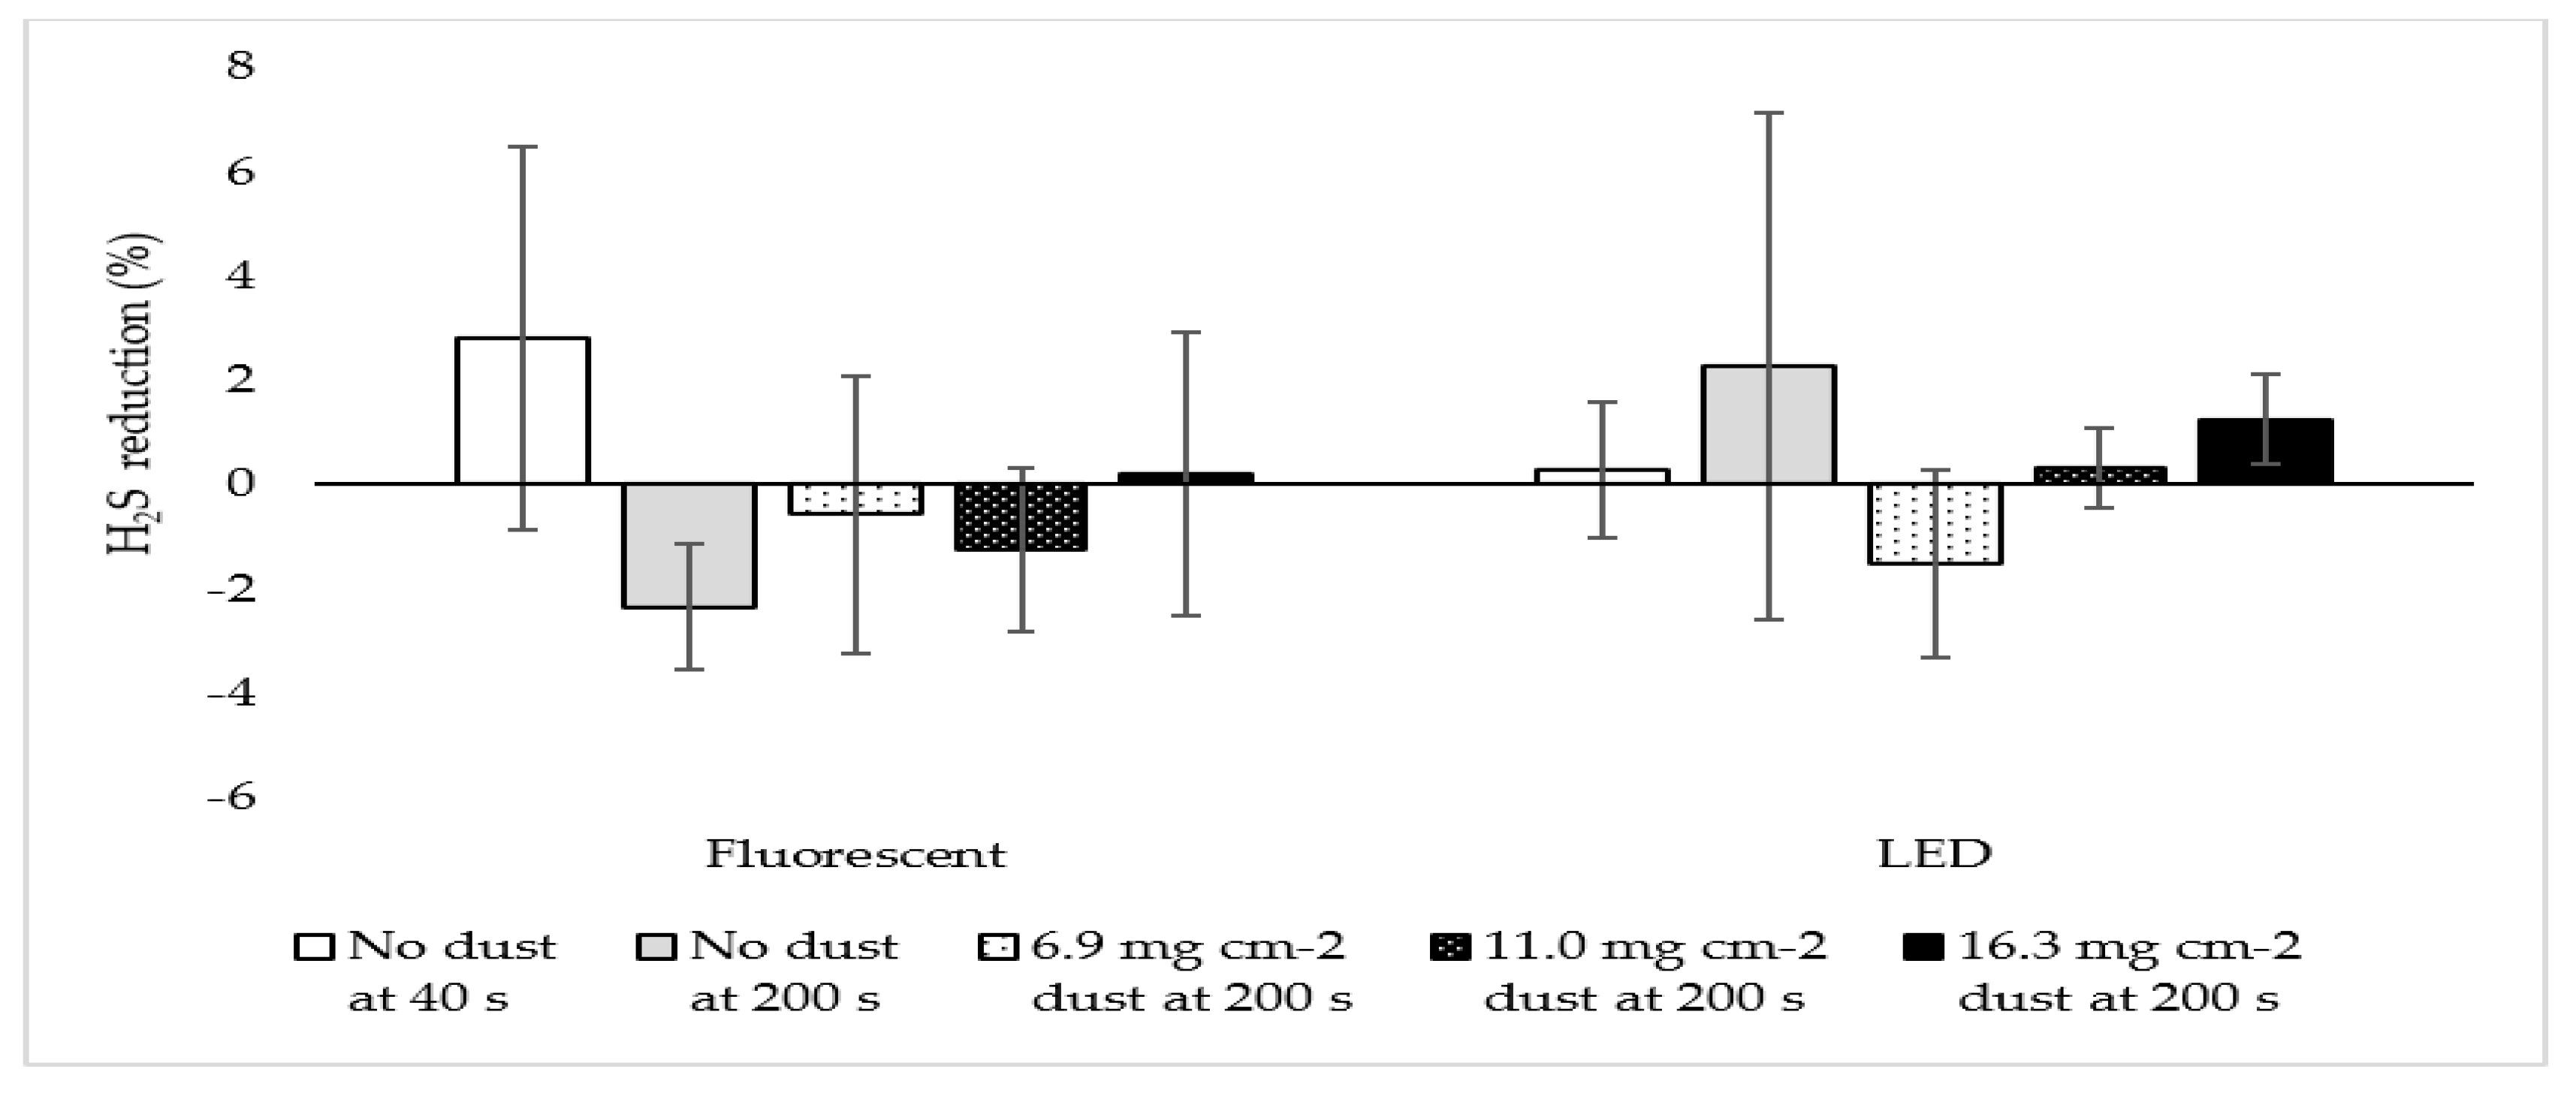
3.2. Hydrogen Sulfide
3.3. Greenhouse Gases
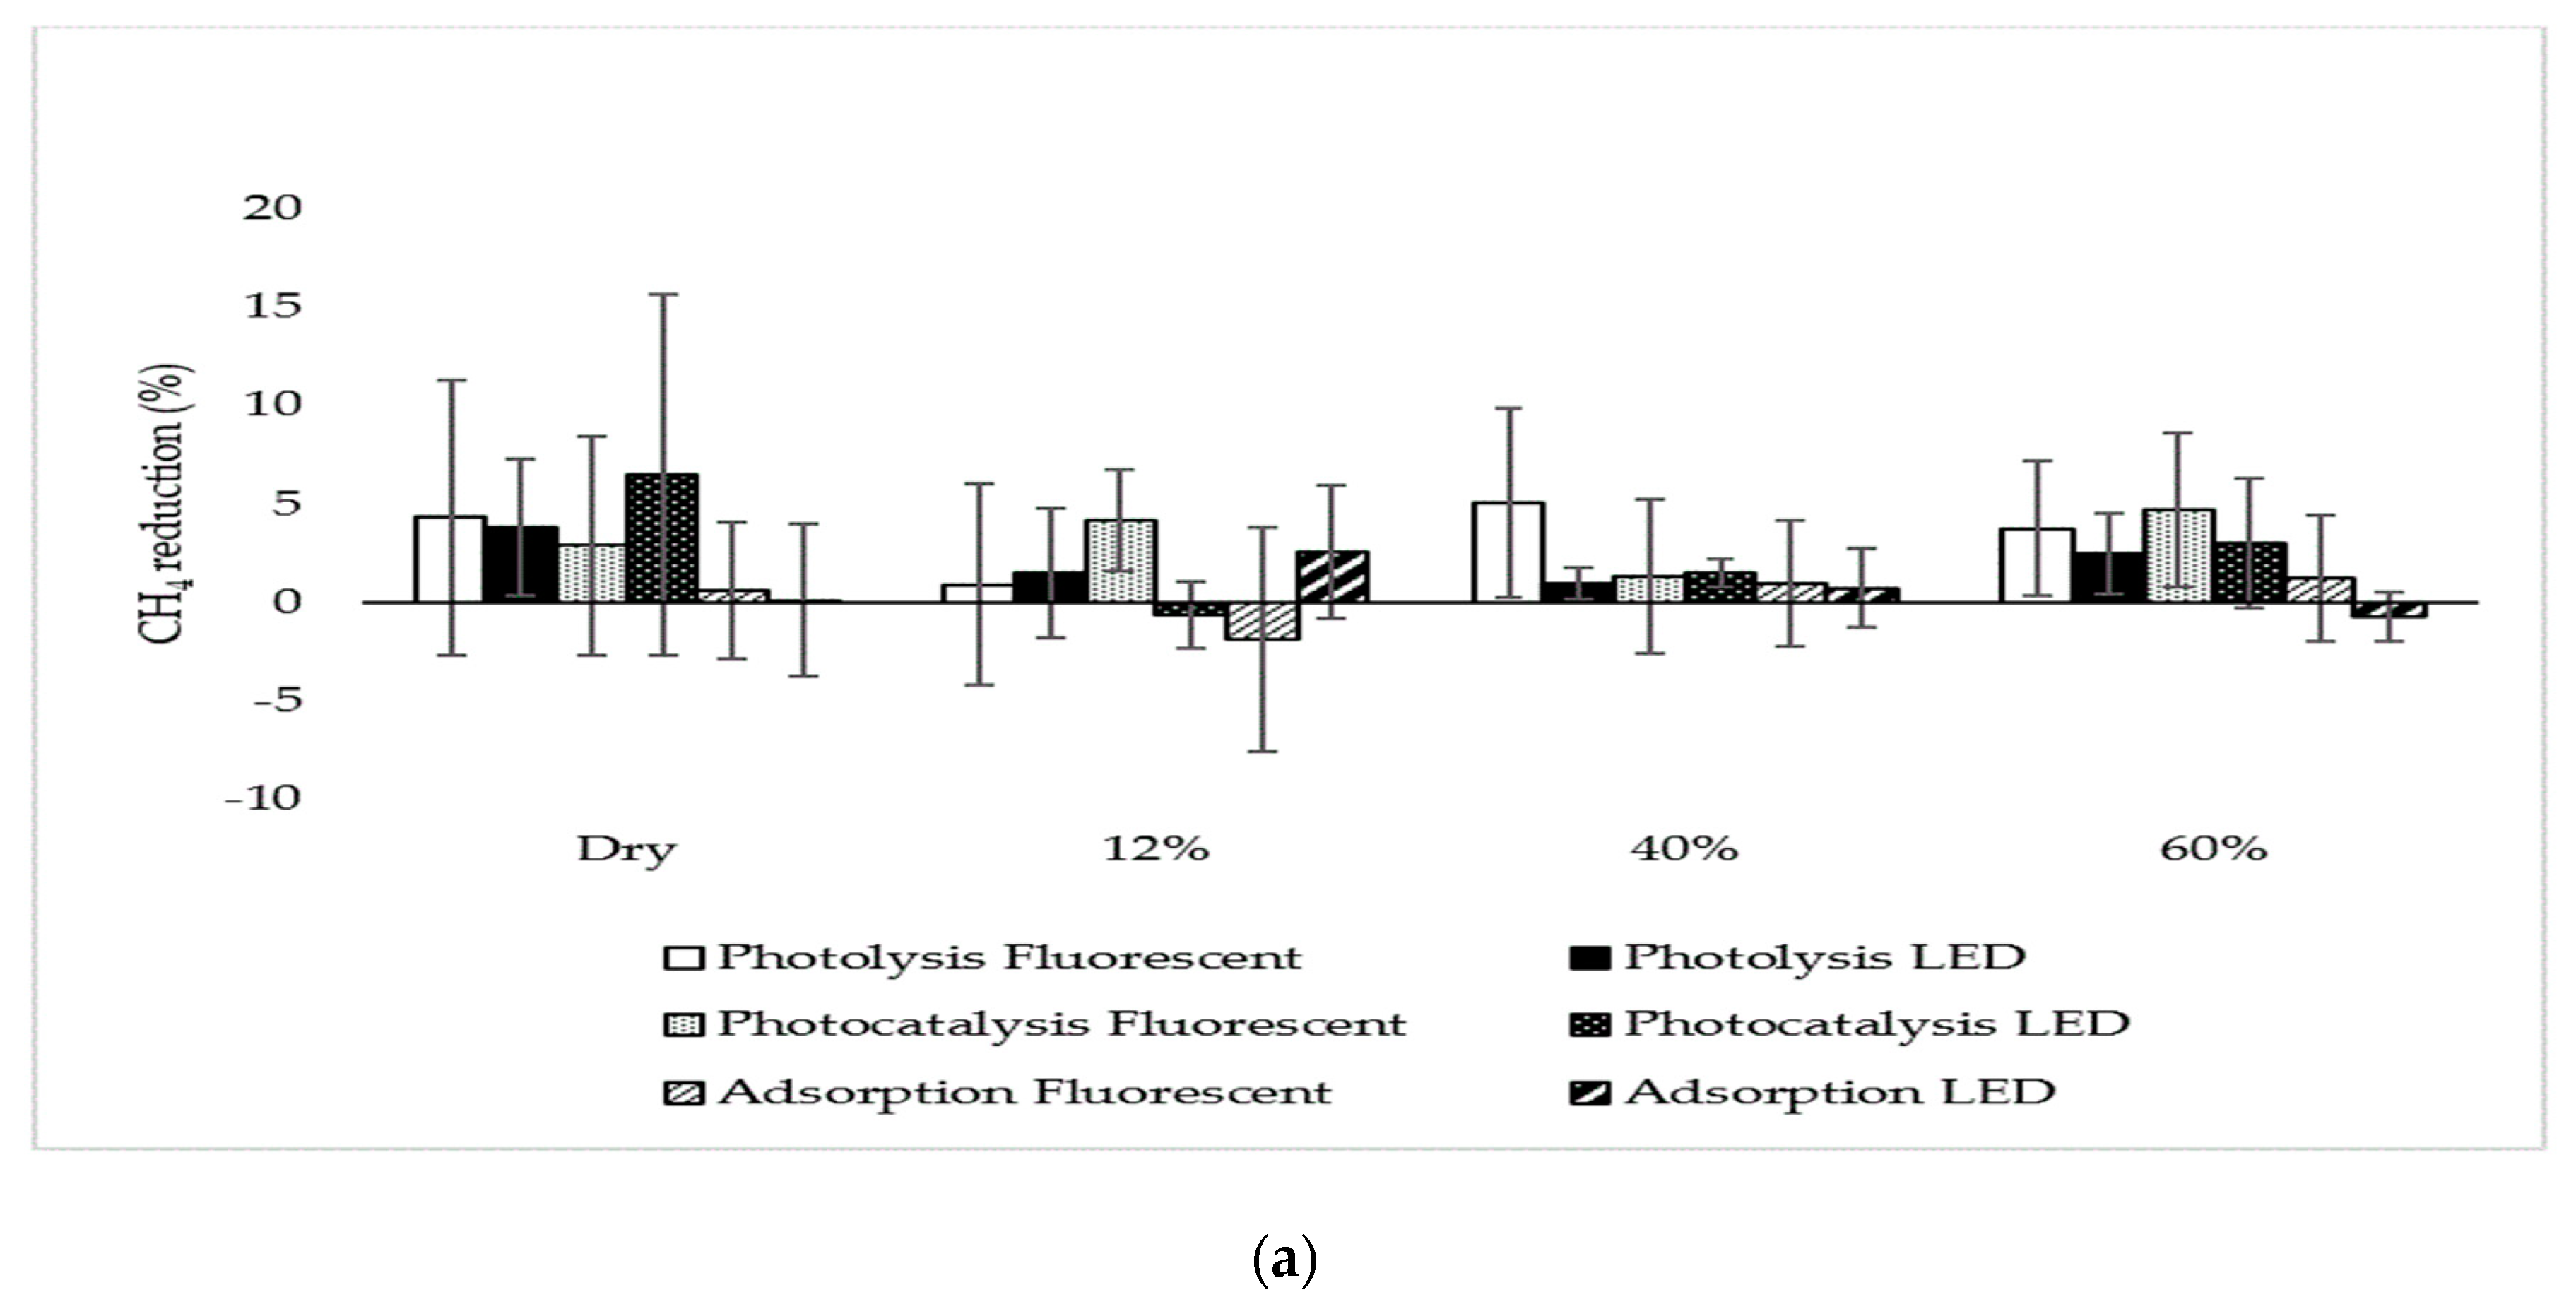
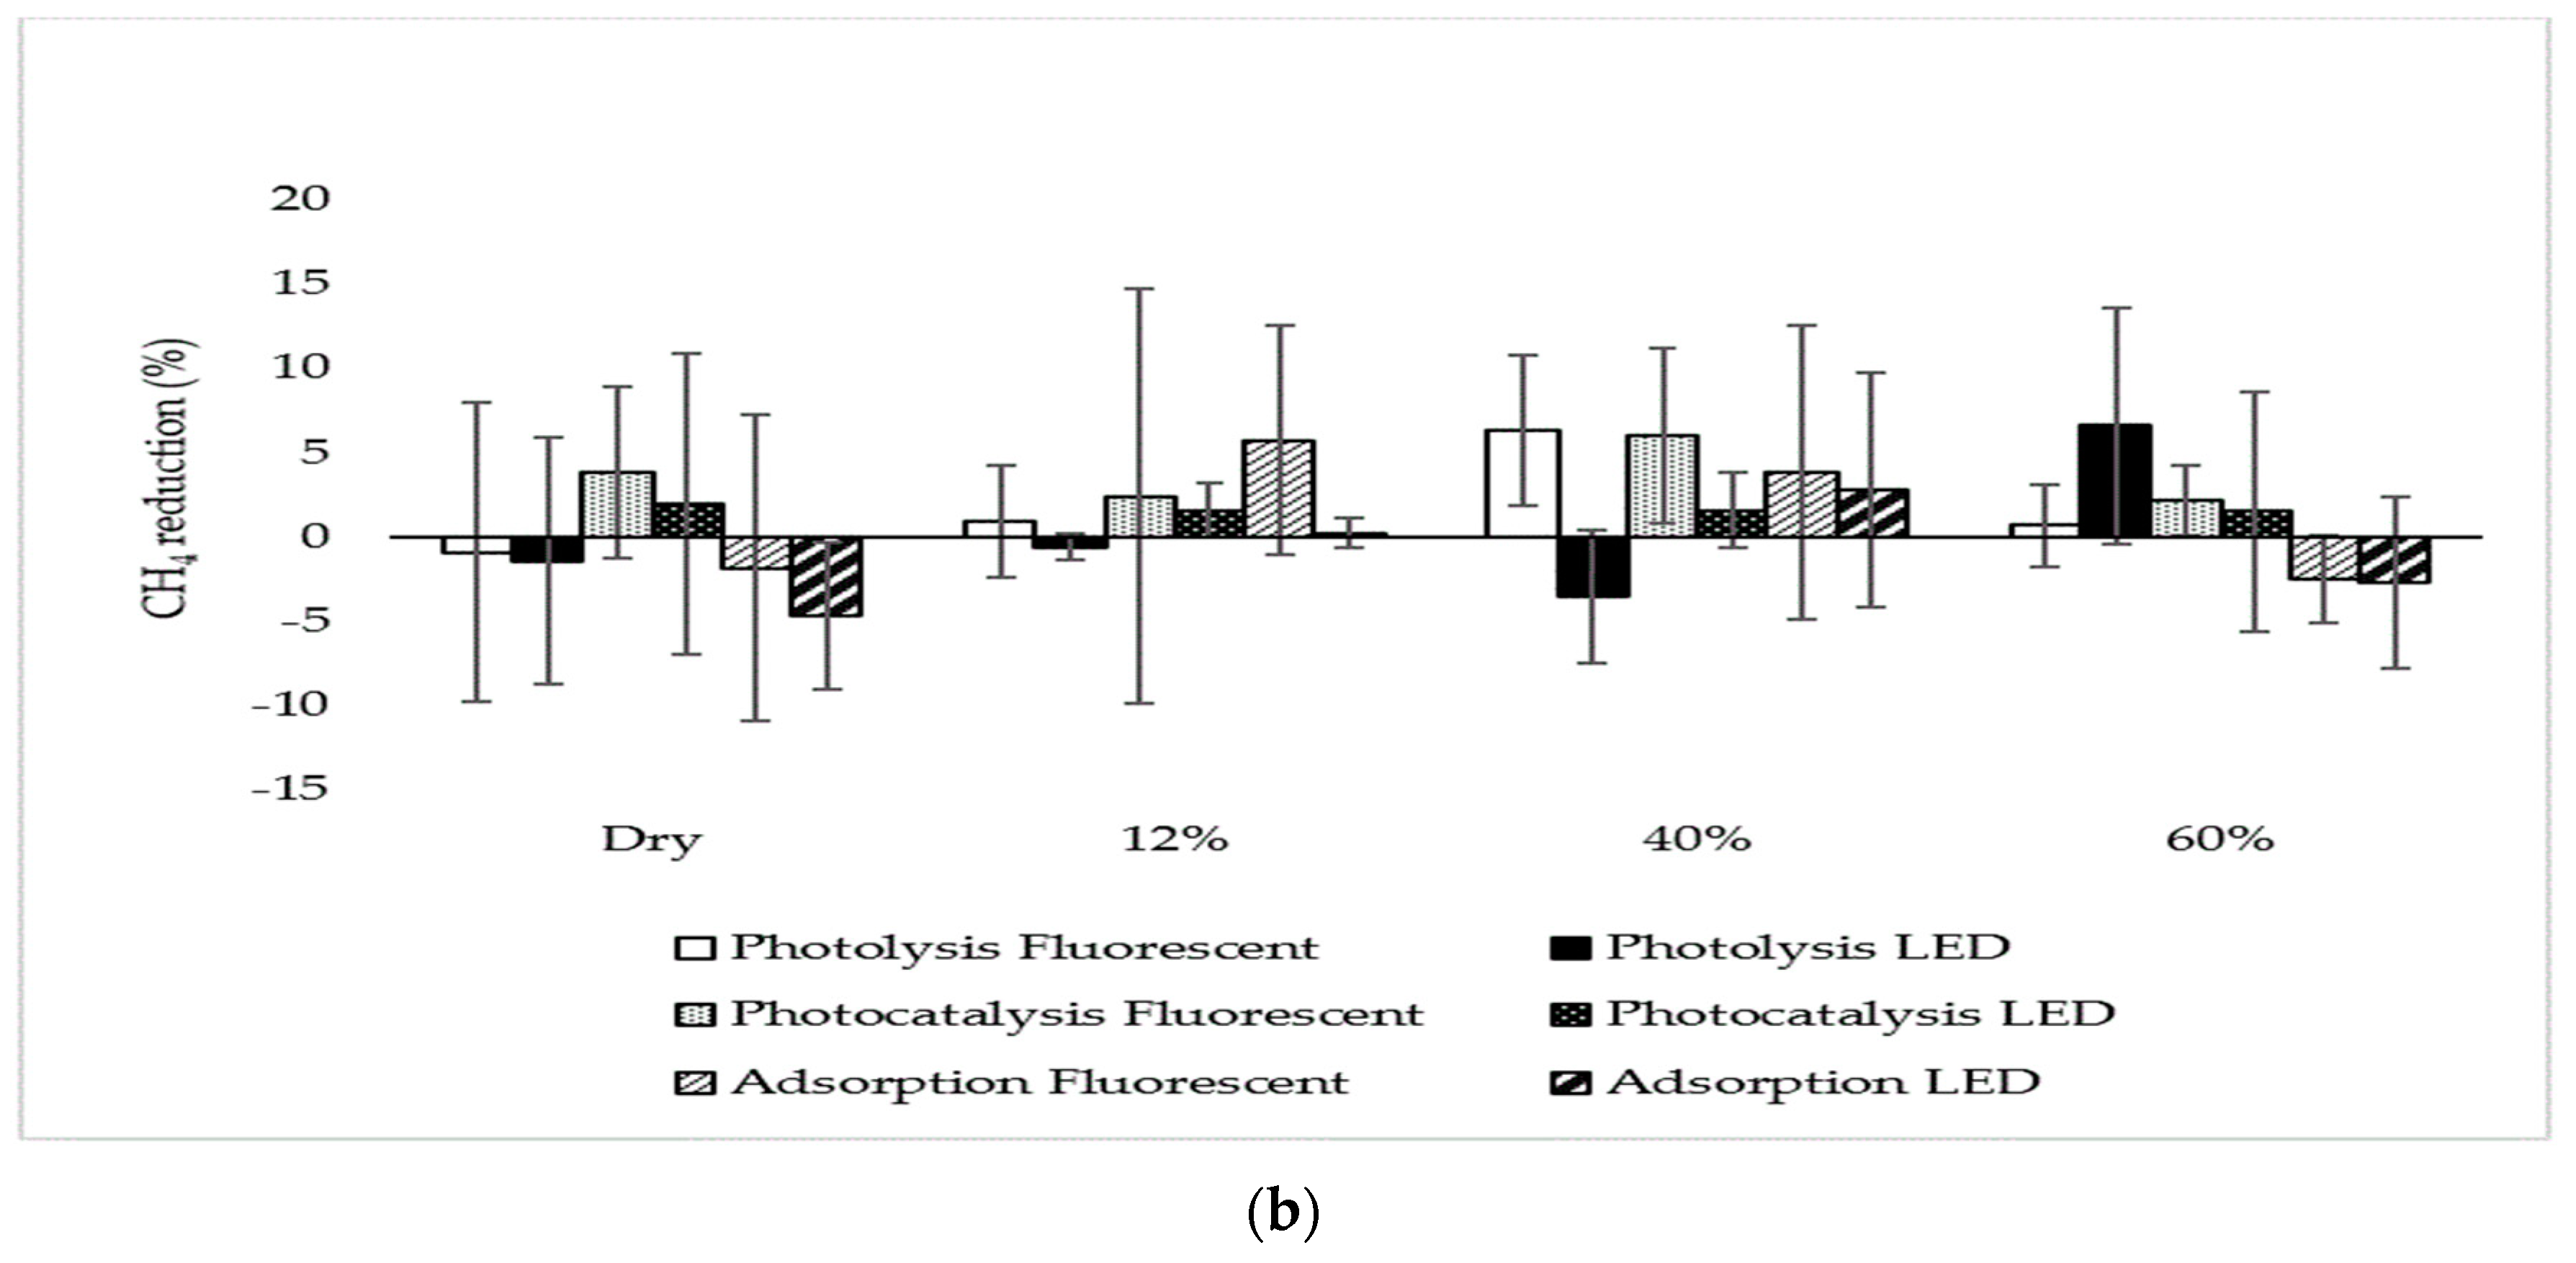
3.3.1. Methane
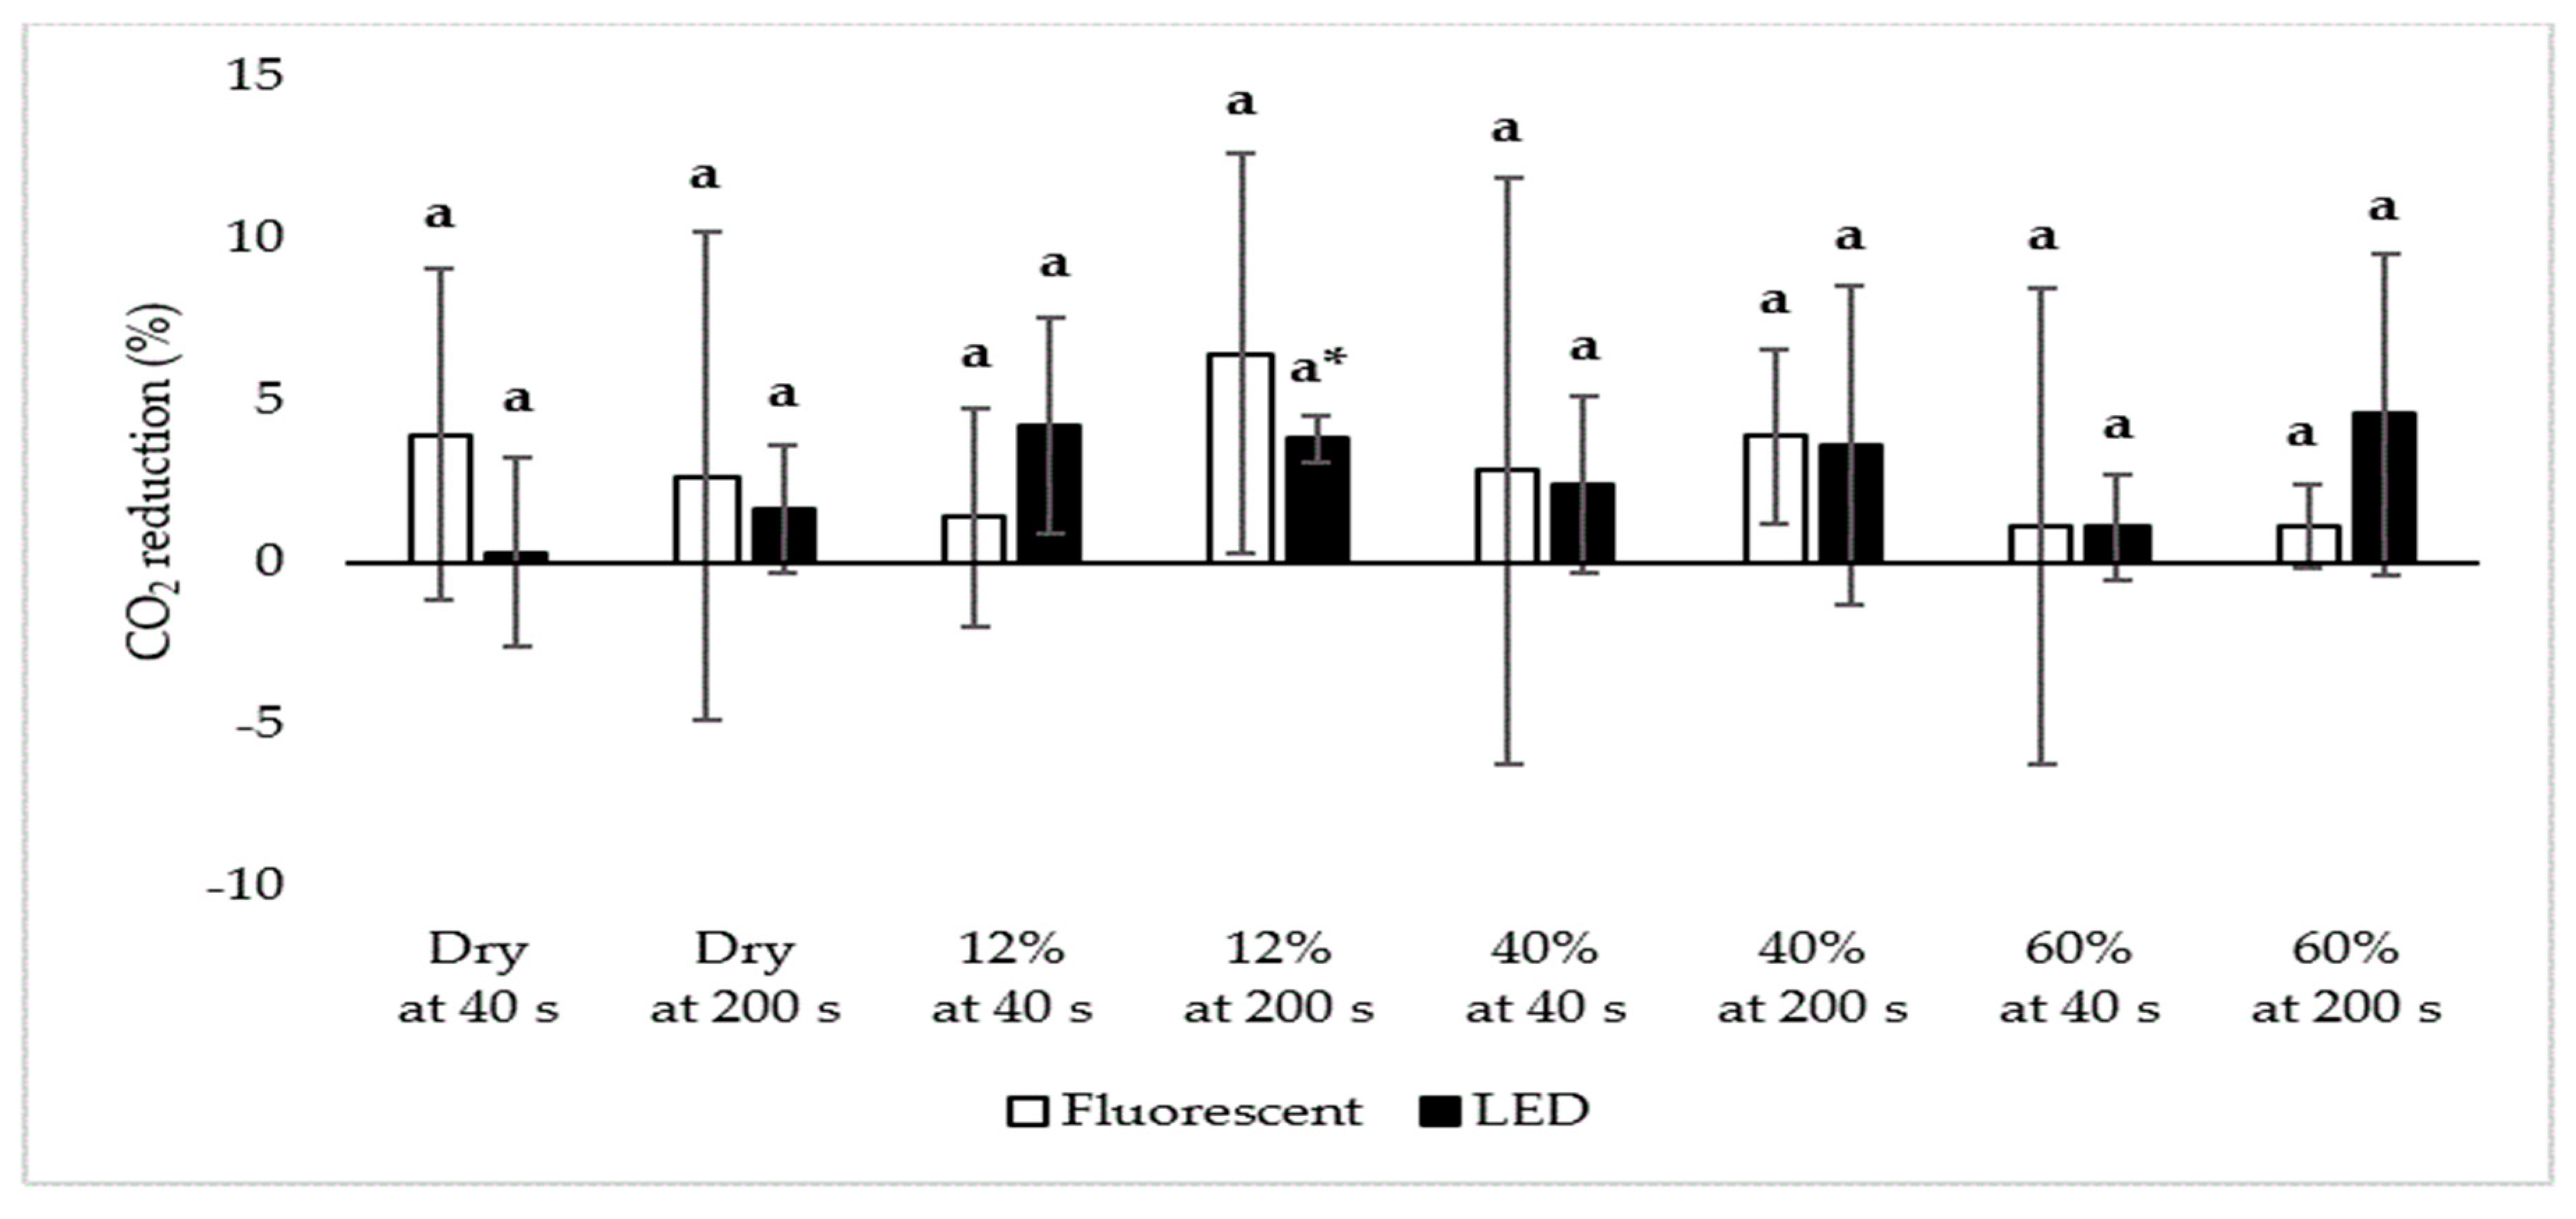
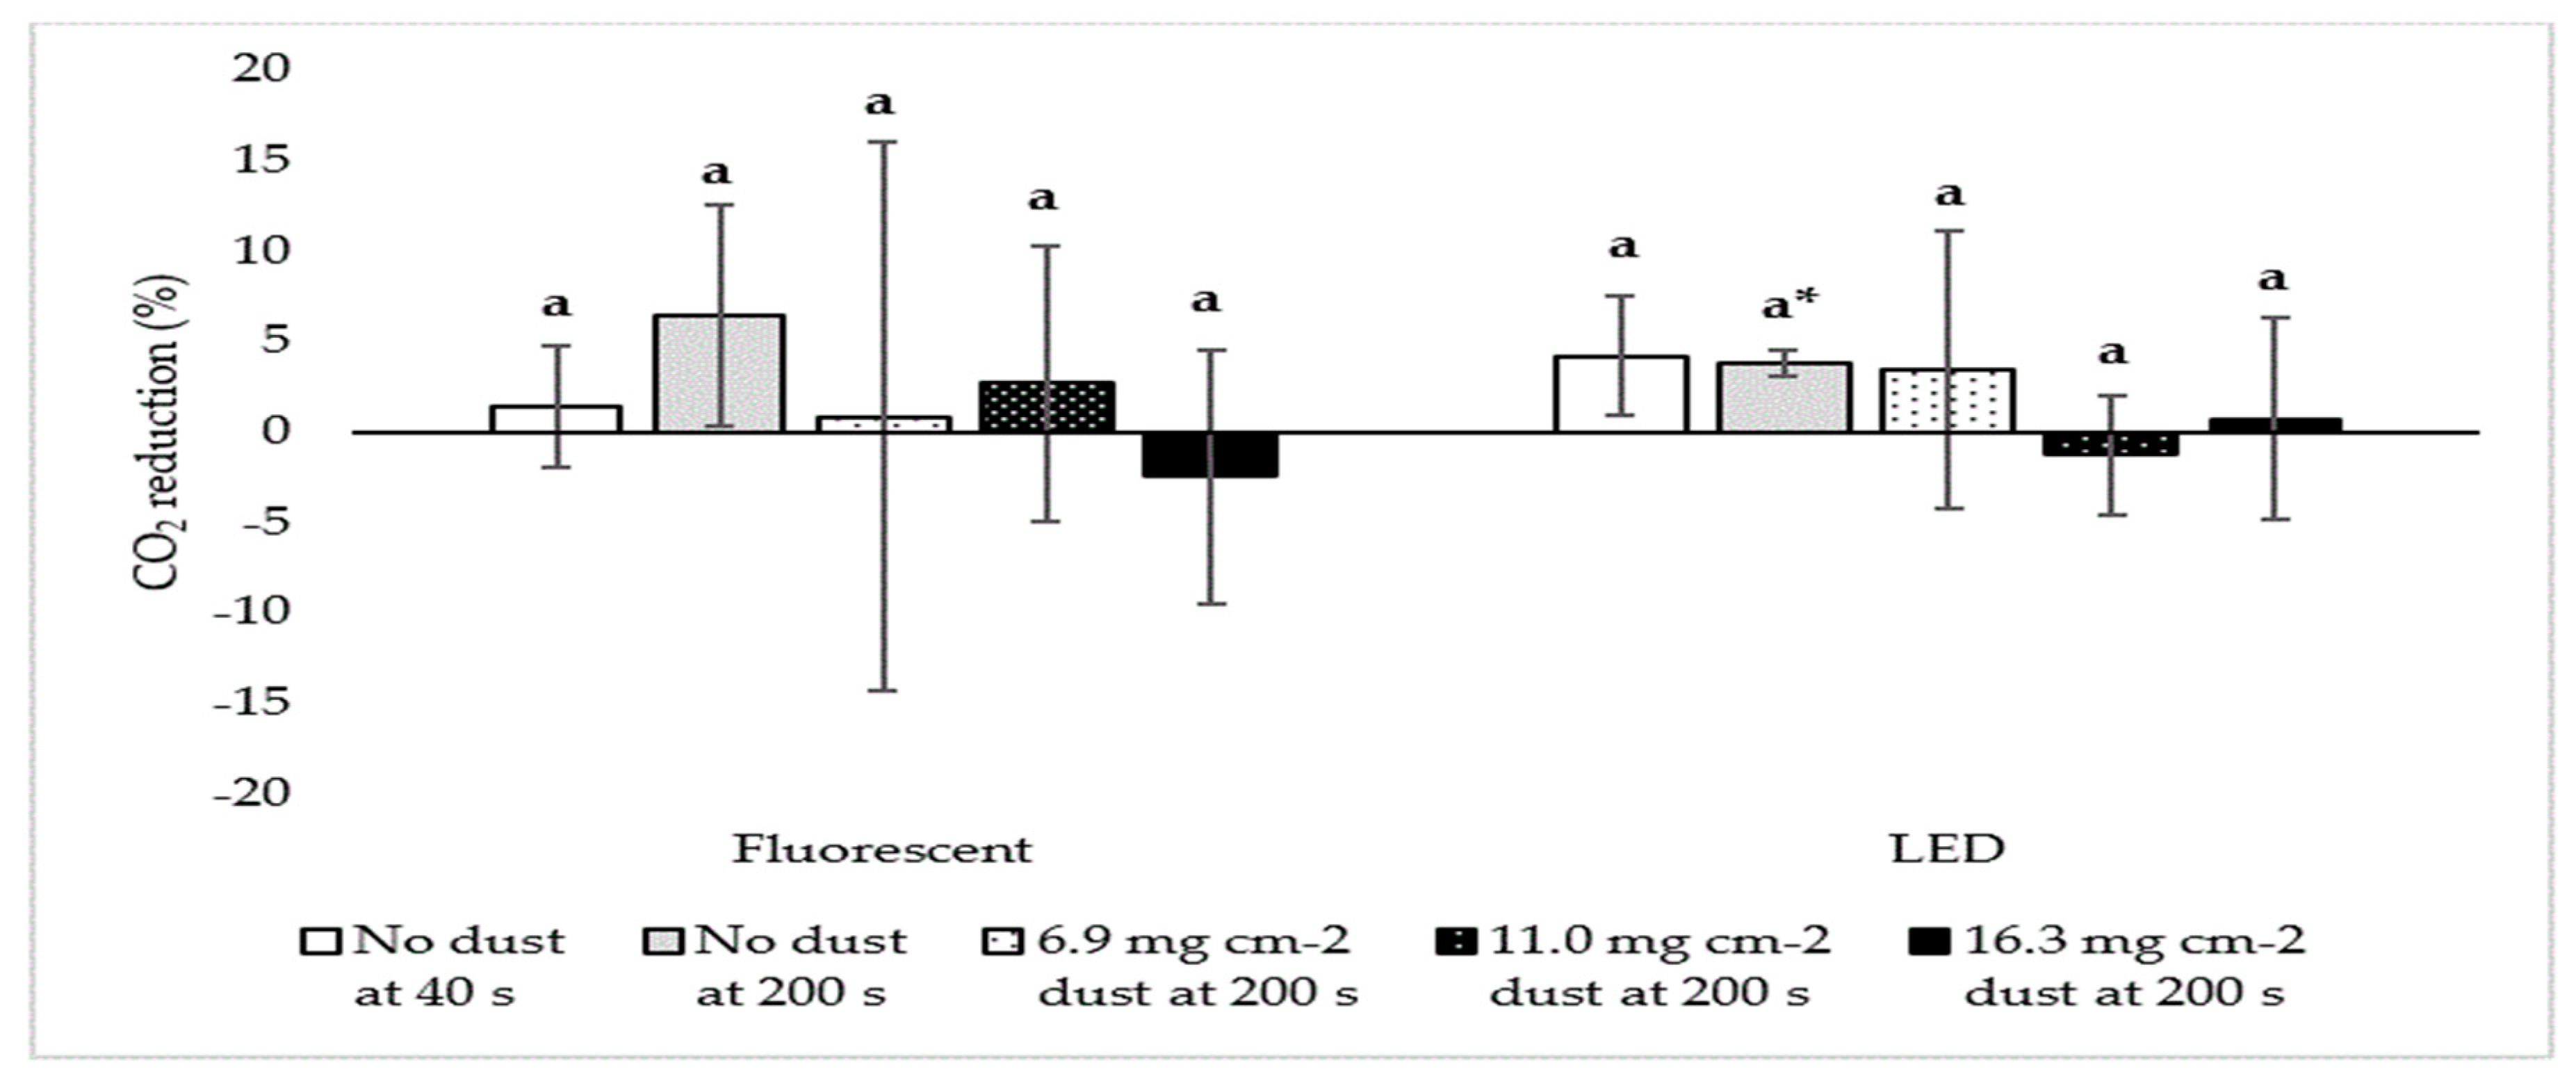
3.3.2. Carbon Dioxide
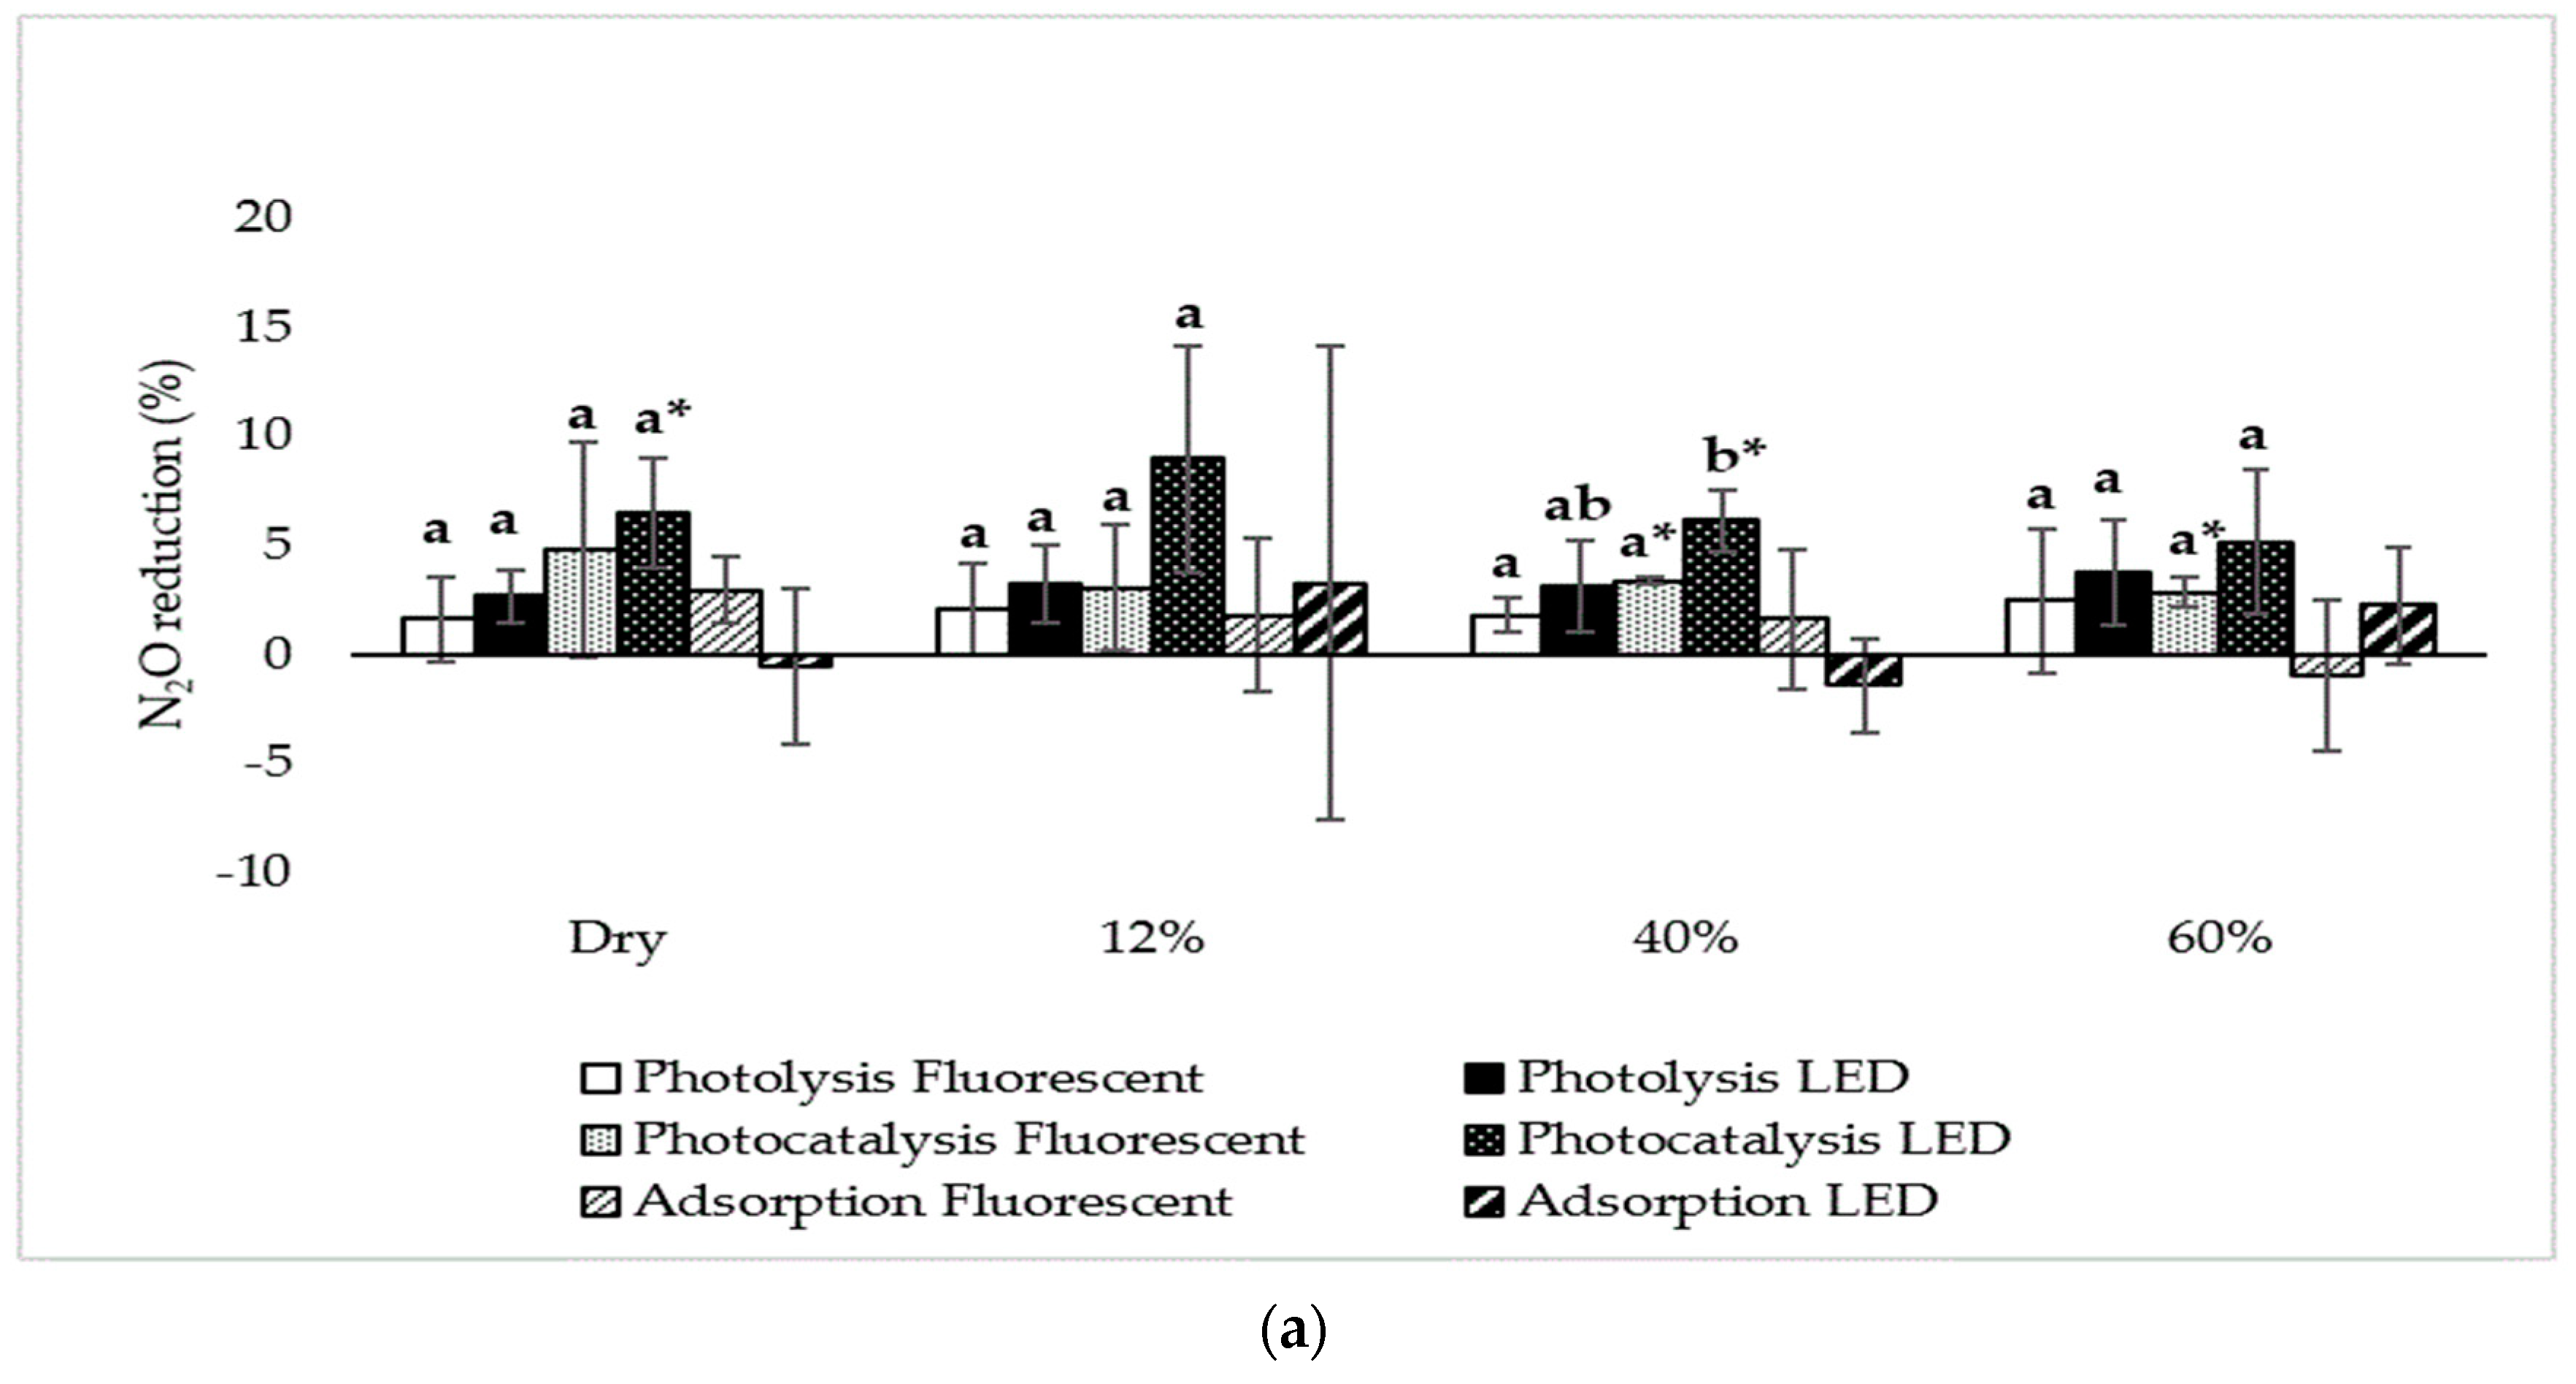
3.3.3. Nitrous Oxide
Comparison of N2O Mitigation when Treating NH3 and H2S Standard Gas
Effect of Photocatalyst, Light Type, Relative Humidity, Dust, and Treatment Time on N2O
3.4. Ozone
3.4.1. Comparison of Mitigation under NH3 and H2S Standard Gas
3.4.2. Effect of Photocatalyst, Light Type, Relative Humidity, Dust, and Treatment Time on O3
4. Discussion
4.1. Ammonia and Hydrogen Sulfide
4.2. Greenhouse Gases and Ozone
5. Conclusions
Author Contributions
Funding
Acknowledgments
Conflicts of Interest
Appendix A

| Relative Humidity | Type of UV lamp | Direct Photolysis (UV only) | Photocatalysis (UV + TiO2) | Adsorption (to TiO2) |
|---|---|---|---|---|
| Dry | Fluorescent | 0.0 ± 0.0 | 2.6 ± 0.8 (0.03) | 1.2 ± 2.0 |
| LED | 1.2 ± 2.0 | 3.8 ± 1.3 (0.04) | 2.7 ± 2.7 | |
| 12% | Fluorescent | −1.2 ± 2.0 | 7.3 ± 0.6 (0.00) | 2.0 ± 1.8 |
| LED | 0.0 ± 0.0 | 10.4 ± 3.4 (0.03) | 4.3 ± 2.1 | |
| 40% | Fluorescent | 0.0 ± 0.0 | 5.0 ± 1.5 (0.03) | 0.0 ± 0.0 |
| LED | 0.0 ± 0.0 | 7.3 ± 1.2 (0.00) | 1.2 ± 2.0 | |
| 60% | Fluorescent | 0.0 ± 0.0 | 3.1 ± 0.4 (0.01) | 1.1 ± 1.9 |
| LED | 0.0 ± 0.0 | 5.1 ± 3.1 (0.08) | 2.1 ± 1.8 | |
| Average | Fluorescent | -0.3 ± 1.0 | 4.5 ± 2.1 | 1.1 ± 1.6 |
| LED | 0.3 ± 1.0 | 6.7 ± 3.3 | 2.6 ± 2.2 |
| Relative Humidity | Type of UV Lamp | Direct Photolysis (UV only) | Photocatalysis (UV + TiO2) | Adsorption (to TiO2) |
|---|---|---|---|---|
| Dry | Fluorescent | 0.0 ± 0.0 | 3.1 ± 0.4 (0.00) | 2.2 ± 1.9 |
| LED | 0.0 ± 0.0 | 5.2 ± 1.6 (0.03) | 3.0 ± 2.8 | |
| 12% | Fluorescent | 0.0 ± 0.0 | 9.4 ± 1.3 (0.00) | 4.0 ± 3.5 |
| LED | 0.0 ± 0.0 | 18.7 ± 2.0 (0.00) | 1.8 ± 1.6 | |
| 40% | Fluorescent | 0.0 ± 0.0 | 5.3 ± 2.4 (0.05) | 1.1 ± 1.9 |
| LED | 0.0 ± 0.0 | 13.5 ± 2.6 (0.01) | 2.0 ± 1.8 | |
| 60% | Fluorescent | 0.0 ± 0.0 | 3.2 ± 0.4 (0.00) | 0.0 ± 0.0 |
| LED | 1.9 ± 3.2 | 6.2 ± 0.6 (0.00) | 1.9 ± 3.2 | |
| Average | Fluorescent | 0.0 ± 0.0 | 5.3 ± 2.9 | 1.8 ± 2.4 |
| LED | 0.5 ± 1.6 | 10.9 ± 6.0 | 2.2 ± 2.1 |
| Relative Humidity | Dry | 12% | |||
|---|---|---|---|---|---|
| Treatment Time | 40 s | 200 s | 40 s | 200 s | |
| No dust | Fluorescent | 2.6 ± 0.8 (0.03) | 3.1 ± 0.4 (0.00) | 7.3 ± 0.6 (0.00) | 9.4 ± 1.3 (0.00) |
| LED | 3.8 ± 1.3 (0.04) | 5.2 ± 1.6 (0.03) | 10.4 ± 3.4 (0.03) | 18.7 ± 2.0 (0.00) | |
| Dust (6.9 mg·cm−2) | Fluorescent | 3.1 ± 0.5 (0.00) | 4.2 ± 2.2 (0.07) | 6.2 ± 0.8 (0.00) | 9.2 ± 2.0 (0.01) |
| LED | 4.0 ± 1.0 (0.02) | 5.0 ± 1.8 (0.03) | 11.1 ± 1.9 (0.01) | 16.2 ± 3.2 (0.01) | |
| Dust (11.0 mg·cm−2) | Fluorescent | 1.1 ± 1.9 (0.42) | 3.3 ± 5.8 (0.43) | 5.1 ± 1.7 (0.03) | 7.2 ± 0.8 (0.00) |
| LED | 4.2 ± 2.0 (0.07) | 3.1 ± 0.4 (0.00) | 8.1 ± 1.5 (0.01) | 9.2 ± 0.9 (0.00) | |
| Dust (16.3 mg·cm−2) | Fluorescent | 0.9 ± 1.5 (0.42) | 2.0 ± 1.7 (0.19) | 0.9 ± 1.6 (0.42) | 4.0 ± 3.5 (0.18) |
| LED | 2.0 ± 1.7 (0.17) | 2.8 ± 2.6 (0.20) | 5.1 ± 1.7 (0.03) | 6.7 ± 3.4 (0.08) | |
| Relative Humidity | 40% | 60% | |||
|---|---|---|---|---|---|
| Treatment Time | 40 s | 200 s | 40 s | 200 s | |
| No dust | Fluorescent | 5.0 ± 1.5 (0.03) | 5.3 ± 2.4 (0.05) | 3.1 ± 0.4 (0.01) | 3.2 ± 0.4 (0.00) |
| LED | 7.3 ± 1.2 (0.00) | 13.5 ± 2.6 (0.01) | 5.1 ± 3.1 (0.08) | 6.2 ± 0.6 (0.00) | |
| Dust (6.9 mg·cm−2) | Fluorescent | 3.1 ± 3.4 (0.25) | 4.3 ± 2.1 (0.08) | 2.0 ± 1.7 (0.18) | 2.9 ± 2.7 (0.20) |
| LED | 8.4 ± 4.3 (0.07) | 10.5 ± 2.7 (0.02) | 5.1 ± 1.7 (0.03) | 6.8 ± 3.6 (0.08) | |
| Dust (11.0 mg·cm−2) | Fluorescent | 2.0 ± 1.8 (0.19) | 2.9 ± 2.7 (0.21) | 3.2 ± 3.2 (0.23) | 1.8 ± 3.1 (0.82) |
| LED | 6.2 ± 3.4 (0.08) | 5.1 ± 1.7 (0.03) | 4.0 ± 1.1 (0.02) | 6.2 ± 0.6 (0.00) | |
| Dust (16.3 mg·cm−2) | Fluorescent | 0.0 ± 0.0 (1.00) | 1.1 ± 1.9 (0.42) | 0.0 ± 0.0 (1.00) | 0.0 ± 0.0 (1.00) |
| LED | 2.3 ± 4.0 (0.47) | 5.3 ± 2.4 (0.05) | 4.3 ± 4.9 (0.27) | 4.0 ± 1.3 (0.03) | |
| Dust level | Type of UV Lamp | Photocatalysis at A Treatment Time of 40 s (UV + TiO2) | Photocatalysis at A Treatment Time of 200 s (UV + TiO2) |
|---|---|---|---|
| No dust | Fluorescent | 1.4 ± 3.4 (0.57) | 6.5 ± 6.2 (0.23) |
| LED | 4.2 ± 3.3 (0.17) | 3.8 ± 0.7 (0.01) | |
| Dust (6.9 mg·cm−2) | Fluorescent | 1.5 ± 4.1 (0.56) | 0.9 ± 15.2 (0.90) |
| LED | −0.7 ± 6.6 (0.96) | 3.5 ± 7.7 (0.50) | |
| Dust (11.0 mg·cm−2) | Fluorescent | 3.5 ± 7.7 (0.50) | 2.7 ± 7.7 (0.55) |
| LED | 0.5 ± 4.4 (0.91) | −1.3 ± 3.3 (0.54) | |
| Dust (16.3 mg·cm−2) | Fluorescent | 4.2 ± 3.5 (0.17) | −2.5 ± 7.1 (0.59) |
| LED | 0.4 ± 8.8 (0.65) | 0.7 ± 5.6 (0.90) |
| Relative Humidity | Type of UV Lamp | Direct Photolysis (UV only) | Photocatalysis (UV + TiO2) | Adsorption (to TiO2) |
|---|---|---|---|---|
| Dry | Fluorescent | 1.6 ± 2.0 | 4.8 ± 4.9 (0.14) | 3.0 ± 1.5 |
| LED | 2.7 ± 1.2 | 6.5 ± 2.5 (0.02) | −0.6 ± 3.5 | |
| 12% | Fluorescent | 2.1 ± 2.1 | 3.1 ± 2.9 (0.06) | 1.8 ± 3.5 |
| LED | 3.3 ± 1.8 | 9.0 ± 5.2 (0.05) | 3.2 ± 10.9 | |
| 40% | Fluorescent | 1.8 ± 0.8 | 3.4 ± 0.2 (0.00) | 1.6 ± 3.2 |
| LED | 3.1 ± 2.1 | 6.8 ± 1.7 (0.01) | −1.4 ± 2.1 | |
| 60% | Fluorescent | 2.5 ± 3.3 | 2.8 ± 0.7 (0.03) | −1.0 ± 3.5 |
| LED | 3.7 ± 2.4 | 5.2 ± 3.3 (0.07) | 2.2 ± 2.7 | |
| Average | Fluorescent | 2.0 ± 1.9 | 3.5 ± 2.7 | 1.8 ± 2.9 |
| LED | 3.2 ± 1.7 | 6.7 ± 3.4 | 0.9 ± 5.5 |
| Relative Humidity | Type of UV Lamp | Direct Photolysis (UV only) | Photocatalysis (UV + TiO2) | Adsorption (to TiO2) |
|---|---|---|---|---|
| Dry | Fluorescent | 1.3 ± 1.5 | 3.7 ± 1.8 (0.03) | 2.5 ± 2.8 |
| LED | 3.3 ± 1.2 (0.04) | 5.1 ± 1.0 (0.00) | 4.4 ± 2.8 | |
| 12% | Fluorescent | 1.8 ± 1.6 | 3.3 ± 2.1 (0.07) | 1.4 ± 1.7 |
| LED | 6.5 ± 1.7 (0.02) | 9.5 ± 3.3 (0.02) | 0.8 ± 5.2 | |
| 40% | Fluorescent | 1.3 ± 1.1 | 3.0 ± 2.3 (0.06) | 0.2 ± 0.4 |
| LED | 4.9 ± 4.4 | 10.6 ± 6.6 (0.06) | 3.1 ± 4.0 | |
| 60% | Fluorescent | 1.0 ± 0.8 | 5.6 ± 3.8 (0.08) | −2.1 ± 3.5 |
| LED | 0.8 ± 0.5 | 5.0 ± 0.9 (0.00) | 2.2 ± 1.4 | |
| Average | Fluorescent | 1.7 ± 1.2 | 3.9 ± 2.5 | 0.5 ± 2.7 |
| LED | 3.9 ± 3.0 | 7.5 ± 4.3 | 2.6 ± 3.4 |
| Relative Humidity | Dry | 12% | 40% | 60% | |
|---|---|---|---|---|---|
| No Dust | Fluorescent | 1.3 ± 1.5 (0.32) | 1.8 ± 1.6 (0.20) | 1.3 ± 1.1 (0.15) | 1.0 ± 0.8 (0.16) |
| LED | 3.3 ± 1.2 (0.04) | 6.5 ± 1.7 (0.02) | 4.9 ± 4.4 (0.15) | 0.8 ± 0.5 (0.12) | |
| Dust (6.9 mg·cm−2) | Fluorescent | 1.0 ± 0.5 (0.08) | 4.1 ± 6.9 (0.41) | 4.4 ± 4.3 (0.23) | 3.5 ± 6.0 (0.41) |
| LED | 1.6 ± 0.4 (0.03) | 6.1 ± 3.0 (0.08) | 5.3 ± 1.7 (0.03) | 5.2 ± 3.3 (0.13) | |
| Dust (11.0 mg·cm−2) | Fluorescent | 1.1 ± 1.8 (0.40) | 4.2 ± 3.0 (0.08) | 5.0 ± 9.6 (0.45) | 3.2 ± 1.1 (0.03) |
| LED | 2.8 ± 1.4 (0.06) | 4.0 ± 1.7 (0.06) | 4.8 ± 2.5 (0.05) | 5.9 ± 5.0 (0.18) | |
| Dust (16.3 mg·cm−2) | Fluorescent | 2.5 ± 2.1 (0.18) | 2.4 ± 2.1 (0.22) | 7.2 ± 6.3 (0.19) | 4.8 ± 3.6 (0.10) |
| LED | 1.4 ± 0.8 (0.10) | 4.2 ± 7.0 (0.40) | 5.0 ± 9.5 (0.45) | 7.1 ± 6.3 (0.19) | |
| Relative Humidity | Dry | 12% | |||
|---|---|---|---|---|---|
| Treatment Time | 40 s | 200 s | 40 s | 200 s | |
| No Dust | Fluorescent | 4.8 ± 4.9 (0.14) | 3.7 ± 1.8 (0.03) | 3.1 ± 2.9 (0.06) | 3.3 ± 2.1 (0.07) |
| LED | 6.5 ± 2.5 (0.02) | 5.1 ± 1.0 (0.00) | 9.0 ± 5.2 (0.05) | 9.5 ± 3.3 (0.02) | |
| Dust (6.9 mg·cm−2) | Fluorescent | 8.5 ± 4.3 (0.09) | 3.1 ± 2.2 (0.14) | 10.5 ± 3.9 (0.06) | 3.2 ± 0.9 (0.03) |
| LED | 4.7 ± 5.9 (0.30) | 4.2 ± 2.0 (0.04) | 5.1 ± 3.4 (0.12) | 11.2 ± 2.1 (0.04) | |
| Dust (11.0 mg·cm−2) | Fluorescent | 4.1 ± 3.1 (0.16) | 5.3 ± 2.2 (0.05) | 4.1 ± 3.7 (0.20) | 1.0 ± 2.3 (0.53) |
| LED | 5.0 ± 1.6 (0.04) | 4.2 ± 3.3 (0.16) | 3.7 ± 3.2 (0.18) | 4.2 ± 3.7 (0.20) | |
| Dust (16.3 mg·cm−2) | Fluorescent | 3.6 ± 5.5 (0.35) | 5.3 ± 3.9 (0.14) | 8.9 ± 6.2 (0.14) | 3.3 ± 6.9 (0.41) |
| LED | 5.7 ± 5.6 (0.23) | 2.8 ± 0.5 (0.00) | 3.4 ± 0.3 (0.01) | 4.7 ± 2.0 (0.04) | |
| Relative Humidity | 40% | 60% | |||
|---|---|---|---|---|---|
| Treatment Time | 40 s | 200 s | 40 s | 200 s | |
| No Dust | Fluorescent | 3.4 ± 0.2 (0.00) | 3.0 ± 2.3 (0.06) | 2.8 ± 0.7 (0.03) | 5.6 ± 3.8 (0.08) |
| LED | 6.8 ± 1.7 (0.01) | 10.6 ± 6.6 (0.06) | 5.2 ± 3.3 (0.07) | 5.0 ± 0.9 (0.00) | |
| Dust (6.9 mg·cm−2) | Fluorescent | 4.6 ± 2.0 (0.07) | 6.2 ± 1.8 (0.04) | 2.4 ± 6.2 (0.54) | 2.1 ± 6.2 (0.67) |
| LED | 5.3 ± 2.1 (0.05) | 7.9 ± 2.3 (0.01) | 4.5 ± 2.3 (0.09) | 7.1 ± 6.4 (0.20) | |
| Dust (11.0 mg·cm−2) | Fluorescent | 11.3 ± 7.2 (0.13) | 1.0 ± 2.3 (0.52) | 3.3 ± 3.1 (0.20) | 5.6 ± 2.4 (0.05) |
| LED | 2.8 ± 3.0 (0.22) | 5.3 ± 3.9 (0.14) | 3.6 ± 5.5 (0.37) | 3.7 ± 6.3 (0.41) | |
| Dust (16.3 mg·cm−2) | Fluorescent | 7.4 ± 6.2 (0.20) | 3.9 ± 5.9 (0.36) | 5.1 ± 3.3 (0.12) | 6.8 ± 6.8 (0.18) |
| LED | 2.4 ± 3.2 (0.32) | 1.0 ± 2.2 (0.52) | 1.4 ± 1.3 (0.19) | 3.8 ± 5.8 (0.36) | |
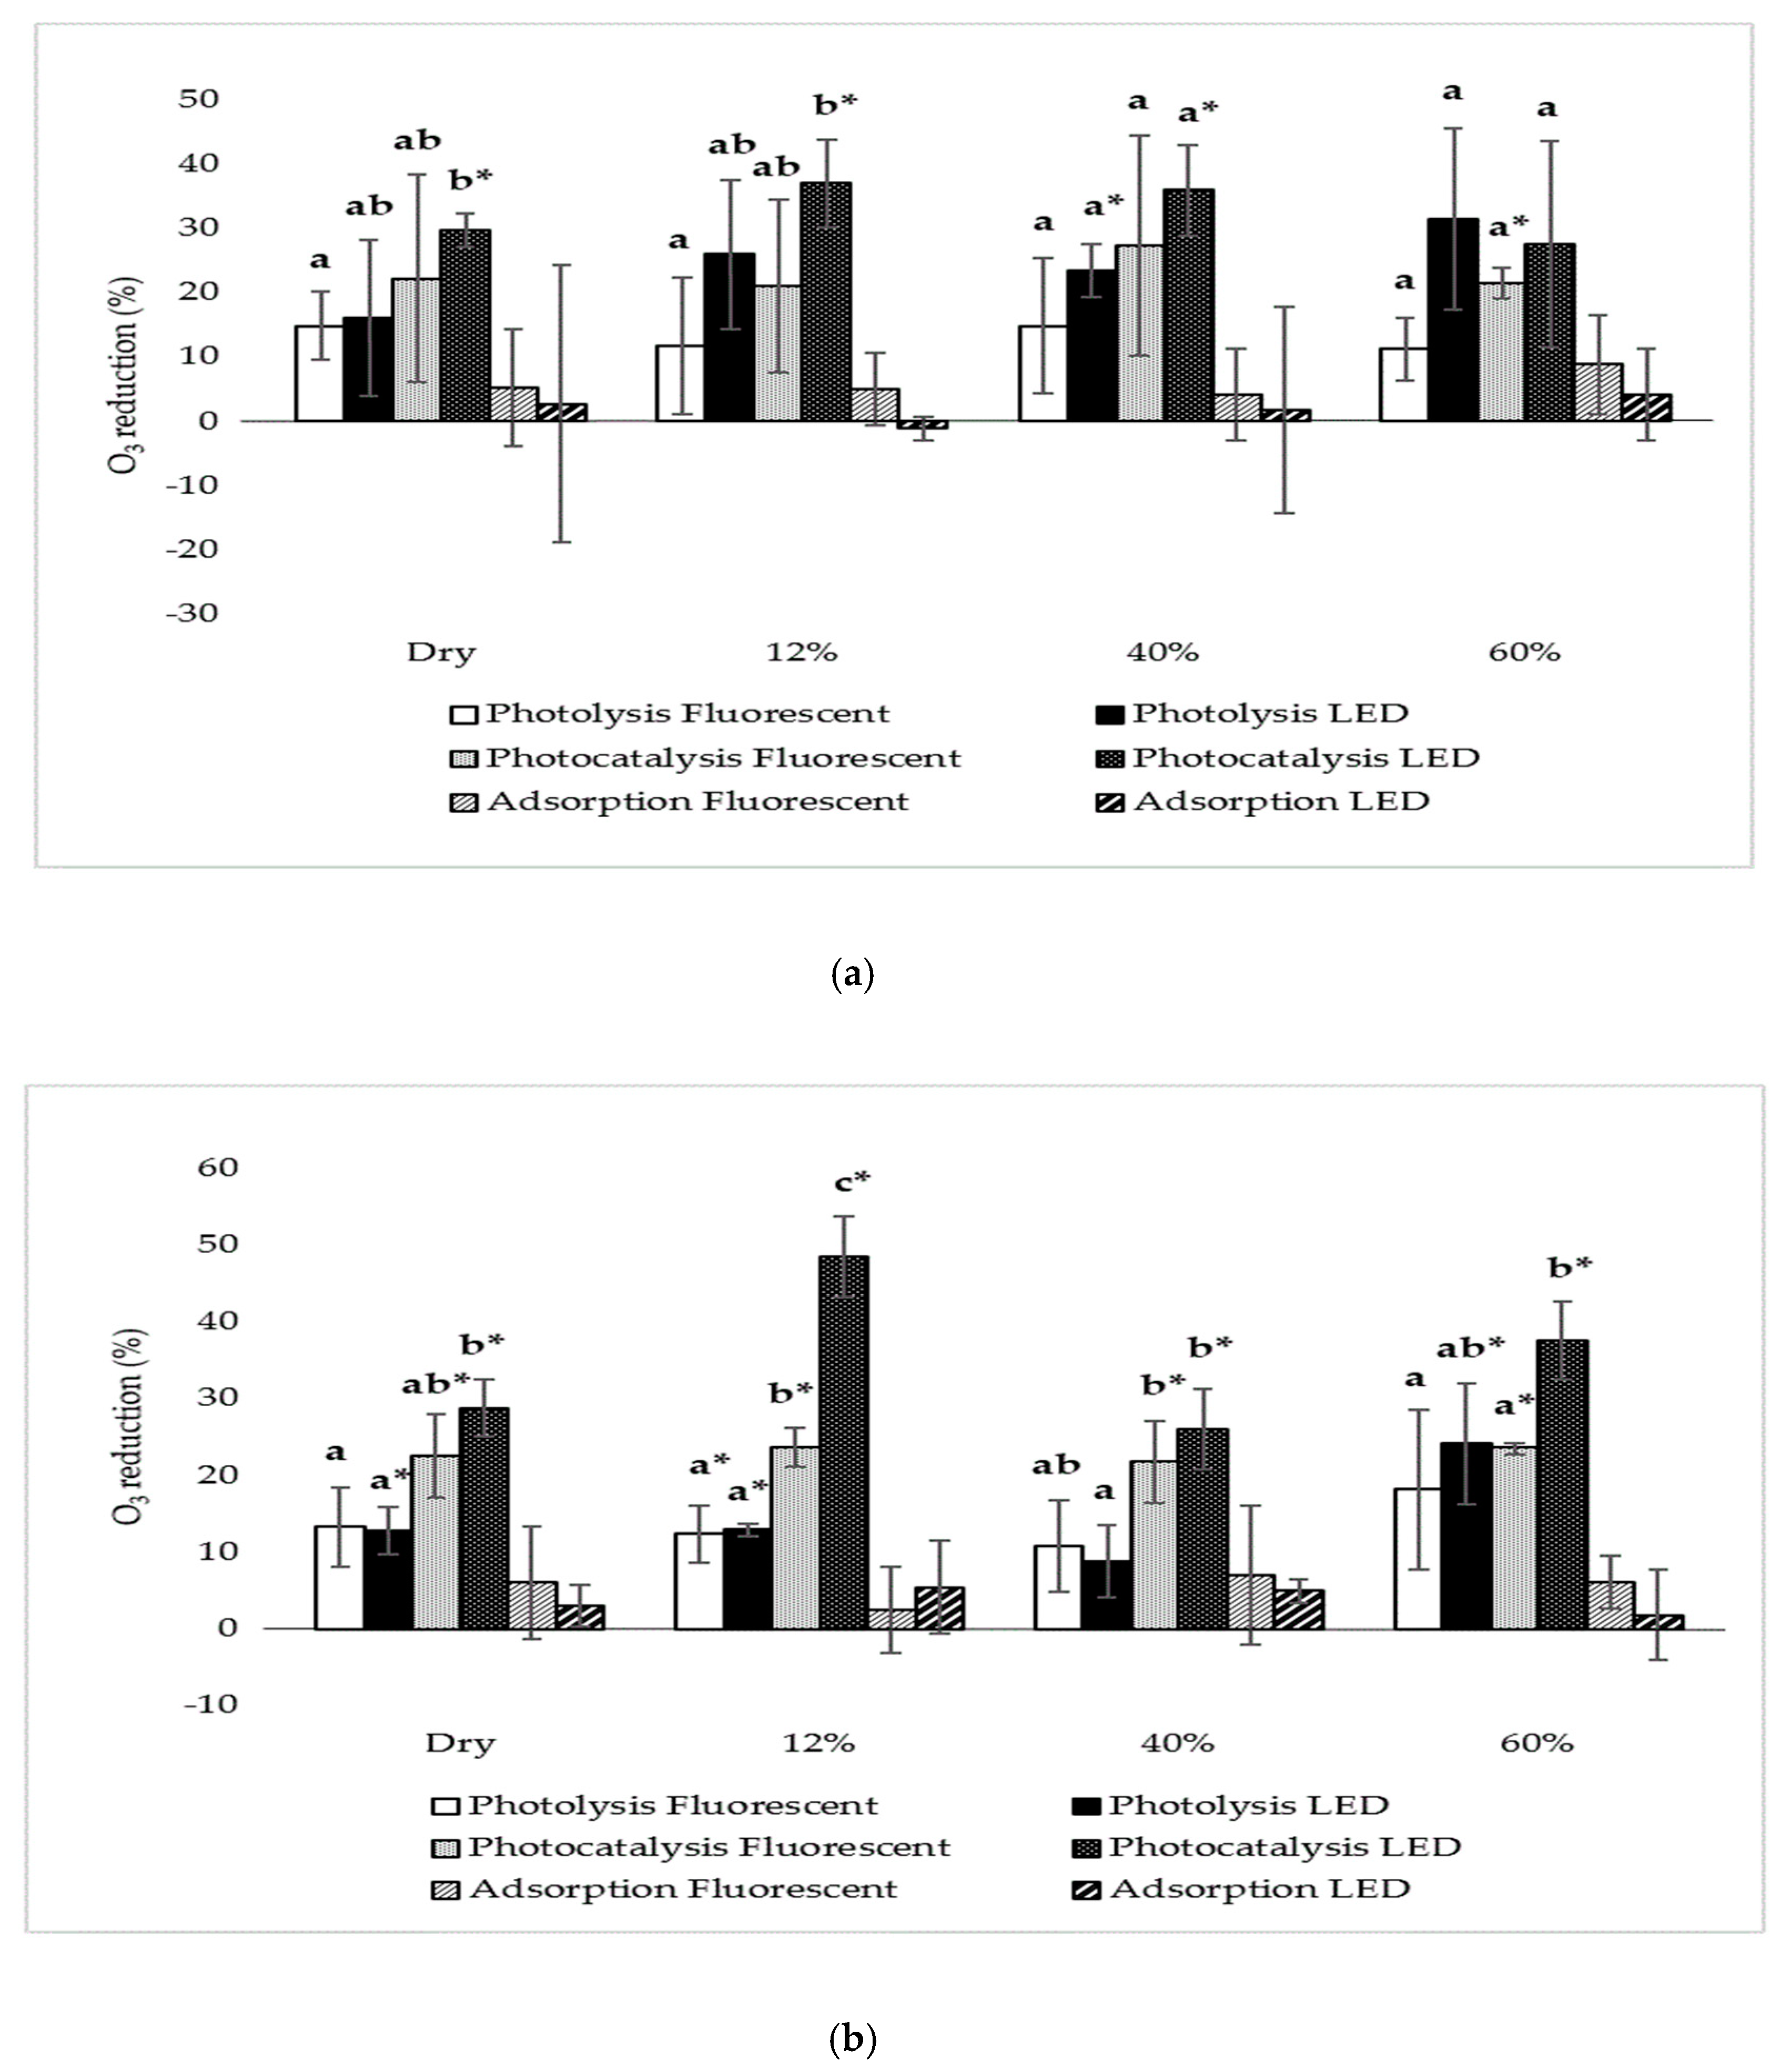
| Relative Humidity | Type of UV Lamp | Direct Photolysis (UV only) | Photocatalysis (UV + TiO2) | Adsorption (to TiO2) |
|---|---|---|---|---|
| Dry | Fluorescent | 14.9 ± 5.4 (0.05) | 22.3 ± 16.2 (0.07) | 5.3 ± 9.1 |
| LED | 16.1 ± 12.1 (0.16) | 29.7 ± 2.6 (0.00) | 2.7 ± 21.6 | |
| 12% | Fluorescent | 11.8 ± 10.7 (0.19) | 21.2 ± 13.5 (0.06) | 5.1 ± 5.6 |
| LED | 26.0 ± 11.6 (0.08) | 37.0 ± 6.9 (0.03) | −1.1 ± 1.9 | |
| 40% | Fluorescent | 14.9 ± 10.6 (0.11) | 27.4 ± 17.1 (0.15) | 4.2 ± 7.2 |
| LED | 23.5 ± 4.2 (0.00) | 36.0 ± 7.1 (0.02) | 1.8 ± 16.1 | |
| 60% | Fluorescent | 11.3 ± 4.9 (0.06) | 21.6 ± 2.4 (0.00) | 8.9 ± 7.7 |
| LED | 31.5 ± 14.1 (0.07) | 27.6 ± 16.0 (0.17) | 4.2 ± 7.2 | |
| Average | Fluorescent | 13.2 ± 7.3 | 23.1 ± 12.5 | 5.9 ± 6.7 |
| LED | 24.3 ± 11.1 | 32.6 ± 9.4 | 1.9 ± 12.1 |
| Relative Humidity | Type of UV Lamp | Direct Photolysis (UV only) | Photocatalysis (UV + TiO2) | Adsorption (to TiO2) |
|---|---|---|---|---|
| Dry | Fluorescent | 13.3 ± 5.2 (0.05) | 22.5 ± 5.4 (0.04) | 6.0 ± 7.4 |
| LED | 12.8 ± 3.1 (0.01) | 28.7 ± 3.7 (0.00) | 3.0 ± 2.6 | |
| 12% | Fluorescent | 12.4 ± 3.8 (0.03) | 23.7 ± 2.6 (0.00) | 2.5 ± 5.6 |
| LED | 12.9 ± 0.8 (0.00) | 48.4 ± 5.3 (0.00) | 5.4 ± 6.1 | |
| 40% | Fluorescent | 10.8 ± 6.1 (0.09) | 21.8 ± 5.3 (0.00) | 7.0 ± 9.1 |
| LED | 8.9 ± 4.7 (0.09) | 26.0 ± 5.2 (0.01) | 5.0 ± 1.6 | |
| 60% | Fluorescent | 18.2 ± 10.4 (0.11) | 23.6 ± 0.7 (0.00) | 6.1 ± 3.5 |
| LED | 24.1 ± 7.9 (0.03) | 37.5 ± 5.1 (0.00) | 1.8 ± 5.9 | |
| Average | Fluorescent | 13.7 ± 6.5 | 22.9 ± 3.7 | 5.4 ± 6.0 |
| LED | 14.7 ± 7.3 | 35.2 ± 10.0 | 3.3 ± 4.1 |
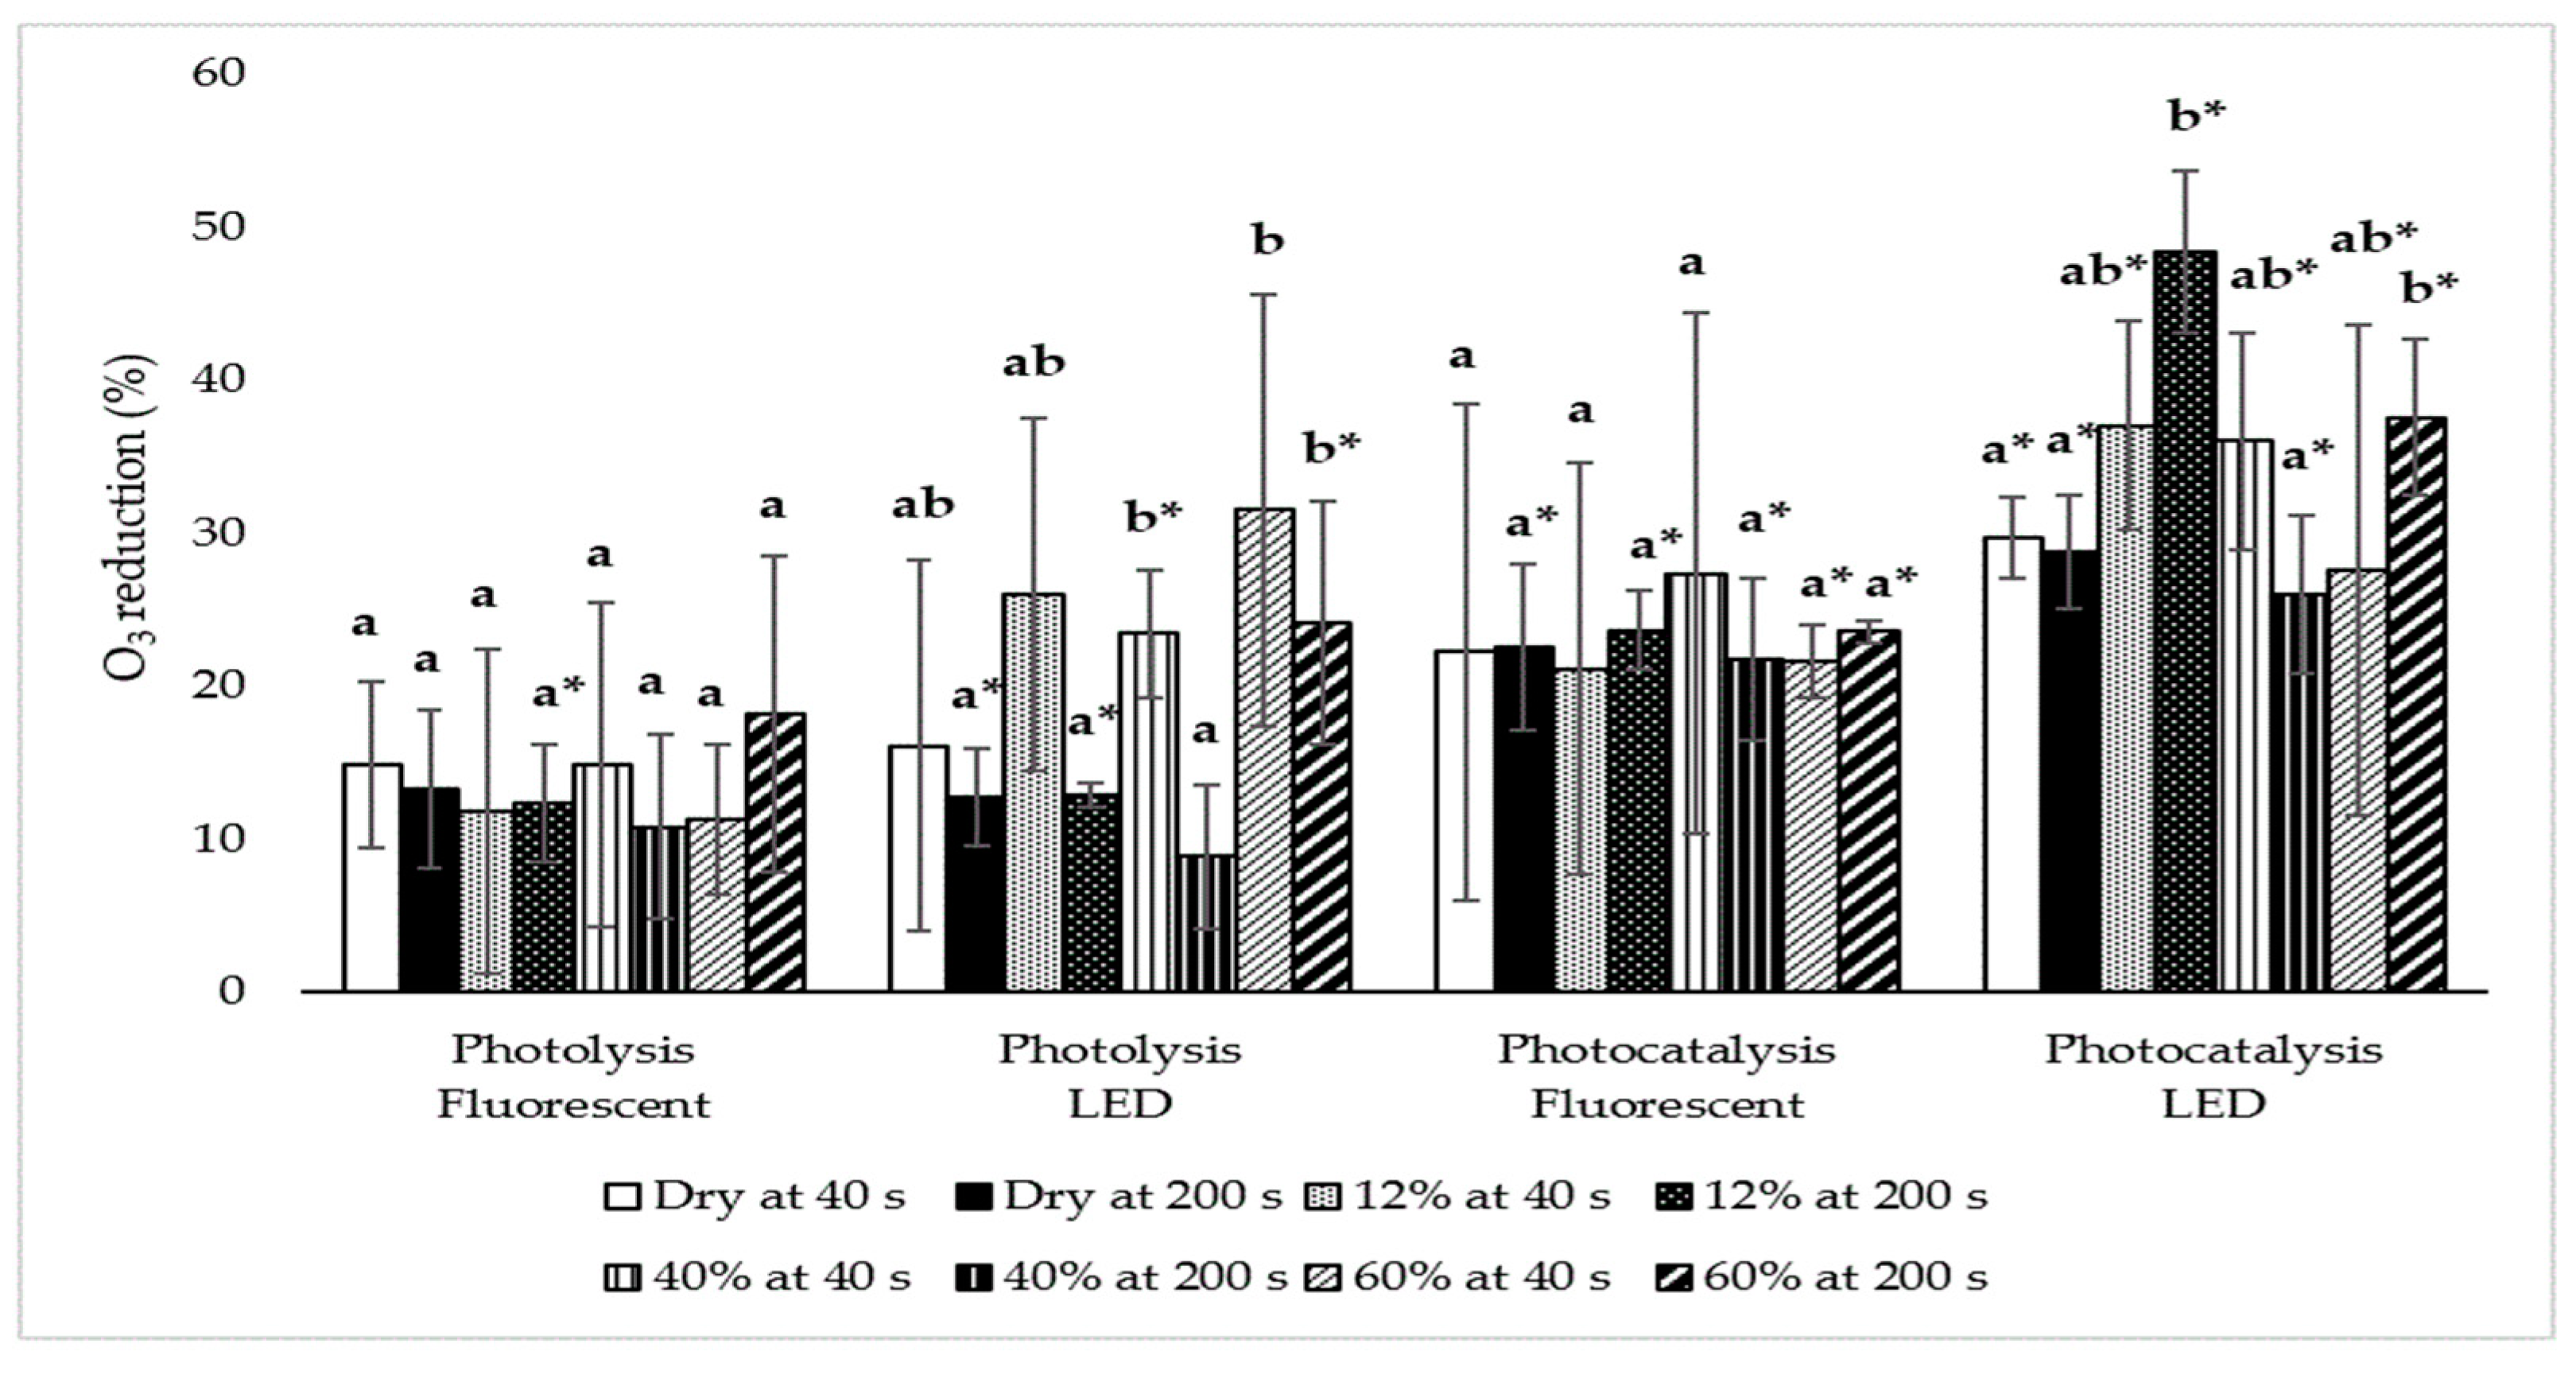
| Relative Humidity | Dry | 12% | |||
|---|---|---|---|---|---|
| Treatment Time | 40 s | 200 s | 40 s | 200 s | |
| No dust | Fluorescent | 14.9 ± 5.4 (0.05) | 13.3 ± 5.2 (0.05) | 11.8 ± 10.7 (0.19) | 12.4 ± 3.8 (0.03) |
| LED | 16.1 ± 12.1(0.16) | 12.8 ± 3.1 (0.01) | 26.0 ± 11.6 (0.08) | 12.9 ± 0.8 (0.00) | |
| Dust (6.9 mg·cm−2) | Fluorescent | 11.4 ± 5.2 (0.05) | 21.0 ± 12.8 (0.10) | 12.1 ± 8.5 (0.15) | 13.1 ± 5.7 (0.06) |
| LED | 14.7 ± 9.5 (0.12) | 19.8 ± 8.9 (0.07) | 38.0 ± 16.9 (0.05) | 15.6 ± 8.5 (0.09) | |
| Dust (11.0 mg·cm−2) | Fluorescent | 14.4 ± 1.4 (0.00) | 19.0 ± 11.6 (0.11) | 16.7 ± 8.5 (0.08) | 18.4 ± 5.9 (0.03) |
| LED | 22.5 ± 12.3(0.09) | 16.0 ± 0.8 (0.00) | 25.5 ± 11.5 (0.06) | 26.3 ± 10.4 (0.05) | |
| Dust (16.3 mg·cm−2) | Fluorescent | 16.1 ± 11.1(0.12) | 21.2 ± 10.5 (0.09) | 17.8 ± 8.8 (0.08) | 11.6 ± 6.6 (0.09) |
| LED | 15.6 ± 10.1(0.12) | 29.4 ± 22.0 (0.19) | 21.8 ± 6.6 (0.03) | 25.8 ± 8.4 (0.04) | |
| Relative Humidity | 40% | 60% | |||
|---|---|---|---|---|---|
| Treatment Time | 40 s | 200 s | 40 s | 200 s | |
| No Dust | Fluorescent | 14.9 ± 10.6 (0.11) | 10.8 ± 6.1 (0.09) | 11.3 ± 4.9 (0.06) | 18.2 ± 10.4 (0.11) |
| LED | 23.5 ± 4.2 (0.00) | 8.9 ± 4.7 (0.09) | 31.5 ± 14.1 (0.07) | 24.1 ± 7.9 (0.03) | |
| Dust (6.9 mg·cm−2) | Fluorescent | 20.6 ± 9.7 (0.06) | 13.8 ± 3.3 (0.02) | 29.0 ± 4.7 (0.02) | 13.6 ± 7.1 (0.09) |
| LED | 19.1 ± 3.7 (0.00) | 15.4 ± 2.2 (0.00) | 18.3 ± 2.5 (0.00) | 17.9 ± 9.5 (0.09) | |
| Dust (11.0 mg·cm−2) | Fluorescent | 10.7 ± 10.0 (0.20) | 14.2 ± 8.7 (0.11) | 18.0 ± 9.1 (0.08) | 20.6 ± 11.0 (0.10) |
| LED | 18.1 ± 6.4 (0.06) | 21.9 ± 3.2 (0.00) | 14.9 ± 8.0 (0.09) | 22.1 ± 6.6 (0.03) | |
| Dust (16.3 mg·cm−2) | Fluorescent | 16.2 ± 6.0 (0.03) | 20.8 ± 19.6 (0.21) | 17.5 ± 18.9 (0.27) | 21.4 ± 13.3 (0.14) |
| LED | 18.1 ± 7.4 (0.05) | 13.5 ± 4.74 (0.03) | 18.9 ± 5.7 (0.03) | 18.0 ± 3.4 (0.02) | |
| Relative Humidity | Dry | 12% | |||
|---|---|---|---|---|---|
| Treatment Time | 40 s | 200 s | 40 s | 200 s | |
| No dust | Fluorescent | 22.3 ± 16.2 (0.07) | 22.5 ± 5.4 (0.04) | 21.2 ± 13.5 (0.06) | 23.7 ± 2.6 (0.00) |
| LED | 29.7 ± 2.6 (0.00) | 28.7 ± 3.7 (0.00) | 37.0 ± 6.9 (0.03) | 48.4 ± 5.3 (0.00) | |
| Dust (6.9 mg·cm−2) | Fluorescent | 18.4 ± 3.0 (0.01) | 32.8 ± 5.6 (0.01) | 26.7 ± 9.6 (0.05) | 36.9 ± 2.8 (0.00) |
| LED | 21.7 ± 9.5 (0.06) | 38.1 ± 7.8 (0.02) | 35.3 ± 7.2 (0.01) | 29.0 ± 1.6 (0.00) | |
| Dust (11.0 mg·cm−2) | Fluorescent | 27.6 ± 13.9(0.08) | 33.1 ± 6.3 (0.01) | 33.7 ± 11.1 (0.03) | 34.0 ± 10.0 (0.03) |
| LED | 28.4 ± 8.0 (0.03) | 40.5 ± 3.7 (0.00) | 44.9 ± 1.8 (0.00) | 44.1 ± 11.5 (0.03) | |
| Dust (16.3 mg·cm−2) | Fluorescent | 27.5 ± 8.8 (0.03) | 36.6 ± 7.1 (0.02) | 26.5 ± 2.9 (0.00) | 37.7± 6.6 (0.01) |
| LED | 33.1 ± 11.8(0.04) | 48.9 ± 13.9 (0.03) | 33.9 ± 10.0 (0.03) | 48.9 ± 4.1 (0.00) | |
| Relative Humidity | 40% | 60% | |||
|---|---|---|---|---|---|
| Treatment Time | 40 s | 200 s | 40 s | 200 s | |
| No dust | Fluorescent | 27.4 ± 17.1 (0.15) | 21.8 ± 5.3 (0.00) | 21.6 ± 2.4 (0.00) | 23.6 ± 0.7 (0.00) |
| LED | 36.0 ± 7.06 (0.02) | 26.0 ± 5.2 (0.01) | 27.6 ± 16.0 (0.17) | 37.5 ± 5.1 (0.00) | |
| Dust (6.9 mg·cm−2) | Fluorescent | 20.9 ± 5.3 (0.01) | 23.4 ± 0.8 (0.00) | 35.5 ± 10.4 (0.04) | 22.8 ± 2.8 (0.00) |
| LED | 30.7 ± 12.4 (0.05) | 25.3 ± 1.7 (0.00) | 32.2 ± 2.6 (0.00) | 29.4 ± 9.8 (0.04) | |
| Dust (11.0 mg·cm−2) | Fluorescent | 21.7 ± 10.9 (0.08) | 25.2 ± 8.1 (0.04) | 31.1 ± 10.2 (0.03) | 34.3 ± 11.0 (0.04) |
| LED | 38.0 ± 12.5 (0.05) | 31.5 ± 14.9 (0.06) | 21.7 ± 4.7 (0.02) | 32.1 ± 2.5 (0.00) | |
| Dust (16.3 mg·cm−2) | Fluorescent | 22.6 ± 5.6 (0.01) | 30.0 ± 9.9 (0.03) | 34.4 ± 10.0 (0.02) | 34.5 ± 9.6 (0.02) |
| LED | 36.5 ± 6.6 (0.01) | 38.9 ± 10.0 (0.01) | 42.8 ± 10.2 (0.01) | 34.9 ± 4.3 (0.00) | |
References
- Maurer, D.L.; Koziel, J.A. On-farm pilot-scale testing of black ultraviolet light and photocatalytic coating for mitigation of odor, odorous VOCs, and greenhouse gases. Chemosphere 2019, 221, 778–784. [Google Scholar] [CrossRef] [PubMed]
- Buijsman, E.; Erisman, J.-W. Wet deposition of ammonium in Europe. J. Atmos. Chem. 1988, 6, 265–280. [Google Scholar] [CrossRef]
- Schiffman, S.S. Livestock odors: Implications for human health and well-being. J. Anim. Sci. 1998, 76, 1343–1355. [Google Scholar] [CrossRef]
- Maurer, D.L.; Koziel, J.A.; Harmon, J.D.; Hoff, S.J.; Rieck-Hinz, A.M.; Andersen, D.S. Summary of performance data for technologies to control gaseous, odor, and particulate emissions from livestock operations: Air management practices assessment tool (AMPAT). Data Brief 2016, 7, 1413–1429. [Google Scholar] [CrossRef]
- Van der Heyden, C.; Demeyer, P.; Volcke, E.I. Mitigating emissions from pig and poultry housing facilities through air scrubbers and biofilters: State-of-the-art and perspectives. Biosyst. Eng. 2015, 134, 74–93. [Google Scholar] [CrossRef]
- Maurer, D.; Koziel, J.; Kalus, K.; Andersen, D.; Opalinski, S. Pilot-scale testing of non-activated biochar for swine manure treatment and mitigation of ammonia, hydrogen sulfide, odorous volatile organic compounds (VOCs), and greenhouse gas emissions. Sustainability 2017, 9, 929. [Google Scholar] [CrossRef]
- Maurer, D.L.; Koziel, J.A.; Bruning, K.; Parker, D.B. Farm-scale testing of soybean peroxidase and calcium peroxide for surficial swine manure treatment and mitigation of odorous VOCs, ammonia and hydrogen sulfide emissions. Atmos. Environ. 2017, 166, 467–478. [Google Scholar] [CrossRef]
- Maurer, D.L.; Koziel, J.A.; Bruning, K.; Parker, D.B. Pilot-scale testing of renewable biocatalyst for swine manure treatment and mitigation of odorous VOCs, ammonia and hydrogen sulfide emissions. Atmos. Environ. 2017, 150, 313–321. [Google Scholar] [CrossRef]
- Parker, D.B.; Hayes, M.; Brown-Brandl, T.; Woodbury, B.; Spiehs, M.; Koziel, J.A. Surface application of soybean peroxidase and calcium peroxide for reducing odorous VOC emissions from swine manure slurry. Appl. Eng. Agric. 2016, 32, 389–398. [Google Scholar] [CrossRef][Green Version]
- Cai, L.; Koziel, J.A.; Liang, Y.; Nguyen, A.T.; Xin, H. Evaluation of zeolite for control of odorants emissions from simulated poultry manure storage. J. Environ. Qual. 2007, 36, 184–193. [Google Scholar] [CrossRef]
- Kalus, K.; Opaliński, S.; Maurer, D.; Rice, S.; Koziel, J.A.; Korczyński, M.; Dobrzański, Z.; Kołacz, R.; Gutarowska, B. Odour reducing microbial-mineral additive for poultry manure treatment. Front. Environ. Sci. Eng. 2017, 11, 7. [Google Scholar] [CrossRef]
- Parker, D.B.; Pandrangi, S.; Greene, L.; Almas, L.; Cole, N.; Rhoades, M.; Koziel, J. Rate and frequency of urease inhibitor application for minimizing ammonia emissions from beef cattle feedyards. Trans. ASAE 2005, 48, 787–793. [Google Scholar] [CrossRef]
- Parker, D.B.; Rhoades, M.B.; Koziel, J.A.; Baek, B.-H.; Waldrip, H.M.; Todd, R.W. Urease inhibitor for reducing ammonia emissions from an open-lot beef cattle feedyard in the Texas High Plains. Appl. Eng. Agric. 2016, 32, 823–832. [Google Scholar] [CrossRef]
- Kalus, K.; Koziel, J.A.; Opaliński, S. A Review of Biochar Properties and Their Utilization in Crop Agriculture and Livestock Production. Appl. Sci. 2019, 9, 3494. [Google Scholar] [CrossRef]
- Wi, J.; Lee, S.; Kim, E.; Lee, M.; Koziel, J.A.; Ahn, H. Evaluation of Semi-Continuous Pit Manure Recharge System Performance on Mitigation of Ammonia and Hydrogen Sulfide Emissions from a Swine Finishing Barn. Atmosphere 2019, 10, 170. [Google Scholar] [CrossRef]
- Chen, L.; Hoff, S.; Cai, L.; Koziel, J.; Zelle, B. Evaluation of wood chip-based biofilters to reduce odor, hydrogen sulfide, and ammonia from swine barn ventilation air. J. Air Waste Manag. Assoc. 2009, 59, 520–530. [Google Scholar] [CrossRef] [PubMed]
- Chen, L.; Hoff, S.J.; Koziel, J.A.; Cai, L.; Zelle, B.; Sun, G. Performance evaluation of a wood-chip based biofilter using solid-phase microextraction and gas chromatography–mass spectroscopy–olfactometry. Bioresour. Technol. 2008, 99, 7767–7780. [Google Scholar] [CrossRef] [PubMed]
- Costa, A.; Chiarello, G.L.; Selli, E.; Guarino, M. Effects of TiO2 based photocatalytic paint on concentrations and emissions of pollutants and on animal performance in a swine weaning unit. J. Environ. Manag. 2012, 96, 86–90. [Google Scholar] [CrossRef] [PubMed]
- Guarino, M.; Costa, A.; Porro, M. Photocatalytic TiO2 coating—To reduce ammonia and greenhouse gases concentration and emission from animal husbandries. Bioresour. Technol. 2008, 99, 2650–2658. [Google Scholar] [CrossRef]
- Rockafellow, E.M.; Koziel, J.A.; Jenks, W.S. Laboratory-scale investigation of UV treatment of ammonia for livestock and poultry barn exhaust applications. J. Environ. Qual. 2012, 41, 281–288. [Google Scholar] [CrossRef]
- Zhu, W.; Koziel, J.; Maurer, D. Mitigation of livestock odors using black light and a new titanium dioxide-based catalyst: Proof-of-concept. Atmosphere 2017, 8, 103. [Google Scholar] [CrossRef]
- Hashimoto, K.; Irie, H.; Fujishima, A. TiO2 photocatalysis: A historical overview and future prospects. Jpn. J. Appl. Phys. 2005, 44, 8269. [Google Scholar] [CrossRef]
- Schneider, J.; Matsuoka, M.; Takeuchi, M.; Zhang, J.; Horiuchi, Y.; Anpo, M.; Bahnemann, D.W. Understanding TiO2 photocatalysis: Mechanisms and materials. Chem. Rev. 2014, 114, 9919–9986. [Google Scholar] [CrossRef]
- Zaleska, A. Doped-TiO2: A review. Recent Pat. Eng. 2008, 2, 157–164. [Google Scholar] [CrossRef]
- Lee, H.J.; Park, Y.G.; Lee, S.H.; Park, J.H. Photocatalytic Properties of TiO2 According to Manufacturing Method. Korean Chem. Eng. Res. 2018, 56, 156–161. [Google Scholar] [CrossRef]
- Vautier, M.; Guillard, C.; Herrmann, J.-M. Photocatalytic degradation of dyes in water: Case study of indigo and of indigo carmine. J. Catal. 2001, 201, 46–59. [Google Scholar] [CrossRef]
- Jia, J.; Li, D.; Wan, J.; Yu, X. Characterization and mechanism analysis of graphite/C-doped TiO2 composite for enhanced photocatalytic performance. J. Ind. Eng. Chem. 2016, 33, 162–169. [Google Scholar] [CrossRef]
- Abe, R. Recent progress on photocatalytic and photoelectrochemical water splitting under visible light irradiation. J. Photochem. Photobiol. C Photochem. Rev. 2010, 11, 179–209. [Google Scholar] [CrossRef]
- Maeda, K.; Domen, K. Photocatalytic water splitting: Recent progress and future challenges. J. Phys. Chem. Lett. 2010, 1, 2655–2661. [Google Scholar] [CrossRef]
- Yang, X.; Zhu, W.; Koziel, J.A.; Cai, L.; Jenks, W.S.; Laor, Y.; van Leeuwen, J.H.; Hoff, S.J. Improved quantification of livestock associated odorous volatile organic compounds in a standard flow-through system using solid-phase microextraction and gas chromatography–mass spectrometry. J. Chromatogr. A 2015, 1414, 31–40. [Google Scholar] [CrossRef]
- Valentine, H. A study of the effect of different ventilation rates on the ammonia concentrations in the atmosphere of broiler houses. Br. Poult. Sci. 1964, 5, 149–159. [Google Scholar] [CrossRef]
- Wathes, C.; Holden, M.; Sneath, R.; White, R.; Phillips, V. Concentrations and emission rates of aerial ammonia, nitrous oxide, methane, carbon dioxide, dust and endotoxin in UK broiler and layer houses. Br. Poult. Sci. 1997, 38, 14–28. [Google Scholar] [CrossRef] [PubMed]
- Wheeler, E.F.; Casey, K.D.; Gates, R.S.; Xin, H.; Zajaczkowski, J.L.; Topper, P.A.; Liang, Y.; Pescatore, A.J. Ammonia emissions from twelve US broiler chicken houses. Trans. Asae 2006, 49, 1495. [Google Scholar] [CrossRef]
- Heber, A.J.; Lim, T.-T.; Ni, J.-Q.; Tao, P.-C.; Schmidt, A.M.; Koziel, J.A.; Hoff, S.J.; Jacobson, L.D.; Zhang, Y.; Baughman, G.B. Quality-assured measurements of animal building emissions: Particulate matter concentrations. J. Air Waste Manag. Assoc. 2006, 56, 1642–1648. [Google Scholar] [CrossRef]
- Heber, A.J.; Ni, J.-Q.; Lim, T.T.; Tao, P.-C.; Schmidt, A.M.; Koziel, J.A.; Beasley, D.B.; Hoff, S.J.; Nicolai, R.E.; Jacobson, L.D. Quality assured measurements of animal building emissions: Gas concentrations. J. Air Waste Manag. Assoc. 2006, 56, 1472–1483. [Google Scholar] [CrossRef]
- Maurer, D.L.; Koziel, J.A.; Bruning, K. Field scale measurement of greenhouse gas emissions from land applied swine manure. Front. Environ. Sci. Eng. 2017, 11, 1. [Google Scholar] [CrossRef]
- Levine, S.Z.; Calvert, J.G. The mechanism of the photooxidation of ammonia. Chem. Phys. Lett. 1977, 46, 81–84. [Google Scholar] [CrossRef]
- Mozzanega, H.; Herrmann, J.M.; Pichat, P. Ammonia oxidation over UV-irradiated titanium dioxide at room temperature. J. Phys. Chem. 1979, 83, 2251–2255. [Google Scholar] [CrossRef]
- Linsebigler, A.L.; Lu, G.; Yates, J.T., Jr. Photocatalysis on TiO2 surfaces: Principles, mechanisms, and selected results. Chem. Rev. 1995, 95, 735–758. [Google Scholar] [CrossRef]
- Roman, E.; De Segovia, J. Adsorption of ammonia on TiO2 (001) at room temperature. Surf. Sci. 1991, 251, 742–746. [Google Scholar] [CrossRef]
- Henrich, V.E.; Dresselhaus, G.; Zeiger, H. Chemisorbed phases of H2O on TiO2 and SrTiO3. Solid State Commun. 1977, 24, 623–626. [Google Scholar] [CrossRef]
- Maxime, G.; Amine, A.A.; Abdelkrim, B.; Dominique, W. Removal of gas-phase ammonia and hydrogen sulfide using photocatalysis, nonthermal plasma, and combined plasma and photocatalysis at pilot scale. Environ. Sci. Pollut. Res. 2014, 21, 13127–13137. [Google Scholar] [CrossRef] [PubMed]
- Jeong, M.-G.; Park, E.J.; Seo, H.O.; Kim, K.-D.; Kim, Y.D.; Lim, D.C. Humidity effect on photocatalytic activity of TiO2 and regeneration of deactivated photocatalysts. Appl. Surf. Sci. 2013, 271, 164–170. [Google Scholar] [CrossRef]
- Seo, H.O.; Park, E.J.; Kim, I.H.; Han, S.W.; Cha, B.J.; Woo, T.G.; Kim, Y.D. Influence of humidity on the photo-catalytic degradation of acetaldehyde over TiO2 surface under UV light irradiation. Catal. Today 2017, 295, 102–109. [Google Scholar] [CrossRef]
- Boulinguiez, B.; Bouzaza, A.; Merabet, S.; Wolbert, D. Photocatalytic degradation of ammonia and butyric acid in plug-flow reactor: Degradation kinetic modeling with contribution of mass transfer. J. Photochem. Photobiol. A Chem. 2008, 200, 254–261. [Google Scholar] [CrossRef]
- Assadi, A.A.; Bouzaza, A.; Wolbert, D. Photocatalytic oxidation of trimethylamine and isovaleraldehyde in an annular reactor: Influence of the mass transfer and the relative humidity. J. Photochem. Photobiol. A Chem. 2012, 236, 61–69. [Google Scholar] [CrossRef]
- Kim, J.S.; Lee, T.K. Effect of humidity on the photocatalytic degradation of trichloroethylene in gas phase over TiO2 thin films treated by different conditions. Korean J. Chem. Eng. 2001, 18, 935–940. [Google Scholar] [CrossRef]
- Amama, P.B.; Itoh, K.; Murabayashi, M. Photocatalytic degradation of trichloroethylene in dry and humid atmospheres: Role of gas-phase reactions. J. Mol. Catal. A Chem. 2004, 217, 109–115. [Google Scholar] [CrossRef]
- Yao, H.; Feilberg, A. Characterisation of photocatalytic degradation of odorous compounds associated with livestock facilities by means of PTR-MS. Chem. Eng. J. 2015, 277, 341–351. [Google Scholar] [CrossRef]
- Hamdy, M.S. Effect of humidity on the photocatalytic degradation of gaseous hydrocarbons mixture. Mater. Chem. Phys. 2017, 197, 1–9. [Google Scholar] [CrossRef]
- Cant, N.W.; Cole, J.R. Photocatalysis of the reaction between ammonia and nitric oxide on TiO2 surfaces. J. Catal. 1992, 134, 317–330. [Google Scholar] [CrossRef]
- Wu, H.; Ma, J.; Li, Y.; Zhang, C.; He, H. Photocatalytic oxidation of gaseous ammonia over fluorinated TiO2 with exposed (0 0 1) facets. Appl. Catal. B Environ. 2014, 152, 82–87. [Google Scholar] [CrossRef]
- Alonso-Tellez, A.; Robert, D.; Keller, N.; Keller, V. A parametric study of the UV-A photocatalytic oxidation of H2S over TiO2. Appl. Catal. B Environ. 2012, 115, 209–218. [Google Scholar] [CrossRef]
- Canela, M.C.; Alberici, R.M.; Jardim, W.F. Gas-phase destruction of H2S using TiO2/UV-VIS. J. Photochem. 1998, 112, 73–80. [Google Scholar] [CrossRef]
- Yuliati, L.; Yoshida, H. Photocatalytic conversion of methane. Chem. Soc. Rev. 2008, 37, 1592–1602. [Google Scholar] [CrossRef]
- Fu, Z.; Yang, Q.; Liu, Z.; Chen, F.; Yao, F.; Xie, T.; Zhong, Y.; Wang, D.; Li, J.; Li, X. Photocatalytic conversion of carbon dioxide: From products to design the catalysts. J. Co2 Util. 2019, 34, 63–73. [Google Scholar] [CrossRef]
- Paramasivam, I.; Jha, H.; Liu, N.; Schmuki, P. A review of photocatalysis using self-organized TiO2 nanotubes and other ordered oxide nanostructures. Small 2012, 8, 3073–3103. [Google Scholar] [CrossRef]
- Tan, S.S.; Zou, L.; Hu, E. Photocatalytic reduction of carbon dioxide into gaseous hydrocarbon using TiO2 pellets. Catal. Today 2006, 115, 269–273. [Google Scholar] [CrossRef]
- Civiš, S.; Ferus, M.; Knížek, A.; Kubelík, P.; Kavan, L.; Zukalová, M. Photocatalytic transformation of CO2 to CH4 and CO on acidic surface of TiO2 anatase. Opt. Mater. 2016, 56, 80–83. [Google Scholar] [CrossRef]
- Kaiser, J.; Röckmann, T.; Brenninkmeijer, C.A.; Crutzen, P.J. Wavelength dependence of isotope fractionation in N2O photolysis. Atmos. Chem. Phys. 2003, 3, 303–313. [Google Scholar] [CrossRef]
- Armerding, W.; Comes, F.; Schülke, B. O (1D) quantum yields of ozone photolysis in the UV from 300 nm to its threshold and at 355 nm. J. Phys. Chem. 1995, 99, 3137–3143. [Google Scholar] [CrossRef]
- Kolinko, P.; Kozlov, D. Products distribution during the gas phase photocatalytic oxidation of ammonia over the various titania based photocatalysts. Appl. Catal. B Environ. 2009, 90, 126–131. [Google Scholar] [CrossRef]
- Kočí, K.; Reli, M.; Troppová, I.; Šihor, M.; Kupková, J.; Kustrowski, P.; Praus, P. Photocatalytic decomposition of N2O over TiO2/g-C3N4 photocatalysts heterojunction. Appl. Surf. Sci. 2017, 396, 1685–1695. [Google Scholar] [CrossRef]
- Wang, H.; Sun, Z.; Li, Q.; Tang, Q.; Wu, Z. Surprisingly advanced CO2 photocatalytic conversion over thiourea derived g-C3N4 with water vapor while introducing 200–420 nm UV light. J. Co2 Util. 2016, 14, 143–151. [Google Scholar] [CrossRef]
- Ohtani, B.; Zhang, S.-W.; Nishimoto, S.-i.; Kagiya, T. Catalytic and photocatalytic decomposition of ozone at room temperature over titanium (IV) oxide. J. Chem. Soc. Faraday Trans. 1992, 88, 1049–1053. [Google Scholar] [CrossRef]
- Černigoj, U.; Štangar, U.L.; Trebše, P. Degradation of neonicotinoid insecticides by different advanced oxidation processes and studying the effect of ozone on TiO2 photocatalysis. Appl. Catal. B Environ. 2007, 75, 229–238. [Google Scholar] [CrossRef]
- Hernández-Alonso, M.a.D.; Coronado, J.M.; Maira, A.J.; Soria, J.; Loddo, V.; Augugliaro, V. Ozone enhanced activity of aqueous titanium dioxide suspensions for photocatalytic oxidation of free cyanide ions. Appl. Catal. B Environ. 2002, 39, 257–267. [Google Scholar] [CrossRef]
- Pichat, P.; Cermenati, L.; Albini, A.; Mas, D.; Delprat, H.; Guillard, C. Degradation processes of organic compounds over UV-irradiated TiO2. Effect of ozone. Res. Chem. Intermed. 2000, 26, 161–170. [Google Scholar] [CrossRef]
- Pichat, P.; Disdier, J.; Hoang-Van, C.; Mas, D.; Goutailler, G.; Gaysse, C. Purification/deodorization of indoor air and gaseous effluents by TiO2 photocatalysis. Catal. Today 2000, 63, 363–369. [Google Scholar] [CrossRef]


| Fluorescent | LED | |
|---|---|---|
| Total light intensity (mW·cm−2) | 0.44 | 4.85 |
| Power consumption (W) | 48.2 | 43.3 |
| Lamps position inside the UV chamber (4 fluorescent lamps and an array of 108 LED chips on an Al board sources were used) |  |  |
| Dust Accumulation Duration | Light Absorption (%) | Dust Accumulation (mg·cm−2) |
|---|---|---|
| 1 week | 14.1 ±3 .6 | 6.9 ± 0.4 |
| 2 weeks | 27.1 ± 4.0 | 11.0 ± 0.7 |
| 3 weeks | 40.1 ± 5.9 | 16.3 ± 1.3 |
| Average | 27.1 ± 12 | 11.4 ± 4.2 |
| Relative Humidity | Type of UV Lamp | 40 s Treatment Time | 200 s Treatment Time | ||||
|---|---|---|---|---|---|---|---|
| Standard Gas | p-Value 1 | Standard Gas | p-Value 1 | ||||
| NH3 | H2S | NH3 | H2S | ||||
| Dry | Fluorescent | 4.1 ± 8.2 | 5.6 ± 1.3 | 0.83 | 2.7 ± 1.7 | 4.6 ± 0.0 * | 0.36 |
| LED | 5.1 ± 3.2 | 7.9 ± 0.5 * | 0.95 | 4.2 ± 0.0 * | 5.9 ± 0.2 * | 0.49 | |
| 12% | Fluorescent | 3.0 ± 4.1 | 3.1 ± 2.8 | 0.44 | 1.8 ± 2.1 | 4.8 ± 0.4 * | 0.69 |
| LED | 6.2 ± 4.0 | 11.7 ± 5.9 | 0.09 | 6.8 ± 1.6 * | 12.2 ± 1.0 * | 0.05 | |
| 40% | Fluorescent | 3.4 ± 0.3 * | 3.3 ± 0.1 * | 0.53 | 1.5 ± 1.0 | 4.5 ± 2.3 | 0.49 |
| LED | 5.5 ± 1.1 * | 6.8 ± 1.7 * | 0.33 | 8.6 ± 3.1 | 11.6 ± 8.9 | 0.09 | |
| 60% | Fluorescent | 2.4 ± 0.6 | 3.3 ± 0.5 * | 0.94 | 5.8 ± 6.5 | 5.4 ± 0.3 | 0.12 |
| LED | 4.0 ± 1.8 | 6.3 ± 5.1 | 0.85 | 5.3 ± 1.4 | 4.7 ± 0.5 * | 0.78 | |
| Relative Humidity | Type of UV Lamp | 40 s Treatment Time | 200 s Treatment Time | ||||
|---|---|---|---|---|---|---|---|
| Standard Gas | p-Value 1 | Standard Gas | p-Value 1 | ||||
| NH3 | H2S | NH3 | H2S | ||||
| Dry | Fluorescent | 33.5 ± 15.4 | 11.0 ± 6.8 | 0.22 | 27.1 ± 2.1 * | 18.0 ± 0.2 * | 0.13 |
| LED | 28.4 ± 3.3 * | 31.0 ± 1.6 * | 0.50 | 31.7 ± 2.3 * | 25.7 ± 0.5 * | 0.16 | |
| 12% | Fluorescent | 22.0 ± 17.6 | 20.3 ± 15.1 | 0.38 | 24.4 ± 0.9 * | 23.0 ± 4.2 | 0.27 |
| LED | 39.3 ± 10.4 | 34.7 ± 3.5 * | 0.37 | 50.3 ± 2.4 * | 46.5 ± 8.0 * | 0.89 | |
| 40% | Fluorescent | 34.6 ± 24.0 | 20.2 ± 9.7 | 0.67 | 22.3 ± 0.5 * | 21.2 ± 9.0 * | 0.57 |
| LED | 40.6 ± 4.4 * | 31.4 ± 6.7 | 0.48 | 29.7 ± 5.2 * | 22.4 ± 0.7 * | 0.46 | |
| 60% | Fluorescent | 23.2 ± 2.5 * | 20.0 ± 0.5 * | 0.69 | 23.4 ± 1.2 * | 23.8 ± 0.0 * | 0.40 |
| LED | 26.1 ± 21.2 | 29.1 ± 17.5 | 0.50 | 41.8 ± 0.6 * | 33.3 ± 2.5 * | 0.06 | |
| Reference | Target Gas | UV Type (Wavelength) | Coating Material (Dose) | The Relative Humidity Condition for Optimal % Reduction |
|---|---|---|---|---|
| [42] | Ammonia | UV-A (355 nm) | TiO2-P25 (650 μg·cm−2) | Low > High |
| [43] | Toluene | UV-A (315–400 nm) | TiO2-P25 (Not reported) | Dry (1%) |
| [44] | Acetaldehyde | UV-A (365 nm) | TiO2 (Not reported) | Dry |
| [47] | Trichloroethylene | UV-A (Not reported) | TiO2 sol-gel films (~1 mg·cm−2) | <50% |
| [48] | Trichloroethylene | UV-A (Not reported) | TiO2-GFC (4.8 g·cm−2) | <25% |
| [49] | Hydrogen sulfide Volatile organic compounds | UV-A (Not reported) | TiO2-ceramic filter (Not reported) | No impact (40–80%) |
| [50] | Hydrocarbons mixture | Not reported (280–650 nm) | TiO2-P25 (Thickness of 1–2 mm) | Dry |
| This study | Ammonia | UV-A (365 nm) | TiO2 (10 μg·cm−2) | 12% |
| Reference | Experiment Conditions | Coating Material | UV Type (Wavelength) | Light Intensity | Target Gas (% Ave 1 Reduction) |
|---|---|---|---|---|---|
| [1] | Swine farm Temp 2: 21.8–26.0 ℃ RH 3: 36–80% T time 4 (s): 24, 47 | TiO2 (10 μg·cm2) | UV-A (365 nm) | <0.04 mW·cm−2 | CH4 (−2.2) CO2 (−3.1) N2O (8.7) Odor (16.3) p-cresol (22.0) |
| [18] | Swine farm Temp: 25.7 ℃ RH: 56.0% CMM: 271.1 T time (s): 71.6 | TiO2 (7 mg·cm−2) | UV-A (315–400 nm) | Not reported | NH3 (2.0), CH4 (27.4) CO2 (−4.5) N2O (−0.8) PM10 (17.0) PM2.5 (−8.1) |
| [19] | Swine farm Temp: 24.3 ℃ RH: 53.6% CMM: 74.9 T time (s): 364.2 | TiO2 (7 mg·cm−2) | UV-A (315–400 nm) | Not reported | NH3 (30.5), CH4 (10.8), CO2 (15.3) N2O (4.2) |
| [52] | Lab-scale Temp: 24 ℃ RH: 50 % T time (min): >30 | TiO2 (Not reported) | UV-A (365 nm) | 0.46 mW·cm−2 | NH3 (35.0) |
| This study | Lab-scale Temp: 25 ± 3 ℃ RH: Dry, 12%, 40%, 60% T time (s): 40, 200 | TiO2 (10 μg·cm−2) | UV-A (365 nm) | 0.44 vs. 4.85 mW·cm−2 | NH3 (4.8 vs. 9.3) H2S (−2.1 vs. 1.7) CH4 (3.4 vs. 2.1) CO2 (−3.1 vs. 3.8) N2O (3.3 vs. 6.6) O3 (22.6 vs. 34.7) |
| Reference | Treatment Time | Direct Photolysis | Photocatalysis |
|---|---|---|---|
| Target Gas (% Reduction) | |||
| [1] | 24 s | N2O (4.2) | N2O (7.3) |
| 47 s | N2O (7.6) | N2O (8.7) | |
| This study | 40 s | N2O (No % reduction) O3 (23.5) | N2O (2.8–6.8) O3 (21.6–37.0) |
| 200 s | N2O (3.3–6.5) O3 (12.4–24.1) | N2O (3.7–9.5) O3 (21.8–48.4) | |
© 2020 by the authors. Licensee MDPI, Basel, Switzerland. This article is an open access article distributed under the terms and conditions of the Creative Commons Attribution (CC BY) license (http://creativecommons.org/licenses/by/4.0/).
Share and Cite
Lee, M.; Wi, J.; Koziel, J.A.; Ahn, H.; Li, P.; Chen, B.; Meiirkhanuly, Z.; Banik, C.; Jenks, W. Effects of UV-A Light Treatment on Ammonia, Hydrogen Sulfide, Greenhouse Gases, and Ozone in Simulated Poultry Barn Conditions. Atmosphere 2020, 11, 283. https://doi.org/10.3390/atmos11030283
Lee M, Wi J, Koziel JA, Ahn H, Li P, Chen B, Meiirkhanuly Z, Banik C, Jenks W. Effects of UV-A Light Treatment on Ammonia, Hydrogen Sulfide, Greenhouse Gases, and Ozone in Simulated Poultry Barn Conditions. Atmosphere. 2020; 11(3):283. https://doi.org/10.3390/atmos11030283
Chicago/Turabian StyleLee, Myeongseong, Jisoo Wi, Jacek A. Koziel, Heekwon Ahn, Peiyang Li, Baitong Chen, Zhanibek Meiirkhanuly, Chumki Banik, and William Jenks. 2020. "Effects of UV-A Light Treatment on Ammonia, Hydrogen Sulfide, Greenhouse Gases, and Ozone in Simulated Poultry Barn Conditions" Atmosphere 11, no. 3: 283. https://doi.org/10.3390/atmos11030283
APA StyleLee, M., Wi, J., Koziel, J. A., Ahn, H., Li, P., Chen, B., Meiirkhanuly, Z., Banik, C., & Jenks, W. (2020). Effects of UV-A Light Treatment on Ammonia, Hydrogen Sulfide, Greenhouse Gases, and Ozone in Simulated Poultry Barn Conditions. Atmosphere, 11(3), 283. https://doi.org/10.3390/atmos11030283