Article

Changes in the Dynamics of the Northern Hemisphere Atmospheric Circulation and the Relationship to Surface Temperature in the 20th and 21st Centuries

by
Nina K. Kononova
1 and
Anthony R. Lupo
2,3,*
1
Institute of Geography Russian Academy of Sciences, Moscow 119017, Russia
2
Atmospheric Science Program, School of Natural Resources, University of Missouri, Columbia, MO 65211, USA
3
Missouri Climate Center, College of Agriculture Food and Natural Resources, University of Missouri, Columbia, MO 65211, USA
*
Author to whom correspondence should be addressed.
Atmosphere 2020, 11(3), 255; https://doi.org/10.3390/atmos11030255
Submission received: 16 January 2020 / Revised: 28 February 2020 / Accepted: 2 March 2020 / Published: 4 March 2020
(This article belongs to the Section Meteorology)

Abstract

:
This study examines the long-term fluctuations in the Northern Hemisphere (NH) and global atmospheric circulation, teleconnections, including blocking, and surface temperature over the period 1899–2018. The teleconnection and blocking data were available from the mid-20th century. The classification of the global atmospheric circulation was developed from an early subjective categorization of atmospheric circulation conditions for the NH that considered the number, location, and amplitude of waves on the jet stream for frequently occurring circulation patterns. This work updated earlier studies that identified three circulation epochs based on the predominance of one of four different flow types that were grouped primarily based on whether the flow was zonal or meridional. This work noted a significant correlation between the early 21st century flow change toward the occurrence of more meridional flows and the increase in the occurrence of blocking as well as changes in the teleconnection indexes. The early 21st century was associated with a distinct change in the Northern Hemisphere flow entropy as measured using Information or Shannon Entropy, a change that was shown to be statistically significant. Additionally, this demonstrated that this quantity has utility as a dynamic diagnostic tool in atmospheric science. Finally, a comparison of these flow regimes to the 20th and 21st century variations in surface temperature were considered here. The global average annual surface temperature variations correlated strongly to fluctuations in the predominant atmospheric circulation type.

1. Introduction

For the analysis of global of hemispheric atmospheric flow regimes, many teleconnection or blocking indexes have been developed and are currently used (e.g., [1,2]) both operationally and in research. The study of atmospheric circulation and teleconnections in the Northern Hemisphere (NH) began in the 1940s (e.g., [3,4]). Among the first of these was a classification system developed for the categorization of extratropical atmospheric circulation patterns in the NH published in [5] (hereafter called DKV46). Briefly, this system classifies NH flows based on whether the NH flow is more zonal or meridional, as well as the number and geographical position of waves along the polar front or jet stream [1,6]. The original work used 13 different categorizations called Elementary Circulation Mechanisms (ECMs) [6] that were grouped into four basic zonal and meridional types ([1,6]). Then, recent research [1] showed the correlation of certain ECMs to NH teleconnections such as the Arctic Oscillation (AO) or the North Atlantic Oscillation (NAO).
The DKV46 system was then extended to the Southern Hemisphere (SH) [7] (hereafter D67), and this work noted a correspondence between the extratropical atmospheric circulation of both the NH and SH. For example, NH zonal flow regimes without strong atmospheric ridging or atmospheric blocking tend to be associated with a similar circulation pattern in the SH. Conversely, during meridional flow regimes in which ridging or blocking occurs, there are similar features in both the NH and SH, including the correspondence of Arctic or Antarctic cold air outbreaks occurring along similar longitudes.
Then, using the daily surface weather maps of the NH and SH and 500 hPa height fields for the period 1998–2005, seasonal differences and trends in the occurrence of NH ECM circulation groups during the later 20th and early 21st centuries that were not considered originally in D67 were noted by in several recent studies [8,9,10,11]. Similar seasonal differences as well as changes and trends in the occurrence and dynamics of SH ECMs for the same period were shown in [12,13].
Further, in [1] the authors discussed the temporal and spatial variations in DKV46 ECM scheme as consistent with earlier studies of NH flows [14,15,16,17,18] (among others) that suggests the NH flow vacillates between two or more quasi-stable states. Many studies (e.g., [19,20,21]) also demonstrate that such flow regime behavior occurs independently in each of the major NH ocean basins. Additionally, Jensen et al. [22] (and references therein) demonstrated that quantities such as enstrophy (specifically the measure developed by [23] called area integrated enstrophy—IE) can be utilized to identify the transitions between hemispheric or regional flow regimes. They [22] showed a correspondence between IE and entropy (Kolmogorov–Saini or metric entropy), which is related to flow predictability and stability, as well as block intensity (BI—as in [22]).
In this paper, the variability and changes in the DKV46 and D67 global atmospheric circulation categories for the period 1899-2018 is examined here. This study will demonstrate the existence of significant flow regime epochs [1,6] based on these ECMs and their correspondence to variability and trends in global temperature and teleconnection activity. This study will demonstrate also the utility of Shannon or Information Entropy [24,25] in order to show that certain epochs and sub-periods are qualitatively and quantitatively different from others. This quantity has not been used often in atmospheric research (e.g., [26]). Finally, this work will also demonstrate a correlation between the occurrence of blocking in the NH and Southern Hemispheres (SH).

2. Data and Methods

2.1. Data

The circulation types are classified using surface maps and 500 hPa height fields which are assimilated daily using the general circulation model developed by the Russian Academy of Science Institute for Computational Mathematics (see website [27]) and plotted on a 2.0° by 2.5° latitude/longitude grid from 1899–2018. Information for global temperature (°C) covering the period (1850–2018), as well as the NH surface temperature (°C) and temperature anomalies (°C) was taken from the University of East Anglia (Climatic Research Unit Data—CRU) database located on the website [28].
Additionally, an independent archive of blocking events from 1970 to 2018 was accessed via the website [29] (see also the work of [2]) for the analysis below. The blocking criteria used in [2], and references therein, is stricter than the D67 criterion, which considered amplified ridging to be a blocking process. The teleconnection indexes, specifically, the Arctic Oscillation (AO) and Antarctic Oscillation (AAO) were downloaded from the website [30].

2.2. Methods

A full description and history of the NH and SH atmospheric flow regime classifications derived by DKV46 and D67, respectively, can be found also in later studies such as [31,32,33]. A brief contemporary description of the concept of ECMs can be found in [1,6,34]. The original work of DKV46 included four groups (Table 1) comprised of 13 main circulation types separated into 41 sub-types identified subjectively on surface maps originally and then using surface and 500 hPa maps [32] when the latter became available in the late 1940s. These sub-types are identified based on the amplitude of the NH mid-latitude flow during the warm or cold season, and the geographical location, phase, and number of ridge–tough couplets in the jet stream. Published studies [1,6,34] used the four combined ECM circulation groups (called types in Table 1) as described below and examples are shown in Figure 1.
Each ECM flow regime lasts several days (typically 6–12 days), and in [1] the authors showed the correspondence of these Type 1–4 flows with NH teleconnection indexes. They also discussed the conceptual similarity of these regimes to NH-wide or basin specific flow regimes (e.g., [14,19,21], and others). These daily classifications of the ECM as well as their monthly and annual statistics since 1899 are available for download via the Russian Academy of Sciences, Institute of Geography website; Fluctuations in the Atmospheric Circulation of the Northern Hemisphere in the 20th and early 21st Century (website [36]).
Type 1 atmospheric flows included ECM 1 and 2 which are characterized by more zonal flow across the entire NH with wave numbers 3–4, and in the SH typically by wave numbers 1–3 (D67 and also [12]). ECM 1 and 2 included two and three variants, respectively, based primarily on the location of mid-latitude ridging or high pressures. Figure 1a is an example of Type 1 NH flow using ECM 2a characterized by zonal flow and a positive AO (0.364). These ECMs are characterized also by the occurrence of a surface anticyclone located over the North Pole region. In [1] the authors associated these type of NH flows with smaller negative to higher positive values of the AO Index, and were, frequently, also associated with values of the Pacific North American (PNA) and North Atlantic Oscillation (NAO) Indexes close to zero.
Type 2 atmospheric flows included ECMs 3–7 (Figure 1b ECM 4a). These flows are characterized by one amplified ridge–trough couplet somewhere in the NH or SH flow, as well as anticyclonic conditions at the surface in the North Pole region. There were 13 versions based on the season and location of the amplified ridge–trough couplet. In the NH, ECMs 3–5 were associated with cold air outbreaks over Europe and western Russia or the central USA, and, consequently, ECM 3 in particular was associated with a stronger negative NAO Index. Otherwise, the AO, NAO, and PNA Indexes were similar in character to Type 1 flows [1].
ECMs 8–12 were included as Type 3 flows, and these were characterized by two to four amplified ridge–trough couplets across the NH or SH, and depending on the season and location of these events included 21 variants. Many of these included atmospheric blocking events as defined by Lupo et. al. [2] (and references therein). Figure 1c is an example of Type 3 NH flow using ECM 10a showing two amplified waves including a blocking event over Eastern Europe. These NH flows were associated with strong negative AO Index (Figure 1c AO = −1.648) episodes and generally larger positive or negative values for the PNA and NAO Indexes [1], as well as a surface anticyclone in the North Pole region.
ECM 13 is the only NH flow regime included as Type 4 (Figure 1d ECM 13s) flows and is characterized by a warm and cold season variant. In the NH, these flows are associated with strong ridging in an equatorward mid-latitude jet stream over Europe or western Russia or a stronger positive NAO Index (Figure 1d—NAO = 0.73). The summer 2010 drought of Eastern Europe and western Russia was representative of this type of flow and the occurrence of these flows has been increasing during the summer season (Figure 1d and in [34]). The North Pole region is characterized by a surface cyclone, and the rest of the NH is typical more zonal or characterized by smaller AO and PNA Index values. D67 (and [6]) show these variants behave similarly in the SH.
Using the DKV46 classification system, six ‘circulation seasons’ were defined in a follow-up study [36]; pre-spring, spring, summer, autumn, pre-winter, and winter. These seasons were defined by the tendency for the predominance of cold versus warm season versions of ECM (e.g., ECM 1, ECM 2) or ECM sub-types (e.g., 12b, 13). The transition from one season to another was defined by the sustained predominance of ECMs occurring more commonly in the next season (in [37]). The specific ECM group(s) that correspond to each season and the mean seasonal duration is shown in Table 2.

2.3. Shannon or Information Entropy

This concept was introduced in communication or information theory during the mid-20th century (e.g., [24,25]) in order to test, for example, the evidence of the reliability of transmitting data between a source and a receiver. The quantity may be interpreted also in terms the likelihood of the occurrence of an individual event, especially an unusual event, as the occurrence of these events would be more informative from a dynamic standpoint. Entropy is often described as a measure of (un) predictability or organization within a system [22] (and references therein) which can be expressed equivalently as information content. The expression for Shannon or Information Entropy is:
H ( x ) = i = 1 n p ( x i ) log b p ( x i )  
where b is the base logarithm and p(x) is the probability of a certain outcome. An illustrative example would be a coin toss. If the coin has an equal probability of heads or tails (p(x) = 0.50, b = 2, n = 2), then it is most difficult to predict the outcome of a particular toss, a situation representing maximum uncertainty (H(x) = 1). If a coin is biased such that the probability of one outcome is 0.6 and the other 0.4, then the outcome can be predicted with more certainty (H(x) = 0.97).
Additionally, as discussed, for example in [26], the Shannon formula is very similar to thermodynamic (Gibbs or Boltzmann Entropy) as proposed in [25]. In [26], an example of the utility for this quantity was shown in the flow field associated with Hurricane Katrina as it approached the Gulf Coast of the USA. Here, it will be used in order to determine whether the occurrence of zonal versus meridional flow regimes in the NH represents an unbiased or biased coin toss during certain epochs.

3. Results

3.1. Circulation Epochs

The climatic characteristics for the NH [11] as a whole is provided below. Circulation epochs are defined by [38] as periods with significant deviations from the annual occurrence of one circulation type (Table 1) over the others. Note, for a local perspective, see the work of [8,11,39,40]. For the period 1899–2018 (Figure 2), Type 3 circulations occur most often during a given year (54% of days) with the exception of a few years between 1930 and 1945, the years 1983–1995, and 2015–2018.
However, using a 10-year running average as a filter on the anomalous occurrences from 1899–2018 mean for particular types reveals that there were three decadal-scale circulation epochs (Figure 3). The first was from 1899–1915 when Type 3 flows showed the largest positive anomalous occurrence from its long-term mean (+27 days annually—see Figure 2 and Figure 3). Then 1916-1956 was characterized as a zonal epoch (Type 1 + Type 2 dominant—Figure 3). Lastly, the 1957–2018 period has been dominated by generally either Type 3 or Type 4 flow regimes (Figure 2 and Figure 3).
A meridional epoch was defined as the occurrence of Type 3 + Type 4 flows. Additionally, Figure 2 suggests that the occurrence of Type 2 flows decreased around 1960 and again in the late 1980s, while there were corresponding increases in Type 4 flows at these times. Note also the occurrence of Type 1 flows decreased in the late 1980s as well. However, as shown in [2], and references therein, Atlantic Region blocking began to increase in the late 1980s and NH-wide around 1998. However, this may only partly explain the NH flow type changes in the late 1980s. Additionally, the occurrence of Type 4 flow was not common before the 1930s. This may be a real phenomenon (similar to the recent Type 1 and 2 decreases) or a function of the observational data since before this period there were no upper air analyses. Thus, the lack of Type 4 flows at this time may be also (at least partly) an artifact of the model assimilation or interpolation.
As demonstrated in [1], the spatial patterns associated with the DKV46 NH zonal and meridional flow types since approximately 1950 corresponds with a similar partition of the NH flow by researchers who used more sophisticated techniques (e.g., [41]). That work used the finite-element, bounded variation, vector autoregressive factor method, as well as three different re-analysis data sets. This technique is similar to the traditional empirical orthogonal function approach with the exception that it better represents non-stationarity in a dataset. Additionally, the temporal periods defined here and in [1] through the variation in zonal versus meridional NH flow was similar to those identified in [41] or those identified using teleconnection regimes (e.g., [42,43,44,45]). Thus, we are confident that the results here are robust.
Focusing on the beginning of the 21st century (Figure 2), a transition to an epoch dominated by meridional flow, especially those classified as Type 4, was underway. Lebedeva et al. [1] correlated this period to a period of decreased AO Index values, and [2] showed that blocking in both the NH and SH has increased relative to the latter part of the 20th century.
Specifically, the predominance of Type 3 (Figure 2—blue) flows is noted here for the period 2006–2012. This period was also characterized by a mean negative AO (−0.10) and NAO (−0.30) Index. In 2013 and 2014, both groups (Type 3 + Type 4) showed similar values. Since 2015, Type 4 groups once again occurred more often reaching a maximum of 114 days per year by 2018. During these three years, there were positive mean values for the AO (0.25) and NAO (0.44) consistent with [1]. Thus, it may be too early to label the end of the third circulation epoch defined above. The return to more Type 4 flows may be a partial result of the strong 2014–2016 El Niño, which is well-known for the occurrence of zonal conditions across the East Pacific and North America. During the latter period (2015–2018), the mean absolute value of the PNA Index was 14% less than that for the former (2006–2012).
D67 (and also [12]) demonstrated the correspondence between similar flow types occurring in the NH and SH simultaneously. The correlation between the AO Index and the Antarctic Oscillation (AAO) Index was 0.15 during the early 21st century when the more robust occurrence of Type 3 and Type 4 flows were prevalent. This result was significant at the 95% confidence level. The AAO Index was only available since 1979 (e.g., [30]) and the authors of [1] demonstrated that 1981–1997 was a sub-period within the 1957–present epoch when the relative occurrence of Type 1 and Type 2 flows was greater in the NH. The period 1981–1997 was characterized by weaker teleconnection index values and a lower correlation between the AO and AAO (−0.05) than might be expected.
Lastly, the occurrence of NH and SH blocking for 1970–2018 was tested. D67 (and also [12]) suggest blocking may occur more frequently in each hemisphere simultaneously. Using the results of [2] suggest this is the case. The work of [2] uses a strict criterion for identifying blocking events compared to DKV46 or D67. Since blocking is a local process and occurs far more frequently in the NH (250+ days per year) versus the SH (less than 100 days per year), comparing the NH and SH on a day-by-day or event-by-event basis may not produce a valid comparison. However, if NH and SH flow regimes are simultaneously more conducive on an annual basis for the occurrence of blocking as suggested by D67 and [12], the two time series may vary together.
In the work of [2], the SH blocking year matches the calendar year, while in the NH the blocking year begins 1 July and 30 June. Adjusting the NH blocking results to fit the calendar year (Figure 4) demonstrates that the correlation between NH and SH blocking time series (1970–2018) was 0.64, a result significant at greater than the 99% confidence level. This was true for the NH and SH Pacific Regions (0.54) and the NH Continental and SH Indian Ocean regions (0.35), respectively, both of which were significant at greater than 99%. Only the Atlantic showed a weaker correlation (0.24), significant at only the 95% confidence level. Thus, for the latter 20th and early 21st century, more blocking in the NH corresponds to more blocking in the SH. Additionally, it is not clear why there has been an increase in Type 3 and Type 4 flows and blocking in the early 21st century. With regard to blocking, in [1,2] the authors show interannual and interdecadal variability from 1970–2018 consistent with the variation in flow types here. The role of climate change in blocking increases is not clear, but the balance of much longer-term studies projects slight decreases in blocking during the 21st century (in [46]).

3.2. Global Surface Temperatures

A comparison of the variations in surface temperature (Figure 5) with the variations in the atmospheric circulation (Figure 3) shows it is evident that the NH and global surface temperature trends correlate with the circulation epochs defined in the text above. The correlation between the NH (global) surface temperature trends with the zonal and meridional flow groups was −0.64 and 0.66 (−0.66 and 0.69), respectively. This is significant at the 99% confidence level. While these correlations are strong, the statistical test only suggests similarity between these time series and does not suggest causation. Additionally, each time series was detrended and decomposed into wave space using Fourier transforms (e.g., Figure 6). Significant spectral peaks corresponding to 20-, 40-, and 60-year cycles (six, three, and two cycles over 120 years, respectively) were found in each time series. These periods roughly correspond to epochs of the Pacific Decadal Oscillation (PDO) or the NAO [1,2,43,44].
The first epoch (1899–1915), an epoch of the greater occurrence of meridional flows (Type 3) was also an epoch of cooling; the average global and NH surface temperature decreased. The second epoch (1916–1956) was associated with a greater occurrence of zonal flows (Type 1 and 2), and this was also the first epoch of 20th century increases in surface temperature. During this epoch, there was a strong warming in the Arctic regions (e.g., [47]).
The third epoch (1957–present time) which is dominated by the occurrence of Type 3 and Type 4 flows breaks down into sub-periods as in [1,9]. The first sub-period (1957–1969) is characterized by an increase in the occurrence of Type 3 atmospheric flows (Figure 2), which was associated also with decreasing global temperature (similar to the first Epoch). In the second sub-period (1970–1980) the occurrence of Type 1 and Type 2 flows increased but each type was close to their long-term average. It was shown in [48] that the dynamic mechanisms occurring between 1970 and 1978 was best reflected by the average position of the storm tracks was closer to the average of the zonal flow types of DKV46 or D67 ECMs.
Between 1981 and 1997, the occurrence of Type 4 flows increased rapidly. This period was characterized by a predominantly positive era of the NAO and Pacific Decadal Oscillation [1,2]. The surface temperature also increased rapidly, reaching a maximum (for that time) in 1998. Since that year, the occurrence of Type 4 flows began to decrease slowly (Figure 3), but the occurrence of Type 3 flows and blocking both hemispheres increased as demonstrated by [2]. This was characterized by a period of comparatively steady global temperatures (e.g., in [47]).
Additionally, according to [12,13], the occurrence of blocking processes within Type 3 is increasing mainly due to the ECM with amplified wave number four events (ECM 12a), while the occurrences of Type 4 events is still above the long-term mean. This is especially true in the summer, which has experienced also a strong increase in blocking [2,34]. However, the surface temperature did not decrease, but they increased to their highest level of the entire period in association with the 2014–2016 strong El Niño and an upturn in the occurrence of Type 4 flows.
The variations in the length and the changes in temperature trends for these epochs or within them may be linked partly to several causes including interdecadal variability of blocking or the teleconnection indexes (in [1,2,34]). Additionally, studies [49,50,51,52] suggest that relationships between oceanic and atmospheric circulation have a nearly 60-year variability. Others have suggested solar variability could be responsible as well (e.g., [52,53,54]). Finally, recent increases in global temperature are apparent in the overall trend [47] that have been attributed to an increase in greenhouse gases. The IPCC [47] volume discusses this attribution research extensively.
The seasonal dates for the beginning and the duration of the circulation seasons discussed in Section 2.2 have varied in association with change in the circulation epochs (in [36]). However, the long-term mean of the warm season transition dates has changed little. For example, the date of the beginning of the pre-spring season, which ends the cold season, in recent years (1970–present) differs little from the average of the entire dataset. Nonetheless, the pre-winter period (the start of the cold season) began seven days earlier than the long-term average date prior to 1970. As a result, the duration of the cold season in the NH has increased by seven days.

3.3. Circulation Epochs and Information Entropy

The work of [14] suggested that the frequency of occurrence for zonal versus meridional flows should be approximately similar throughout the course of a year. If the occurrence of the 41 DKV46 ECMs and sub-types are equally likely on an annual basis, then the occurrence of Type 1 + Type 2 (Type 3 + Type 4) NH flows should be 44% (56%), accounting for 18 of the 41 (23 of the 41) ECMs and sub-types, respectively. The Information Entropy for this system is 0.99 (Table 3), which is very close to that of an unbiased coin, or nearly random. Testing this distribution for a year using a simple Chi Square, Z-score, or Kolmogorov–Smirnov (KS) test found in any elementary statistics text [55] or testing the Information Entropy as in [56] demonstrates that this system is not different from a strictly random one at standard levels of significance. Since this distribution is close to that of the random distribution, it is used as the expected background frequency to test observed occurrences of zonal versus meridional flow following [57].
Examining the occurrence of the NH flow Types in Table 1 throughout the entire period (1899–2018) demonstrated that the mean annual occurrence of Type 1 + Type 2 (zonal) flows versus Type 3 + Type 4 (meridional) flows was less than one—half that of zonal flows (Table 1). The information entropy for the entire period is 0.90, which indicates the occurrence of NH flow regimes are more predictable (less random) than a coin flip. This may be due partly to land water distribution in the NH or could be a reflection of longer-term climate variability and/or trends than the study period. Testing this distribution showed that the more frequent occurrence of meridional flows was statistically significant at 90% confidence level using the KS test (Table 3), but at 95% or 99% using the Chi-square or Z-score test.
For each circulation epoch discussed in Section 3.1, the entropy varied as well. From 1899–1915, 1916–1956, 1957–2018, the Information Entropy was 0.94, 0.99, and 0.76, respectively. While the first two epochs were similar to the overall time series (Table 3), the Information Entropy for 1957–2018 was much lower, reflecting the strong tendency toward the more frequent occurrence of meridional flow types during this time. Thus, this epoch is at least qualitatively different from the previous two. Statistical testing revealed that Epoch 3 was different form the overall time series at the 95% confidence level using the KS test. As shown in the study of [1] and above, this is also an epoch of increasing global temperatures and 500 hPa heights.
Examining the sub-periods within this third epoch gives results that support the discussion in Section 3.2. The Information Entropy for sub-periods one through four is shown in Table 3. During this Epoch, the occurrence of NH meridional flows decreases for the first two sub-periods, but increases strongly for sub-periods three and four (1981–2018). Only sub-period two is not significantly different from the expected DKV46 distribution at a standard level of significance.
The most recent sub period is different at the 99% confidence level using the KS test. This coincides with the more frequent occurrence of blocking. During this sub-period, some research has suggested that the increase in global temperatures [47,59] may be contributing to longer lasting amplified NH flow regimes. This is consistent with the result here, but does not suggest a cause and effect or dynamic relationship between the two. An examination of the wave dynamics would be needed and a recent study [60] suggested that the annual frequency of changes in flow regimes (here ECMs) is not changing significantly or projected to increase in the near future. Additionally, the correspondence between the future occurrence DKV46 NH flow regimes and those examined in studies such as [60] for example has not been examined as yet.
Finally, as expected, there is a correlation between the time series of Shannon or Information Entropy and the NH and global temperatures as well. This correlation was −0.75 for both (significant at the 99% confidence level) for the NH temperature time series, which further strengthens the connection between the flow regime epochs described above and global temperatures as well as demonstrates the utility of this quantity. It is conceded here that while the entropy quantity describes the dynamic behavior and epochs, it does not shed light on the causes of recent temperature increases.

4. Summary and Conclusions

In this study, the occurrence frequency of NH flow regimes from 1899 to 2018 was examined using the daily DKV46 NH flow classification scheme which is archived at the Institute of Geography (Russian Academy of Sciences) in Moscow and available via the website [36]. The circulation types are classified using surface maps and 500 hPa height fields which are assimilated daily using the general circulation model developed by the Russian Academy of Science Institute for Computational Mathematics and plotted on a 2.0° by 2.5° latitude/longitude grid from 1899 to 2018. The predominance of NH flow regime epochs for the 20th century has been published previously, and this work extends the previous work into the early 21st century. The correlation of flow regime epochs to variability in the NH surface temperature anomalies, NH teleconnections, and atmospheric blocking was explored here as well. Finally, the utility of Shannon (or Information Entropy) in defining and describing the NH flow regime epochs was examined in order to demonstrate the utility of this tool in atmospheric science analysis.
Among the new findings presented here:
  • the end of the third circulation epoch (starting in 1957) since 1899 may be occurring as the frequency of Type 3 + Type 4 (meridional) NH flows has occurred more frequently. The period 1981–2018 is characterized by a strong increase in Type 4 NH flows. The occurrence of Type 3 flows overtook the occurrence of Type 4 flows again in the early 2000s, but it is not yet clear that a new epoch or sub-period has begun as Type 4 flows became more common again. This may be partly due to the recent strong 2014–2016 El Niño;
  • the NH teleconnection indexes (e.g., AO, NAO) of the late 20th and early 21st centuries have varied along with the frequency of Type 3 and Type 4 flows consistent with [1] and references therein;
  • the correspondence of NH and SH atmospheric flows as proposed by D67 and in [10,11] showed promise as identified by two additional tests. There is a significant correlation between the AO and AAO Indexes for the period 1998–2018 (when these indexes were available and most robust). The occurrence of atmospheric blocking time series in each hemisphere from 1970 to 2018 correlated very strongly hemisphere wide as well as by sector;
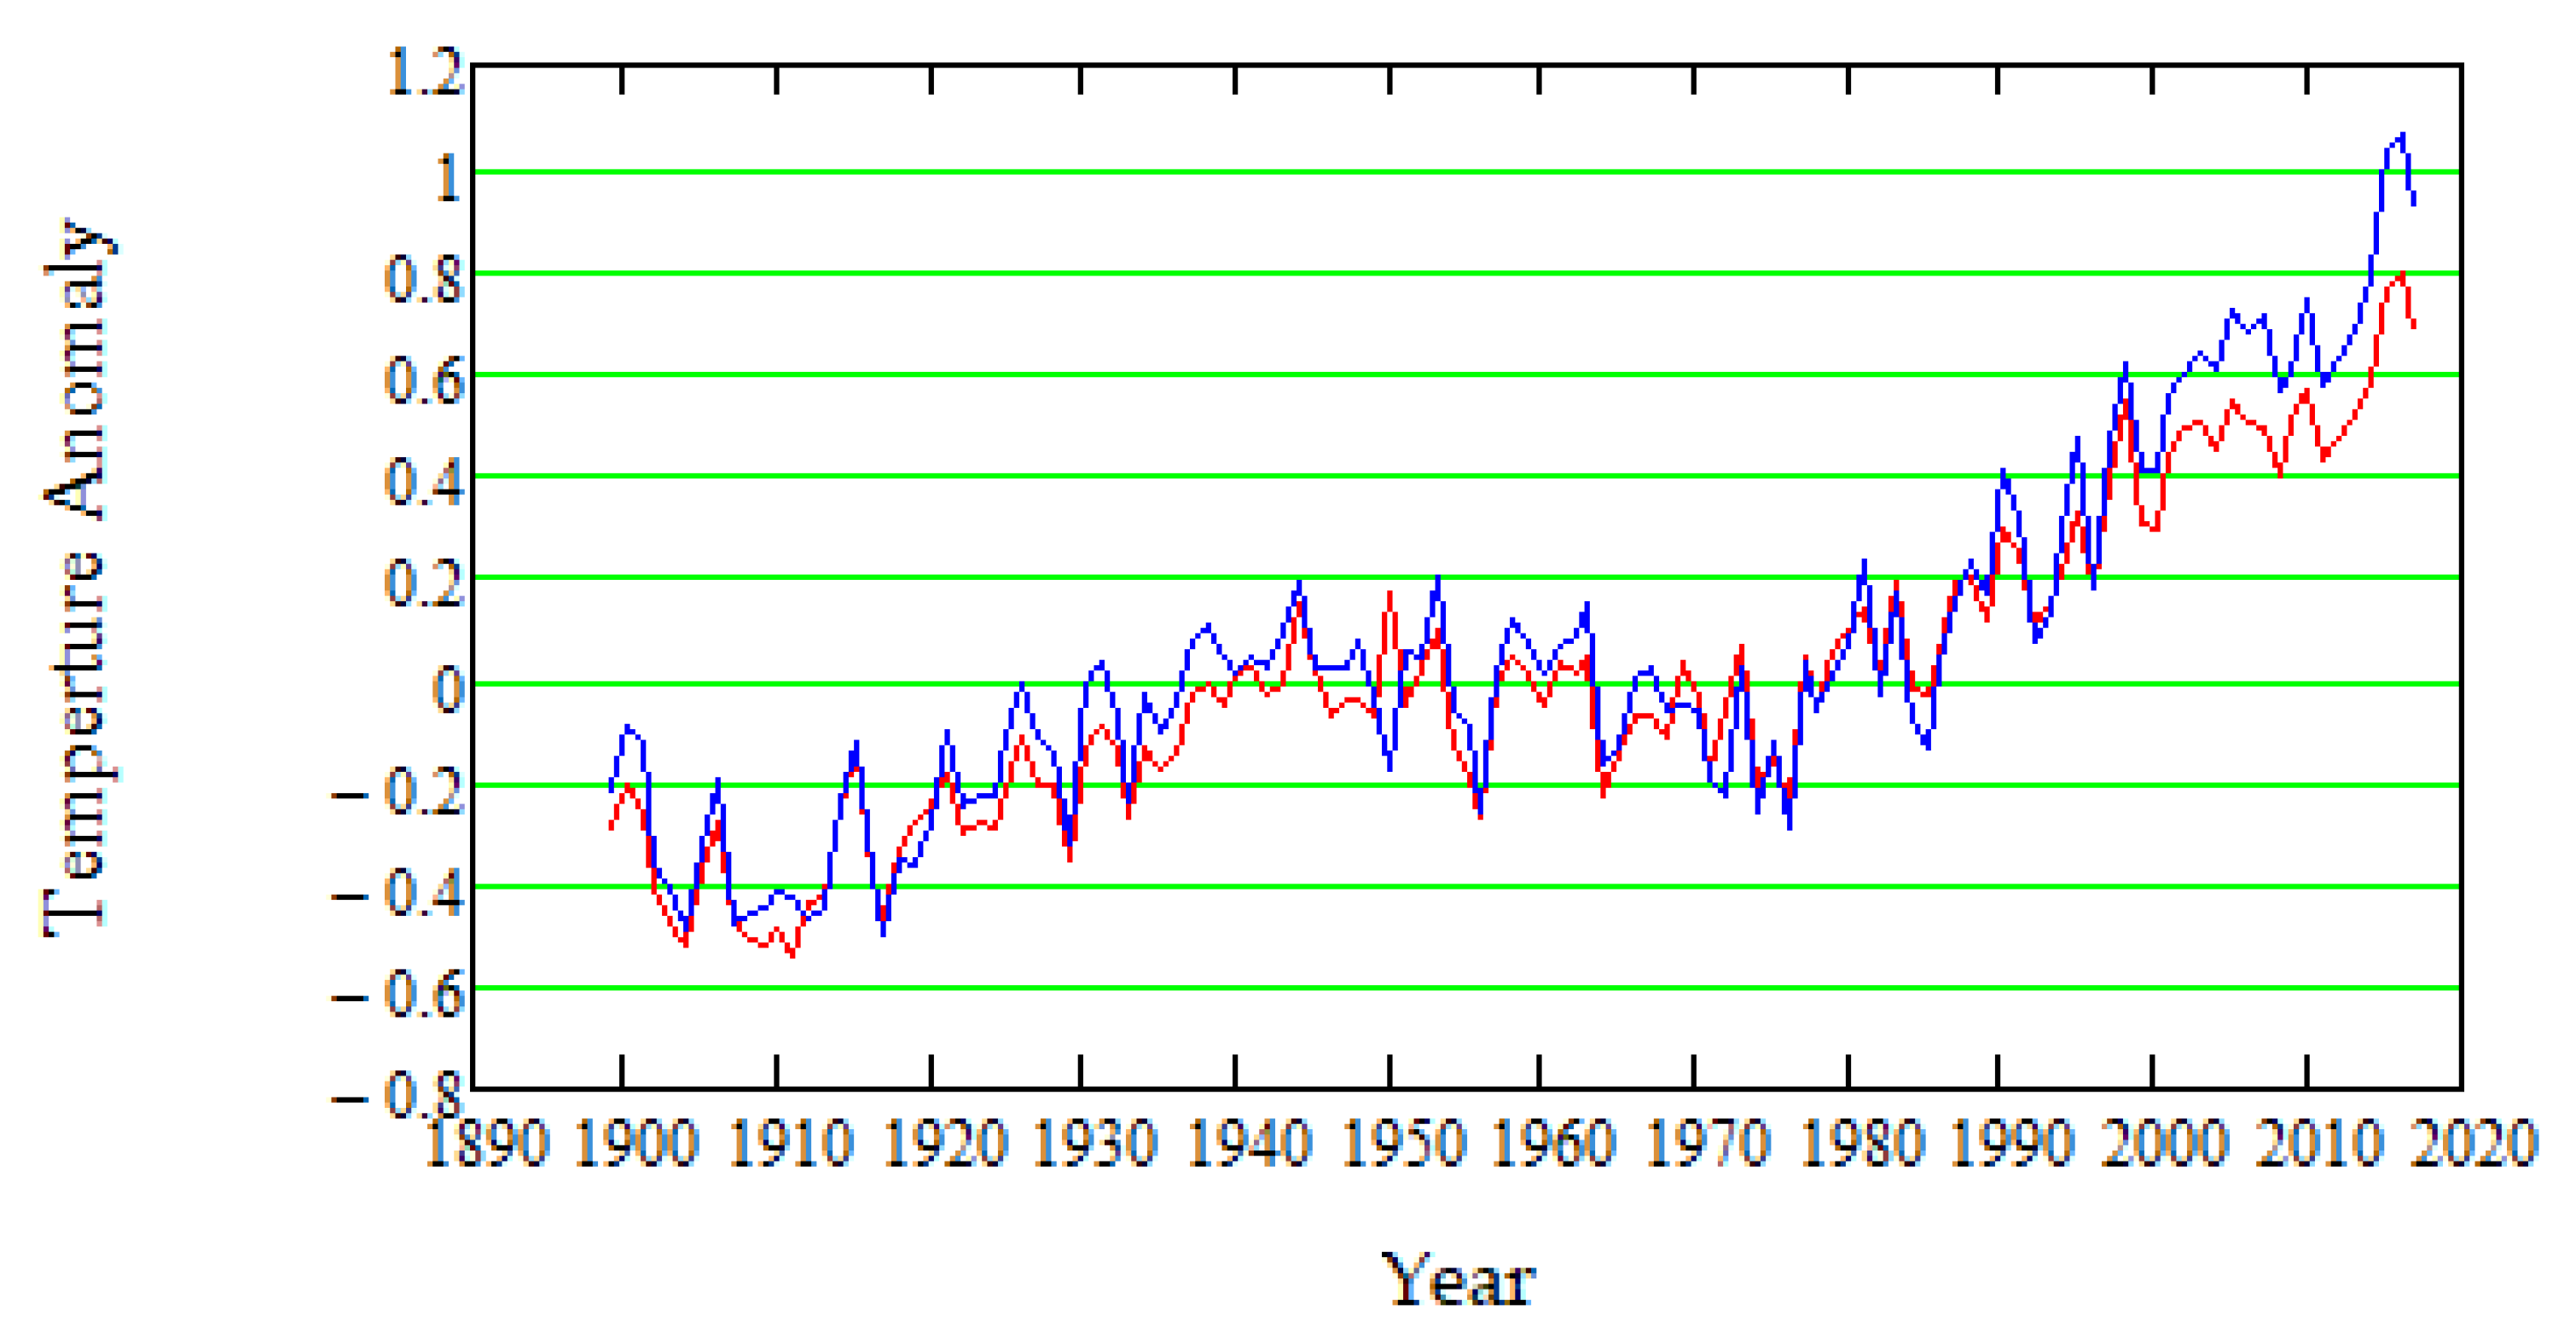
  • the global surface temperature trends including those of the early 21st century significantly correlated to the circulation epochs and sub-periods identified in the text;
  • the quantity, Shannon or Information Entropy, corresponded to the occurrence of zonal versus meridional NH flows (as well as NH surface temperatures) during the period from 1899 to 2018 and was not random as an unbiased coin toss or as suggested by theory (in [14]—or the DKV46 classification scheme). The first two epochs were similar to the entire period overall, but the third epoch (1957–2018) was significantly different and biased toward the more frequent occurrence of meridional flows. Thus, the Shannon or Information Entropy has utility as a diagnostic tool in atmospheric science. It may have use in an operational or seasonal range forecasting environment as well as in examining future climate scenarios produced by models.

Author Contributions

Conceptualization, methodology, validation, formal analysis, investigation, resources, writing—review and editing, visualization was done by N.K.K. and A.R.L. Data curation, writing—original draft preparation, and funding acquisition was done by N.K.K. All authors have read and agreed to the published version of the manuscript.

Funding

This research was funded by the Program of Basic Research of the Institute of Geography, Russian Academy of Sciences, project no. 0148-2019-0009.

Acknowledgments

The authors are very grateful to the two anonymous reviewers whose comments were valuable in making this work much stronger. This work was performed at the Institute of Geography, Russian Academy of Sciences, State assignment no. 0148-2019-0009.

Conflicts of Interest

The authors declare no conflict of interest.

References

  1. Lebedeva, M.G.; Lupo, A.R.; Chendev, Y.G.; Krymskaya, O.V.; Solovyev, A.B. Changes in the atmospheric circulation conditions and regional climatic characteristics in two remote regions since the mid-20th century. Atmosphere 2019, 10, 11. [Google Scholar] [CrossRef] [Green Version]
  2. Lupo, A.R.; Jensen, A.D.; Mokhov, I.I.; Timazhev, A.V.; Eichler, T.; Efe, B. Changes in Global Blocking Character in Recent Decades. Atmosphere 2019, 10, 92. [Google Scholar] [CrossRef] [Green Version]
  3. Allen, R.A.; Fletcher, R.; Holmboe, J.; Namias, J.; Willett, H.C. Report on an Experiment in Five-Day Weather Forecasting; Massachusetts Institute of Technology and Woods Hole Oceanographic Institution: Woods Hole, MS, USA, 1940. [Google Scholar]
  4. Van Loon, H.; Rogers, J.C. The Seesaw in Winter Temperatures between Greenland and Northern Europe. Part I: General Description. Mon. Wea. Rev. 1978, 106, 296–310. [Google Scholar] [CrossRef] [Green Version]
  5. Dzerdzeevskii, B.L.; Kurganskaya, V.M.; Vitviskaya, Z.M. The Classification of Circulation Mechanisms in the Northern Hemisphere and the Characteristics of Synoptic Seasons. In Synoptic Meteorology; Gidrometizdat: Leningrad, Russia, 1946. [Google Scholar]
  6. Kononova, N.K. The Classification of Northern Hemisphere Circulation Mechanisms According to B.L. Dzerdzeevskii; Izdatel’stvo “Voyentekhinizdat”: Moscow, Russia, 2009. [Google Scholar]
  7. Dzerdzeevskii, B.L. A comparison of the main regularities of atmospheric circulation over the Northern and Southern Hemispheres. Inf. Bull. Sov. Antarct. Exped. 1967, 65, 58–68. [Google Scholar]
  8. Kononova, N.K. Circulation of the atmosphere in the European Sector of the Northern Hemisphere in the 21st Century and fluctuations in air temperature in the Crimea. Geopolit. Ecogeodynamics Reg. 2014, 10, 633–639. [Google Scholar]
  9. Kononova, N.K. Peculiarities of the atmospheric Circulation of the Northern Hemisphere during the end of the 20th—Beginning of the 21st Centuries and its reflection in the climate. Complex Syst. 2014, 2, 11–35. [Google Scholar]
  10. Kononova, N.K. Changes of the Atmospheric Circulation in the Northern Hemisphere in the 20th–21st Centuries and their consequences for the climate. Fundam. Appl. Climatol. 2015, 1, 127–156. [Google Scholar]
  11. Kononova, N.K. Circulating epochs in the sectors of the Northern Hemisphere from 1899–2014. Geopolit. Ecogeodynamics Reg. 2015, 11, 56–66. [Google Scholar]
  12. Kononova, N.K. Fluctuations in the global atmospheric circulation in the 20th–21st Centuries. Complex Syst. 2016, 4, 22–37. [Google Scholar]
  13. Kononova, N.K. Types of the global atmospheric circulation: Monitoring and retrospective assessment results for 1899–2017. Fundam. Appl. Climatol. 2018, 3, 108–123. [Google Scholar] [CrossRef]
  14. Lorenz, E.N. Deterministic, non-periodic flow. J. Atmos. Sci. 1963, 20, 130–141. [Google Scholar] [CrossRef] [Green Version]
  15. Hansen, A.R. Observational characteristics of atmospheric planetary waves with bimodal amplitude distributions. Adv. Geophys. 1986, 29, 101–134. [Google Scholar]
  16. Sutera, A. Probability density distribution of large-scale atmospheric flow. Adv. Geophys. 1986, 29, 227–250. [Google Scholar]
  17. Charney, J.G.; DeVore, J.G. Multiple flow equilibria in the atmosphere and blocking. J. Atmos. Sci. 1979, 36, 1205–1216. [Google Scholar] [CrossRef] [Green Version]
  18. Mo, K.; Ghil, M. Cluster analysis of multiple planetary flow regimes. J. Geophys. Res. 1988, 93, 10927–10952. [Google Scholar] [CrossRef] [Green Version]
  19. Franzke, C.; Woollings, T.; Martius, O. Persistent circulation regimes and preferred regime transitions in the North Atlantic. J. Atmos. Sci. 2011, 68, 2809–2825. [Google Scholar] [CrossRef] [Green Version]
  20. Michel, C.; Rivière, G. The link between Rossby wave breakings and weather regime transitions. J. Atmos. Sci. 2011, 68, 1730–1748. [Google Scholar] [CrossRef]
  21. Huang, W.; Chen, R.; Wang, B.; Wright, J.S.; Yang, Z.; Ma, W. Potential vorticity regimes over East Asia during winter. J. Geophys. Res. Atmos. 2016, 122, 1524–1544. [Google Scholar] [CrossRef]
  22. Jensen, A.D.; Lupo, A.R.; Mokhov, I.I.; Akperov, M.G.; Reynolds, D.D. Integrated regional enstrophy and block intensity as a measure of Kolmogorov Entropy. Atmosphere 2017, 8, 237. [Google Scholar] [CrossRef] [Green Version]
  23. Dymnikov, V.P.; Kazantsev, Y.V.; Kharin, V.V. Information entropy and local Lyapunov exponents of barotropic atmospheric circulation. Izv.-Russ. Acad. Sci. Atmos. Ocean. Phys. 1992, 28, 425–432. [Google Scholar]
  24. Shannon, C.E. A mathematical theory of communication. Bell Syst. Tech. J. 1948, 27, 379–423. [Google Scholar] [CrossRef] [Green Version]
  25. Jaynes, E.T. Information theory and statistical mechanics. Phys. Rev. 1957, 106, 620–630. [Google Scholar] [CrossRef]
  26. Liu, Y.; Liu, C.; Wang, D. Understanding atmospheric behavior in terms of entropy: A review of Applications of the Second Law of Thermodynamics to meteorology. Entropy 2011, 13, 211–240. [Google Scholar] [CrossRef] [Green Version]
  27. Institute of Computational Mathematics (Russian Academy of Sciences). Available online: https://www.inm.ras.ru/en/ (accessed on 4 February 2020).
  28. Climatic Research Unit (CRU), University of East Anglia. Temperature data (HadCRUT4, CRUTEM4) Climatic Research Unit Global Temperature, Climatic Research Unit. 2019. Available online: https://crudata.uea.ac.uk/cru/data/temperature/ (accessed on 12 March 2019).
  29. The University of Missouri Blocking Archive. Available online: http://weather.missouri.edu/gcc (accessed on 6 August 2019).
  30. National Oceanic and Atmospheric Administration (NOAA) Climate Prediction Center (CPC) Teleconnections. Available online: https://www.cpc.ncep.noaa.gov/products/precip/CWlink/daily_ao_index/month_ao_index.shtml (accessed on 29 July 2019).
  31. Dzerdzeevskii, B.L. Fluctuations of Climate and of General Circulation of the Atmosphere in Extra-tropical Latitudes of the Northern Hemisphere and Some Problems of Dynamic Climatology. Tellus 1962, 14, 328–336. [Google Scholar] [CrossRef] [Green Version]
  32. Dzerdzeevskii, B.L. Circulation Mechanisms in the Atmosphere of the Northern Hemisphere in the Twentieth Century. In Materials of Meteorological Research; Institute of Geography of the USSR Academy of Sciences and the Interagency Geophysical, Committee under the Presidium of the USSR Academy of Sciences: Moscow, Russia, 1968; p. 240. [Google Scholar]
  33. Dzerdzeevskii, B.L. Selected Works, General Circulation of the Atmosphere and Climate. Science 1975. [Google Scholar]
  34. Lebedeva, M.G.; Krymskaya, O.V.; Lupo, A.R.; Chendev, Y.G.; Petin, A.N.; Solovyev, A.B. Trends in summer season climate for Eastern Europe and Southern Russia in the early 21st Century. Adv. Meteorol. 2016. [Google Scholar] [CrossRef] [Green Version]
  35. The National Centers for Environmental Prediction—National Centers for Atmospheric Research. Available online: https://www.esrl.noaa.gov/psd/data/gridded/data.ncep.reanalysis.html (accessed on 20 February 2020).
  36. Kononova, N.K. Fluctuations in the Atmospheric Circulation of the Northern Hemisphere in the 20th and Early 21st Century. Available online: https://atmospheric-circulation.ru/ (accessed on 12 March 2019).
  37. Dzerdzeevskii, B.L. Circulation Schemes of the Seasons in the Northern Hemisphere. Izvestiya of the SSSR Academy of Sciences. Geography 1957, 1, 36–55. [Google Scholar]
  38. Dzerdzeevskii, B.L. The Problem of Fluctuations in the General Circulation of the Atmosphere and the Climate. In Modern Problems of Climatology; Voeikov, A.I., Ed.; Gidrometizdat: Leningrad, Russia, 1956; pp. 109–122. [Google Scholar]
  39. Chaplygina, A.S. Fluctuations in the circulation of the atmosphere and the climatic regime of the Earth. Physical and Dynamic Climatology. Gidrometizdat 1974, 30, 209–217. [Google Scholar]
  40. Kononova, N.K. Fluctuations in the circulation of the atmosphere and air temperature in the Northeast of Siberia in the 20th and Early 21st Centuries. In Proceedings of the International Conference, Sustainable Nature Management in Coastal Marine Zones; Izdatel’stvo “Dal’nauka”: Vladivostok, Russia, 2013; pp. 62–66. [Google Scholar]
  41. Risbey, J.S.; O’Kane, T.J.; Monselesan, D.P. Metastability of Northern Hemisphere Teleconnection Modes. J. Atmos. Sci. 2015, 72, 35–54. [Google Scholar] [CrossRef]
  42. Halpert, M.; Bell, G. Climate assessment for 1996. Bull. Am. Meteor. Soc. 1997, 78, S1–S49. [Google Scholar] [CrossRef] [Green Version]
  43. Visbeck, M.; Hurrell, J.; Polvani, L.; Cullen, H. The North Atlantic Oscillation: Past, present, and future. Proc. Natl. Acad. Sci. USA 2001, 98, 12876–12877. [Google Scholar] [CrossRef] [PubMed] [Green Version]
  44. Minobe, S. A 50–70-Year Climatic Oscillation over the North Pacific and North America. Geophys. Res. Lett. 1997, 24, 683–686. [Google Scholar] [CrossRef] [Green Version]
  45. Wang, Y.-H.; Magnusdottir, G.; Stern, H.; Tian, X.; Yu, Y. Decadal variability of the NAO: Introducing an augmented NAO index. Geophys. Res. Lett. 2012, 39, L21702. [Google Scholar] [CrossRef] [Green Version]
  46. Woollings, T.; Barriopedro Cepero, D.; Methven, J.; Son, S.-W.; Harvey, B.; Martius, O.; Sillmann, J.; Lupo, A.R.; Seneviratne, S. Blocking and it’s response to climate change. Curr. Clim. Chang. Rep. 2018, 4, 287–300. [Google Scholar] [CrossRef] [PubMed] [Green Version]
  47. Intergovernmental Panel on Climate Change (IPCC). Climate Change 2013: The Physical Scientific Basis. 2013. Available online: http://www.ipcc.ch (accessed on 27 June 2019).
  48. Savina, S.S.; Khmelevskaya, L.V. Dynamics of Atmospheric Processes in the Northern Hemisphere in the Twentieth Century; Soviet Geophysical Committee at the Presidium of the USSR Academy of Sciences: Moscow, Russia, 1984. [Google Scholar]
  49. Wyatt, M.G.; Curry, J.A. Role for Eurasian Arctic shelf sea ice in a secularly varying hemispheric climate signal during the 20th century. Clim. Dyn. 2013. [Google Scholar] [CrossRef]
  50. Byshev, V.I.; Serykh, I.V.; Sidorova, A.N.; Sklyarov, V.E.; Anisimov, M.V. Oceanic factor of multi-decadal variability of the current climate. Oceanol. Stud. 2018, 46, 5–19. (In Russian) [Google Scholar]
  51. Serykh, I.V. On the dynamics and structure of global atmospheric oscillation in climate models and in reality. Oceanol. Stud. 2018, 46, 14–28. (In Russian) [Google Scholar] [CrossRef] [Green Version]
  52. Scafetta, N. Solar Oscillations and the Orbital Invariant Inequalities of the Solar System. Sol. Phys. 2020, 295, 33. [Google Scholar] [CrossRef]
  53. Kukoleva, A.A.; Kononova, N.K.; Krivolutsky, A.A. Manifestation of the solar cycle in the circulation characteristics of the lower atmosphere in the Northern Hemisphere. Geomagn. Aeron. 2018, 58, 808–817. [Google Scholar] [CrossRef]
  54. Fedorov, V.M.; Frolov, D.M. Spatial and temporal variability of solar radiation coming to the upper boundary of the atmosphere. Space Res. 2019, 57, 177–184. (In Russian) [Google Scholar]
  55. Neter, J.; Wasserman, W.; Whitmore, G.A. Applied Statistics, 3rd ed.; Allyn and Bacon Press: Boston, MA, USA, 1988; p. 2029. [Google Scholar]
  56. Jantschi, L.; Bolboaca, S.D. Performances of Shannon’s Entropy statistic in assessment of distribution of data. Ovidius Univ. Ann. Chem. 2017, 28, 30–42. [Google Scholar] [CrossRef] [Green Version]
  57. Wiedenmann, J.M.; Lupo, A.R.; Mokhov, I.I.; Tikhonova, E.A. The climatology of blocking anticyclones for the Northern and Southern Hemisphere: Block intensity as a diagnostic. J. Clim. 2002, 15, 3459–3474. [Google Scholar] [CrossRef] [Green Version]
  58. Wilks, D.S. Statistical Methods in the Atmospheric Sciences, 2nd ed.; Int. Geophys Series number 91; Academic Press: Cambridge, MA, USA, 2006; p. 627. [Google Scholar]
  59. Francis, J.A.; Vavrus, S.J. Evidence linking Arctic amplification to extreme weather in the mid-latidudes. Geophys. Res. Lett. 2011, 39, L06801. [Google Scholar] [CrossRef]
  60. Jensen, A.D.; Lupo, A.R.; Mokhov, I.I.; Akperov, M.G.; Sun, F. The dynamic character of Northern Hemisphere flow regimes in a near term climate change projection. Atmosphere 2018, 9, 27. [Google Scholar] [CrossRef] [Green Version]
Figure 1. Adapted from [1] using data from [35], examples of the large-scale circulation types using the 1200 Coordinated Universal Time (UTC) 500 hPa height field. The contour intervals are 60 m and in color. The given examples are (A) Type 1 (26 August 2008—Elementary Circulation Mechanism (ECM) 2a), (B) Type 2 (19 February 2006—ECM 4a), (C) Type 3 (5 January 2006—ECM 10a), (D) Type 4 (10 July 2010—ECM 13s).
Atmosphere 11 00255 g001
Figure 2. The annual total duration (days) of the global atmospheric circulation types from 1899 to 2018 for Type 1 (1. orange solid), Type 2 (3. red solid), Type 3 (5. blue solid), Type 4 (7. green solid), respectively, and their 1899-2018 mean for Type 1 (2. orange dashed), Type 2 (4. red dashed), Type 3 (6. Blue dashed), Type 4 (8. green dashed), respectively.
Atmosphere 11 00255 g002
Figure 3. The anomalous occurrence (days) of (1) zonal flows (Type 1 and 2, dashed), and (2) meridional flows (Type 3 and Type 4, solid) from 1899 to 2018 means since the beginning of the 21st century.
Atmosphere 11 00255 g003
Figure 4. The annual block occurrences (ordinate) per calendar year from 1970 (abscissa) for the Northern Hemisphere (NH) (red) and the Southern Hemisphere (SH) (blue).
Atmosphere 11 00255 g004
Figure 5. Annual surface temperature anomalies (°C) for the years 1850–2018 from the 1961–1990 mean obtained from [28]. The red line is global temperature and the blue line is NH temperature.
Atmosphere 11 00255 g005
Figure 6. The spectral analysis of the detrended NH time series for the NH (red). The dotted (dashed) line is the 95% confidence level assuming a white (red) noise spectrum (see [58]). The abscissa unit is cycles per 120 years and the ordinate unit is spectral power (°C2).
Atmosphere 11 00255 g006
Table 1. Global atmosphere circulation groups.
Circulation GroupECMs IncludedAtmospheric Pressure at the North/South PoleNumber of Amplified Waves
Zonal (Type 1)1–2High0
Zonal Breaking (Type 2)3–7High1
Amplified Ridging (Type 3)8–12High2–4
Equatorward Troughs (Type 4)13Low3–4
Table 2. Seasonal circulation groups.
SeasonsDate (s)Dominant ECMs
Winter (NH)/Summer (SH)26 Nov–8 March5a,b,d, 7aw,bw, 11a,b,c, 12bw,cw, 13w
Summer (NH)/Winter (SH)24 May–31 August2a,b,c, 3, 4b,c, 6, 7as,bs, 8bs,cs,ds, 9a, 10b, 13s
Spring/Fall9 April–8 May/1 September–7 October10a, 12a,bs,cs
Pre-spring/Pre-winter9 March–8 April/8 October–25 November1a,b, 4a, 5c, 8a,bw,cw,dw, 9b, 11d,12d
Table 3. The distribution and Shannon or Information Entropy for NH flow epochs studied here. Zonal flow is Type 1 + Type 2 and Meridional is Type 3 + Type 4. Bold values are significant at the 90% confidence level, while a * (**) indicates significance at the 95% confidence level using the Kolmogoro–Smirnov test, where DKV46 serves as the expected values.
EpochOccurrence of Zonal Versus Meridional Flow (Z/M)Information Entropy
Random0.50/0.50 1.00
Expected DKV460.44/0.560.99
Observed 1899–20180.31/0.690.90
Epoch 1 1899–19150.36/0.640.94
Epoch 2 1916–19560.44/0.560.99
Epoch 3 1957–20180.22/0.78 *0.76 *
Sub-period 1 1957–19690.28/0.720.86
Sub-period 2 1970–19800.32/0.680.90
Sub-period 3 1981–19970.26/0.740.82
Sub-period 4 1998–20180.13/0.87 **0.57 **

