Article

A Study of the Effects of Anthropogenic Gaseous Emissions on the Microphysical Properties of Landfalling Typhoon Nida (2016) over China

1
State Key Laboratory of Severe Weather, Chinese Academy of Meteorological Sciences, Beijing 100081, China
2
Shanghai Typhoon Institute, Shanghai 200030, China
*
Author to whom correspondence should be addressed.
Atmosphere 2020, 11(12), 1322; https://doi.org/10.3390/atmos11121322
Submission received: 13 October 2020 / Revised: 25 November 2020 / Accepted: 1 December 2020 / Published: 7 December 2020
(This article belongs to the Special Issue Asia-Pacific Region: Monsoons and Typhoons)

Abstract

:
Using the Weather Research and Forecasting model with chemistry module (WRF-Chem), Typhoon Nida (2016) was simulated to investigate the effects of anthropogenic gaseous emissions on the vortex system. Based on the Multi-resolution Emission Inventory for China (MEIC), three certain experiments were conducted: one with base-level emission intensity (CTRL), one with one-tenth the emission of SO 2 (SO2_C), and one with one-tenth the emission of NH 3 (NH3_C). Results show that the simulations reasonably reproduced the typhoon’s track and intensity, which were slightly sensitive to the anthropogenic gaseous emissions. When the typhoon was located over the ocean, a prolonged duration of raindrop growth and more precipitation occurred in CTRL run. The strongest updraft in CTRL is attributed to the maximum latent heating through water vapor condensation. During the landfalling period, larger (smaller) differential reflectivities in the main-core of the vortex were produced in NH3_C (SO2_C) run. Such opposite changes of raindrop size distributions may lead to stronger (weaker) rainfall intensity, and the ice-related microphysical processes and the relative humidity in low troposphere were two possible influential factors. Moreover, additional ten-member ensemble results in which white noise perturbations were added to the potential temperature field, indicated that the uncertainty of thermodynamic field in the current numerical model should not be ignored when exploring the impacts of aerosol on the microphysics and TC precipitation.

1. Introduction

The effects of anthropogenic aerosols on a deep convective system have been more investigated through the theoretical and observational methods, as aerosols can act as cloud condensation nuclei (CCN) or ice nuclei (IN), changing the in-cloud microphysical properties and thermal-related processes, thence modulating the surface precipitation induced by the convective system [1,2,3,4]. Generally, an enhancement of CCN concentration will increase the cloud droplet concentration, inhibit the auto-conversion and collision rate of raindrops, and lead to a delay in raindrop growing [5]. Meanwhile, the rest of the small droplets are easily transferred into the mixed-phase region, increasing the latent heat release and buoyancy, and can finally invigorate convection in there [6,7].
Although the main effect of aerosols on single deep convection has been better discussed and partially understood, it becomes more complicated and controversial when involving a tropical cyclone (TC). Various factors such as when and where the aerosols intrude into the vortex jointly determine the ultimate effects of anthropogenic aerosols on the track, intensity, structure, and precipitation of TCs [8,9,10,11,12,13,14,15,16,17,18,19,20,21,22]. Most of the studies indicated that aerosols may have a slight effect on TC track [14,23,24,25]. According to a specific region of the vortex where aerosols penetrate, Herbener et al. [12] pointed out that TC would intensify due to the increasing concentrations of aerosol in the eyewall region, which is also confirmed by Khain et al. [16]. However, when large amounts of pollution aerosol intrude into the outer rainband of a TC, invigorating the convection therein, and the vortex would dissipate earlier since the cut-off of inward transportation of water vapor and energy [26]. In addition, other studies also demonstrate the different response of TC intensity to the aerosols from the aspect of ingestion time [27], which can be similarly interlinked and explained by the aforementioned region where aerosols intrude.
Using the observation and numerical simulation, there has been steady progress in understanding the relationship between the anthropogenic aerosols and TC-induced precipitation. Based on the aerosol optical depth (AOD) and TC precipitation from 1980 to 2014 over the mainland China, Yang et al. [20] reported that the anthropogenic aerosols invigorated TC precipitation, which is mainly through enhancing the mixed-phase processes, and they speculated that the different aerosol type would cause distinction of microphysical interaction and dynamic evolution in TCs. By further examining the relationship between the AOD and TC rainfall radius over the western North Pacific region from 2000 to 2015, Zhao et al. [21] indicated that anthropogenic aerosols can penetrate into the spiral rainbands of the TC system, invigorating the convection embedded in the outer rainbands and intensifying the ice particle detrainment aloft as well as increasing the rainfall area which is also suggested by numerical simulations [15] and satellite measurements [13]. Furthermore, the particular chemical component in the emission would definitely influence the TCs to a certain extent. For example, the higher sea-salt aerosol emission can lead to more latent heat release and increase the horizontal velocity and convective precipitation [22]. Consistently, Hoarau et al. [28] reported that the intensity of a TC system will dramatically weaken once the sea-salt emission is excluded, which can be attributed to the activation of interstitial CCN in the inner core.
To our knowledge, the significance of aerosol effects on the TC precipitation is still full of controversy since aerosol-precipitation interaction is nonmonotonic and additionally determined by environmental conditions such as humidity and vertical wind shear [8,29]. Previous numerical studies which explore the aerosol effects on TC system commonly use the Weather Research and Forecasting model (WRF, [30]) with spectral bin microphysics (SBM, [15,16,18]) and the relevant results will certainly remain to be discussed due to the following reasons: (1) the fixed distribution of CCN in the whole domain is imperfect when using such cloud microphysics due to the overlooked temporal and spatial evolution of anthropogenic emission. (2) The robustness of the aerosol effect on TC precipitation is lacking as most of the conclusions are obtained through certain simulation without consideration of model uncertainty [31]. (3) Based on WRF with chemistry module (WRF-chem), some studies concluded that the impact of aerosol on TC microphysics is evident though uncertainty should always be noted since the complex evolution and reaction from the precursor gaseous to CCN are included during the simulations. Most of the sensitive experiments concerning the aerosol effects are conducted only by changing the emission intensity of all pollution simultaneously, without separately discussing the peculiarity of different precursor gaseous emissions [14]. Since these emitted gases determine the concentration of secondary inorganic salts in the atmosphere and play a key role in the activated CCN and formation of cloud droplets, it is noteworthy to explore whether various species of these gaseous has a consistent impact on the microphysics and ultimate TC-induced precipitation as well. Besides, the discrepancies of cloud microphysics and the relevant thermodynamic field before and after the landfalling of vortex under the effects of various aerosol compositions are also rare discussed.
With the development of cloud and precipitation observations, polarimetric radar has gradually been used to validate the model in simulating the raindrop characteristics within the TC system [32,33,34]. The horizontal reflectivity factor (ZH, unit: dBZ) is a variable that represents both particle size and number concentration in the detective volume, while the differential reflectivity (ZDR, unit: dB) only expresses the size information of particles. Generally, smaller-sized raindrops are treated as spheres with almost 0 dB while larger-sized drops exhibit large ZDR due to the increasing oblateness. Typhoon Nida (2016) directly hit Dapeng Peninsula in Guangdong Province with the category of strong typhoon at around 2100 UTC 1 August 2016. Based on the fact that operational S-band polarimetric radar at Guangzhou city, south China coast, fortunately captured Nida during its landfalling period, the specific influences of anthropogenic aerosols on the intensity as well as evolution of microphysics within the main-core of the vortex can be investigated substantially. The simulated radar variables and precipitation are firstly compared to evaluate the cloud microphysics in the simulation. The major purposes of this study are (a) identify and test the effects of different precursor gaseous emission ( SO 2 and NH 3 ) on the microphysical evolution of TC, and (b) explore the relative contribution of various microphysical processes before and after TC landfalling under the polluted condition.
The next section briefly describes the model configuration, anthropogenic gaseous emissions, and the setting of numerical experiments. Section 3 presents the verification of the model track, intensity, polarimetric radar variables, and surface precipitation. The evolutions of aerosols and the characteristics of cloud droplets and raindrops are discussed in Section 4. The diversities of microphysical contribution and thermodynamic fields within the vortex are also presented in Section 4. Summary is given in the last section.

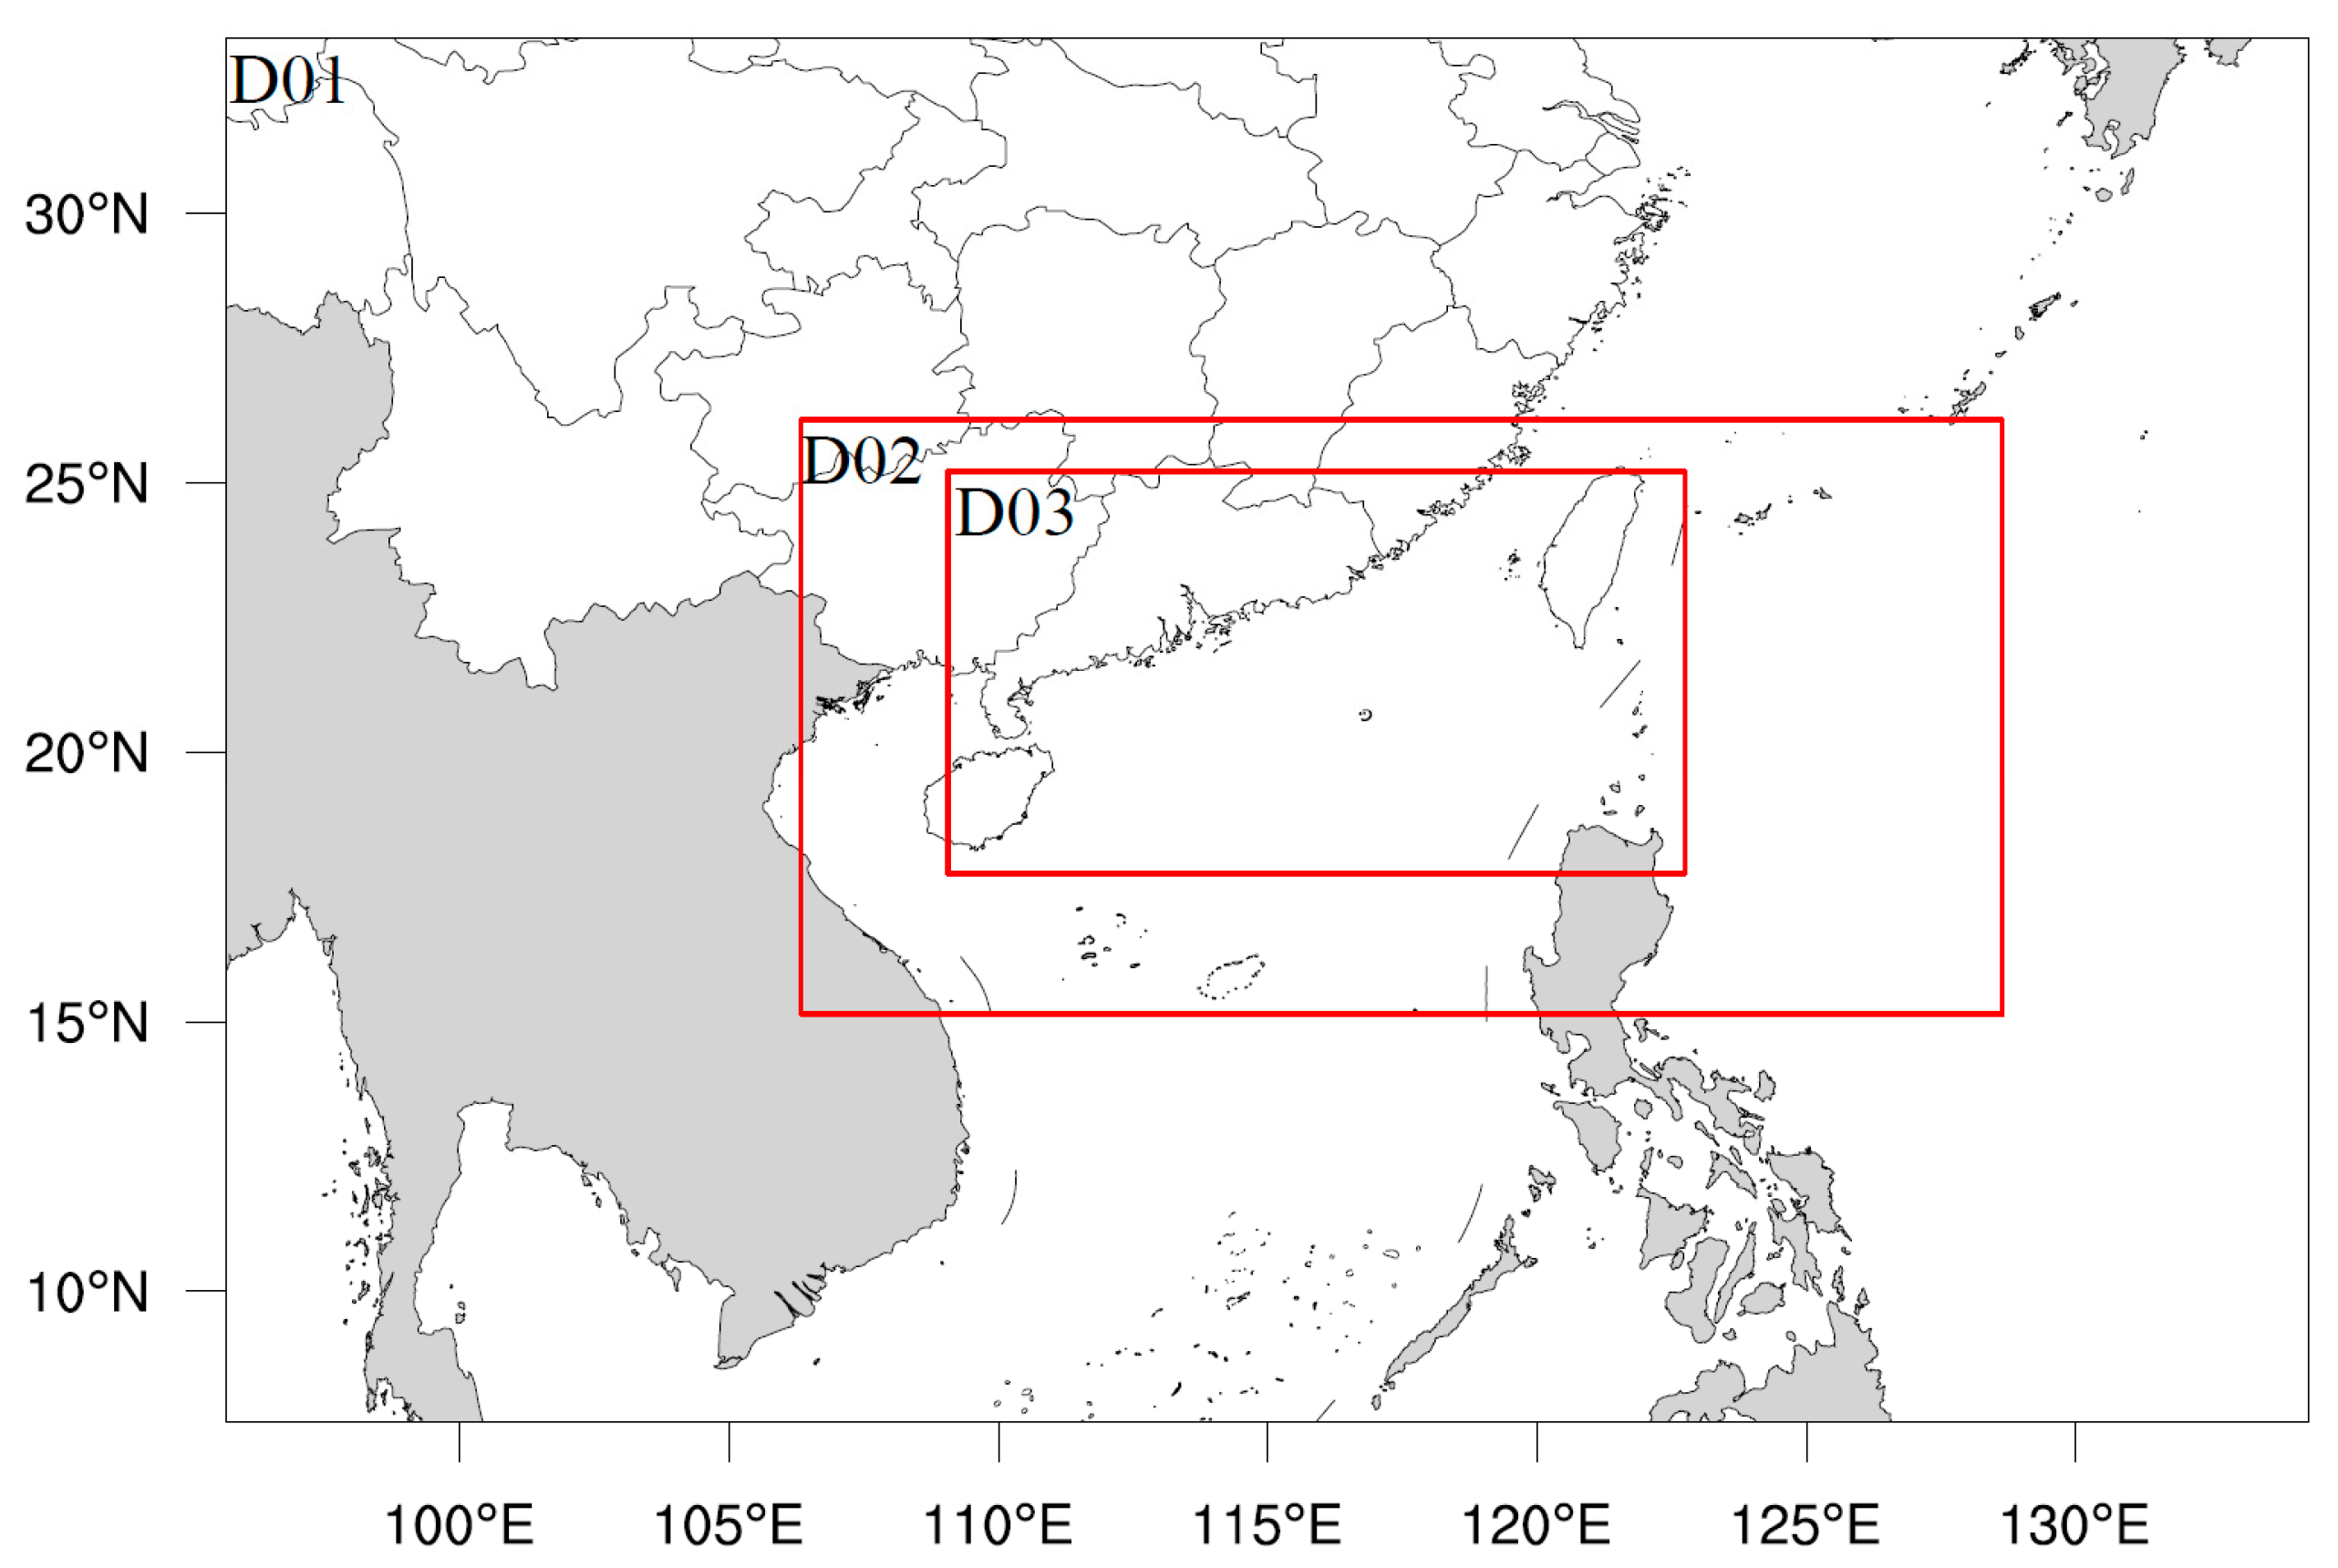
2. Model Description and Experimental Design

The WRF-Chem (Version 3.8.1) with three fixed nested domains is used to conduct the simulation. The horizontal resolution of each domain is 36, 12, and 4 km, respectively (Figure 1). There are 50 vertical layers from the surface to the model top of 10 hPa. Since the computational cost of chemistry module in the model, the finest resolution is relatively coarse but able to explicitly simulate the main characteristics of cloud microphysics in a large-scale system [14]. The experiments start from 0000 UTC 1 August 2016 and integrate for 36 h. To explore the effect of gaseous emission on the evolution of microphysics in Nida (2016) before and after its landfalling, the outputs from 1200 UTC 1 to 0600 UTC 2 August with 1-h interval are used for analyses. The Morrison two-moment microphysics [35] is adopted since it can give the predictions of mixing ratio and number concentration of cloud droplets, raindrops, ice, snow, and graupel when it coupled with the chemical module. All the size distributions for hydrometeors except cloud droplets are treated as a gamma distribution n ( D ) = N 0 D μ e Λ D with the shape parameter μ equals zero ( Λ is the slope parameter). For the cloud droplets, μ is set to 3 according to Martin et al. [36]. Thus, the mass-weighted mean cloud droplet (raindrop) diameter can be inferred from the predicted mixing ratio and number concentration as 7 Λ ( 4 Λ ), respectively. The formation of cloud droplets is mainly through the condensation of water vapor, and its growing rate is directly controlled by the air supersaturation and radius of the cloud droplet. The main source/sink terms for raindrop mixing ratio are the auto-conversion from cloud droplets to raindrops, accretion of cloud droplets by raindrops, evaporation of raindrops, and melting of snow and graupel particles. The other physical schemes for the simulation include the new Grell cumulus scheme [37] (also turned on in the innermost domain), the Rapid Radiative Transfer Model for global climate models shortwave and longwave schemes [38], the Noah land-surface model [39], and the Yonsei University boundary-layer scheme [40].
For the chemical module, the Regional Acid Deposition Model version 2 (RADM2) [41] and Modal Aerosol Dynamics Model for Europe/Secondary Organic Aerosol Model (MADE/SORGAM) [42,43] are adopted to describe the chemical reaction and aerosol interaction within and out of clouds, including the photochemical reaction, activation, and wet scavenging, etc. In MADE/SORGAM, the chemical composition such as sulfate, ammonium is divided into Aitken and accumulation modes with the size distribution prescribed by two overlapping lognormal modes [14]. The gaseous precursors turn into the smallest aerosol particles (~1 nm) through the gas-to-particle conversion process (nucleation). The main source of sulfate aerosol is atmospheric oxidation of SO2 to H2SO4. The sulfate aerosols can be partly or totally neutralized by NH3 [44,45,46]. The nucleation particles continuously grow by the aerosol microphysical processes such as the condensation and coagulation. The aerosols are finally activated when the environmental supersaturation is large than the aerosol critical supersaturation, which depends on the aerosol size and composition. The activation fractions of mass and number for each aerosol mode/bin are calculated according to the vertical velocity [47]. One can find more details about the WRF-Chem model through http://ruc.noaa.gov/wrf/wrf-chem/.
The 1° × 1° National Centers for Environmental Prediction Final analysis (NCEP-FNL) data are used to offer the initial and boundary forcing during the simulation. We choose the 0.25° × 0.25° monthly emission datasets of the year 2013 from Multi-resolution Emission Inventory for China (MEIC) (http://www.meicmodel.org) [48], including different emission sources such as industrial manufacturing, residential and agricultural production as well as traffic transportation, to represent the distribution of local anthropogenic aerosol. Based on the characteristics of long-term observations, the precursor gases of anthropogenic aerosols show clear diurnal variation and non-uniform spatial distribution (Figure 2). Note that the emission amount and the diurnal variation on each day of a certain month are the same. With the rapid industrialization, the sulfur dioxide ( SO 2 , a precursor gas for sulfate) released from factories and automobile exhaust becomes one of the major sources of anthropogenic aerosol species over East Asia with about 39.5   Tg ( SO 2 ) yr 1 [49]. Focusing on the local distribution of SO 2 in Guangdong province, it mostly concentrates around the Pearl River Delta region with the peak intensity of 30   mol   km 2 h 1 (Figure 2a). Unlike the spatial distribution of SO 2 , the ammonia ( NH 3 ), which is largely produced by agricultural activities as farmland fertilization and livestock and poultry breeding, is emitted more homogeneous with the peak intensity of 7   mol   km 2 h 1 (Figure 2b).
The time-series of domain-averaged (within the black circle in Figure 2a) mixing ratio of SO 2 and NH 3 also exhibit some differences, although both polluting intensities of these two precursor gases rise during the daytime and decrease during the night. An almost unchanged emission intensity of SO 2 is seen once it reaches its maximum value, while two peaks of emission intensity of NH 3 are shown during the daytime [50]. To distinguish the particular influences of different gaseous anthropogenic emissions on the microphysical structure in a landfalling TC, three numerical experiments are performed. According to Guo et al. [49], the annual mean emission intensity of SO 2 nowadays is ten times heavier than that in the second half of the twentieth century. Thus, besides the control experiment (CTRL) using the MEIC emission datasets, two sensitive certain experiments focusing on the response of TC systems under reduced emission intensity of particular gaseous such as SO 2 (SO2_C) and NH 3 (NH3_C) are conducted, respectively. In order to access the uncertainty of aerosol impact, ensemble experiments with ten members are generated by adding white noise perturbation into the potential temperature field at model levels beneath 800 m in the initial condition (RUN0x_CTRL, referring as ensembles hereafter), which is adopted in Griffin et al. [51] but with a maximum magnitude of perturbation of 0.2 °C. The detailed model setups are summarized in Table 1.

3. Results

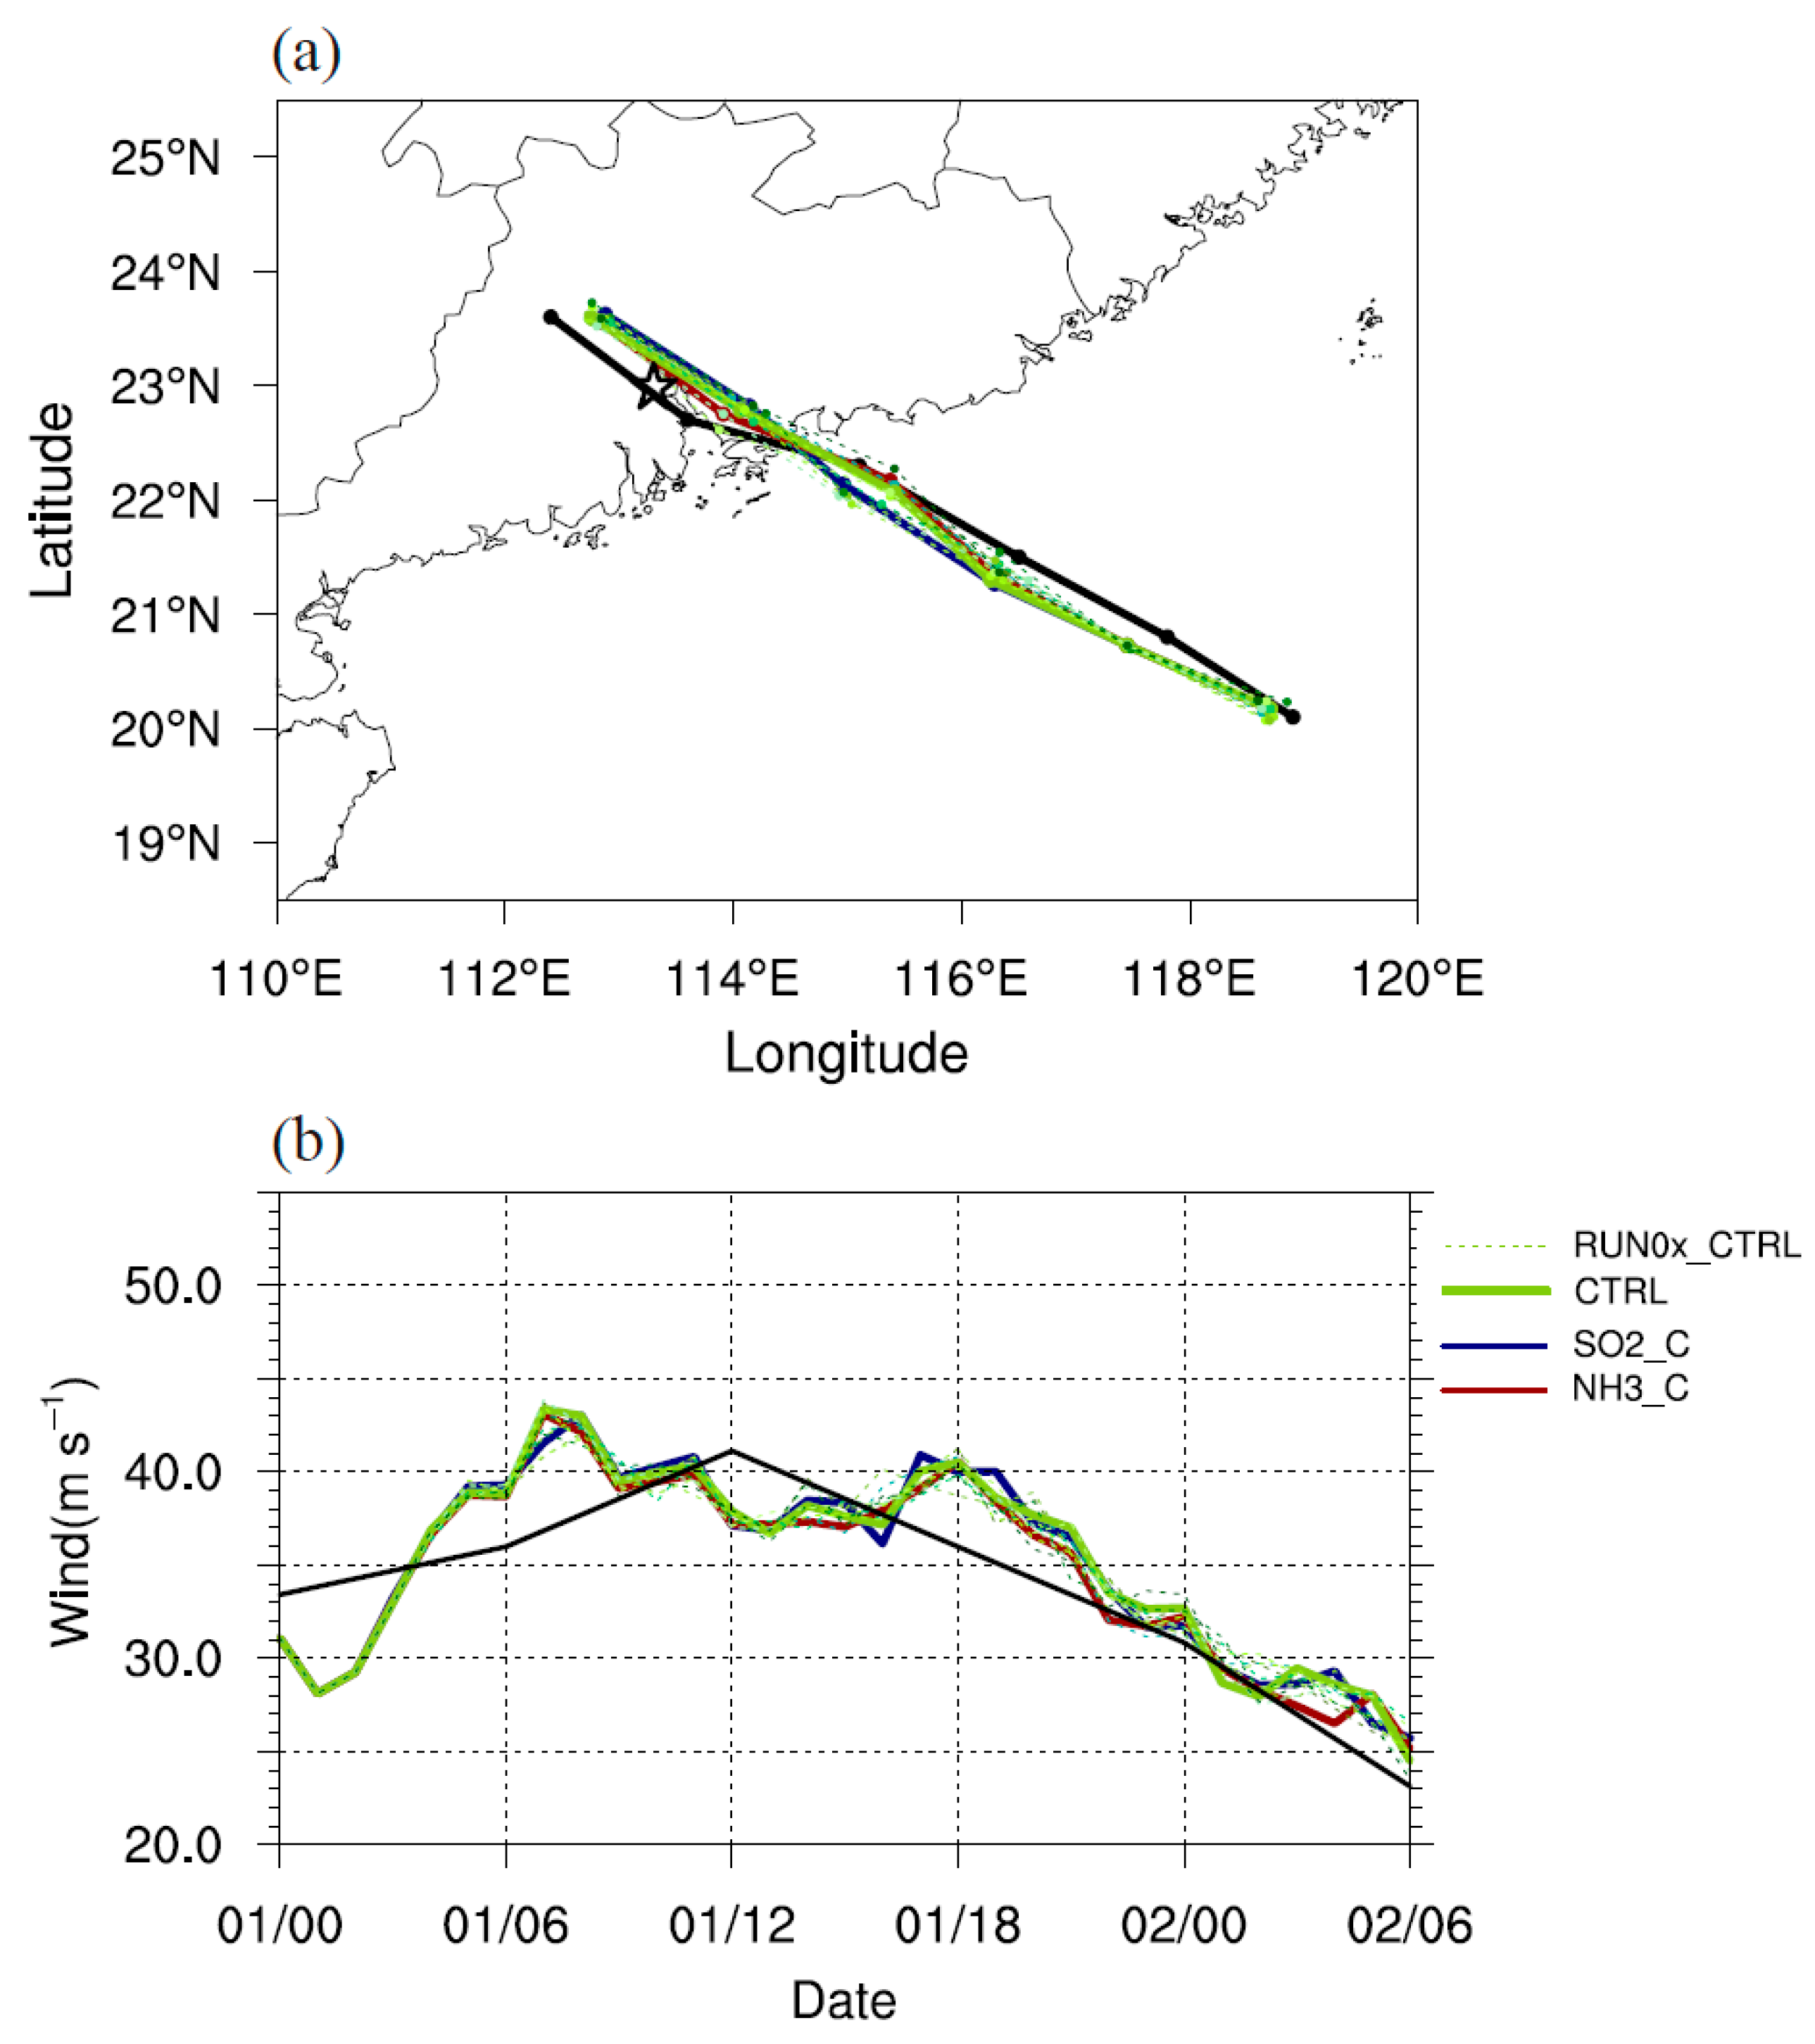
3.1. Track and Intensity

According to the best-track dataset from the China Meteorological Administration (CMA) (http://tcdata.typhoon.org.cn/zjljsjj_zlhq.html) [52], all the simulated tracks are in general agreement with the observations at 6-h intervals (Figure 3a). Based on the 10-m maximum wind speed, an intensification of the vortex is shown during the first 12 h. Once it approaches the coastline and moves inland, the vortex gradually decays (Figure 3b). Different from the observation, the simulated vortex undergoes a short-period intensification after the model spins up for the first 12 h, and continuously decays from 1800 UTC 1 August. Consistent with the previous studies [22], insignificant diversity of simulated tracks and intensities are shown among these experiments under the effects of different precursor gases penetration as well as the ensembles.

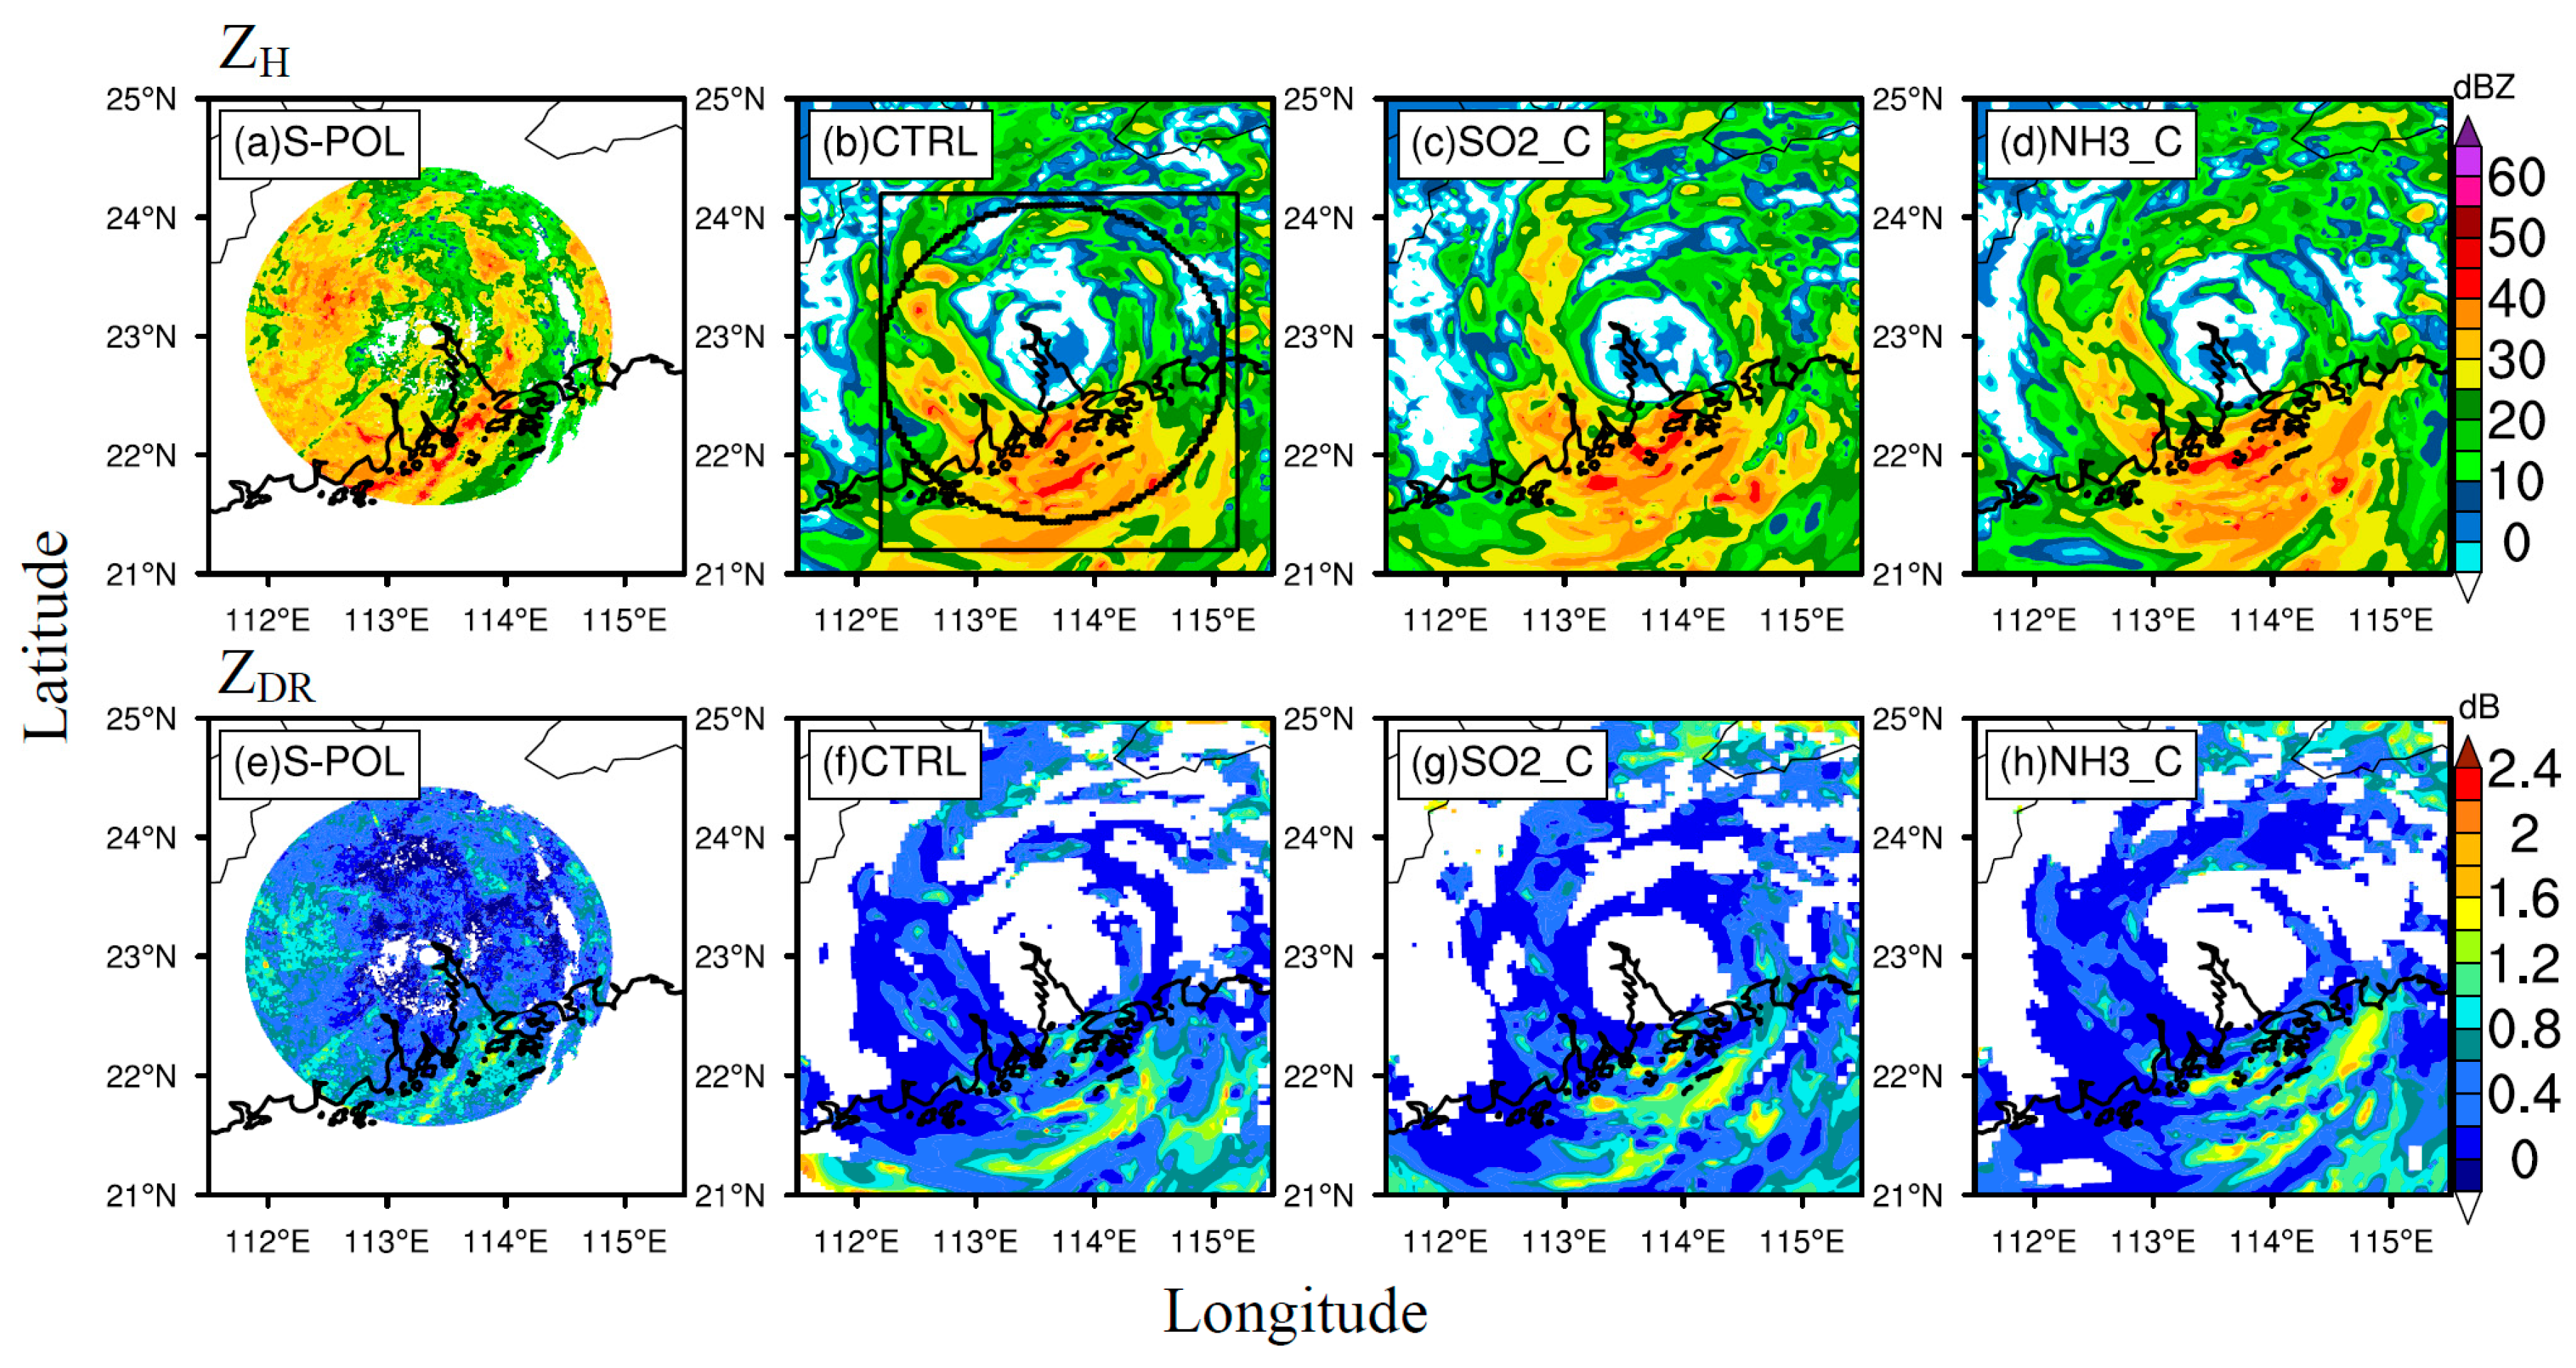
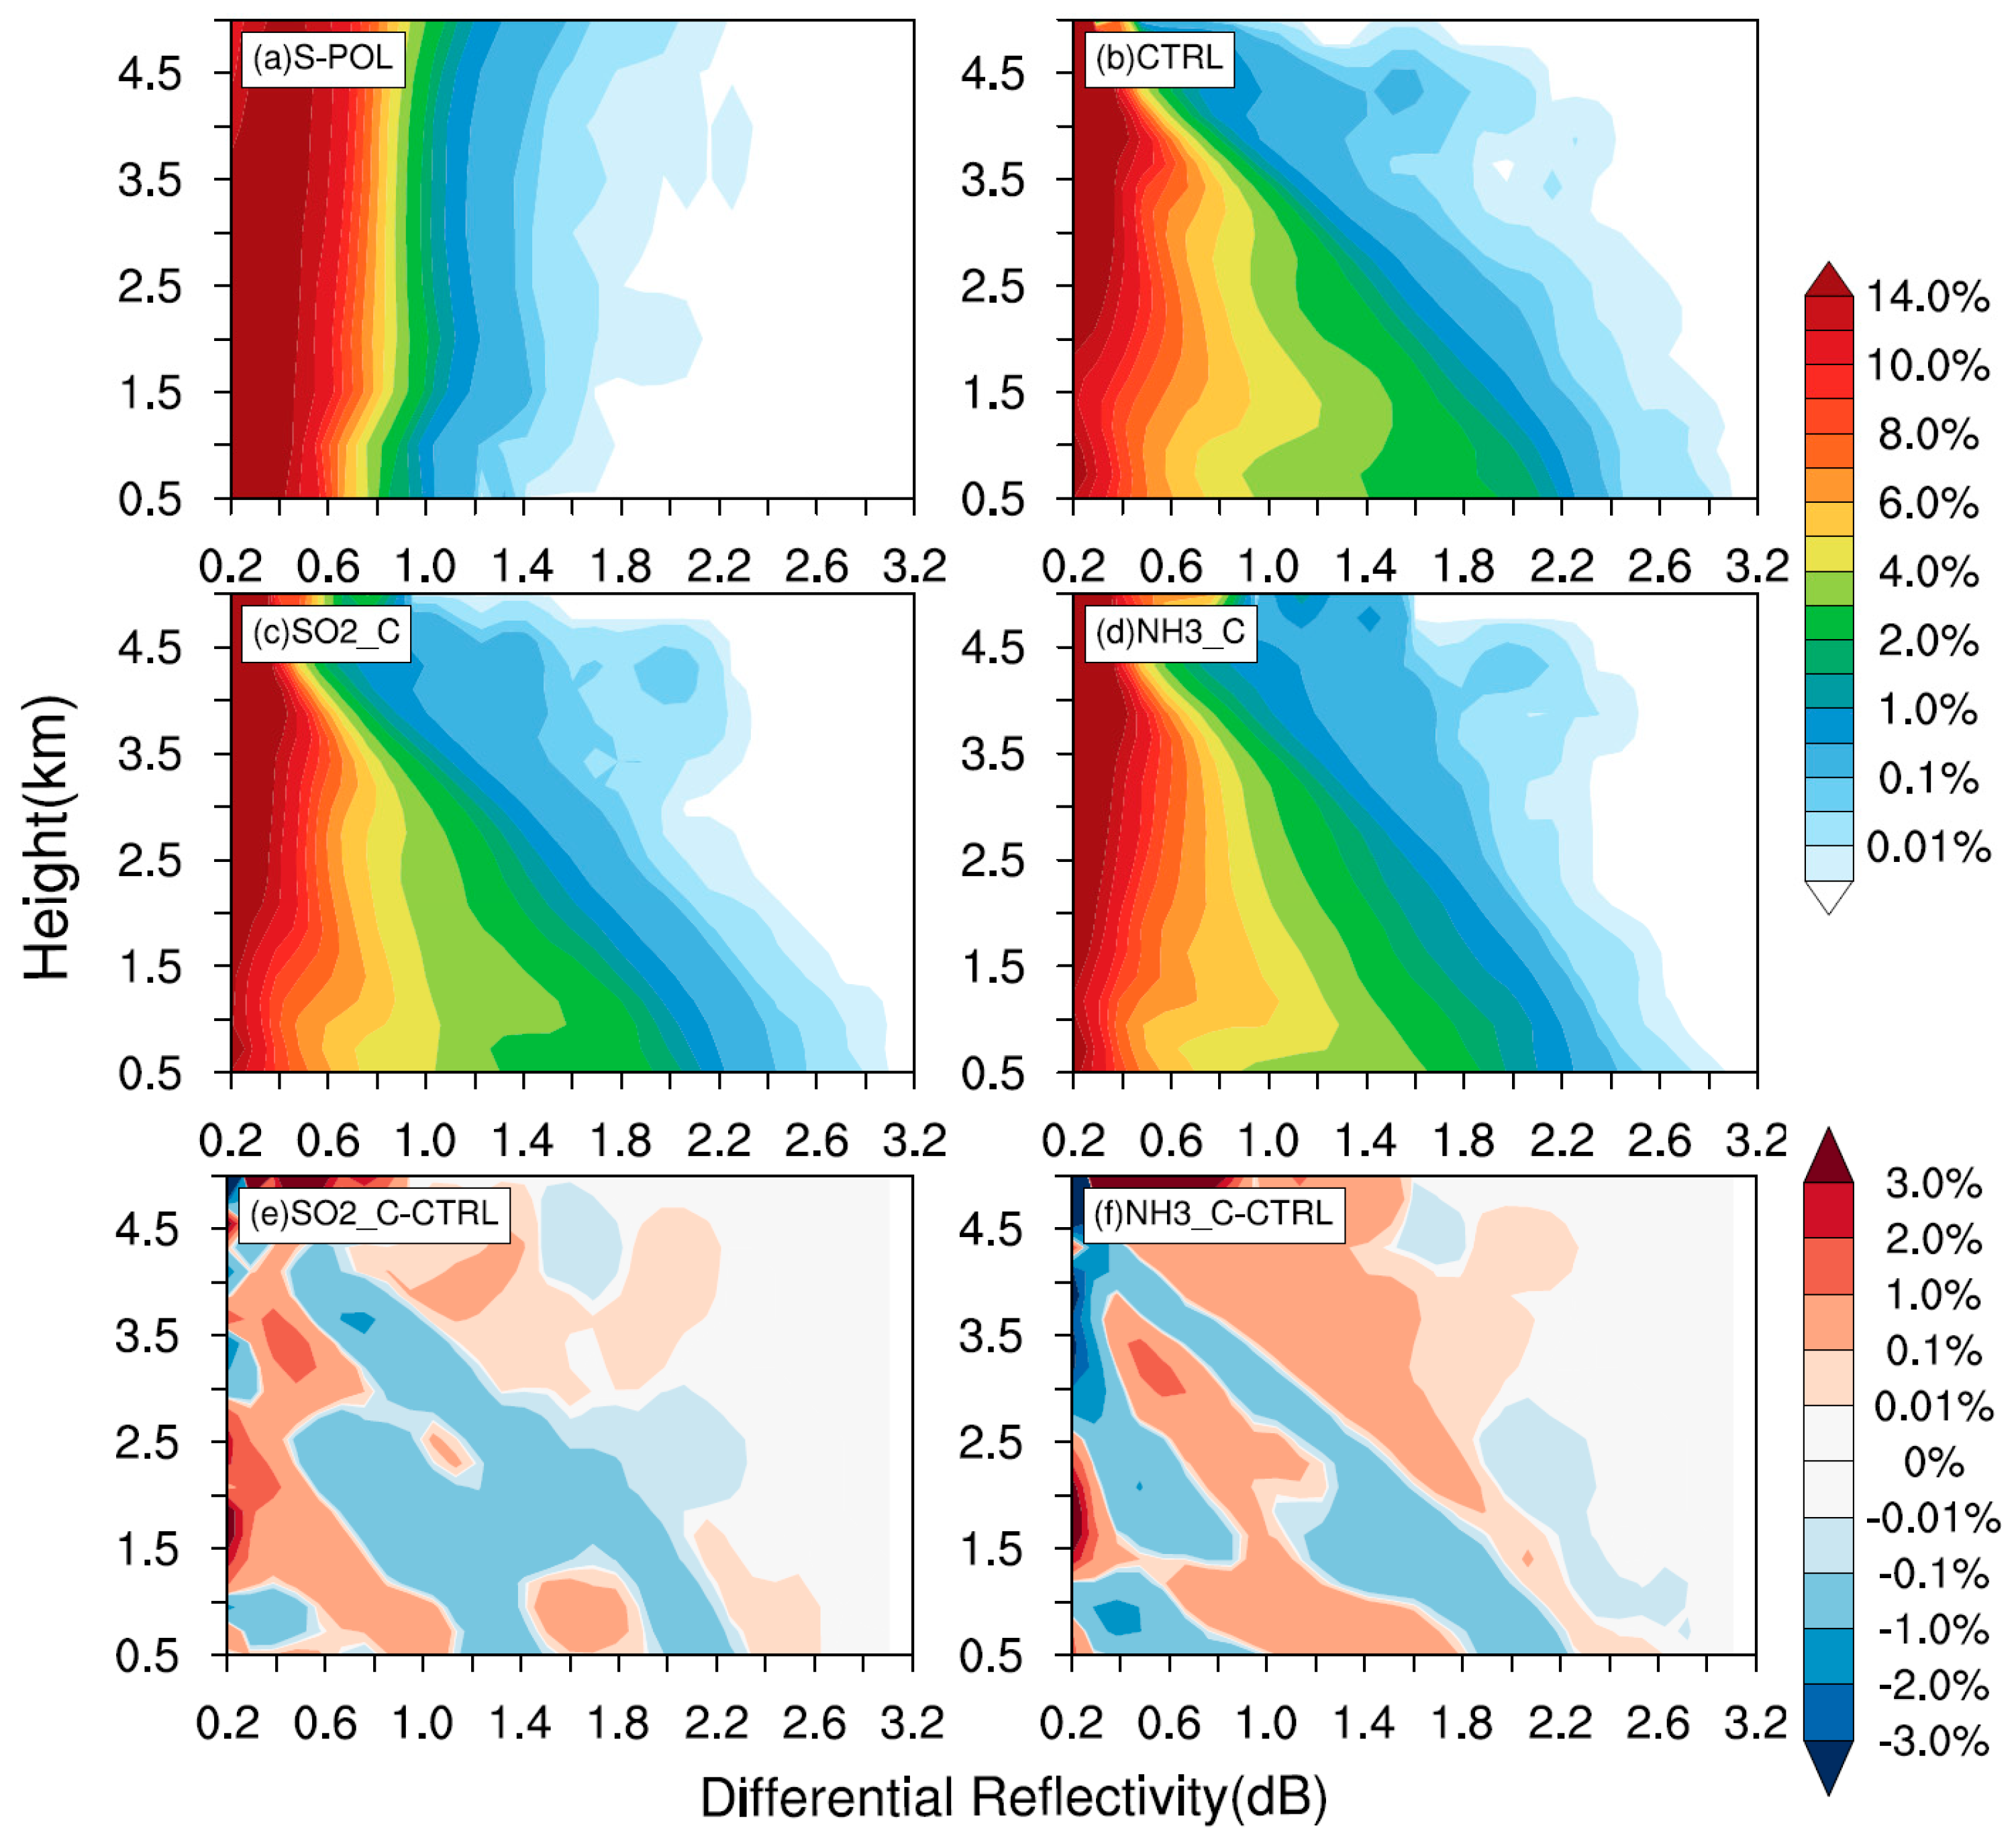
3.2. Polarimetric Radar Variables

Typhoon Nida (2016) is wholly captured by the Guangzhou polarimetric radar (23.0° N, 113.3° E) during its landfalling stage. The quality-controlled reflectivity fields [53] are interpolated to a grid dataset with horizontal/vertical spacing of 1.0-km/500-m. A polarimetric radar simulator [54,55] is used to convert the microphysical parameters from model outputs to the polarimetric radar variables and gives a direct comparison with the observation to evaluate the characteristics of hydrometeors in the simulation [32]. Based on T-matrix scattering calculations, the simulator adopts the same prescribed particle size distribution as in the model and assumes the raindrops be oblate spheroids. Figure 4 firstly depicts the horizontal distributions of observed and simulated Z H and Z DR at 3-km height at 0200 UTC 2 August when the core of vortex moves across the radar from the three certain runs.
With the disruption of the structure due to the landfall, high Z H and Z DR values mainly locate at the western and southern parts of Typhoon Nida (2016), which is consistent with the intensity of the convection therein. Three certain simulations reasonably reproduce the polarimetric radar variables but with somewhat underestimation of Z H and Z DR at the western part of the storm. Since the Z DR exclusively correlates with the size of raindrops in the radar detective volume and is commonly used to represent the raindrop size distribution (RSD), the contoured frequency by altitude diagrams (CFADs) of Z DR are thus calculated for further evaluating the vertical characteristics of the raindrops (Figure 5). Both the samples at 0200 UTC and 0300 UTC 2 August within the black solid square in Figure 4b are involved for the analysis to decrease the time-space mismatch between the observations and simulations. The largest proportion of observed Z DR is concentrated at around 0.4 dB at low layers, which is probably attributed to the smaller-sized raindrops produced by significant accretion and breakup process therein, while larger Z DR gradually exhibits in the higher levels. When we focus on the larger frequency of Z DR (e.g., 4 % ), all the certain simulations exhibit a similar distribution pattern, which mainly concentrates less than 1.0 dB, and is a little larger than the observation. Note that the percentage of occurrence of large simulated Z DR is increasing toward the ground, implying the small-amount but large-sized raindrops present in the lower layer. This is different from that of the polarimetric radar observation. The prescribed exponential RSD in Morrison microphysics scheme is one of the reasons that induces such larger-sized raindrops with obvious extreme large Z DR (e.g., 2   dB ). The decreasing radar detective area toward the ground should be another important factor for the discrepancy at a lower troposphere. Compared among these certain experiments, smaller (larger) occurrence frequency of ZDR with the moderate value of 1.0–1.6 dB in the low troposphere can be seen in SO2_C (NH3_C) run (Figure 5e,f), which demonstrates the opposite effects of different precursor gaseous emissions on the raindrop size distribution within the vortex after its landfalling.

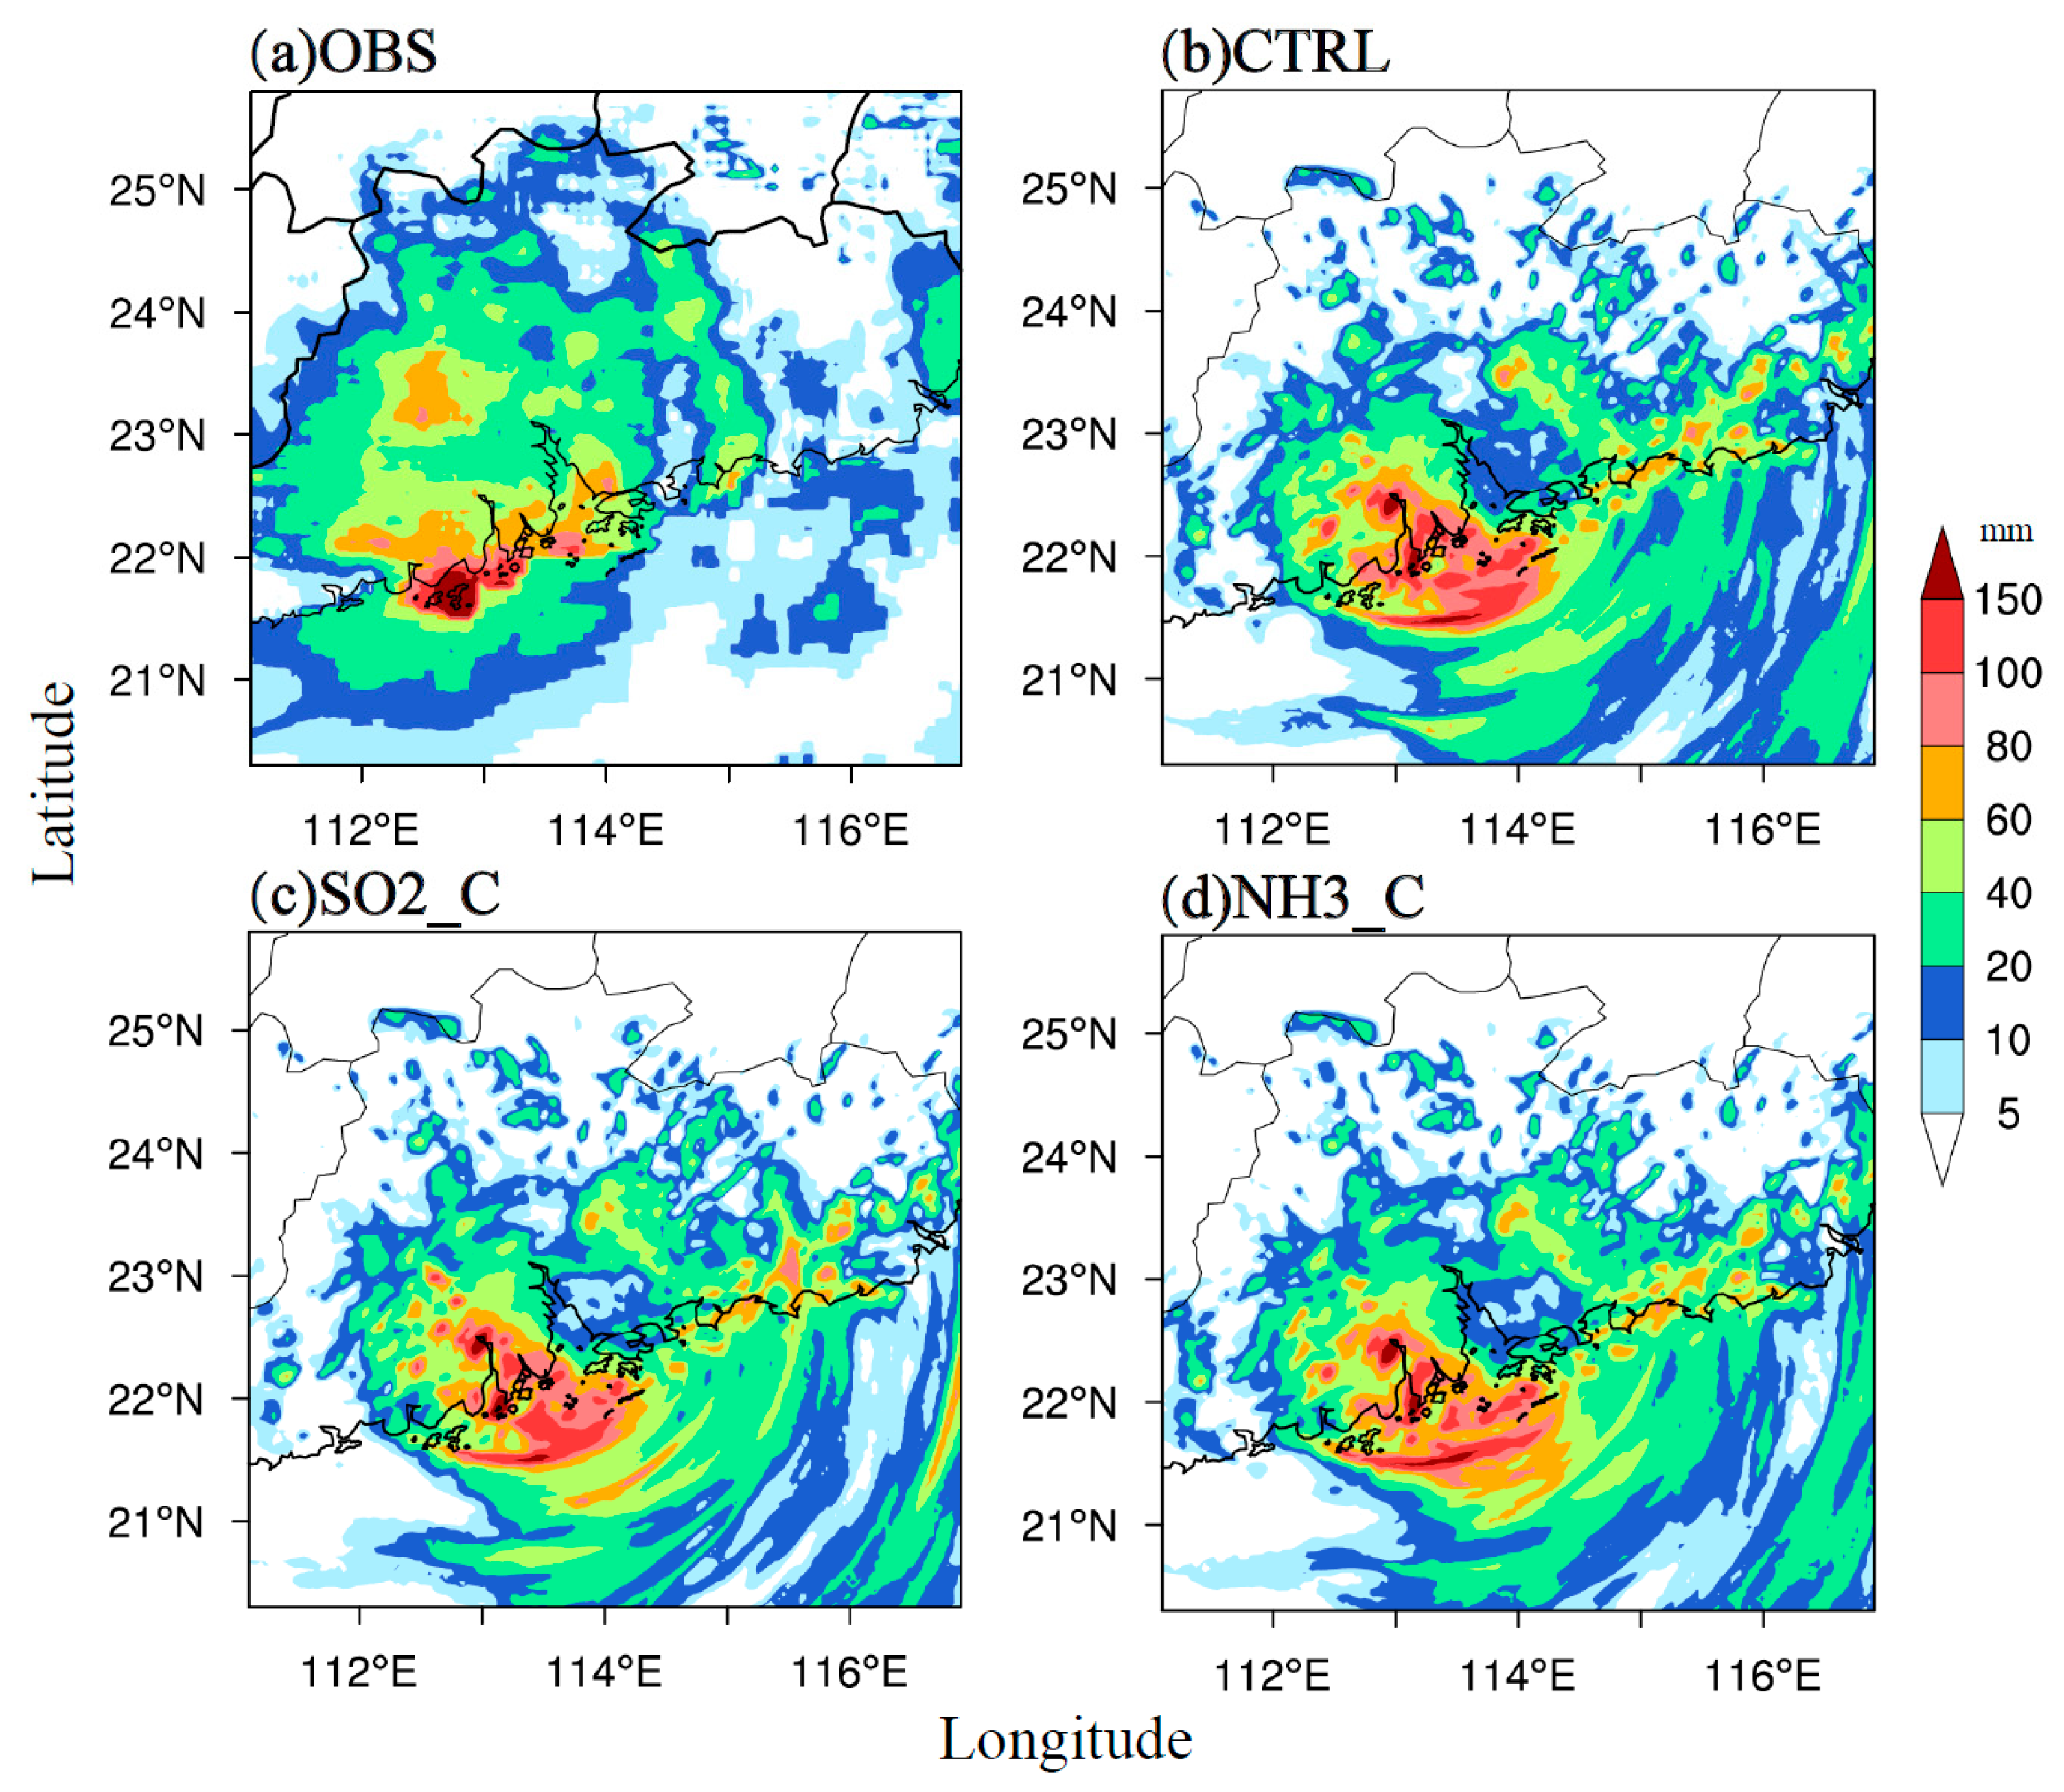
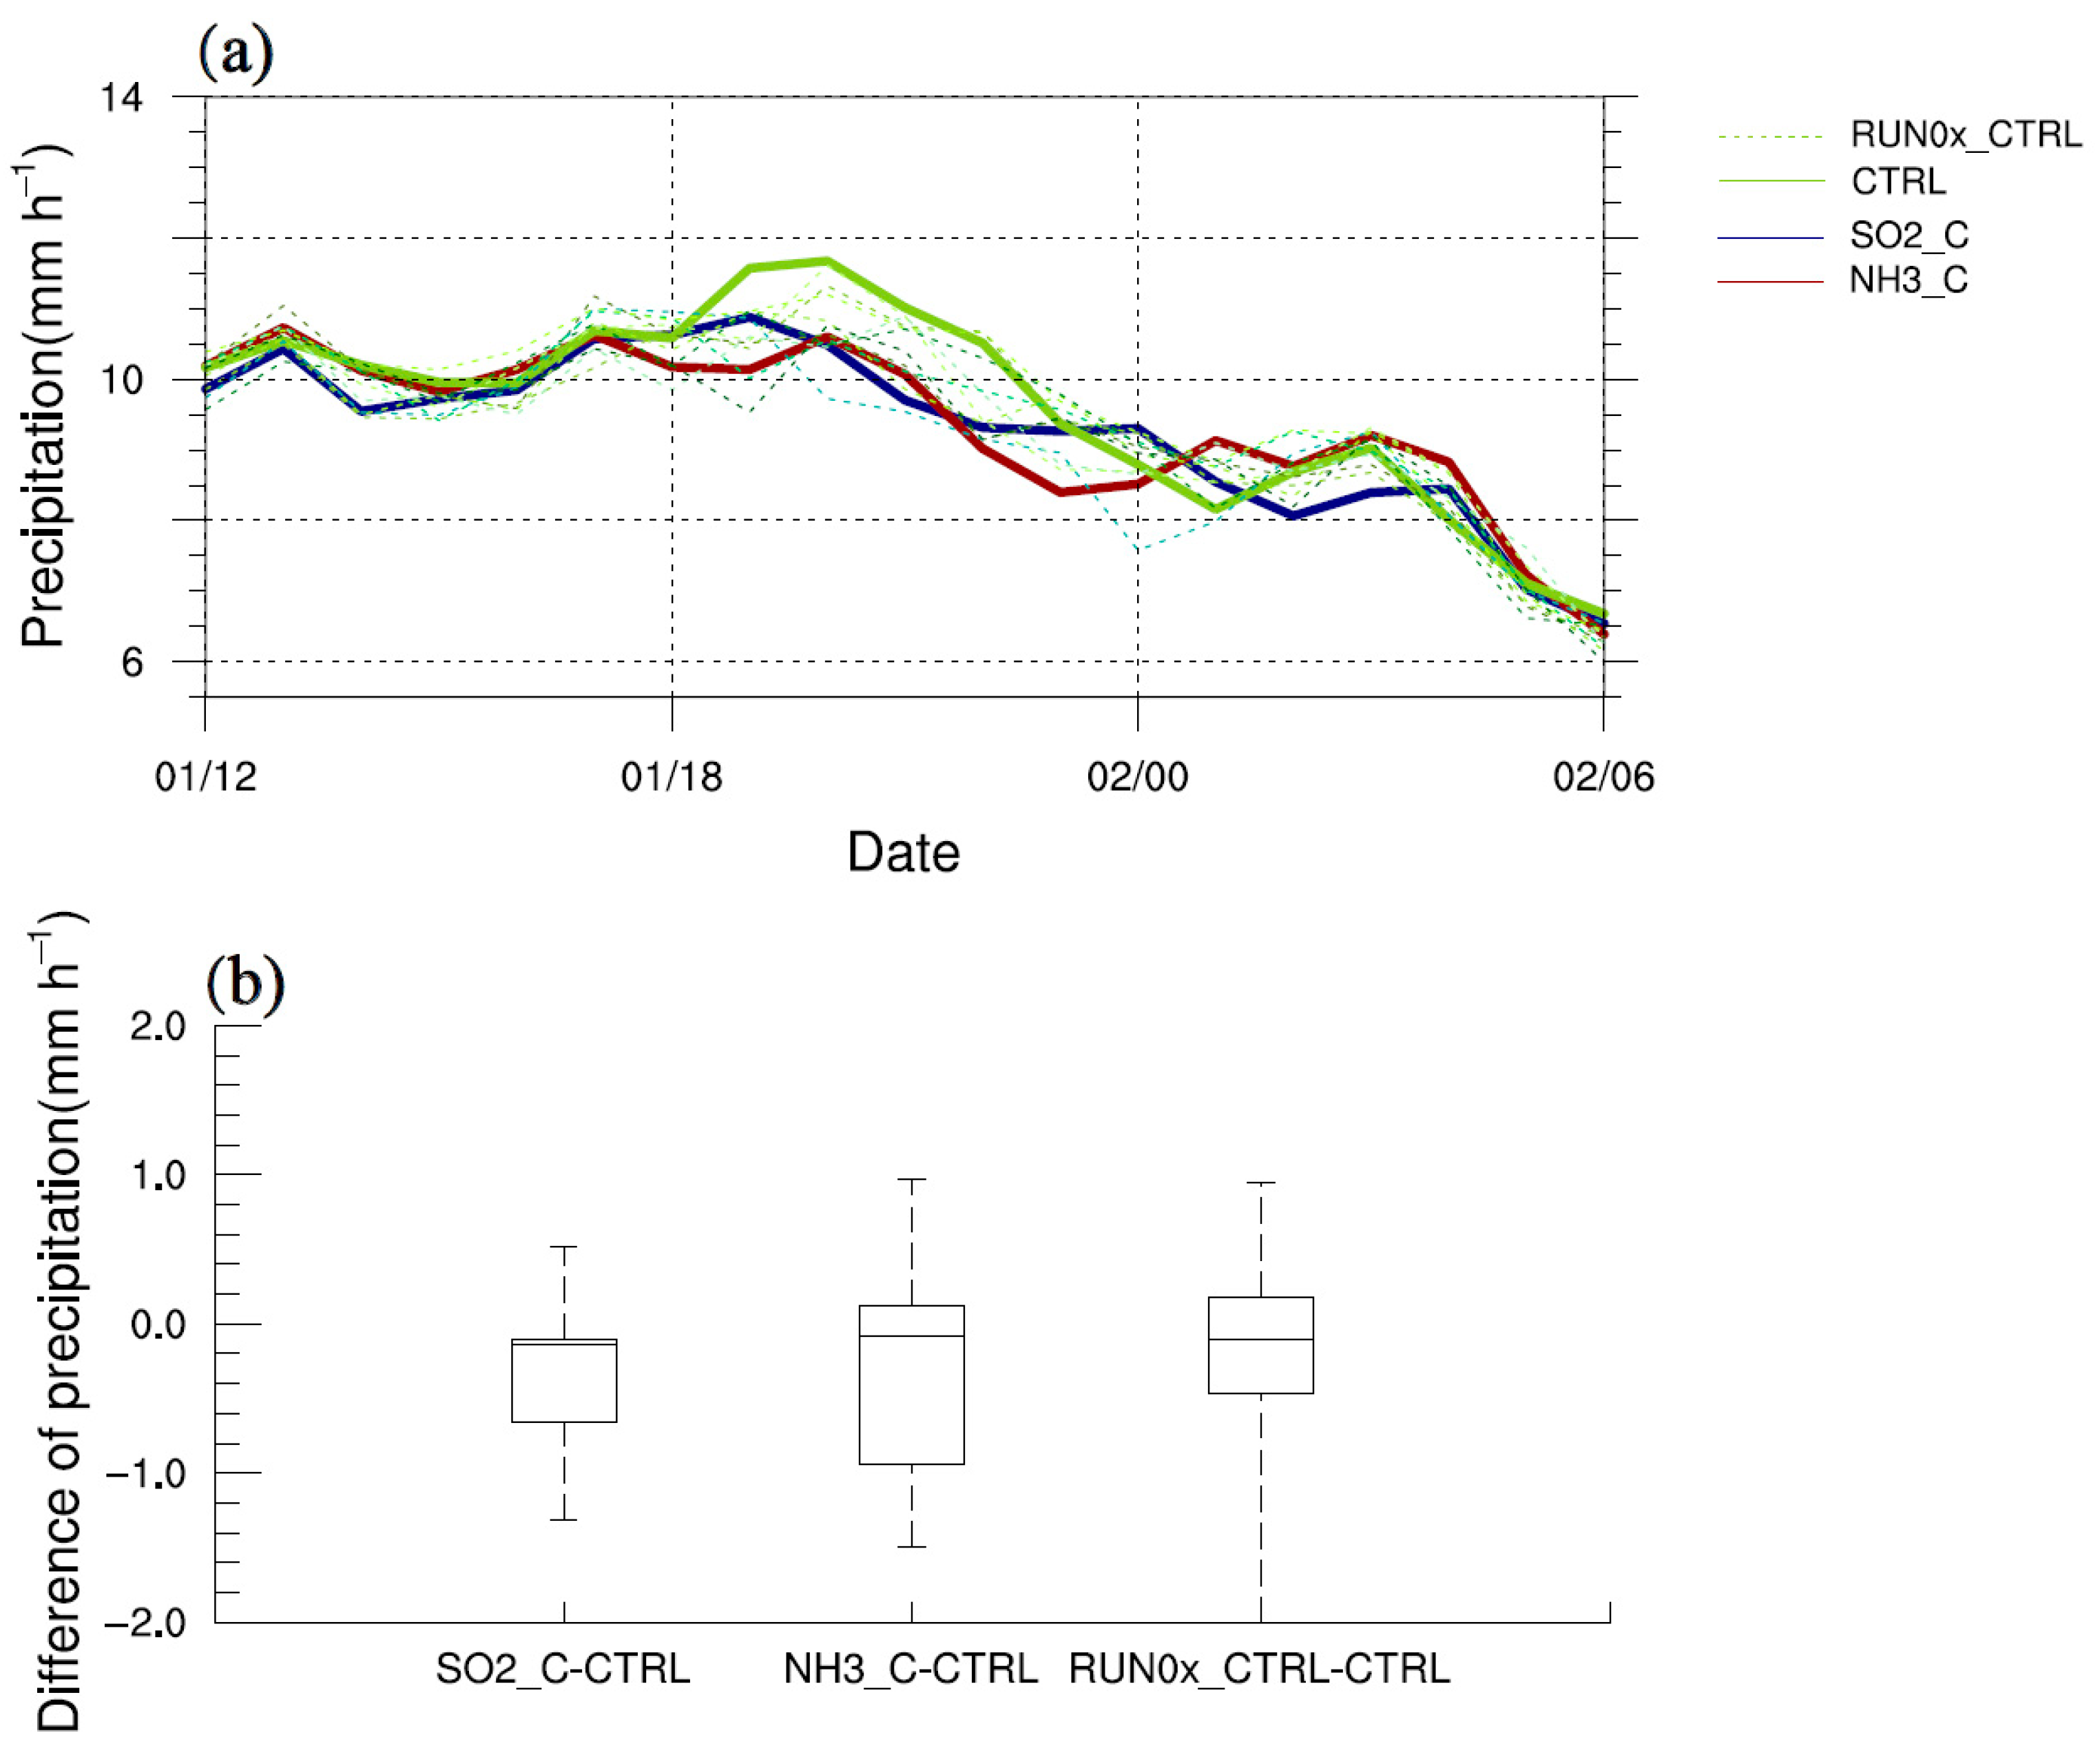
3.3. Surface Precipitation

The satellite-gauge hourly precipitation products with horizontal spacing of 0.05° by merging the Climate Precipitation Center Morphing (CMORPH) precipitation and automatic rain gauges data [56] are used to access the model precipitation. The spatial distribution of 6-h accumulated precipitation after the TC landfalling from 0000 UTC to 0600 UTC 2 August is in general agreement with the observation as the heavy rainfall locates at the western and southern parts of the vortex (Figure 6). The locations of heavy precipitation (e.g., >60 mm) mainly lie in the coastal region, which is more likely due to the land-sea contrast. The areas of heavy precipitation among the certain runs are larger than that of observation due to the stronger vortex produced from the model (Figure 3b). The similar features of simulated accumulated precipitation are consistent with the previous results regarding the continental convective systems [57,58], that relatively small influence on precipitation can be induced by the anthropogenic aerosols as the combined effects of dynamical and cloud microphysical processes.
However, the evolution of area-averaged precipitation rate within the radius of 150 km from vortex center among certain runs shows evident difference (Figure 7a). Here, only rainfall rate that exceeds 1.0   mm   h 1 are involved for analysis. The TC-induced rainfall intensity under base-level emission is clearly larger than that in SO2_C and NH3_C runs before 2300 UTC 1 August. But, after the vortex makes landfall, the strongest precipitation rate is present in NH3_C run, which should be consistent with the simulated larger median Z DR in it. An oscillation of precipitation rate compared with CTRL run occurs when the emission intensity of SO 2 reduced for 90% (SO2_C). The precipitation rate between 0200 UTC and 0300 UTC 2 August in the SO2_C run is smaller than that in the CTRL run, which also reflects as a smaller median Z DR in it (Figure 5). Nevertheless, the precipitation behaviors from the ensembles repeatedly show that the precipitation rate in CTRL run is stronger when the core of vortex locates on the ocean. Larger negative deviation of area-averaged precipitation rate can be traced in the SO2_C and NH3_C runs than that in the ensemble runs (Figure 7b). Even so, it should be reminded that the white noise perturbation introduced into the potential temperature field, is closely related to the conditional instability at the lower atmosphere [51], which is favorable to trigger new convection, leading to such discrepancy of precipitation. Thus, the notable different characteristics of raindrops, as well as rainfall rate among the certain runs, can be treated as one of the reasonable but not definite results, and it is worth further exploring why the reduction of SO 2 and NH 3 causes diverse effects on the cloud microphysics and ultimate precipitation after typhoon landfalling. As the cloud droplets act as key hydrometeor to form and alter the raindrop size distribution, the evolution of mixing ratio and number concentration of cloud droplets and raindrops are hence discussed as follows.

4. Discussion

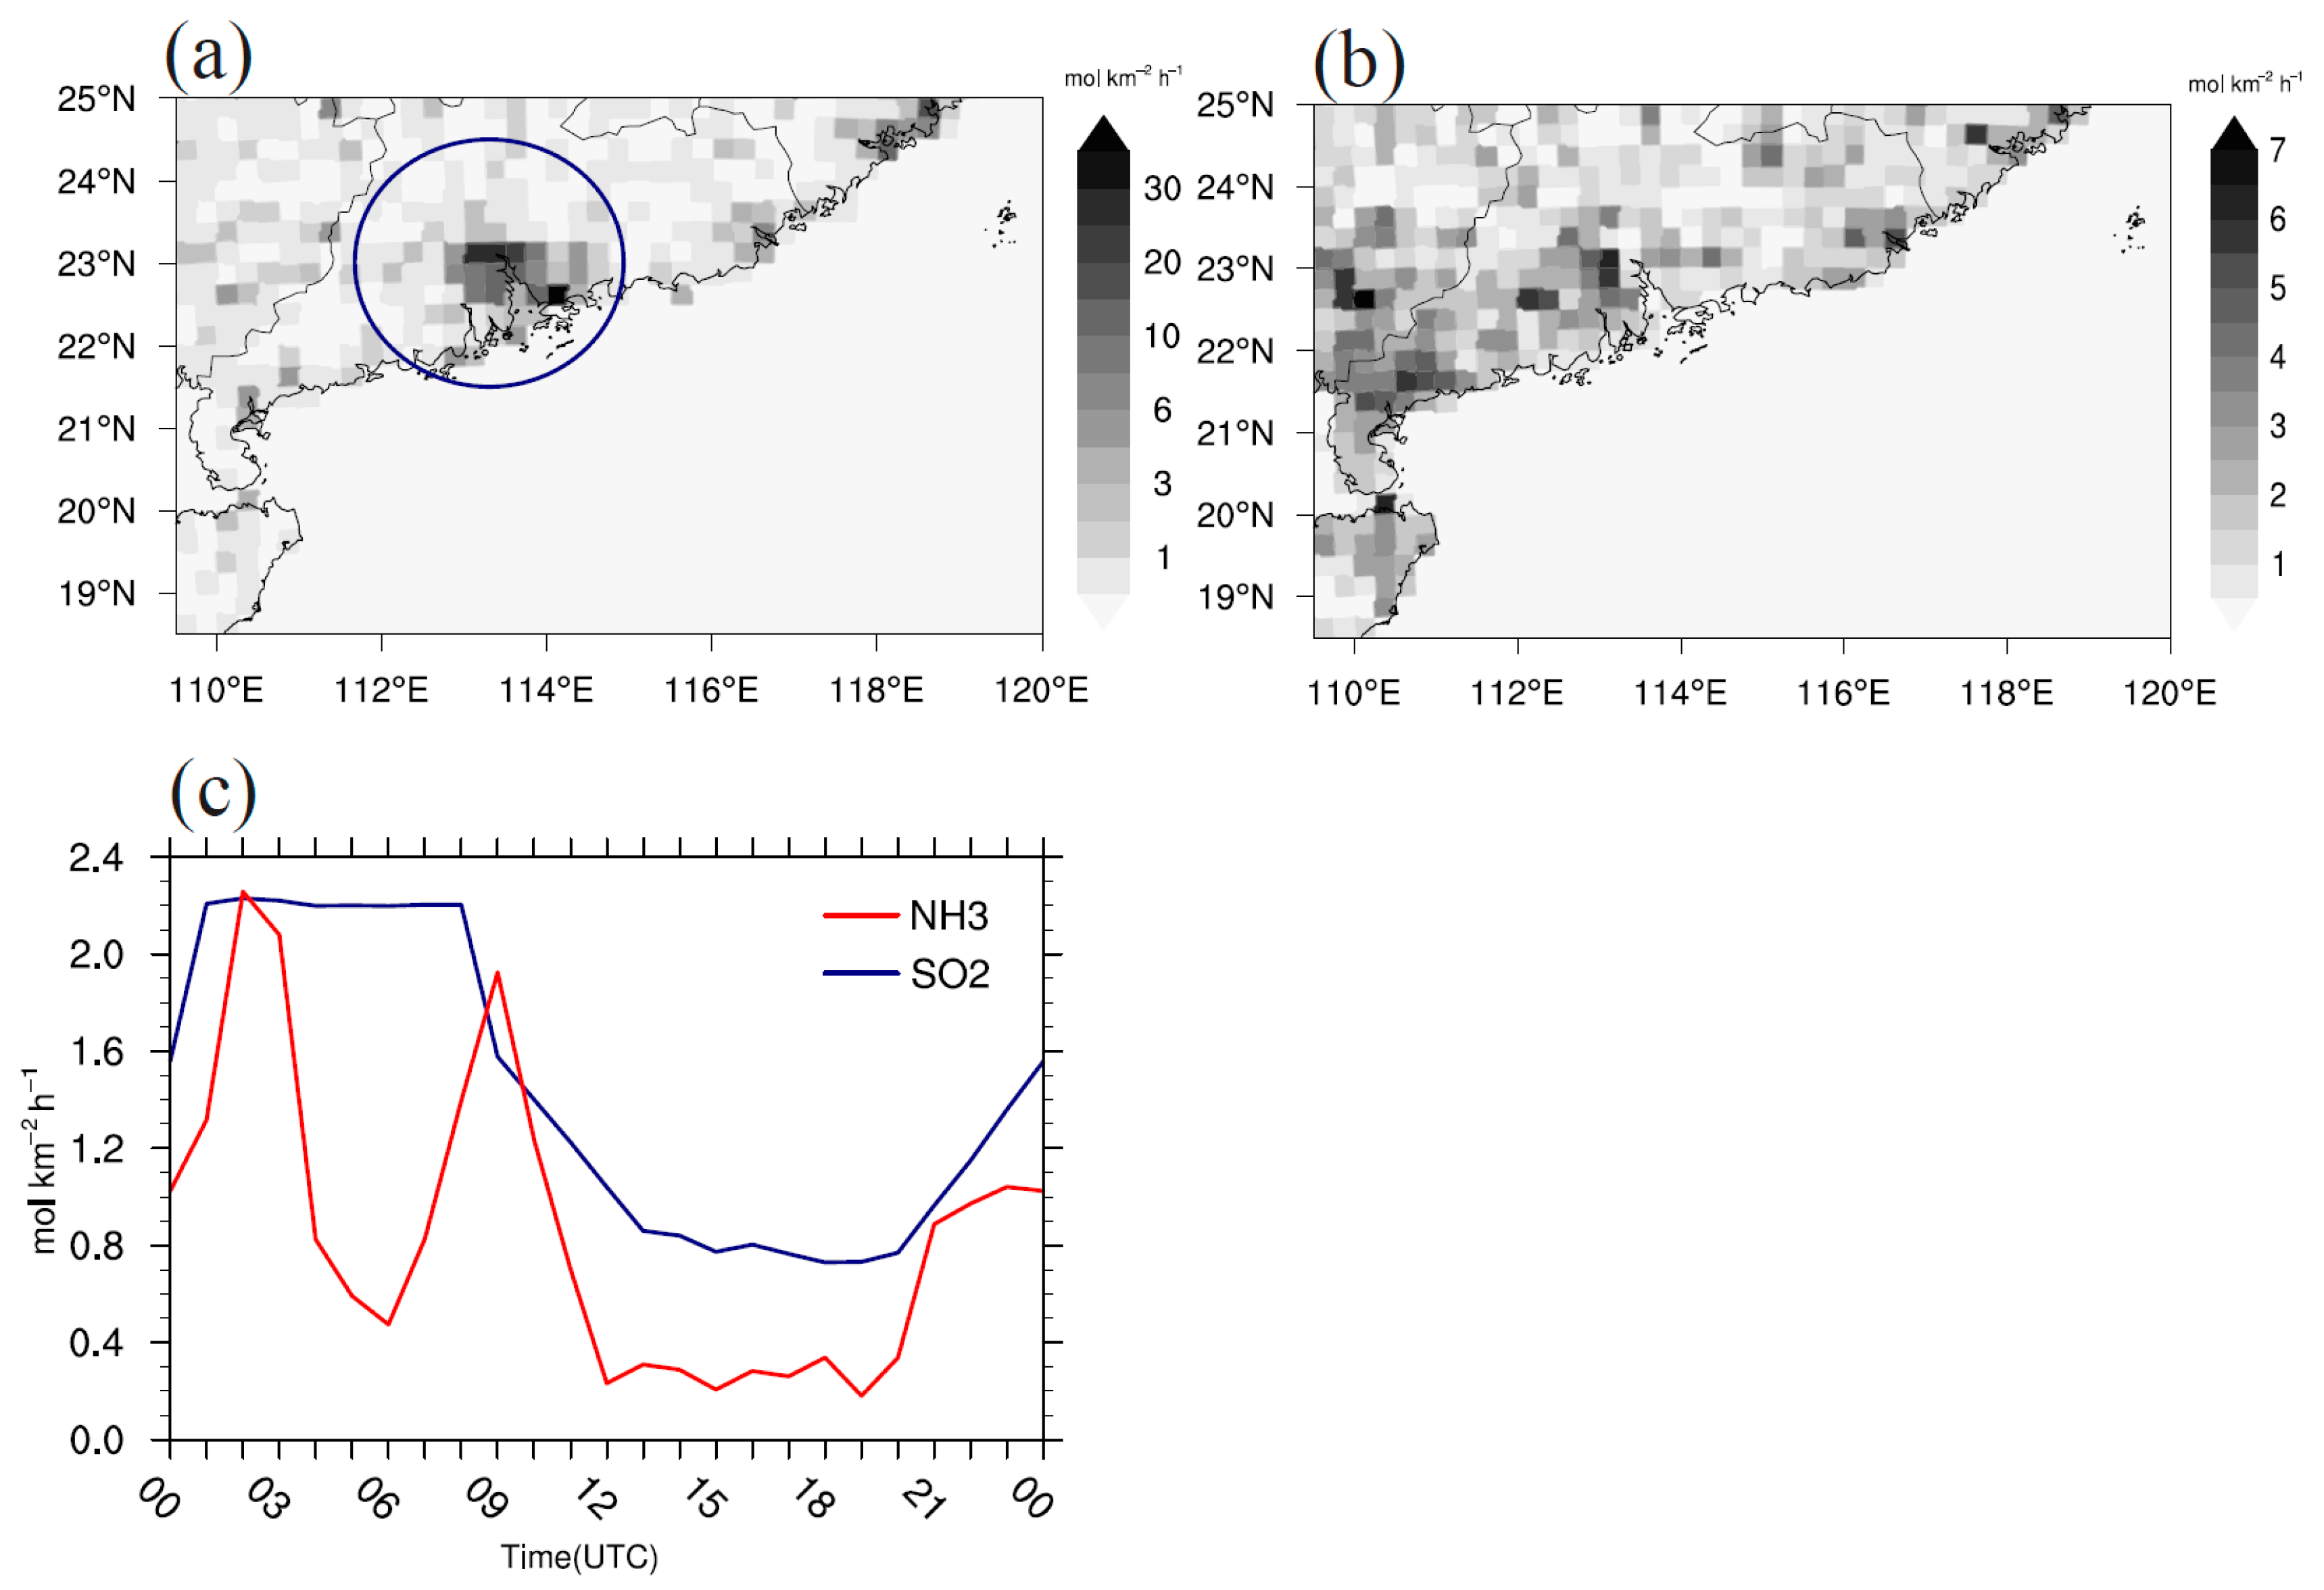
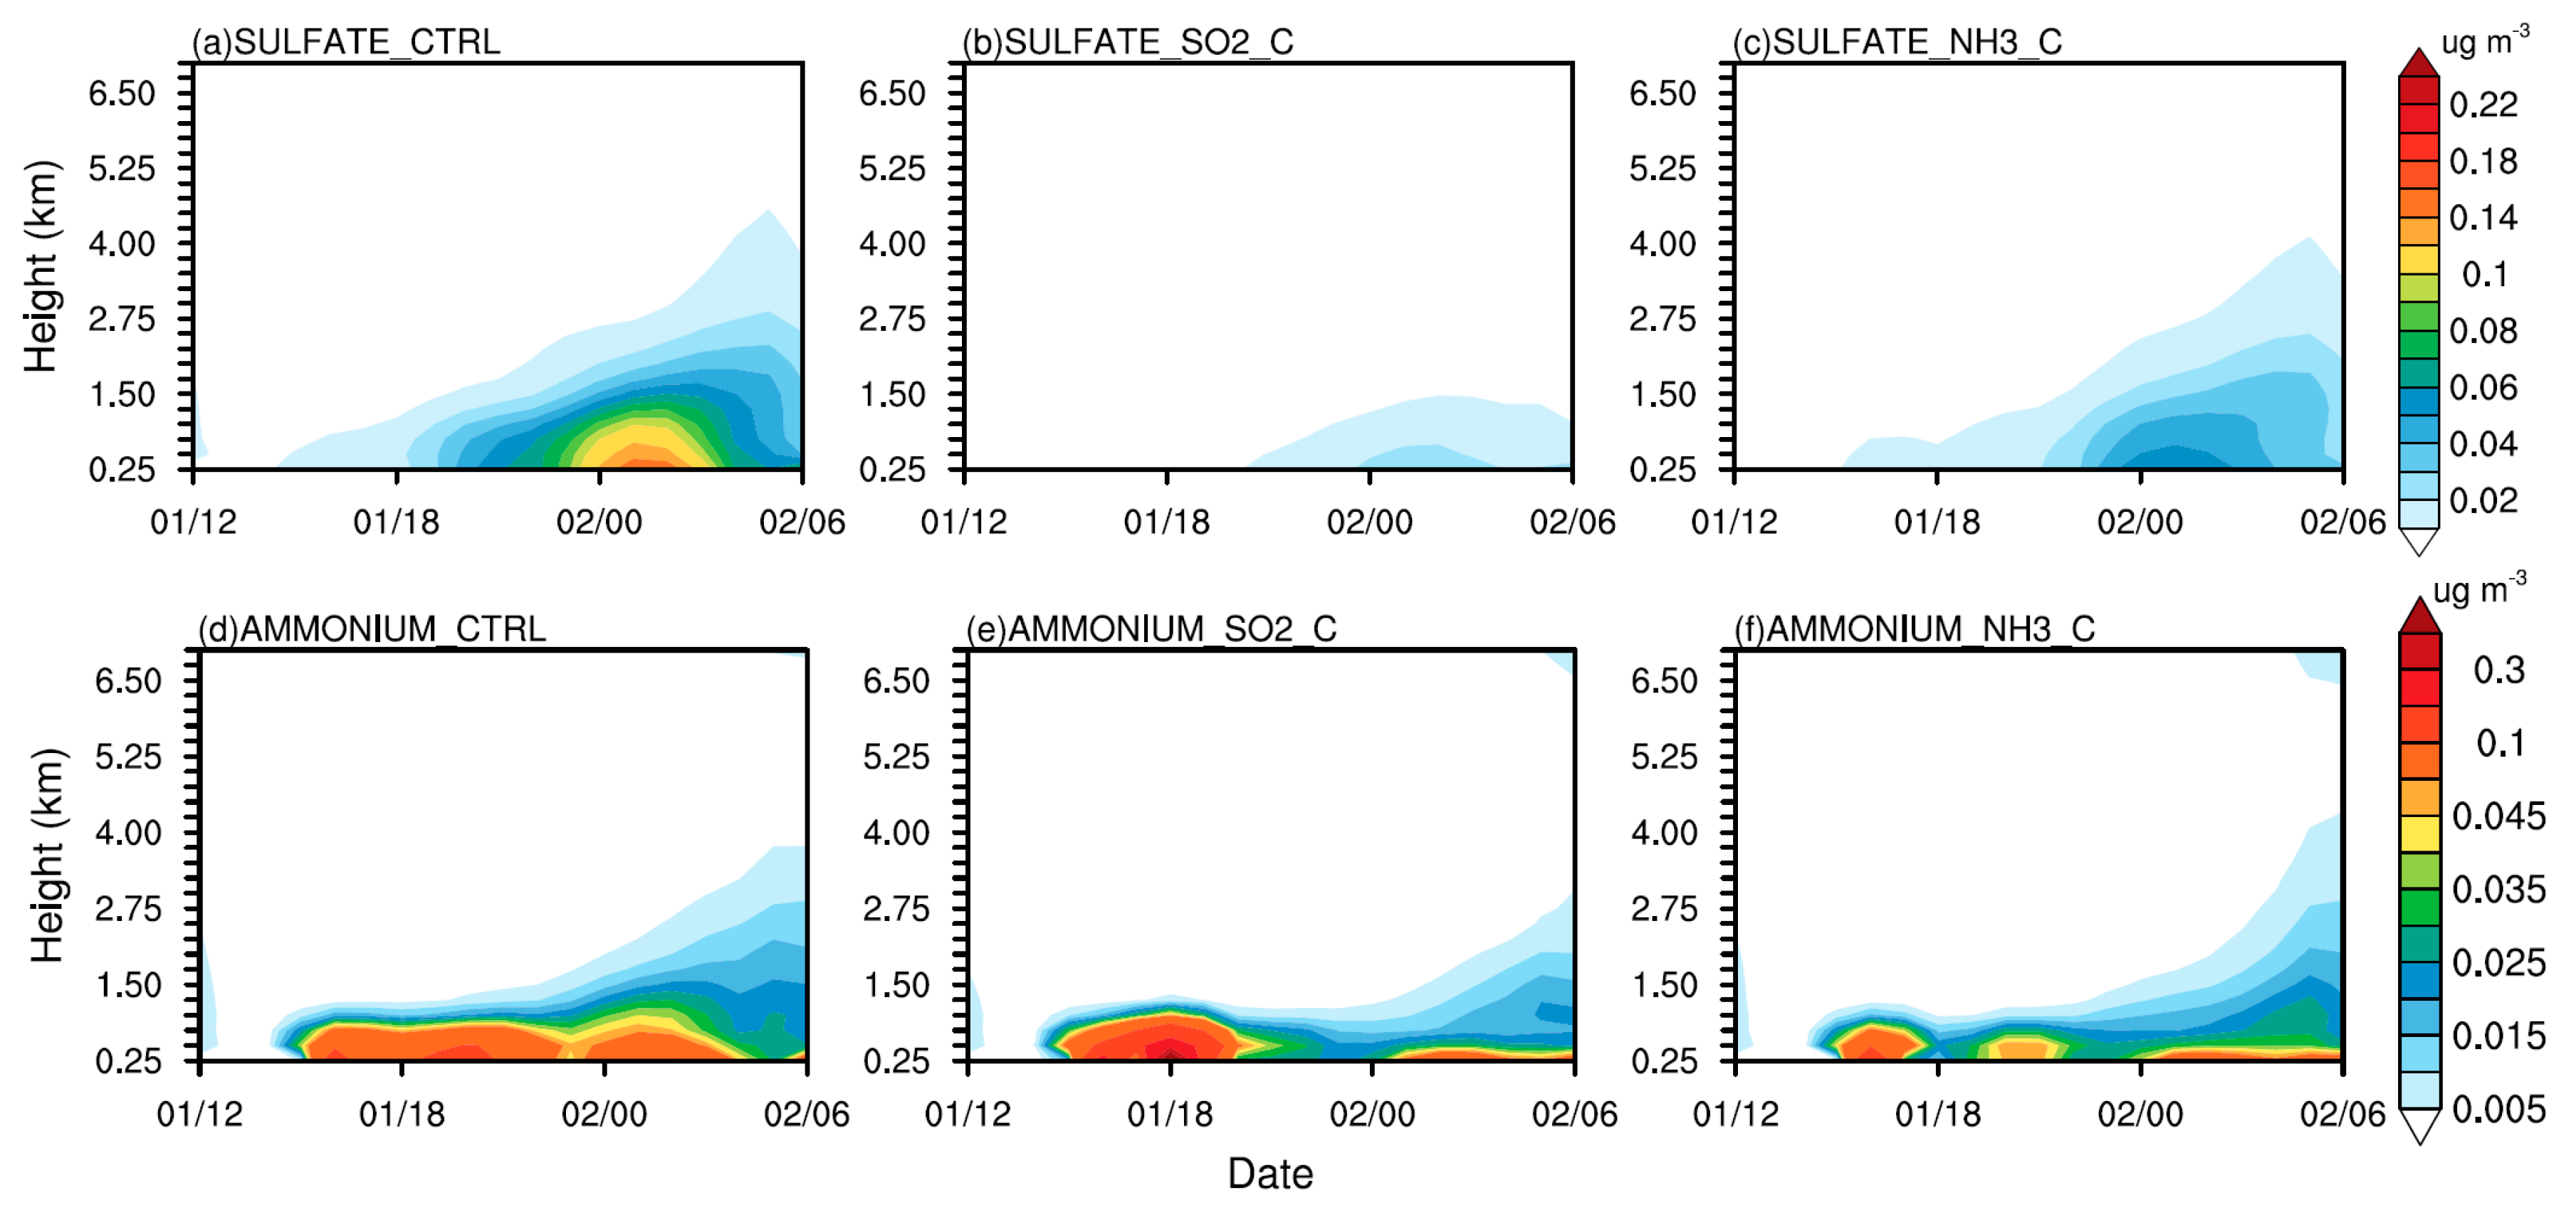
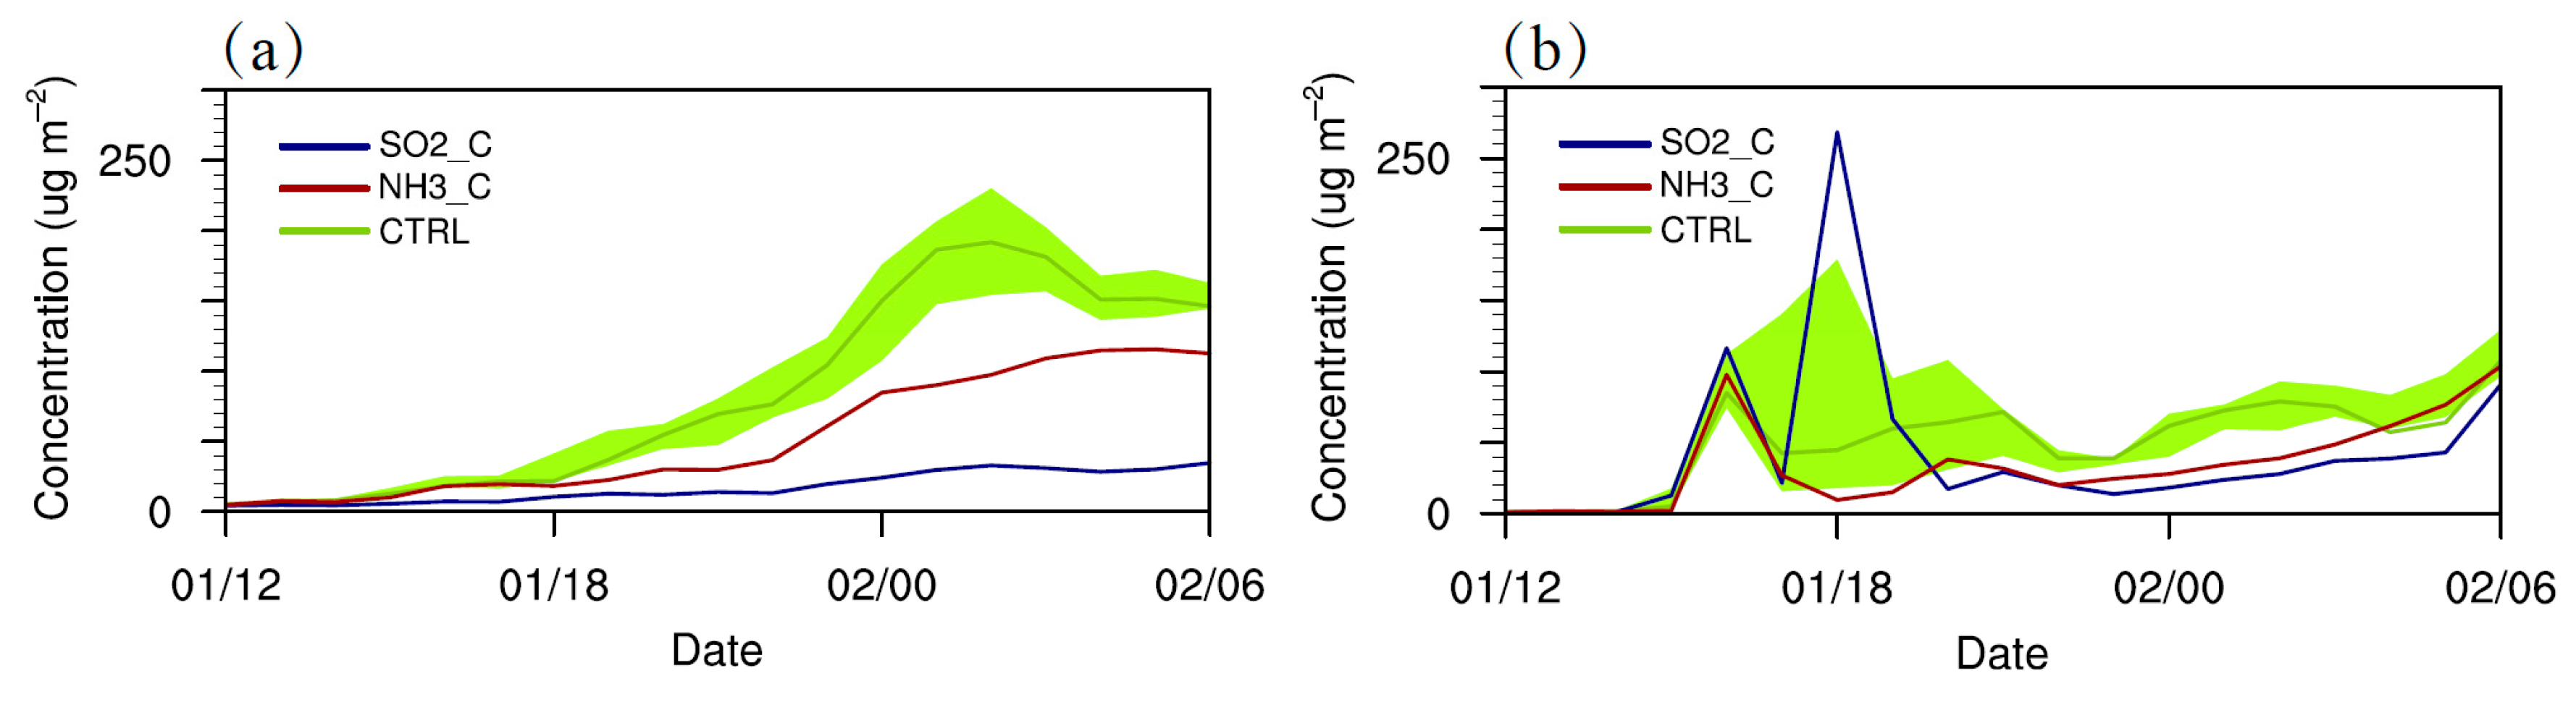
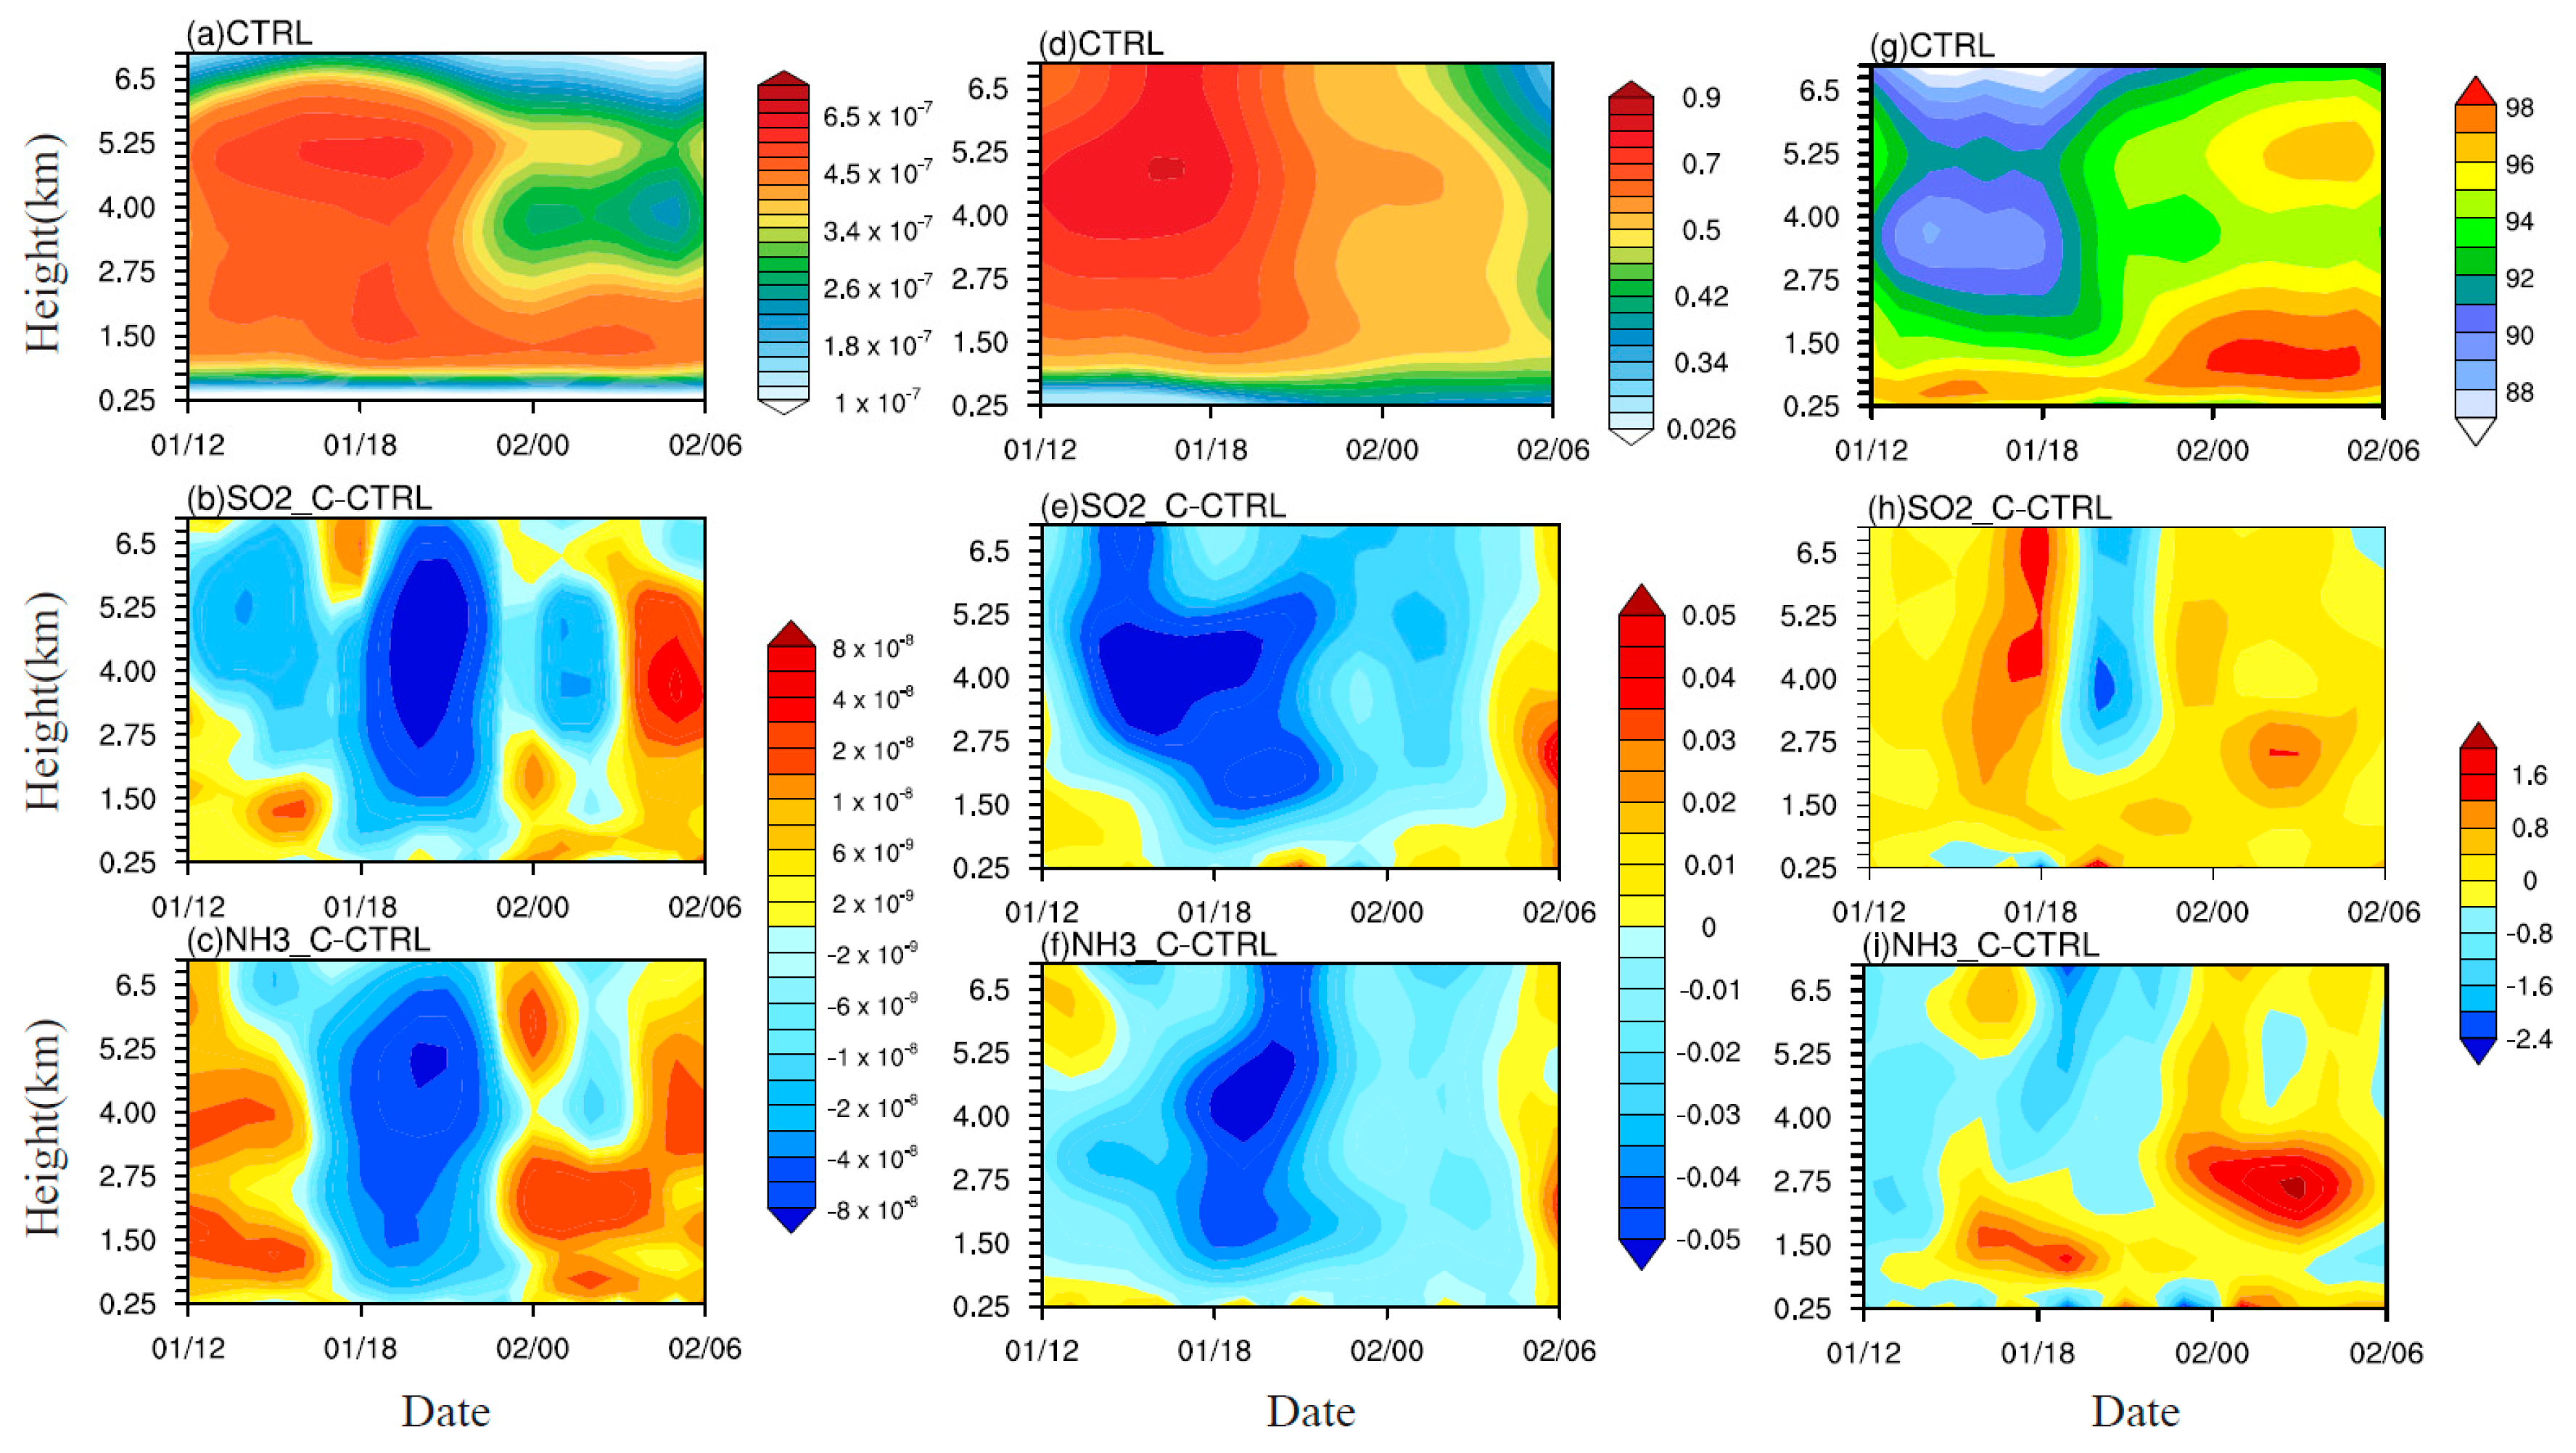
4.1. Evolutions of the Inorganic Aerosols

Since SO 2 and NH 3 are the precursor gases for the production of sulfate ( SO 4 2 ) and ammonium ( NH 4 + ), reducing the emission intensity of these two gases will inevitably change the concentration and spatial distribution of the relevant inorganic aerosols, which can act as CCN in the air. When the typhoon system moves toward the mainland, a large amount of water vapor is transferring to the coastline by the outer circulation of the vortex, changing the saturation therein and enhancing the activating efficiency of CCN. Besides, some of the local-formed inorganic aerosols can also be loaded upward and spiral into the vortex without being converted to cloud droplets. To answer the raised question mentioned above, the height-time evolutions of SO 4 2 and NH 4 + within 150-km radius from the storm center are firstly depicted to illustrate these aerosol compositions in the main circulation of the vortex during its approaching to the mainland (Figure 8).
The comparisons between the two certain experiments show that (1) the reduction of one kind of precursor gaseous emission will simultaneously lead to the decrease in the corresponding aerosol and variations of the other species. e.g., the SO 4 2 and NH 4 + are both significantly decreasing in the SO2_C or NH3_C runs. The probable reason is that the main source of sulfate aerosol is atmospheric oxidation of SO2 to H2SO4, and the sulfate aerosols can be partly or totally neutralized by NH3 [45]. Reducing either the SO2 or the NH3 can cause this chemical reaction to weaken. (2) The production of NH 4 + at night are quicker than that of SO 4 2 , and large amounts of NH 4 + are entrained into the vortex when it still moves over the ocean (Figure 8a,d). Therefore, such changes of anthropogenic gaseous emissions are believed to result in the subsequent variations of cloud microphysics. In addition, the area-averaged vertically-integrated concentration of SO 4 2 and NH 4 + in the certain and ensemble runs are shown in Figure 9. Remarkable reduction of SO 4 2 can be detected in both SO2_C and NH3_C runs when comparing with the ensembles. Note that the sudden increase of NH 4 + at 1800 UTC 1 August in SO2_C run is just due to the average within the 150km radius (the NH 4 + exists exactly in the edge of the study area).

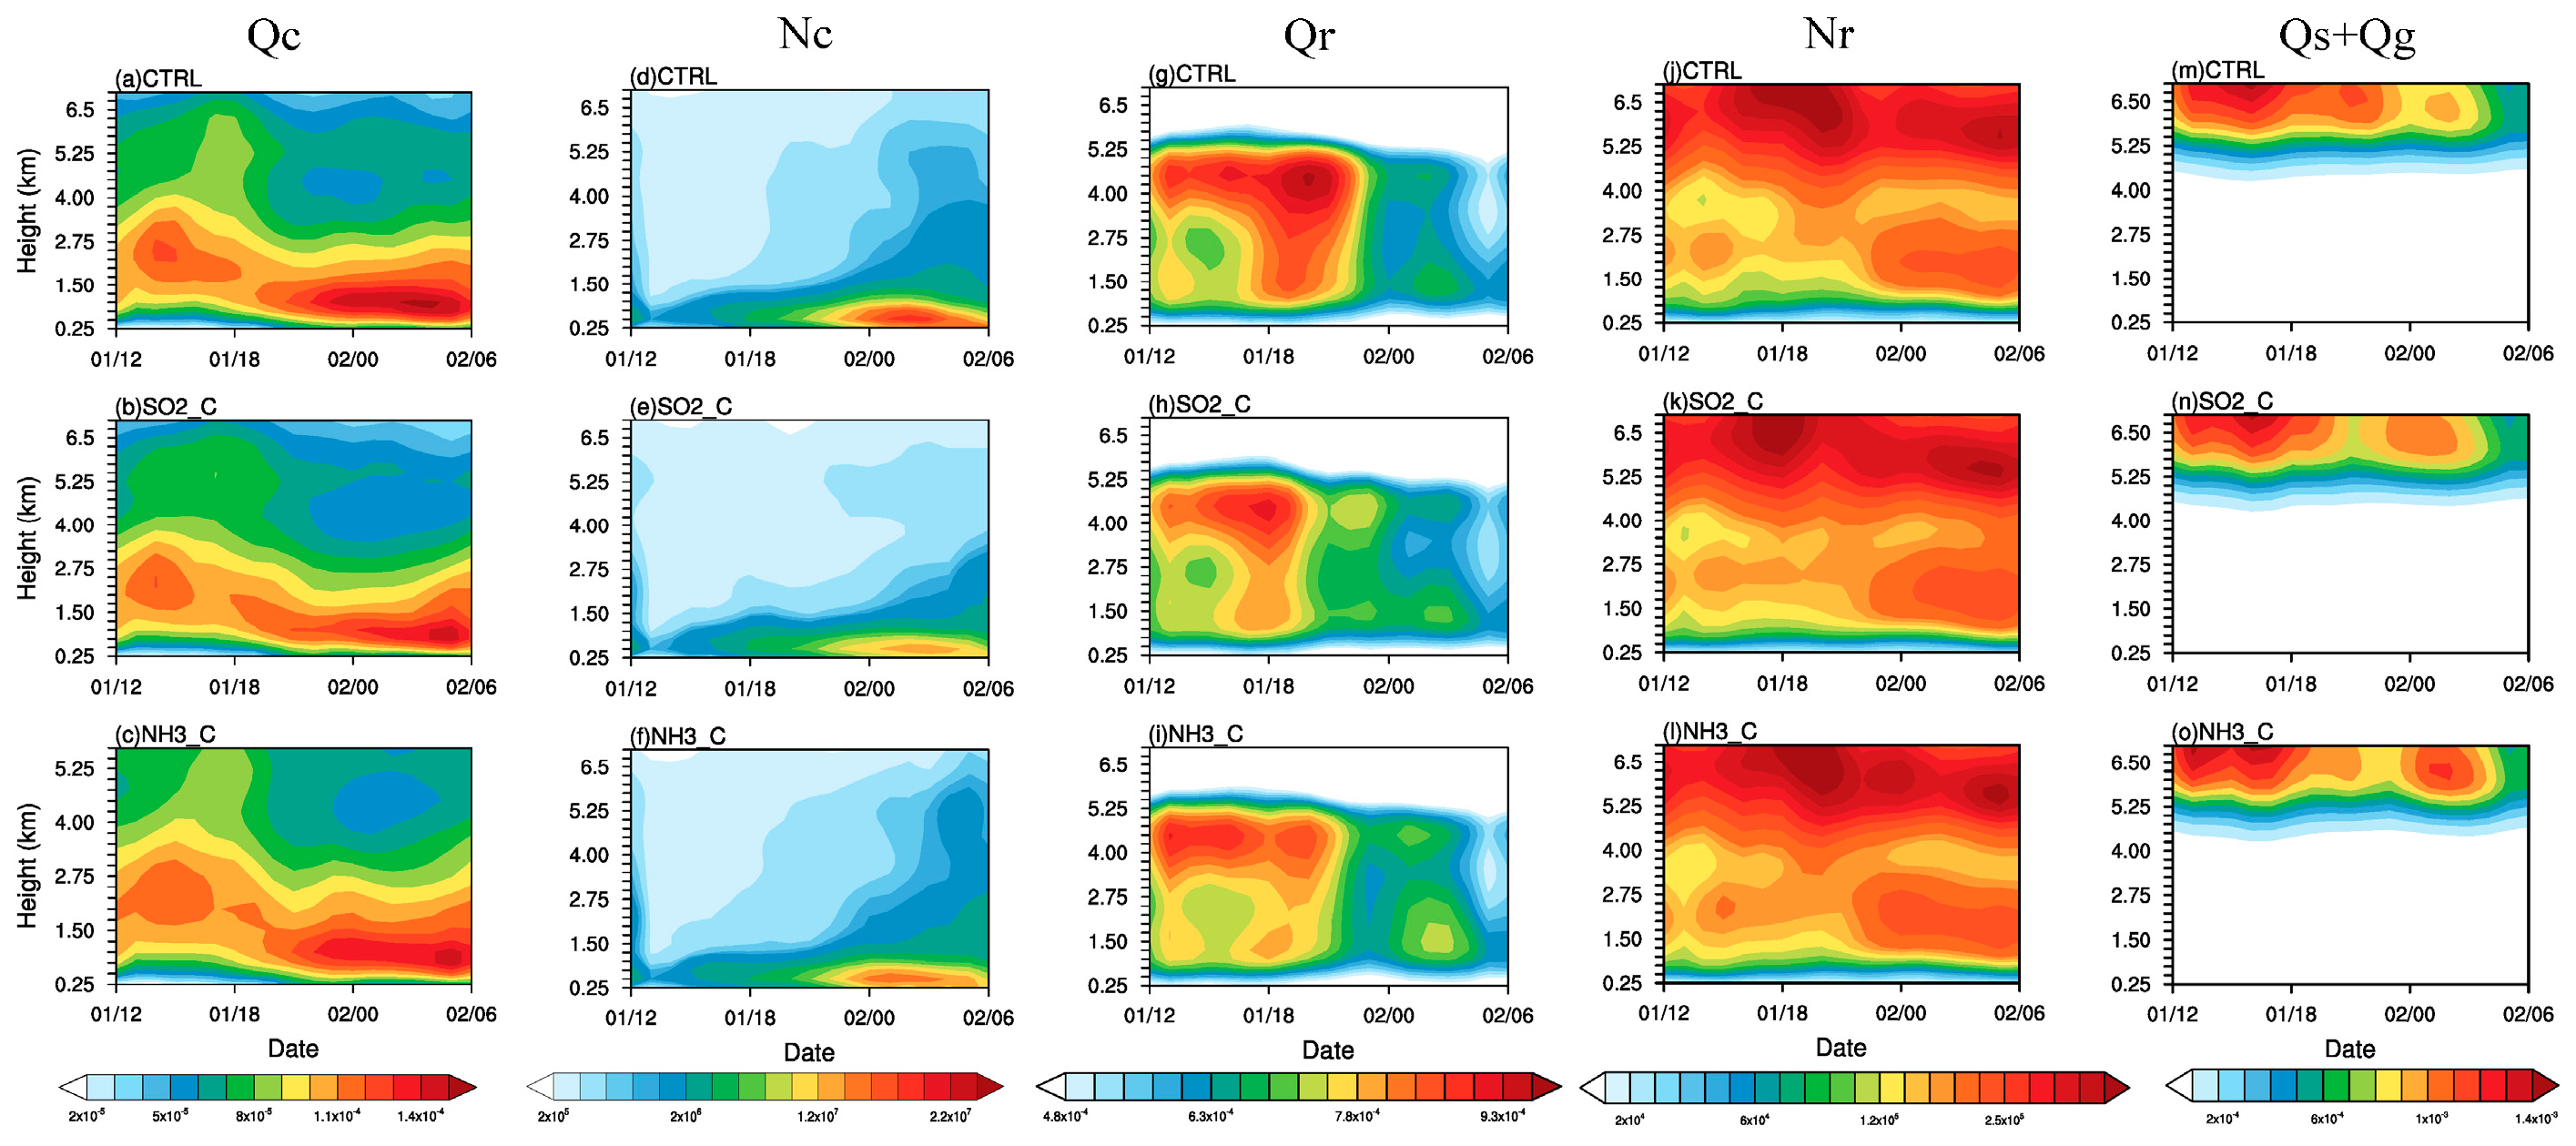
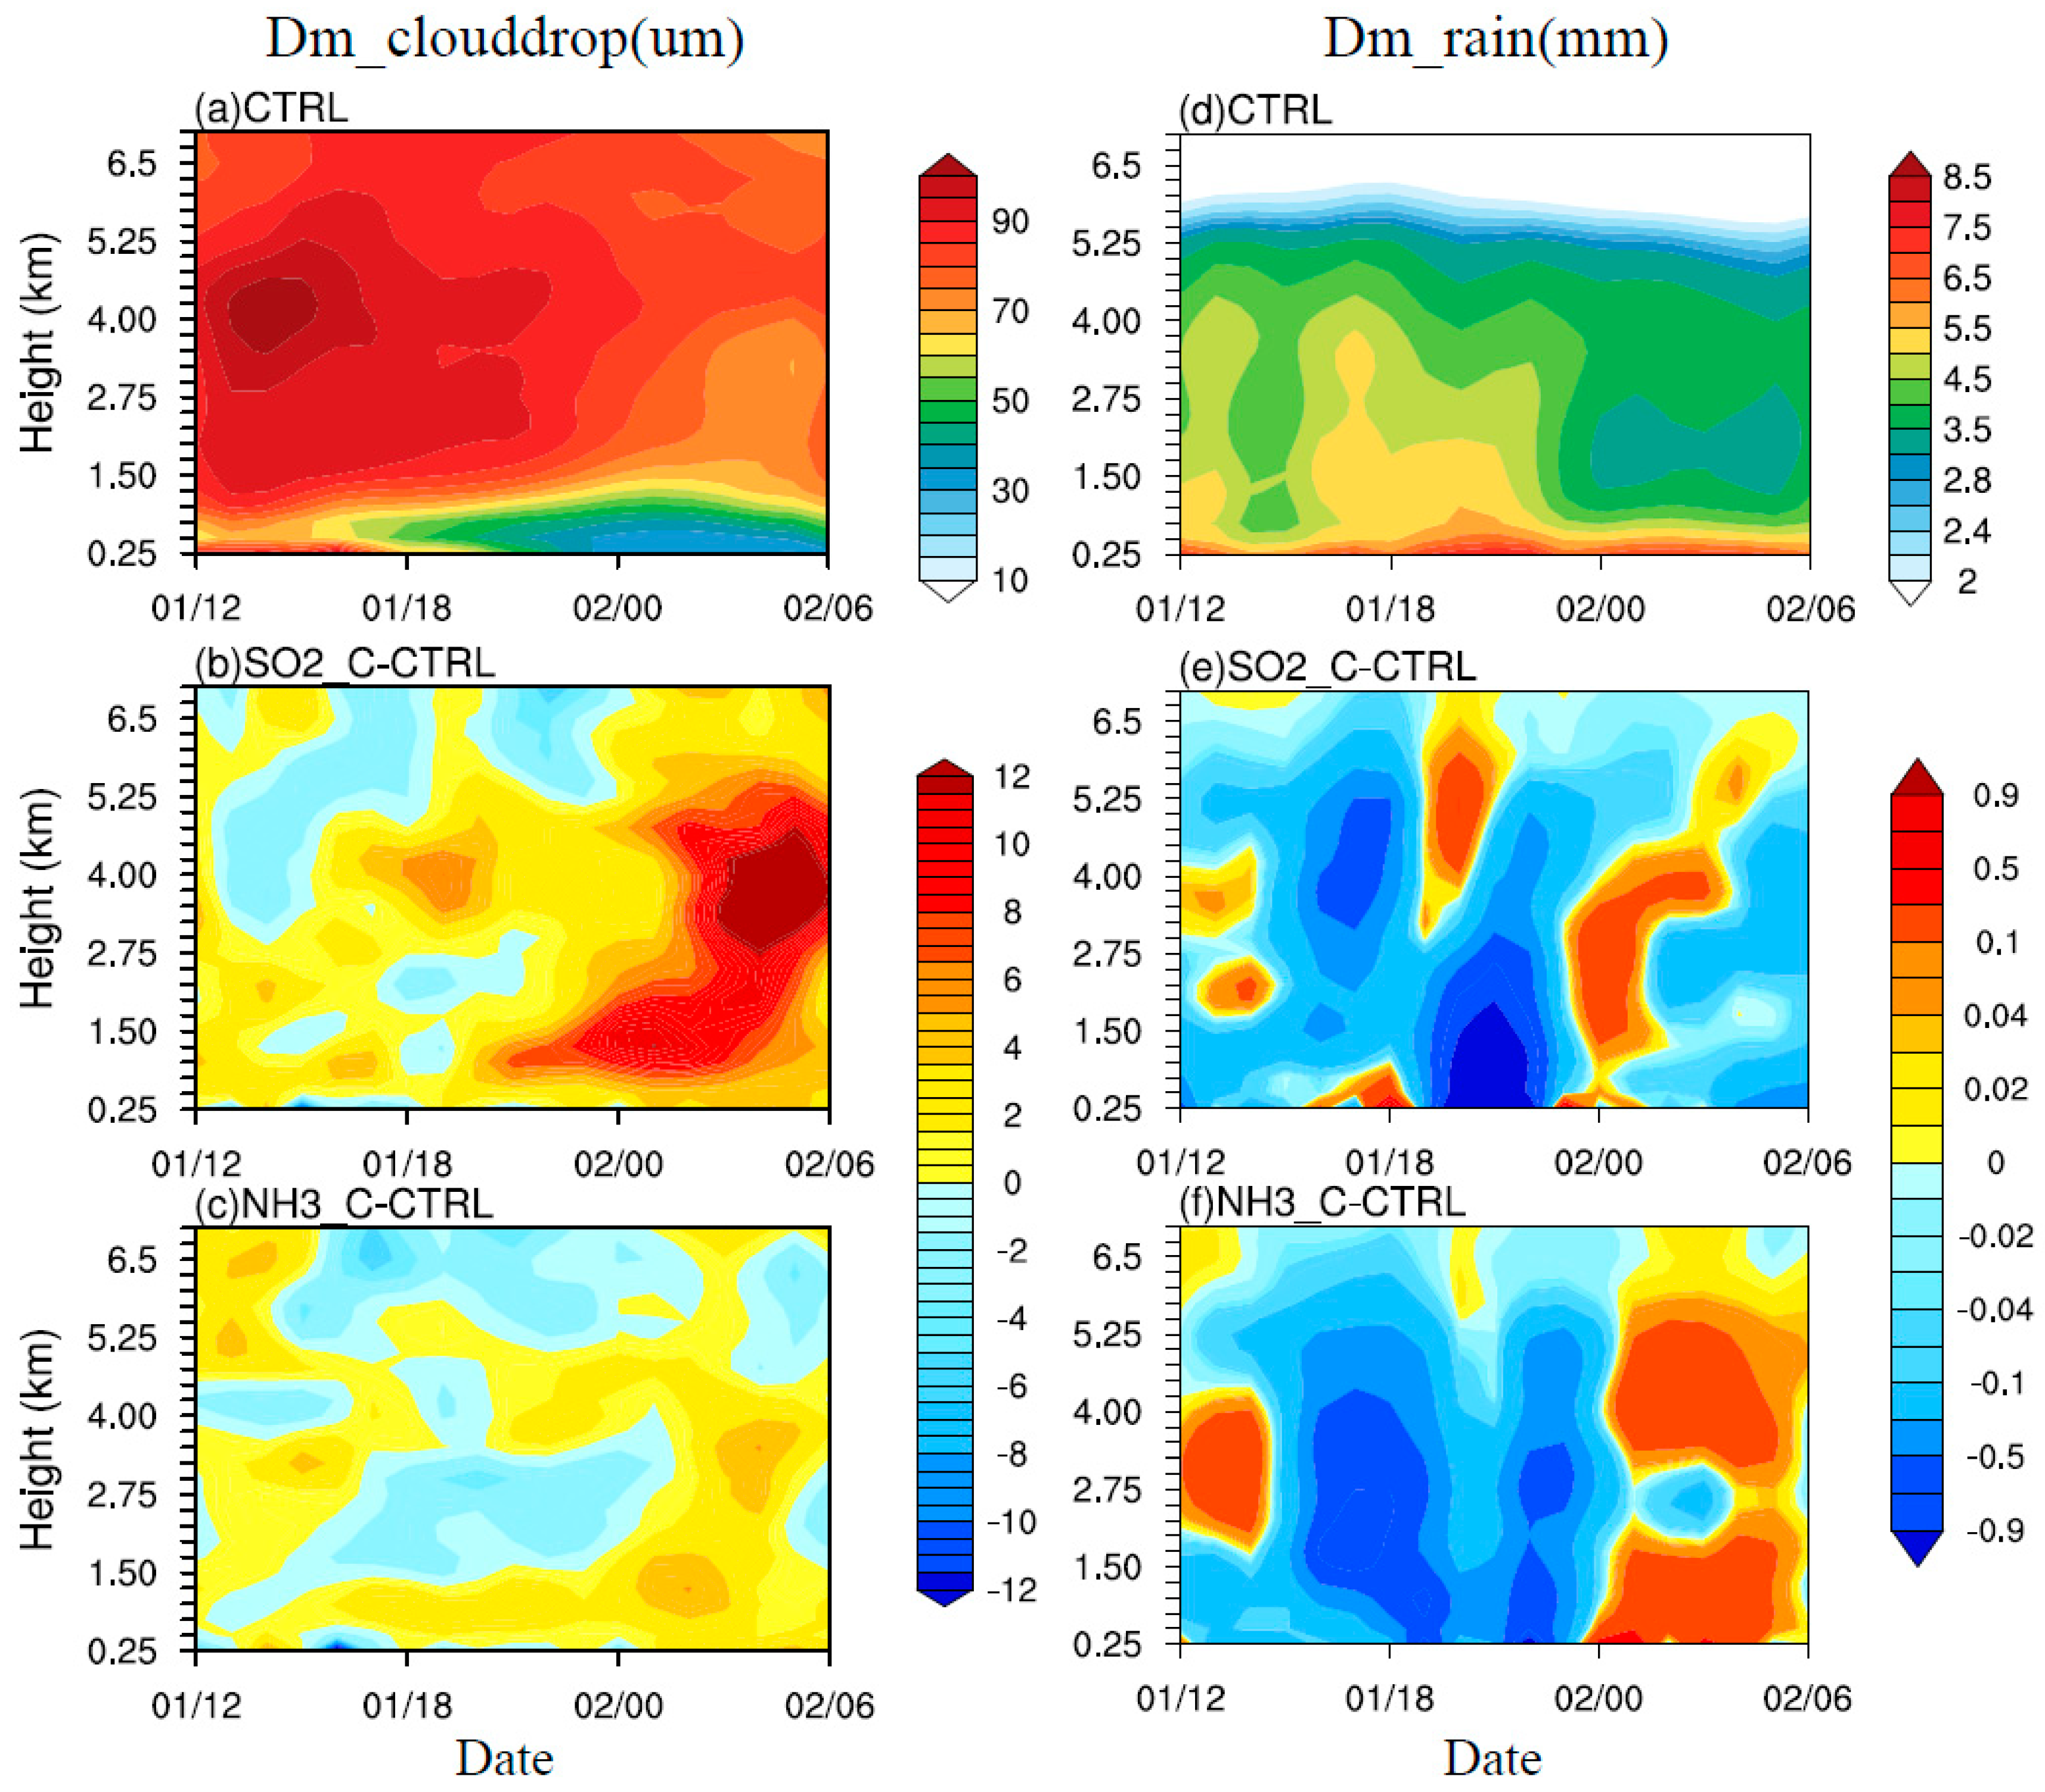
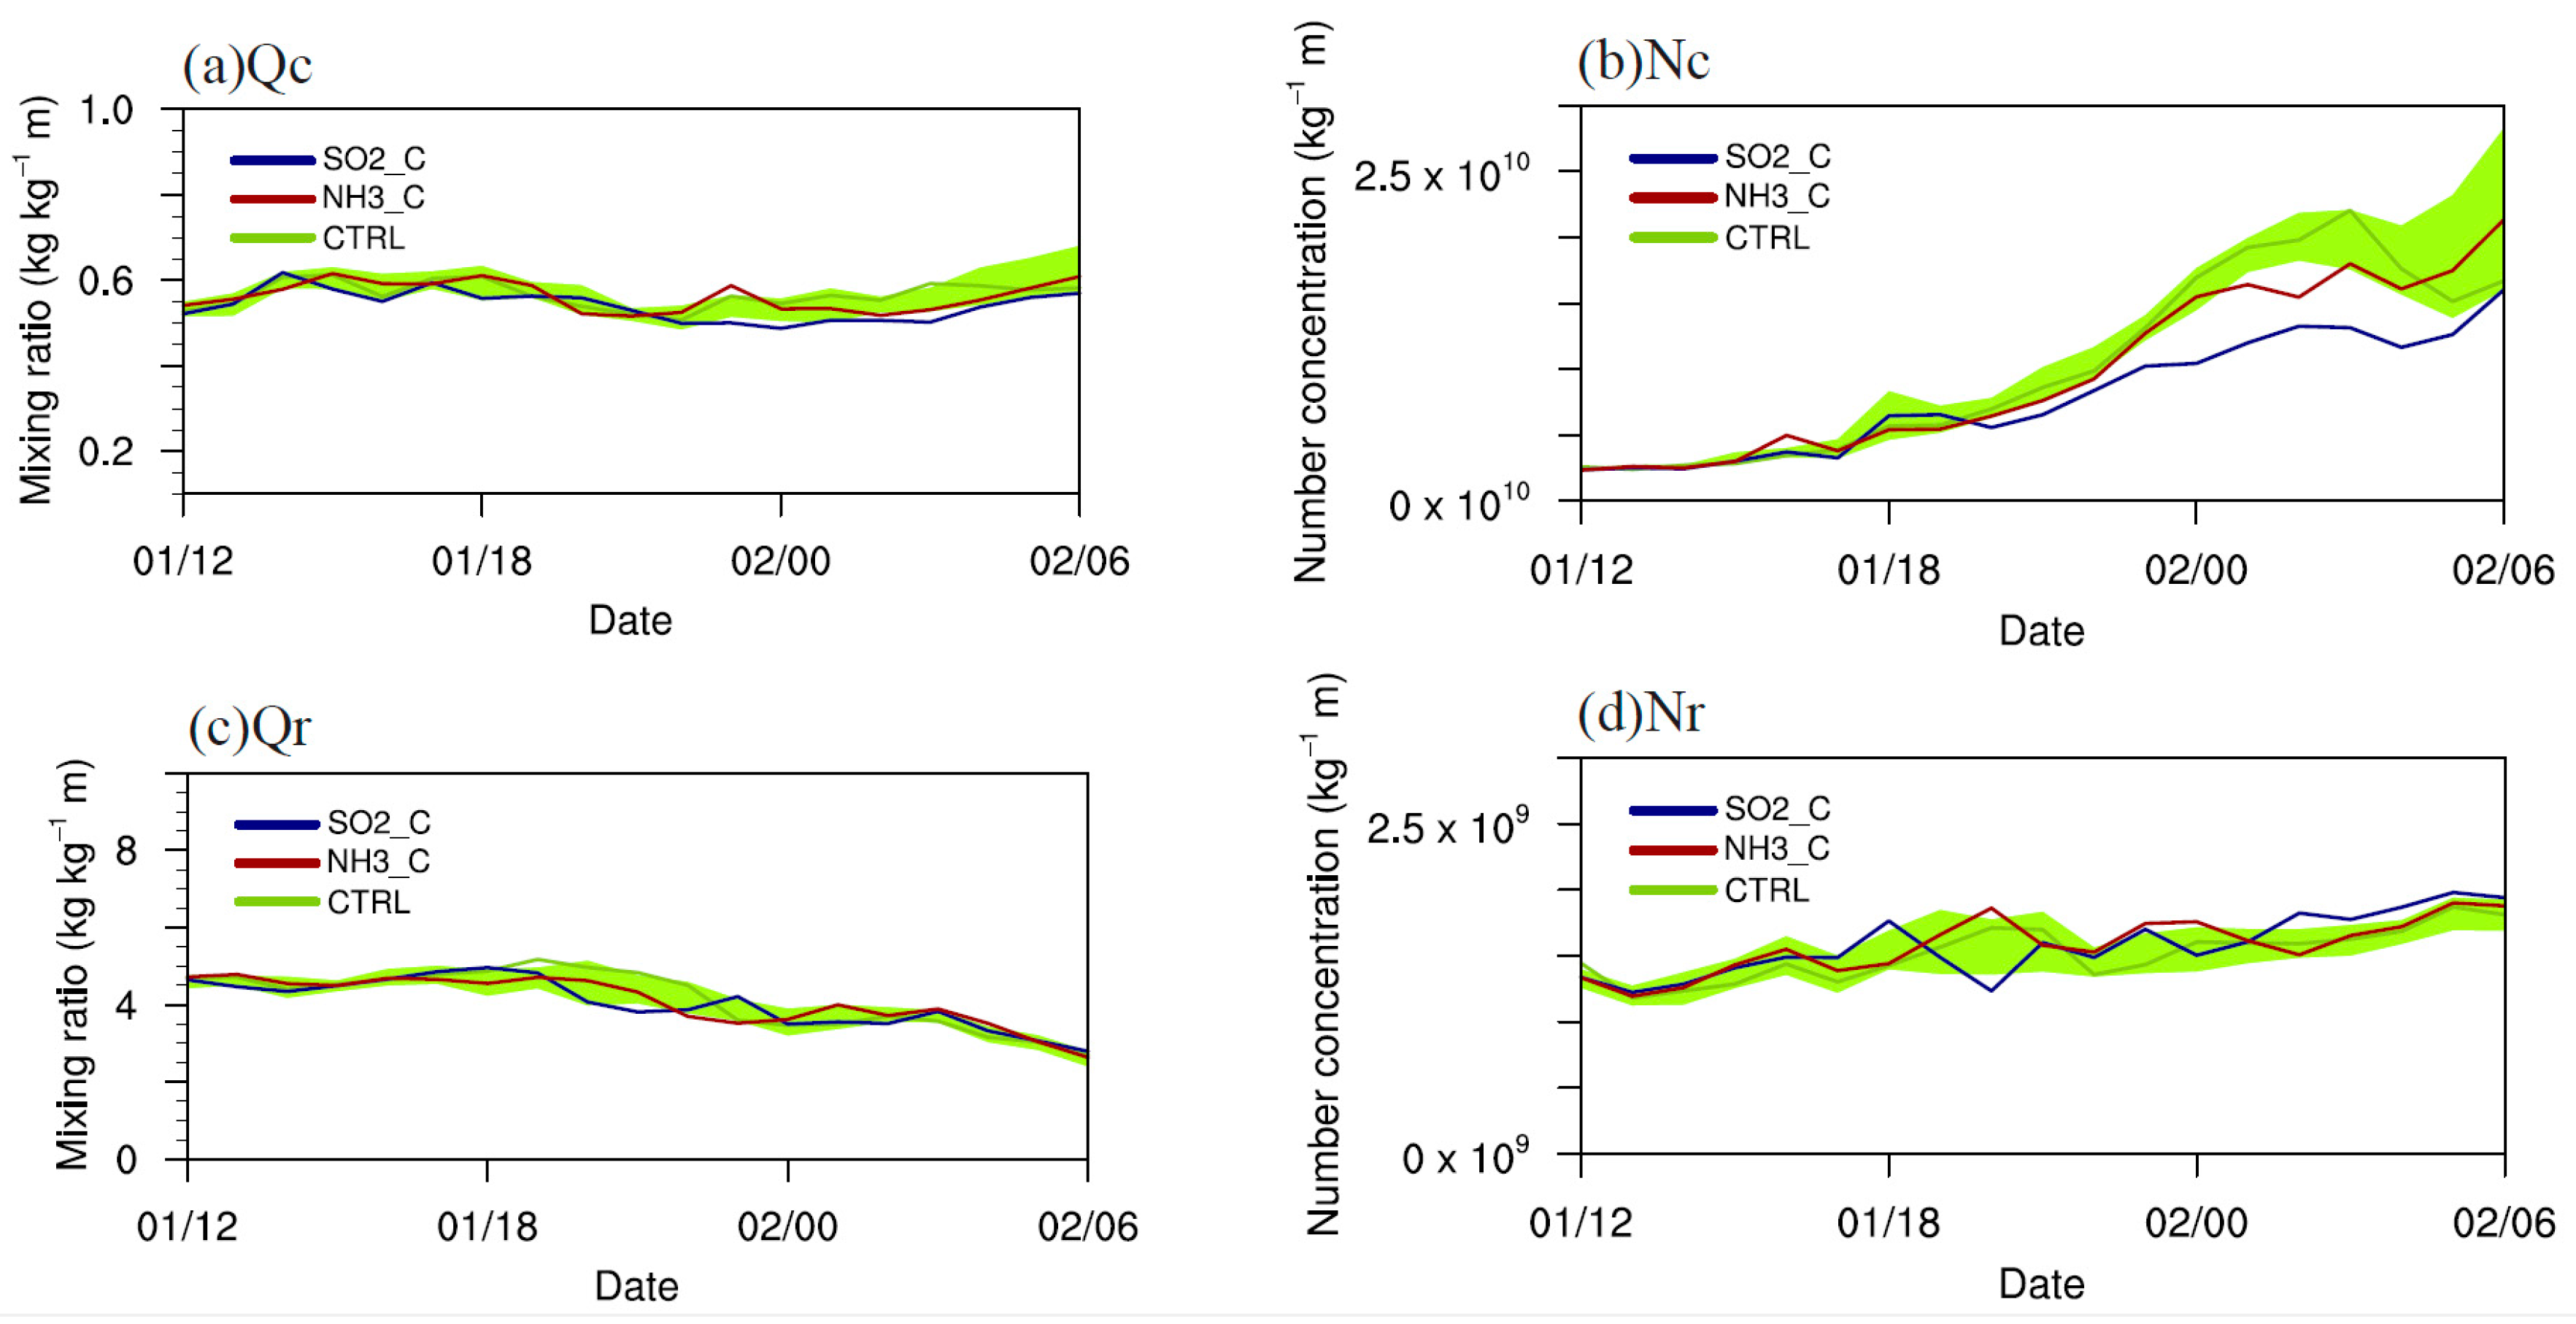
4.2. Evolutions of Cloud Droplets and Raindrops

When typhoon Nida (2016) approaches toward the coastline, sharp increases of the mixing ratio and number concentration of cloud droplets near the surface layer are shown (Figure 10a–f), largely due to the activation of anthropogenic aerosols entrained from the Pearl River Delta region. In agreement with the previous studies, high CCN concentrations in CTRL run essentially lead to more numerous (Figure 10d) but smaller-sized cloud droplets (Figure 11a) compared to the reduction of emission intensity in both SO2_C and NH3_C runs. Since more intensive emission of SO 2 than NH 3 in the base-level condition, the reduction of SO 2 emission results in the least amounts of cloud droplets (Figure 10e) and then the largest mass-weighted mean cloud droplet diameter (Figure 11b), especially after the landfalling of the whole vortex.
Figure 10g–l further demonstrates the evolution of area-averaged mixing ratio and number concentration of raindrops. Since the cloud droplets are not the only hydrometeor to produce raindrops, the temporal-spatial characteristics of rainwater among the simulations show remarkable differences from those of cloud droplets. Two developing stages can be seen based on the vertical distribution of the raindrop mixing ratio. When the main core of vortex moves on the ocean (before 2300 UTC 1 August, defined as ocean stage), the raindrop mixing ratio reaches its peak level at around 4.5-km height and gradually decreases downward (Figure 10g–i), which implies the large contribution from the melting of ice-phase hydrometeors as shown in Figure 10m–o. The corresponding number concentration of raindrops centralizes at a higher layer around 6.5 km and with another layer at around 2 km (Figure 10j–l). Under the efficient auto-conversion from the cloud droplets, plenty of smaller-sized raindrops are produced in both certain runs (Figure 11e,f). The largest number concentration of CCN in the CTRL run leads to a prolonged duration of raindrop growth (Figure 10g–i) and an invigoration in convection (i.e., the amount of melting snow and graupel is the maximum in it). This is likely due to the most latent heat release from the numerous and smallest-sized cloud droplets in the mixed-phase region, which consequently increases the surface precipitation before 2300 UTC 1 August (Figure 7).
Conversely, the concentrated height of the raindrop mixing ratio rapidly descends to about 1.5-km height when the vortex moves inland (after 2300 UTC 1 August, defined as a continental stage). The clearly enhanced raindrop number concentrations at about 2.0 km in the certain runs than that in the CTRL run indicate the important effect of warm-rain microphysical processes (Figure 10j–l). It should be pointed out that the faster fall-speed of raindrop mixing ratio than that of number concentration in the current microphysics scheme is reported to cause of the presence of larger raindrops locate near the surface (Figure 11d) [59]. Because of the largest-sized cloud droplet in the SO2_C run during the continental stage (Figure 11b), the auto-conversion rate of cloud droplets to raindrops will considerably strengthen, the raindrop number concentration and mixing ratio in it should be the largest. Unexpectedly, the simulations in the NH3_C run are larger than those in the SO2_C run, which is probably due to the overmuch melting of ice-phase hydrometeor in the former (Figure 10o). For such complex interaction among hydrometeors, the mass-weighted mean raindrop diameters in NH3_C run ultimately exceed that in CTRL run when the vortex continually moves inland (contrary to those over the ocean and existing results) (Figure 11f), causing the largest occurrence frequency of medium Z DR and strongest precipitation. In addition, the more general comparisons of area-averaged and vertically-integrated mixing ratio and number concentration of cloud droplets and raindrops between the simulations show that only the notable deviation on cloud droplet number concentration can be detected, while mixing ratio and number concentration of raindrops are mixed together with less discrepancy among the certain runs and ensembles (Figure 12). Furthermore, we are still interested in the contributions of microphysics with phase change before and after the landfalling of vortex under polluted condition in certain runs to analyze the interaction between the thermodynamics and dynamic fields within the main core.

4.3. Microphysical and Thermodynamic Processes

Although several microphysical processes jointly determine the evolution of cloud droplets and raindrops, the thermo-related processes such as cloud droplet condensation and raindrop evaporation can greatly affect the vortex thermodynamic field. During the ocean stage, plenty of water vapor condenses on the cloud droplets around 5-km height in the CTRL run (Figure 13a), which subsequently makes a contribution for the increase of raindrop mixing ratio through accretion of cloud water by raindrop therein (Figure 10g). The updraft induced by the latent heat release also shows its maximum intensity at the same layers (Figure 13d), corresponding well with the occurring time of peak intensity of vortex (Figure 3b). The reduction of cloud droplet condensation due to the less CCN in both SO2_C and NH3_C runs (Figure 13b,c) causes a markedly decreased upward motion (Figure 13e,f). Specifically, the lowest number concentration of cloud droplets in the SO2_C run leads to the least condensation of water vapor, which is in agreement with the weakest updraft in it. That is, the evolutions of air updraft and cloud droplet condensation are generally synchronous, and they both get to the maximum values and decrease hereafter.
While during the continental stage, the concentrated layers of water vapor condensation turn down to the lower troposphere in the CTRL run, accompanied by a rapid formation of cloud droplets because of the penetration of anthropogenic aerosols. More of the condensation occurs in the SO2_C and NH3_C runs especially beneath 2.5 km, although fewer CCN exists in them. The highest relative humidity in NH3_C run (Figure 13i) is responsible for the maximal condensation in it. However, the enhanced cloud droplet condensations in certain runs do not induce an increase in the updraft until after 0500 UTC 2 August (Figure 13e,f), which indicates that the response of dynamic field to the thermodynamic field associated with cloud microphysical process is complicated. Besides the latent heating induced by the condensation of water vapor, the coastal terrain and the multi-scale interactions should be other important factors that affecting the vertical motion. In addition, larger-sized raindrops in the NH3_C run produce less raindrop evaporation and weaker downward motion than those in the SO2_C run during the continental stage. To more clearly summarize the differences of cloud microphysical processes induced by the precursor gaseous emissions, the time-area averaged raindrop number concentration, mass-weighted diameter and source/sink terms of raindrop mixing ratio within the radius of 150 km from the vortex center during the continental stage are listed in Table 2.
As the lower air supersaturation and fewer CCN are present in the SO2_C run than those in the NH3_C run after Nida landfalling, less water vapor is condensed to form cloud water in the former, resulting in cloud droplets with smaller number concentration but larger-size and higher auto-conversion rate from the cloud droplets to raindrops. More raindrop evaporation occurs in the SO2_C run due to the smaller-sized raindrops with larger total surface area. Moreover, the melting of snow and graupel has a dominant contribution to rainwater near the melting layer, which to a lesser extent affects the content of raindrops at the lower troposphere due to the high 0 °C layer. To sum up, the lower melting of ice-phase hydrometeors and the lower accretion rate of cloud droplets by raindrops in SO2_C run than those in NH3_C run are responsible for the smaller mixing ratio of raindrops in it.

5. Summary

In this study, Typhoon Nida (2016) is simulated using the WRF-Chem (V3.8.1) model to investigate the effects of two kinds of precursor gaseous emission on the cloud microphysical properties before and after vortex landfalling. The 0.25° × 0.25° monthly emission datasets in the year 2013 from MEIC are gridded and introduced as chemical data into the model. Three certain experiments with base-level emission intensity (CTRL), one-tenth the emission intensity of SO 2 (SO2_C), and one-tenth the emission intensity of NH 3 (NH3_C) are conducted and integrate 36 h with the finest grid-spacing of 4 km. To validate the robustness of the aerosol effect, additional ten-member ensembles are conducted by adding white noise perturbations into the potential temperature field in the lower troposphere at the initial time of the simulation. The simulated radar variables and surface precipitation are firstly evaluated using the Guangzhou polarimetric radar observation and gauge-satellite merged hourly precipitation production. The characteristics of cloud droplets and raindrops among the certain runs as well as ensembles are compared to figure out the detailed impact induced by the aerosol on the cloud microphysics in a landfalling vortex. The main results are as follows.
The simulated typhoon track and intensity are all generally consistent with the CMA best-track dataset and insignificant diversities exist. Due to the lack of observation over the ocean, the simulated raindrop characteristics are validated after the vortex makes landfall. All the simulations including the extra ensembles exhibit similar horizontal distributions of Z H and Z DR with high values concentrate at the western and southern parts of the vortex. As the Z DR represents the mean size of raindrops, an increase of infrequent occurrence of large Z DR toward the ground indicates the formation of large-sized raindrops in the simulations, but it is not captured by the radar observation owing to the smaller detective range at lower levels and the assumed exponential RSD in the model. The occurrence frequency of Z DR in middle-value in the SO2_C is lower than that in the CTRL run, implying the formation of smaller raindrops due to the reduction of SO 2 emission. However, the existence of more medium-sized raindrops in the NH3_C run shows the opposite impact on raindrop microphysics in two certain runs. Correspondingly, the area-averaged rainfall rate in the NH3_C run is the largest among the three simulations after the vortex makes landfall. Nevertheless, such impact is lack of confidence since comparable deviation in the simulated Z DR or precipitation can be found when perturbing potential temperature in the initial condition.
Concerning the microphysics evolution before and after the landfalling, two stages (i.e., the ocean and continental stages) are separated by around 2300 UTC 1 August. When the major core of the vortex still locates over the ocean, the melting of ice-phase hydrometeor plays a dominant contribution to the formation of raindrops, and the maximum mixing ratio of raindrops lies just below the melting layer. A distinct extension of raindrop growth and more surface precipitation are present in the CTRL run probably due to the suppression of warm-rain and enhancement of convection, where higher concentrations of CCN penetrated into the vortex than those in SO2_C and NH3_C runs. The consistent tendencies of cloud microphysics and thermodynamic field exist particularly during the ocean period. That is, the least latent heat release through water vapor condensation in the SO2_C run results in the smallest upward motion in the vortex.
Focusing on the continental stage, the updraft becomes complex and is also affected by the coastal terrain and multi-scale interactions. More of raindrops in the two certain runs are produced through the enhanced warm-rain microphysics, and the concentrated layer of raindrop mixing ratio moves downward to lower troposphere. More water vapor condensed in the NH3_C run due to higher relative humidity and caused stronger upward motion than these in the SO2_C run. In addition, the maximum melting of ice-phase hydrometeors and the accretion of cloud droplets in the NH3_C run also lead to the largest size of raindrops and the strongest rainfall rate among the three certain experiments.
Since the changes in the environment will affect the atmospheric stability and available water vapor, when we add perturbations into the potential temperature at the initialization, larger deviation is shown in either the simulated raindrop size distribution or surface precipitation, indicating the non-ignored impact induced by the pure uncertainty of the numerical model. It should also be pointed out that the results here are only based on the simulation of a landfalling TC and the imprecise parameterization of aerosol-cloud interaction in the current physical scheme may conceal the aerosol effect on the microphysics in such an intense system, which is still worth being further explored.

Author Contributions

Conceptualization, L.D. and W.G.; methodology, W.G.; validation, L.D., C.W.; data curation, Y.D.; writing—original draft preparation, L.D.; writing—review and editing, W.G.; supervision, Y.D. All authors have read and agreed to the published version of the manuscript.

Funding

This research was funded by the National (Key) Basic Research and Development (973) Program of China (2015CB452805), and National Natural Science Foundation of China (41575108, 42075012).

Acknowledgments

We wish to thank Lei Zhang from Chinese Academy of Meteorological Sciences for providing the chemical input data and Greg Thompson from National Center of Atmospheric Research for discussing about the effect by introducing the white-noise perturbation in the potential temperature at initialization. The NCEP FNL analysis data are available from the Computational and Information Systems Laboratory (CISL) (http://rda.ucar.edu/datasets/ds083.2). The typhoon track and intensity data are available from the China Meteorological Administration (CMA) (http://tcdata.typhoon.org.cn/zjljsjj_zlhq.html). The S-band polarimetric radar, surface precipitation, anthropogenic gaseous emission, and the model data can be obtained from https://pan.baidu.com/s/1pUFYHjdrwJVsk4mPz-wjVQ with the password (ea44).

Conflicts of Interest

The authors declare no conflict of interest

References

  1. Rosenfeld, D.; Lohmann, U.; Raga, G.B.; O’Dowd, C.D.; Kulmala, M.; Fuzzi, S.; Reissell, A.; Andreae, M.O. Flood or drought: How do aerosols affect precipitation? Science 2008, 321, 1309–1313. [Google Scholar] [CrossRef] [Green Version]
  2. Tao, W.K.; Chen, J.P.; Li, Z.; Wang, C.; Zhang, C. Impact of aerosols on convective clouds and precipitation. Rev. Geophys. 2012, 50, RG2001. [Google Scholar] [CrossRef] [Green Version]
  3. Storer, R.L.; van den Heever, S.C. Microphysical processes evident in aerosol forcing of tropical deep convective clouds. J. Atmos. Sci. 2013, 70, 430–446. [Google Scholar] [CrossRef]
  4. Fan, J.; Rosenfeld, D.; Zhang, Y.; Giangrande, S.E.; Li, Z.; Machado, L.A.T.; Martin, S.T.; Yang, Y.; Wang, J.; Artaxo, P.; et al. Substantial convection and precipitation enhancements by ultrafine aerosol particles. Science 2018, 359, 411–418. [Google Scholar] [CrossRef] [PubMed] [Green Version]
  5. Pruppacher, H.; Klett, J. Microphysics of Clouds and Precipitation, 2nd ed.; Oxford Press: Oxford, UK, 1997; p. 914. [Google Scholar]
  6. Andreae, M.O.; Rosenfeld, D.; Artaxo, P.; Costa, A.A.; Frank, G.P.; Longo, K.M.; Silva-Dias, M.A.F. Smoking rain clouds over the Amazon. Science. 2004, 303, 1337–1342. [Google Scholar] [CrossRef] [Green Version]
  7. Storer, R.L.; Van den Heever, S.C.; L’Ecuyer, T.S. Observations of aerosol-induced convective invigoration in the tropical east Atlantic. J. Geophys. Res. Atmos. 2014, 119, 3963–3975. [Google Scholar] [CrossRef]
  8. Evan, A.; Kossin, J.; Ramanathan, V. Arabian sea tropical cyclones intensified by emissions of black carbon and other aerosols. Nature 2011, 479, 94–97. [Google Scholar] [CrossRef]
  9. Rosenfeld, D.; Khain, A.; Lynn, B.; Woodley, W.L. Simulation of hurricane response to suppression of warm rain by sub-micron aerosols. Atmos. Chem. Phys. 2007, 7, 3411–3424. [Google Scholar] [CrossRef] [Green Version]
  10. Rosenfeld, D.; Woodley, W.; Khain, A.; Cotton, W.; Carrió, G.; Ginis, I.; Golden, J. Aerosol effects on microstructure and intensity of tropical cyclones. Bull. Am. Meteor. Soc. 2012, 93, 987–1001. [Google Scholar] [CrossRef]
  11. Wang, Y.; Lee, K.; Lin, Y.; Levy, M.; Zhang, R. Distinct effects of anthropogenic aerosols on tropical cyclones. Nat. Clim. Chang. 2014, 4, 368–373. [Google Scholar] [CrossRef]
  12. Herbener, S.R.; Van den Heever, S.C.; Carrió, G.G.; Saleeby, S.M.; Cotton, W.R. Aerosol indirect effects on idealized tropical cyclone dynamics. J. Atmos. Sci. 2014, 71, 2040–2055. [Google Scholar] [CrossRef] [Green Version]
  13. Reale, O.; Lau, K.M.; Da Silva, A.; Matsui, T. Impact of assimilated and interactive aerosol on tropical cyclogenesis. Geophys. Res. Lett. 2014, 41, 3282–3288. [Google Scholar] [CrossRef] [PubMed] [Green Version]
  14. Jiang, B.; Huang, B.; Lin, W.; Xu, S. Investigation of the effects of anthropogenic pollution on typhoon precipitation and microphysical processes using WRF-Chem. J. Atmos. Sci. 2016, 73, 1593–1610. [Google Scholar] [CrossRef]
  15. Khain, A.; Lynn, B.; Dudhia, J. Aerosol effects on intensity of landfalling hurricanes as seen from simulations with the WRF model with spectral bin microphysics. J. Atmos. Sci. 2010, 67, 365–384. [Google Scholar] [CrossRef] [Green Version]
  16. Khain, A.; Lynn, B.; Shpund, J. High resolution WRF simulations of Hurricane Irene: Sensitivity to aerosols and choice of microphysical schemes. Atmos. Res. 2016, 167, 129–145. [Google Scholar] [CrossRef] [Green Version]
  17. Krall, G.; Cotton, W.R. Potential indirect effects of aerosol on tropical cyclone intensity: Convective fluxes and cold-pool activity. Atmos. Chem. Phys. Discuss 2012, 12, 351–385. [Google Scholar] [CrossRef]
  18. Qu, Y.; Chen, B.; Ming, J.; Lynn, B.H.; Yang, M.J. Aerosol impacts on the structure, intensity, and precipitation of the landfalling Typhoon Saomai (2006). J. Geophys. Res. Atmos. 2017, 122, 11825–11842. [Google Scholar] [CrossRef]
  19. Nowottnick, E.P.; Colarco, P.R.; Braun, S.A.; Barahona, D.O.; Da Silva, A.; Hlavka, D.L.; McGill, M.J.; Spackman, J.R. Dust Impacts on the 2012 Hurricane Nadine track during the NASA HS3 Field Campaign. J. Atmos. Sci. 2018, 75, 2473–2489. [Google Scholar] [CrossRef]
  20. Yang, X.; Zhou, L.; Zhao, C.; Yang, J. Impact of aerosols on tropical cyclone-induced precipitation over the mainland of China. Clim. Chang. 2018, 148, 173–185. [Google Scholar] [CrossRef]
  21. Zhao, C.; Lin, Y.; Wu, F.; Wang, Y.; Li, Z.; Rosenfeld, D.; Wang, Y. Enlarging rainfall area of tropical cyclones by atmospheric aerosols. Geophys. Res. Lett. 2018, 45, 8604–8611. [Google Scholar] [CrossRef] [Green Version]
  22. Luo, H.; Jiang, B.; Li, F.; Lin, W. Simulation of the effects of sea-salt aerosols on the structure and precipitation of a developed tropical cyclone. Atmos. Res. 2019, 217, 120–127. [Google Scholar] [CrossRef]
  23. Hazra, A.; Mukhopadhyay, P.; Taraphdar, S.; Chen, J.; Cotton, W. Impact of aerosols on tropical cyclones: An investigation using convection-permitting model simulation. J. Geophys. Res. Atmos. 2013, 118, 7157–7168. [Google Scholar] [CrossRef]
  24. Xu, S.; Lin, W.; Sui, C. The separation of convective and stratiform precipitation regions of simulated Typhoon Chanchu and its sensitivity to the number concentration of cloud droplets. Atmos. Res. 2013, 122, 229–236. [Google Scholar] [CrossRef]
  25. Jiang, B.; Lin, W.; Li, F.; Chen, J. Sea-salt aerosol effects on the simulated microphysics and precipitation in a tropical cyclone. J. Meteorol. Res. 2019, 33, 115–125. [Google Scholar] [CrossRef]
  26. Carrio, G.G.; Cotton, W.R. Investigations of aerosol impacts on hurricanes: Virtual seeding flights. Atmos. Chem. Phys. 2011, 11, 2557–2567. [Google Scholar] [CrossRef] [Green Version]
  27. Cotton, W.R.; Zhang, H.; McFarquhar, G.M.; Saleeby, S.M. Should we consider polluting hurricanes to reduce their intensity? J. Weather. Modif. 2007, 39, 70–73. [Google Scholar]
  28. Hoarau, T.; Barthe, C.; Tulet, P.; Claeys, M.; Pinty, J.P.; Bousquet, O.; Delanoë, J.; Vié, B. Impact of the generation and activation of sea salt aerosols on the evolution of tropical cyclone Dumile. J. Geophys. Res. Atmos. 2018, 123, 8813–8831. [Google Scholar] [CrossRef]
  29. Dunion, J.; Velden, C. The impact of the Saharan air layer on Atlantic tropical cyclone activity. Bull. Am. Meteorol. Soc. 2014, 85, 353–365. [Google Scholar] [CrossRef] [Green Version]
  30. Skamarock, W.C.; Klemp, J.B.; Dudhia, J.; Gill, D.O.; Barker, D.M.; Duda, M.G.; Huang, X.; Wang, W.; Powers, J.G. A Description of the Advanced Research WRF Version 3 (No. NCAR/TN-475+STR); University Corporation for Atmospheric Research: Boulder, CO, USA, June 2008; p. 113. [Google Scholar]
  31. Ancell, B.C.; Bogusz, A.; Lauridsen, M.J.; Nauert, C.J. Seeding Chaos: The Dire Consequences of Numerical Noise in NWP Perturbation Experiments. Bull. Am. Meteorol. Soc. 2018, 99, 615–628. [Google Scholar] [CrossRef] [Green Version]
  32. Brown, B.R.; Bell, M.M.; Frambach, A.J. Validation of simulated hurricane drop size distributions using polarimetric radar. Geophys. Res. Lett. 2016, 43, 910–917. [Google Scholar] [CrossRef]
  33. Wu, D.; Zhao, K.; Kumjian, M.R.; Chen, X.; Huang, H.; Wang, M.; Didlake, A.C.; Duan, Y.; Zhang, F. Kinematics and microphysics of convection in the outer rainband of Typhoon Nida (2016) revealed by polarimetric radar. Mon. Weather Rev. 2018, 146, 2147–2159. [Google Scholar] [CrossRef]
  34. Deng, L.; Gao, W.; Duan, Y. A modeling study of the effects of vertical wind shear on the raindrop size distribution in Typhoon Nida (2016). J. Geophys. Res. Atmos. 2019, 124, 6501–6517. [Google Scholar] [CrossRef]
  35. Morrison, H.; Thompson, G.; Tatarskii, V. Impact of cloud microphysics on the development of trailing stratiform precipitation in a simulated squall line: Comparison of one- and two-moment schemes. Mon. Weather Rev. 2009, 137, 991–1007. [Google Scholar] [CrossRef] [Green Version]
  36. Martin, G.M.; Johnson, D.W.; Spice, A. The measurement and parameterization of effective Radius of droplets in warm stratocumulus clouds. J. Atmos. Sci. 1994, 51, 1823–1842. [Google Scholar] [CrossRef]
  37. Grell, G.A.; Freitas, S. A scale and aerosol aware stochastic convective parameterization for weather and air quality modeling. Atmos. Chem. Phys. Discuss. 2013, 13, 23845–23893. [Google Scholar] [CrossRef]
  38. Iacono, M.J.; Delamere, J.S.; Mlawer, E.J.; Shephard, M.W.; Clough, S.A.; Collins, W.D. Radiative forcing by long-lived greenhouse gases: Calculations with the AER radiative transfer models. J. Geophys. Res. 2008, 113, D13103. [Google Scholar] [CrossRef]
  39. Chen, F.; Dudhia, J. Coupling an advanced land-surface/hydrology model with the Penn State/NCAR MM5 modeling system. Part I: Model description and implementation. Mon. Weather Rev. 2001, 129, 569–585. [Google Scholar] [CrossRef] [Green Version]
  40. Hong, S.Y.; Noh, Y.; Dudhia, J. A new vertical diffusion package with an explicit treatment of entrainment processes. Mon. Weather Rev. 2006, 134, 2318–2341. [Google Scholar] [CrossRef] [Green Version]
  41. Stockwell, W.R.; Middleton, P.; Chang, J.S.; Tang, X. The second generation regional acid deposition model chemical mechanism for regional air quality modeling. J. Geophys. Res. 1990, 95, 16343–16367. [Google Scholar] [CrossRef]
  42. Ackermann, I.J.; Hass, H.; Memmesheimer, M.; Ebel, A.; Binkowski, F.S.; Shankar, U. Modal aerosol dynamics model for Europe: Development and first applications. Atmos. Environ. 1998, 32, 2981–2999. [Google Scholar] [CrossRef]
  43. Schell, B.; Ackermann, I.; Hass, H.; Binkowski, F.; Ebel, A. Modeling the formation of secondary organic aerosol within a comprehensive air quality model system. J. Geophys. Res. 2001, 106, 28275–28293. [Google Scholar] [CrossRef]
  44. Park, R.J.; Jacob, D.J.; Field, B.D.; Yantosca, R.M.; Chin, M. Natural and transboundary pollution influenceson sulfate-nitrate-ammonium aerosols in the United States: Implications for policy. J. Geophys. Res. 2004, 109, D15204. [Google Scholar] [CrossRef]
  45. Baker, K.; Scheff, P. Photochemical model performance for PM2.5 sulfate, nitrate, ammonium, and precursor species SO2, HNO3, and NH3 at background monitor locations in the central and eastern United States. Atmos. Environ. 2007, 41, 6185–6195. [Google Scholar] [CrossRef]
  46. Wang, G.; Zhang, R.; Gomez, M.E.; Yang, L.; Zamora, M.L.; Hu, M.; Lin, Y.; Peng, J.; Guo, S.; Meng, J.; et al. Persistent sulfate formation from London Fog to Chinese haze. Proc. Natl. Acad. Sci. USA 2016, 113, 13630–13635. [Google Scholar] [CrossRef] [PubMed] [Green Version]
  47. Abdul-Razzak, H.; Ghan, S.J. A parameterization of aerosol activation. 3. Sectional representation. J. Geophys. Res. 2002, 107, 4026. [Google Scholar] [CrossRef]
  48. Li, M.; Zhang, Y.; Kurokawa, J.-I.; Woo, J.-H.; He, K.; Lu, Z.; Ohara, T.; Song, Y.; Streets, D.G.; Carmichael, G.R.; et al. MIX: A mosaic Asian anthropogenic emission inventory under the international collaboration framework of the MICS-Asia and HTAP. Atmos. Chem. Phys. 2017, 17, 935–963. [Google Scholar] [CrossRef] [Green Version]
  49. Guo, L.; Highwood, E.J.; Shaffrey, L.C.; Turner, A.G. The effect of regional changes in anthropogenic aerosols on rainfall of the East Asian Summer Monsoon. Atmos. Chem. Phys. 2013, 13, 1521–1534. [Google Scholar] [CrossRef] [Green Version]
  50. Wang, X.; Liang, X.-Z.; Jiang, W.; Tao, Z.; Wang, J.X.; Liu, H.; Han, Z.; Liu, S.; Zhang, Y.; Grell, G.A. WRF-Chem simulation of East Asian air quality: Sensitivity to temporal and vertical emissions distributions. Atmos. Environ. 2010, 44, 660–669. [Google Scholar] [CrossRef]
  51. Griffin, S.M.; Otkin, J.A.; Thompson, G.; Frediani, M.; Berner, J.; Kong, F. Assessing the Impact of Stochastic Perturbations in Cloud Microphysics using GOES-16 Infrared Brightness Temperatures. Mon. Weather Rev. 2020, 148, 3111–3137. [Google Scholar] [CrossRef]
  52. Ying, M.; Zhang, W.; Yu, H.; Lu, X.; Feng, J.; Fan, Y.; Zhu, Y.; Chen, D. An overview of the China Meteorological Administration tropical cyclone database. J. Atmos. Ocean. Technol. 2014, 31, 287–301. [Google Scholar] [CrossRef] [Green Version]
  53. Wu, C.; Liu, L.P.; Wei, M.; Xi, B.Z.; Yu, M.H. Statistics-based optimization of the polarimetric radar hydrometeor classification algorithm and its application for a squall line in South China. Adv. Atmos. Sci. 2018, 35, 296–316. [Google Scholar] [CrossRef]
  54. Jung, Y.; Xue, M.; Zhang, G. Simulations of polarimetric radar signatures of a supercell storm using a two-moment bulk microphysics scheme. J. Appl. Meteorol. Climatol. 2010, 49, 146–163. [Google Scholar] [CrossRef]
  55. Dawson, D.T.; Mansell, E.R.; Jung, Y.; Wicker, L.J.; Kumjian, M.R.; Xue, M. Low-level ZDR signatures in supercell forward flanks: The role of size sorting and melting of hail. J. Atmos. Sci. 2014, 71, 276–299. [Google Scholar] [CrossRef]
  56. Pan, Y.; Shen, Y.; Yu, J.; Xiong, A. An experiment of high-resolution gauge-radar-satellite combined precipitation retrieval based on the Bayesian merging method. Acta Meteorol. Sin. 2015, 73, 177–186. (In Chinese) [Google Scholar]
  57. Seifert, A.; Köhler, C.; Beheng, K.D. Aerosol-cloud-precipitation effects over Germany as simulated by a convective scale numerical weather prediction model. Atmos. Chem. Phys. 2012, 12, 709–725. [Google Scholar] [CrossRef] [Green Version]
  58. Thompson, G.; Eidhammer, T. A study of aerosol impacts on clouds and precipitation development in a large winter cyclone. J. Atmos. Sci. 2014, 71, 3636–3658. [Google Scholar] [CrossRef]
  59. Kumjian, M.R.; Ryzhkov, A.V. The impact of size sorting on the polarimetric radar variables. J. Atmos. Sci. 2012, 69, 2042–2060. [Google Scholar] [CrossRef]
Figure 1. Three fixed nested model domains. The horizontal resolution of each domain is 36, 12, 4 km, respectively.
Atmosphere 11 01322 g001
Figure 2. The spatial distributions of mean hourly emission intensity of (a)   SO 2 and (b) NH 3 ( mol   km 2   h 1 ) in August. (c) The time-series of area-averaged mixing ratio of SO 2 and NH 3 ( mol   km 2   h 1 ) within the black circle in (a).
Atmosphere 11 01322 g002
Figure 3. (a) Trajectory of Typhoon Nida from the CMA best-track (black line) and simulations. The Guangzhou S-band polarimetric radar is marked by black star. (b) Time evolution of the 10-m maximum wind speed ( ms 1 ) from the best-track dataset (every 6 h) and simulations (every hour).
Atmosphere 11 01322 g003
Figure 4. The horizontal distributions of radar reflectivity (dBZ) and differential reflectivity (dB) at 3-km height from (a,e) Guangzhou S-band polarimetric radar, (b,f) CTRL, (c,g) SO2_C and (d,h) NH3_C runs at 0200 UTC 2 August. The black circle in (b) represents the range of 150km from the vortex center.
Atmosphere 11 01322 g004
Figure 5. The contoured frequency by altitude diagram of differential reflectivity (dB) from (a) S-band polarimetric radar, (b) CTRL, (c) SO2_C, (d) NH3_C, (e) differences between SO2_C and CTRL, and (f) differences between NH3_C and CTRL runs. The data at 0200 UTC and 0300 UTC 2 August within the black solid square in Figure 4b are involved for analysis.
Atmosphere 11 01322 g005
Figure 6. Spatial distributions of 6-h accumulated precipitation (mm) after landfalling from 0000 UTC to 0600 UTC 2 August from the (a) observation and (b) CTRL, (c) SO2_C and (d) NH3_C runs.
Atmosphere 11 01322 g006
Figure 7. (a)The time-series of area-averaged precipitation rate (mm h−1) within the vortex. Only data exceeding 1.0   mm   h 1 are involved for analysis. (b) difference of precipitation between SO2_C and CTRL run, NH3_C, and CTRL run as well as RUN0x_CTRL and CTRL run in (a). Each box in (b) shows the minimum, the 25th percentiles, the median, the 75th percentiles, and the maximum value in the relevant datasets.
Atmosphere 11 01322 g007
Figure 8. Time-height evolutions of area-averaged (ac) SO 4 2 and (df) NH 4 + ( μ g   m 3 ) within 150-km radius from the vortex center. The left, middle, and right columns represent the CTRL, SO2_C and NH3_C runs, respectively.
Atmosphere 11 01322 g008
Figure 9. The time-series of area-averaged and vertically-integrated concentration of (a) SO 4 2 and (b) NH 4 + within the radius of 150-km from the vortex center in the CTRL, SO2_C and NH3_C run. The shaded area in green presents the spread of ensembles.
Atmosphere 11 01322 g009
Figure 10. Time-height evolutions of area-averaged (ac) mixing ratio ( kg   kg 1 ) and (df) number concentration ( kg 1 ) of cloud droplets, (gi) mixing ratio ( kg   kg 1 ) and (jl) number concentration ( kg 1 ) of raindrops, (mo) mixing ratio ( kg   kg 1 ) of snow and graupel within the vortex. The top, middle, and bottom rows represent the CTRL, SO2_C and NH3_C runs, respectively.
Atmosphere 11 01322 g010
Figure 11. Time-height evolutions of area-averaged mass-weighted mean diameter of (a) cloud droplets (um) and (d) raindrops (mm) within the vortex in CTRL run, (b,e) the differences between SO2_C and CTRL runs, and (c,f) the differences between NH3_C and CTRL runs.
Atmosphere 11 01322 g011
Figure 12. Area-averaged and vertically-integrated (a,c) mixing ratio (kg kg−1 m) and (b,d) number concentration (kg−1 m) of cloud droplets and raindrops within the radius of 150 km from the storm center. The shaded area in green presents the spread of ensembles.
Atmosphere 11 01322 g012
Figure 13. Time-height evolutions of area-averaged (a) condensation of cloud droplet ( kg   kg 1   s 1 ), (d) updrafts ( m   s 1 ) and (g) relative humidity (%) within the vortex in CTRL run, (b,e,h) the differences between SO2_C and CTRL runs, and (c,f,i) the differences between NH3_C and CTRL runs.
Atmosphere 11 01322 g013
Table 1. Model setups for numerical experiments.
ItemsModel ConfigurationReferences
Simulation time0000 UTC 1 August to 1200 UTC 2 August 2016, saving at 1-h interval
Time step60 s
Vertical levels50, top at 10 hPa
Horizontal resolution36, 12, and 4 km
Nesting Fixed nests
Land surface model (LSM)Noah LSMChen and Dudhia, [39]
Planetary boundary layer (PBL)Yonsei University PBLHong et al. [40]
Longwave and shortwave radiationRapid Radiative Transfer Model for GCMs RRTMGIacono et al. [38]
Microphysics Morrison two-moment schemeMorrison et al. [35]
Cumulusnew Grell cumulus schemeGrell et al. [37]
ChemistryRADM2
MADE/SORGAM
Stockwell et al. [41];
Ackermann et al. [42]
Schell et al. [43]
EmissionMulti-resolution Emission Inventory for ChinaLi et al. [48]
Sensitivity experiments
NameDescription
CTRLBase-level emission intensity from MEIC
RUN0x_CTRLTen-member ensemble experiments by introducing white noise perturbation into the potential temperature beneath 800m in the initial field.
SO2_CAs in the CTRL, but with one-tenth the emission intensity of SO 2
NH3_CAs in the CTRL, but with one-tenth the emission intensity of NH 3
Table 2. Time-area averaged raindrop number concentration (Nr), mass-weighted diameter (Dr) and source/sink terms of raindrop mixing ratio in three runs. The data within the vortex from 0000 UTC to 0600 UTC 2 August are used.
Raindrop Parameters/Source (Sink) Terms Nr   ( k g 1 ) Dr (mm) Condensation   ( k g     k g 1   s 1 ) Evaporation   ( k g   k g 1   s 1 ) Auto - Conversion   ( k g   k g 1   s 1 ) Accretion   ( k g   k g 1   s 1 ) Snow / Graupel   Melting   ( k g   k g 1   s 1 )
CTRL1.571 × 1050.2871.495 × 10−7−4.590 × 10−86.363 × 10−89.257 × 10⁻⁸−5.342 × 10⁻⁸/−2.021 × 10−8
SO2_C1.600 × 1050.2831.501 × 10−7−4.903 × 10−86.714 × 10−88.961 × 10⁻⁸−5.514 × 10⁻⁸/−1.925 × 10−8
NH3_C1.579 × 1050.2931.529 × 10−7−4.689 × 10−86.590 × 10−89.403 × 10⁻⁸−5.831 × 10⁻⁸/−2.118 × 10−8
Publisher’s Note: MDPI stays neutral with regard to jurisdictional claims in published maps and institutional affiliations.

