Variability in Observation-Based Onroad Emission Constraints from a Near-Road Environment

 , , , and
Abstract
1. Introduction
2. Methods
2.1. Las Vegas Near-Road Field Study
2.2. Data Screening Criteria
2.3. Ambient Data Analysis Methods
2.3.1. Upwind Monitor Data to Determine Cross-Road Gradient ∆CO:∆NOx
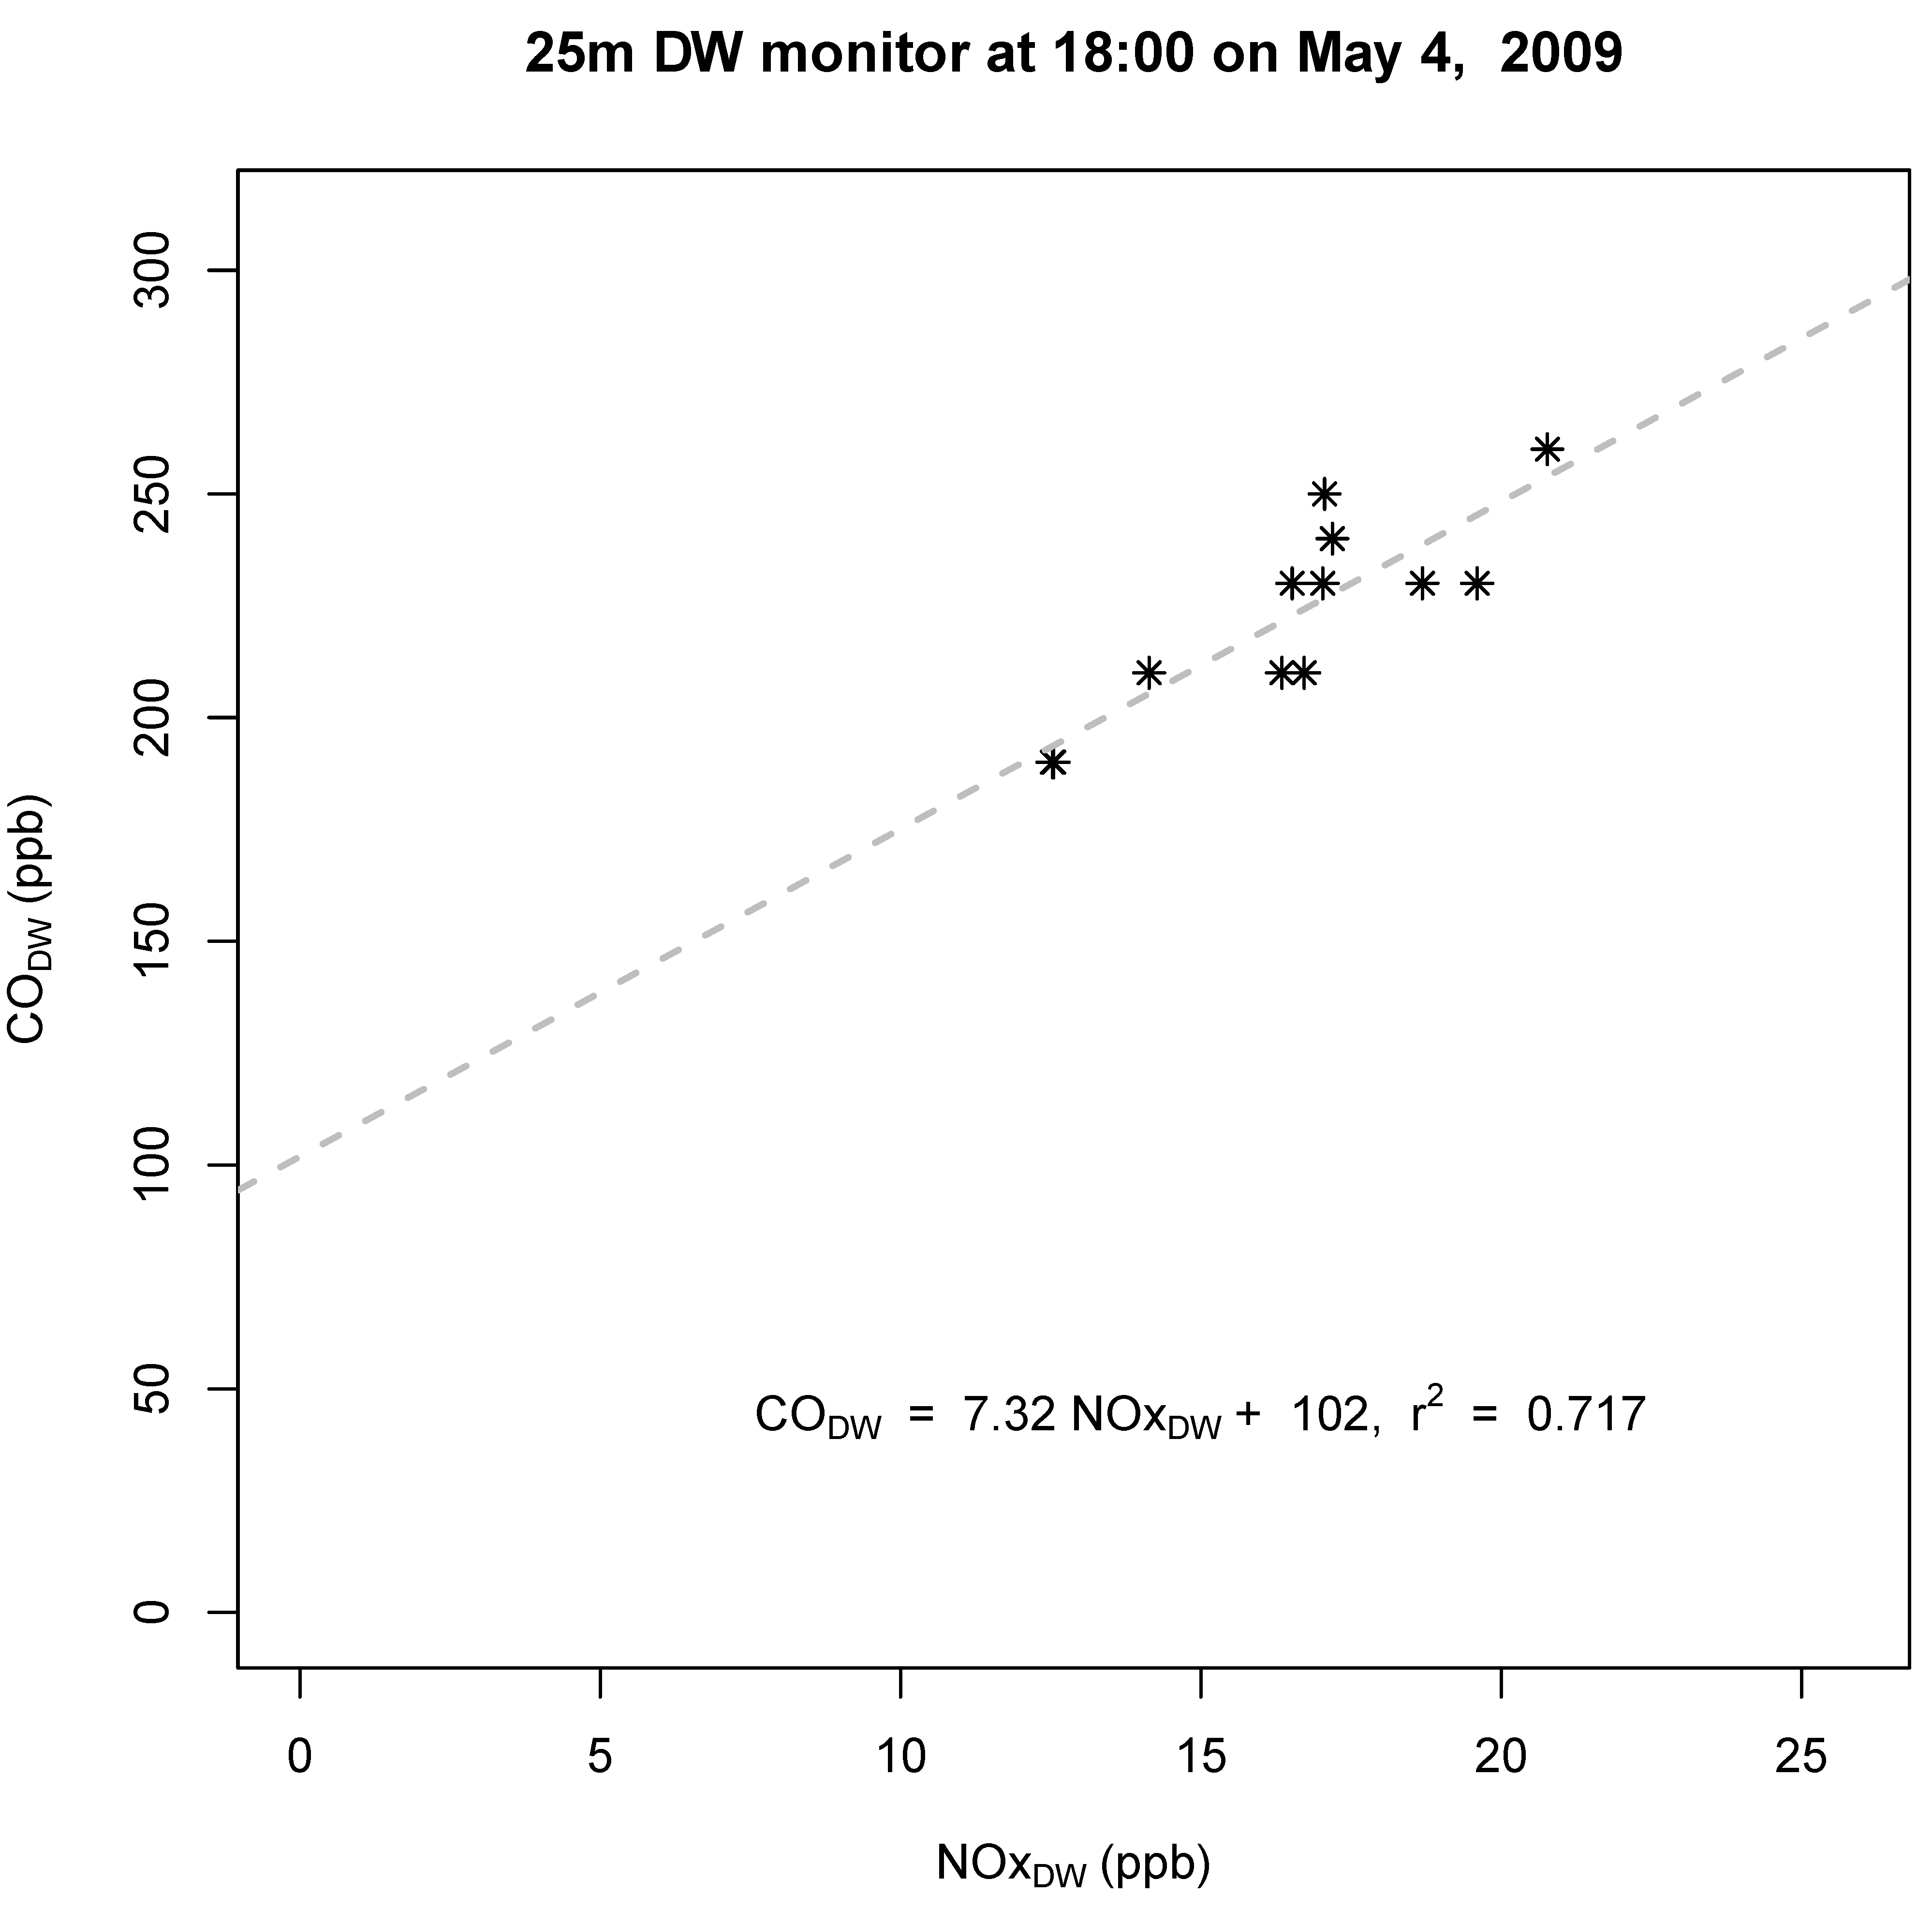
2.3.2. Regression Analyses for Determining Roadway ∆CO:∆NOx
2.4. Roadway CO:NOx from MOVES Emissions Model Simulations
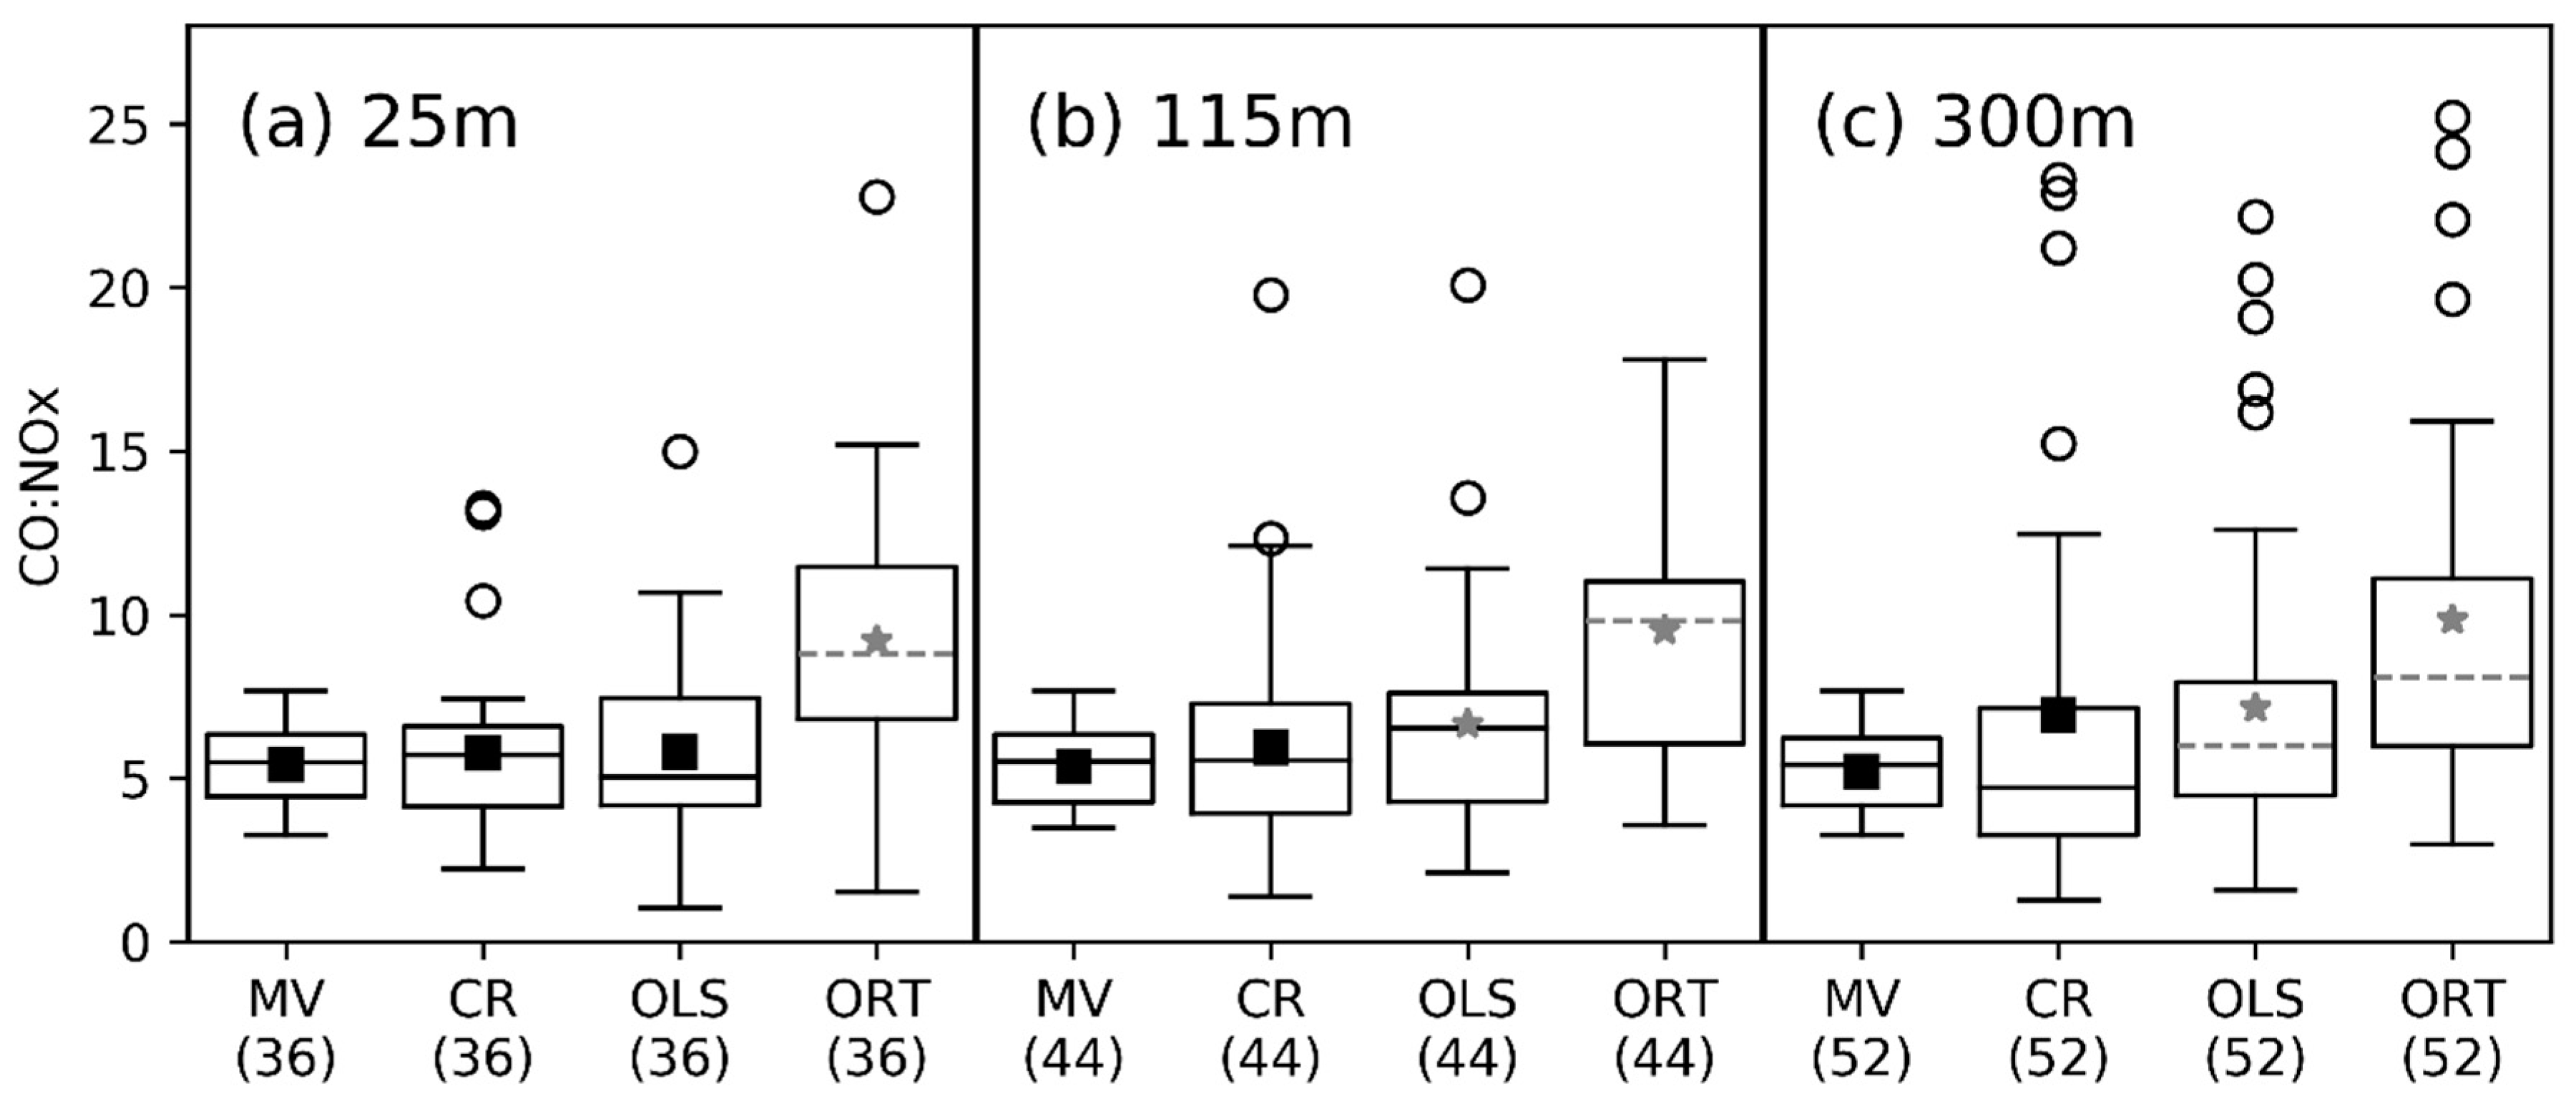
3. Results
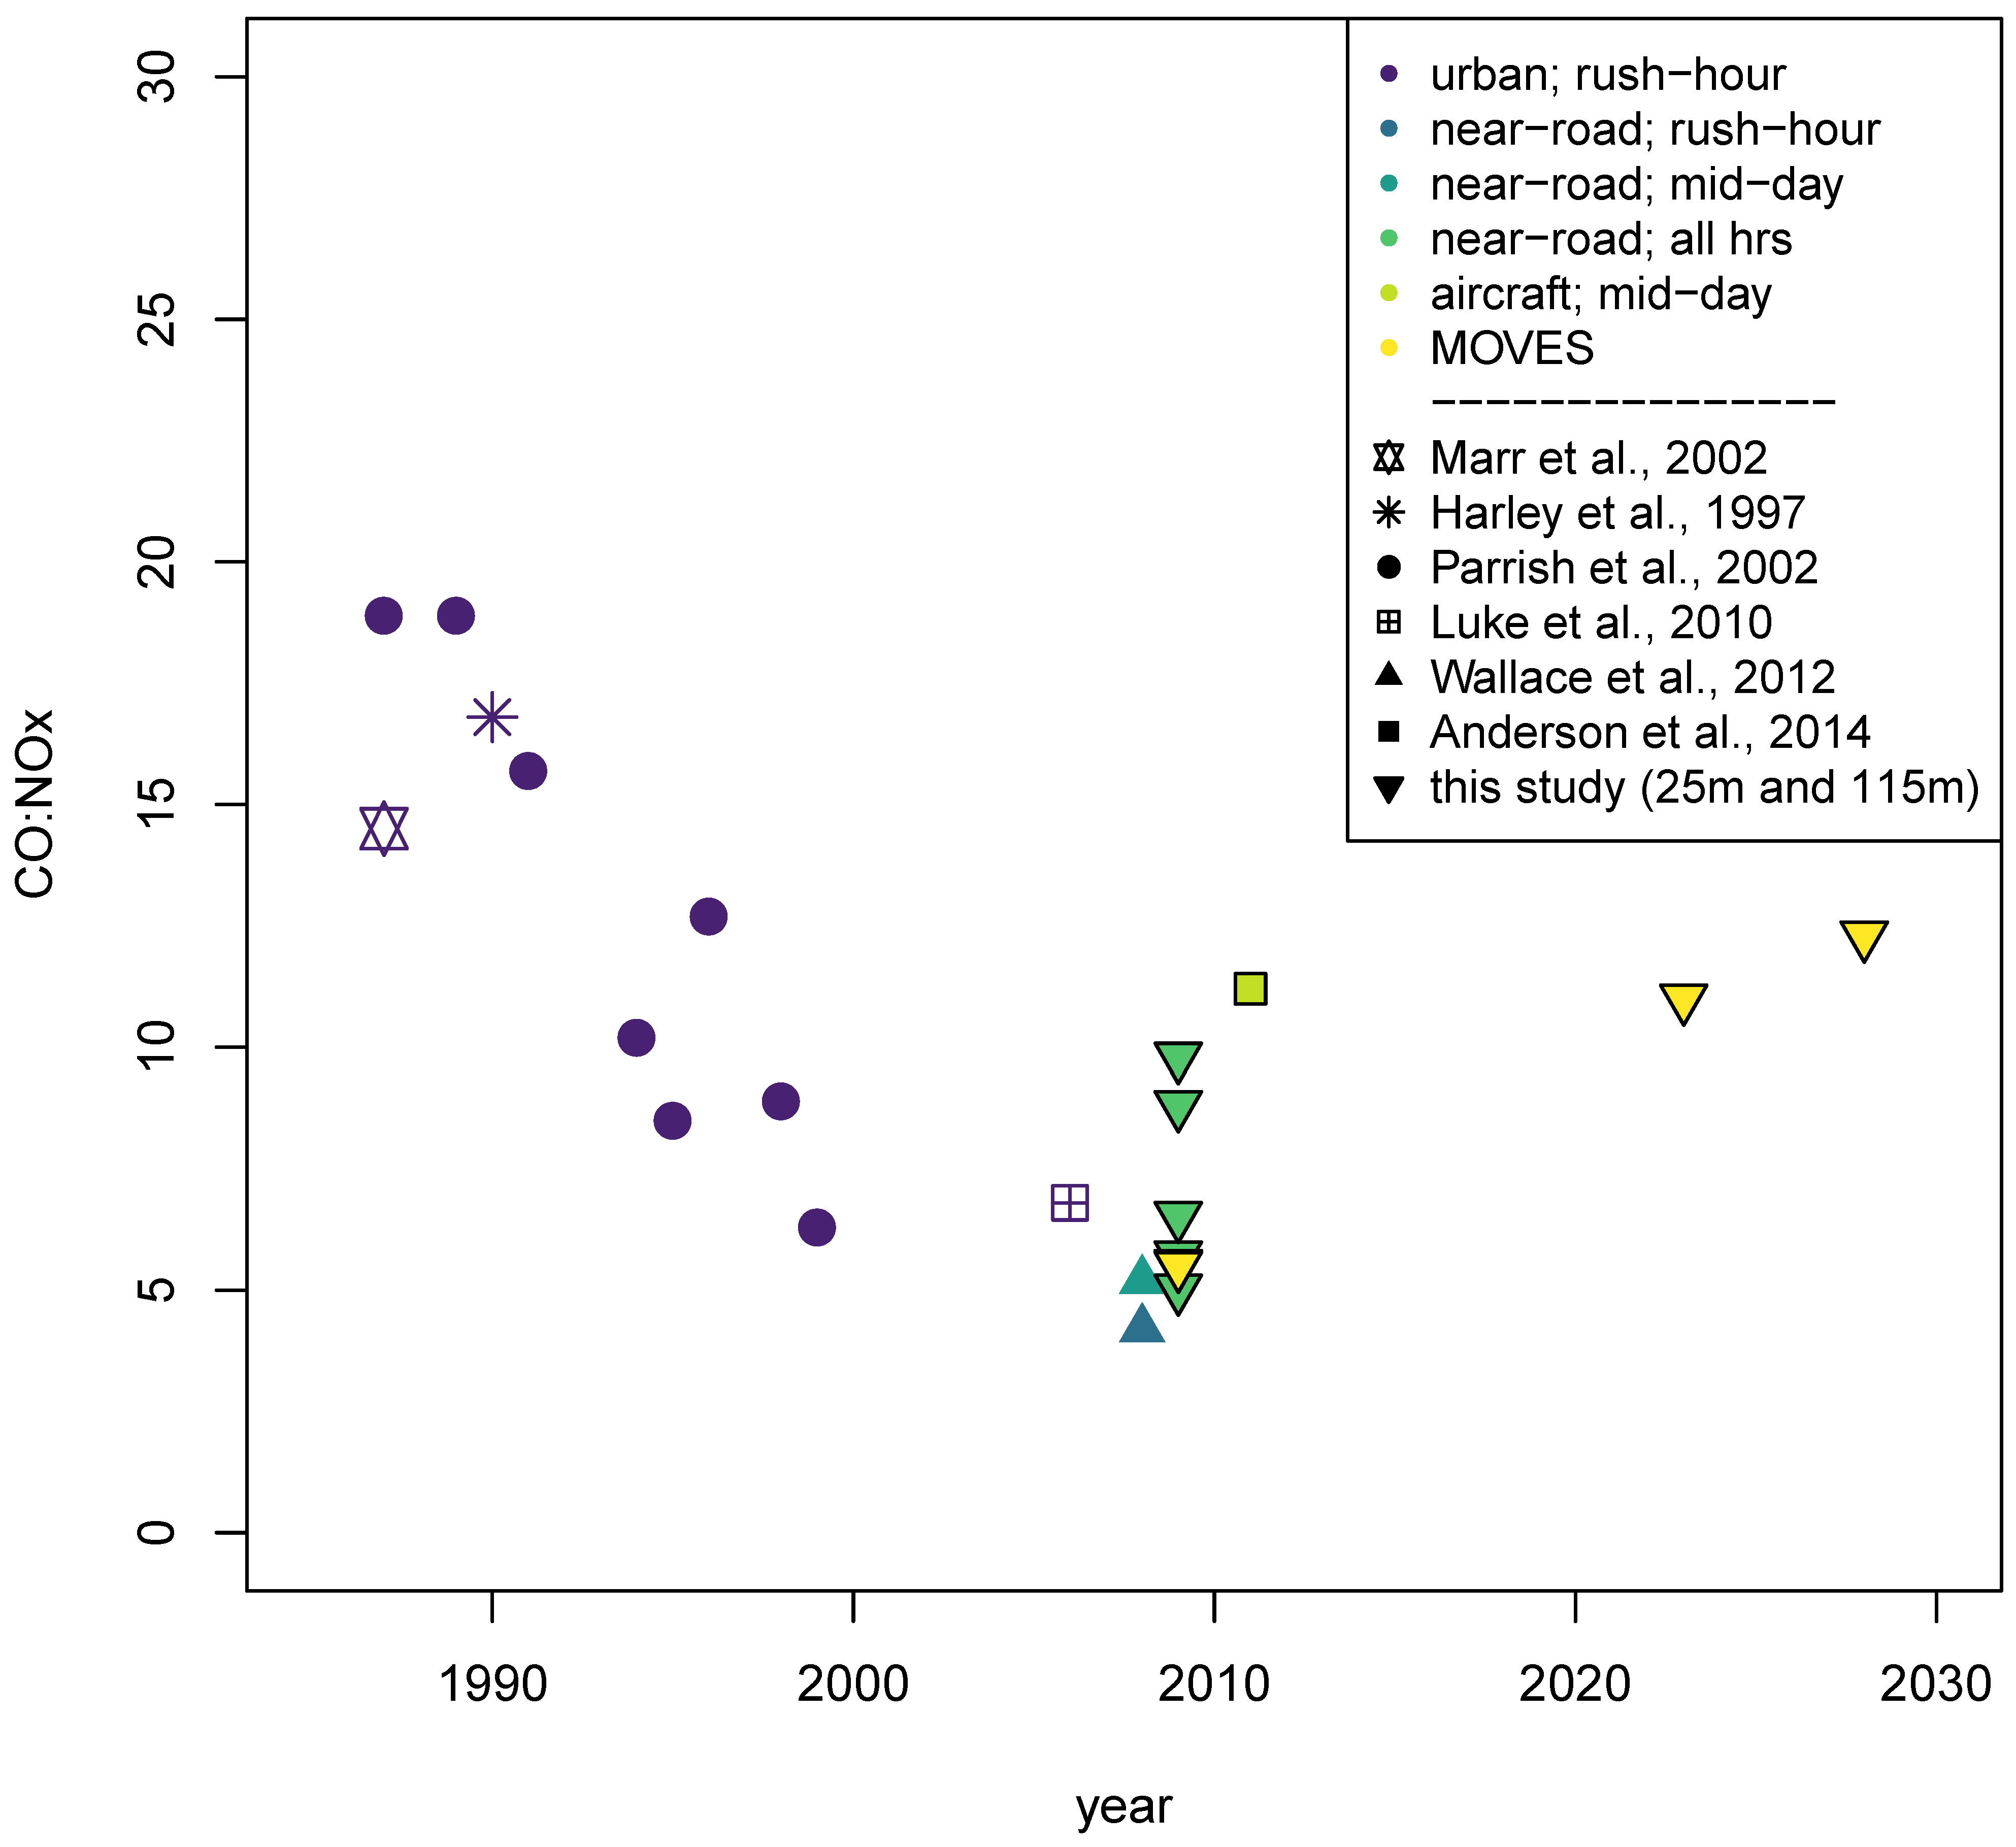
4. Discussion
5. Conclusions
Supplementary Materials
Author Contributions
Funding
Acknowledgments
Conflicts of Interest
Disclaimer
References
- USEPA. 2014 National Emissions Inventory, Version 2 Technical Support Document; OAQPS, Ed.; USEPA: Research Triangle Park, NC, USA, 2018.
- Bond, T.C.; Streets, D.G.; Yarber, K.F.; Nelson, S.M.; Woo, J.H.; Klimont, Z. A technology-based global inventory of black and organic carbon emissions from combustion. J. Geophys. Res. Atmos. 2004, 109, 43. [Google Scholar] [CrossRef]
- Mobley, J.D.; Deslauriers, M.; Rojas-Brachos, L. Improving Emission Inventories for Effective Air-Quality Management across North America—A NARSTO Assessment. Presented at NARSTO Executive Assembly Meeting, Las Vegas, NV, USA, 11–12 April 2005. [Google Scholar]
- Simon, H.; Allen, D.T.; Wittig, A.E. Fine particulate matter emissions inventories: Comparisons of emissions estimates with observations from recent field programs. J. Air Waste Manag. Assoc. 2008, 58, 320–343. [Google Scholar] [CrossRef] [PubMed]
- Smith, S.J.; van Aardenne, J.; Klimont, Z.; Andres, R.J.; Volke, A.; Arias, S.D. Anthropogenic sulfur dioxide emissions: 1850–2005. Atmos. Chem. Phys. 2011, 11, 1101–1116. [Google Scholar] [CrossRef]
- Zhao, Y.; Nielsen, C.P.; Lei, Y.; McElroy, M.B.; Hao, J. Quantifying the uncertainties of a bottom-up emission inventory of anthropogenic atmospheric pollutants in China. Atmos. Chem. Phys. 2011, 11, 2295–2308. [Google Scholar] [CrossRef]
- MOVES. Available online: https://www.epa.gov/moves (accessed on 1 August 2019).
- EMFAC. Available online: https://ww3.arb.ca.gov/msei/msei.htm (accessed on 1 August 2019).
- Beirle, S.; Boersma, K.F.; Platt, U.; Lawrence, M.G.; Wagner, T. Megacity Emissions and Lifetimes of Nitrogen Oxides Probed from Space. Science 2011, 333, 1737–1739. [Google Scholar] [CrossRef]
- Gordon, G.E. Receptor Models. Environ. Sci. Technol. 1980, 14, 792–800. [Google Scholar] [CrossRef]
- Hopke, P.K.; Gladney, E.S.; Gordon, G.E.; Zoller, W.H.; Jones, A.G. Use of Multivariate-Analysis to Identify Sources of Selected Elements in Boston Urban Aerosol. Atmos. Environ. 1976, 10, 1015–1025. [Google Scholar] [CrossRef]
- Martin, R.V.; Jacob, D.J.; Chance, K.; Kurosu, T.P.; Palmer, P.I.; Evans, M.J. Global inventory of nitrogen oxide emissions constrained by space-based observations of NO2 columns. J. Geophys. Res. Atmos. 2003, 108, 12. [Google Scholar] [CrossRef]
- Schauer, J.J.; Rogge, W.F.; Hildemann, L.M.; Mazurek, M.A.; Cass, G.R.; Simoneit, B.R.T. Source apportionment of airborne particulate matter using organic compounds as tracers. Atmos. Environ. 1996, 30, 3837–3855. [Google Scholar] [CrossRef]
- Escribano, J.; Boucher, O.; Chevallier, F.; Huneeus, N. Impact of the choice of the satellite aerosol optical depth product in a sub-regional dust emission inversion. Atmos. Chem. Phys. 2017, 17, 7111–7126. [Google Scholar] [CrossRef]
- Kemball-Cook, S.; Yarwood, G.; Johnson, J.; Dornblaser, B.; Estes, M. Evaluating NOx emission inventories for regulatory air quality modeling using satellite and air quality model data. Atmos. Environ. 2015, 117, 1–8. [Google Scholar] [CrossRef]
- Lee, C.; Martin, R.V.; van Donkelaar, A.; Lee, H.; Dickerson, R.R.; Hains, J.C.; Krotkov, N.; Richter, A.; Vinnikov, K.; Schwab, J.J. SO2 emissions and lifetimes: Estimates from inverse modeling using in situ and global, space-based (SCIAMACHY and OMI) observations. J. Geophys. Res. Atmos. 2011, 116, 13. [Google Scholar] [CrossRef]
- Buhr, M.; Parrish, D.; Elliot, J.; Holloway, J.; Carpenter, J.; Goldan, P.; Kuster, W.; Trainer, M.; Montzka, S.; McKeen, S.; et al. Evaluation of Ozone Precursor Source Types Using Principal Component Analysis of Ambient Air Measurements in Rural Alabama. J. Geophys. Res. Atmos. 1995, 100, 22853–22860. [Google Scholar] [CrossRef]
- Buhr, M.P.; Trainer, M.; Parrish, D.D.; Sievers, R.E.; Fehsenfeld, F.C. Assessment of Pollutant Emission Inventories by Principal Component Analysis of Ambient Air Measurements. Geophys. Res. Lett. 1992, 19, 1009–1012. [Google Scholar] [CrossRef]
- Fujita, E.M.; Croes, B.E.; Bennett, C.L.; Lawson, D.R.; Lurmann, F.W.; Main, H.H. Comparison of Emission Inventory and Ambient Concentration Ratios of Co, Nmog, and Nox in California South Coast Air Basin. J. Air Waste Manag. Assoc. 1992, 42, 264–276. [Google Scholar] [CrossRef]
- Guo, H.; Jiang, F.; Cheng, H.R.; Simpson, I.J.; Wang, X.M.; Ding, A.J.; Wang, T.J.; Saunders, S.M.; Wang, T.; Lam, S.H.M.; et al. Concurrent observations of air pollutants at two sites in the Pearl River Delta and the implication of regional transport. Atmos. Chem. Phys. 2009, 9, 7343–7360. [Google Scholar] [CrossRef]
- Li, S.M.; Anlauf, K.G.; Wiebe, H.A.; Bottenheim, J.W.; Shepson, P.B.; Biesenthal, T. Emission ratios and photochemical production efficiencies of nitrogen oxides, ketones, and aldehydes in the Lower Fraser Valley during the summer Pacific 1993 oxidant study. Atmos. Environ. 1997, 31, 2037–2048. [Google Scholar] [CrossRef]
- Mellios, G.; Van Aalst, R.; Samaras, Z. Validation of road traffic urban emission inventories by means of concentration data measured at air quality monitoring stations in Europe. Atmos. Environ. 2006, 40, 7362–7377. [Google Scholar] [CrossRef]
- Anderson, D.C.; Loughner, C.P.; Diskin, G.; Weinheimer, A.; Canty, T.P.; Salawitch, R.J.; Worden, H.M.; Fried, A.; Mikoviny, T.; Wisthaler, A.; et al. Measured and modeled CO and NOy in DISCOVER-AQ: An evaluation of emissions and chemistry over the eastern US. Atmos. Environ. 2014, 96, 78–87. [Google Scholar] [CrossRef]
- Arriaga-Colina, J.L.; West, J.J.; Sosa, G.; Escalona, S.S.; Ordunez, R.M.; Cervantes, A.D.M. Measurements of VOCs in Mexico City (1992–2001) and evaluation of VOCs and CO in the emissions inventory. Atmos. Environ. 2004, 38, 2523–2533. [Google Scholar] [CrossRef]
- Harley, R.A.; Sawyer, R.F.; Milford, J.B. Updated photochemical modeling for California’s South Coast Air Basin: Comparison of chemical mechanisms and motor vehicle emission inventories. Environ. Sci. Technol. 1997, 31, 2829–2839. [Google Scholar] [CrossRef]
- Hassler, B.; McDonald, B.C.; Frost, G.J.; Borbon, A.; Carslaw, D.C.; Civerolo, K.; Granier, C.; Monks, P.S.; Monks, S.; Parrish, D.D.; et al. Analysis of long-term observations of NOx and CO in megacities and application to constraining emissions inventories. Geophys. Res. Lett. 2016, 43, 9920–9930. [Google Scholar] [CrossRef]
- Kourtidis, K.A.; Ziomas, I.C.; Rappenglueck, B.; Proyou, A.; Balis, D. Evaporative traffic hydrocarbon emissions, traffic CO and speciated HC traffic emissions from the city of Athens. Atmos. Environ. 1999, 33, 3831–3842. [Google Scholar] [CrossRef]
- Marr, L.C.; Black, D.R.; Harley, R.A. Formation of photochemical air pollution in central California—1. Development of a revised motor vehicle emission inventory. J. Geophys. Res. Atmos. 2002, 107, 9. [Google Scholar] [CrossRef]
- Parrish, D.D. Critical evaluation of US on-road vehicle emission inventories. Atmos. Environ. 2006, 40, 2288–2300. [Google Scholar] [CrossRef]
- Pierson, W.R.; Gertler, A.W.; Bradow, R.L. Comparison of the Scaqs Tunnel Study with other On-Road Vehicle Emission Data. J. Air Waste Manag. Assoc. 1990, 40, 1495–1504. [Google Scholar] [CrossRef]
- Vivanco, M.G.; Andrade, M.D. Validation of the emission inventory in the Sao Paulo Metropolitan Area of Brazil, based on ambient concentrations ratios of CO, NMOG and NOx and on a photochemical model. Atmos. Environ. 2006, 40, 1189–1198. [Google Scholar] [CrossRef]
- Wallace, H.W.; Jobson, B.T.; Erickson, M.H.; McCoskey, J.K.; VanReken, T.M.; Lamb, B.K.; Vaughan, J.K.; Hardy, R.J.; Cole, J.L.; Strachan, S.M.; et al. Comparison of wintertime CO to NOx ratios to MOVES and MOBILE6.2 on-road emissions inventories. Atmos. Environ. 2012, 63, 289–297. [Google Scholar] [CrossRef]
- Salmon, O.E.; Shepson, P.B.; Ren, X.; He, H.; Hall, D.L.; Dickerson, R.R.; Stirm, B.H.; Brown, S.S.; Fibiger, D.L.; McDuffie, E.E.; et al. Top-Down Estimates of NOx and CO Emissions From Washington, DC-Baltimore During the WINTER Campaign. J. Geophys. Res. Atmos. 2018, 123, 7705–7724. [Google Scholar]
- Luke, W.T.; Kelley, P.; Lefer, B.L.; Flynn, J.; Rappengluck, B.; Leuchner, M.; Dibb, J.E.; Ziemba, L.D.; Anderson, C.H.; Buhr, M. Measurements of primary trace gases and NOy composition in Houston, Texas. Atmos. Environ. 2010, 44, 4068–4080. [Google Scholar] [CrossRef]
- Simon, H.; Valin, L.C.; Baker, K.R.; Henderson, B.H.; Crawford, J.H.; Pusede, S.E.; Kelly, J.T.; Foley, K.M.; Chris Owen, R.; Cohen, R.C.; et al. Characterizing CO and NOy Sources and Relative Ambient Ratios in the Baltimore Area Using Ambient Measurements and Source Attribution Modeling. J. Geophys. Res. Atmos. 2018, 123, 3304–3320. [Google Scholar] [CrossRef]
- Kimbrough, S.; Baldauf, R.W.; Hagler, G.S.W.; Shores, R.C.; Mitchell, W.; Whitaker, D.A.; Croghan, C.W.; Vallero, D.A. Long-term continuous measurement of near-road air pollution in Las Vegas: Seasonal variability in traffic emissions impact on local air quality. Air Qual. Atmos. Health 2013, 6, 295–305. [Google Scholar] [CrossRef]
- Kimbrough, S.; Hanley, T.; Hagler, G.; Baldauf, R.; Snyder, M.; Brantley, H. Influential factors affecting black carbon trends at four sites of differing distance from a major highway in Las Vegas. Air Qual. Atmos. Health 2018, 11, 181–196. [Google Scholar] [CrossRef]
- Browne, E.C.; Cohen, R.C. Effects of biogenic nitrate chemistry on the NOx lifetime in remote continental regions. Atmos. Chem. Phys. 2012, 12, 11917–11932. [Google Scholar] [CrossRef]
- de Foy, B.; Lu, Z.F.; Streets, D.G.; Lamsal, L.N.; Duncan, B.N. Estimates of power plant NOx emissions and lifetimes from OMI NO2 satellite retrievals. Atmos. Environ. 2015, 116, 1–11. [Google Scholar] [CrossRef]
- Kunhikrishnan, T.; Lawrence, M.G.; von Kuhlmann, R.; Richter, A.; Ladstatter-Weissenmayer, A.; Burrows, J.P. Analysis of tropospheric NOx over Asia using the model of atmospheric transport and chemistry (MATCH-MPIC) and GOME-satellite observations. Atmos. Environ. 2004, 38, 581–596. [Google Scholar] [CrossRef]
- Liu, F.; Beirle, S.; Zhang, Q.; Dorner, S.; He, K.B.; Wagner, T. NOx lifetimes and emissions of cities and power plants in polluted background estimated by satellite observations. Atmos. Chem. Phys. 2016, 16, 5283–5298. [Google Scholar] [CrossRef]
- Schaub, D.; Brunner, D.; Boersma, K.F.; Keller, J.; Folini, D.; Buchmann, B.; Berresheim, H.; Staehelin, J. SCIAMACHY tropospheric NO2 over Switzerland: Estimates of NOx lifetimes and impact of the complex Alpine topography on the retrieval. Atmos. Chem. Phys. 2007, 7, 5971–5987. [Google Scholar] [CrossRef]
- York, D.; Evensen, N.M.; Martinez, M.L.; Delgado, J.D. Unified equations for the slope, intercept, and standard errors of the best straight line. Am. J. Phys. 2004, 72, 367–375. [Google Scholar] [CrossRef]
- Prather, M.J. Time scales in atmospheric chemistry: Theory, GWPs for CH4 and CO, and runaway growth. Geophys. Res. Lett. 1996, 23, 2597–2600. [Google Scholar] [CrossRef]
- Xiao, Y.P.; Jacob, D.J.; Turquety, S. Atmospheric acetylene and its relationship with CO as an indicator of air mass age. J. Geophys. Res. Atmos. 2007, 112, 14. [Google Scholar] [CrossRef]
- Barre, J.; Edwards, D.; Worden, H.; Arellano, A.; Gaubert, B.; Da Silva, A.; Lahoz, W.; Anderson, J. On the feasibility of monitoring carbon monoxide in the lower troposphere from a constellation of northern hemisphere geostationary satellites: Global scale assimilation experiments (Part II). Atmos. Environ. 2016, 140, 188–201. [Google Scholar] [CrossRef]
- Edwards, D.P.; Emmons, L.K.; Hauglustaine, D.A.; Chu, D.A.; Gille, J.C.; Kaufman, Y.J.; Petron, G.; Yurganov, L.N.; Giglio, L.; Deeter, M.N.; et al. Observations of carbon monoxide and aerosols from the Terra satellite: Northern Hemisphere variability. J. Geophys. Res. Atmos. 2004, 109, 17. [Google Scholar] [CrossRef]
- Wu, C.; Yu, J.Z. Evaluation of linear regression techniques for atmospheric applications: The importance of appropriate weighting. Atmos. Meas. Tech. 2018, 11, 1233–1250. [Google Scholar] [CrossRef]
- Cantrell, C.A. Technical Note: Review of methods for linear least-squares fitting of data and application to atmospheric chemistry problems. Atmos. Chem. Phys. 2008, 8, 5477–5487. [Google Scholar] [CrossRef]
- R Core Team. R: A Language and Environment for Statistical Computing; R Foundation for Statistical Computing: Vienna, Austria, 2013. [Google Scholar]
- USEPA. MOVES2014, MOVES2014a, and MOVES2014b Technical Guidance: Using MOVES to Prepare Emission Inventories for State Implementation Plans and Transportation Conformity; USEPA: Washington, DC, USA, 2018; Volume EPA-420-B-18-039.
- FHA. UC Riverside, Improving Vehicle Fleet, Activity, and Emissions Data for On-Road Mobile Sources Emissions Inventories FINAL REPORT, Prepared for: Federal Highway Administration; FHA: Washington, DC, USA, 2011.
- Snyder, M. Filling the gaps: Estimating roadway emissions using inconsistent traffic measurements in Las Vegas, Nevada near-road field study. In Proceedings of the Community Modeling and Analysis System Annual Conference, Chapel Hill, NC, USA, 22–24 October 2018. [Google Scholar]
- FHA. UC Riverside. Improving Vehicle Fleet, Activity, and Emissions Data for On-Road Mobile Sources Emissions Inventories FINAL REPORT; FHWA: Washington, DC, USA, 2011.
- Hall, D.L.; Anderson, D.C.; Martin, C.R.; Ren, X.R.; Salawitch, R.J.; He, H.; Canty, T.P.; Hains, J.C.; Dickerson, R.R. Using near-road observations of CO, NOy, and CO2 to investigate emissions from vehicles: Evidence for an impact of ambient temperature and specific humidity. Atmos. Environ. 2020, 232, 12. [Google Scholar] [CrossRef]
- Parrish, D.D.; Allen, D.T.; Bates, T.S.; Estes, M.; Fehsenfeld, F.C.; Feingold, G.; Ferrare, R.; Hardesty, R.M.; Meagher, J.F.; Nielsen-Gammon, J.W.; et al. Overview of the Second Texas Air Quality Study (TexAQS II) and the Gulf of Mexico Atmospheric Composition and Climate Study (GoMACCS). J. Geophys. Res. Atmos. 2009, 114. [Google Scholar] [CrossRef]
- USEPA. Emissions Files for 2016 Emissions Modeling Platofrm. Available online: ftp://newftp.epa.gov/air/emismod/2016/v1/reports/ (accessed on 1 September 2020).
- Bishop, J.D.K.; Molden, N.; Boies, A.M. Using portable emissions measurement systems (PEMS) to derive more accurate estimates of fuel use and nitrogen oxides emissions from modern Euro 6 passenger cars under real-world driving conditions. Appl. Energy 2019, 242, 942–973. [Google Scholar] [CrossRef]
- Carslaw, D.C.; Beevers, S.D.; Tate, J.E.; Westmoreland, E.J.; Williams, M.L. Recent evidence concerning higher NOx emissions from passenger cars and light duty vehicles. Atmos. Environ. 2011, 45, 7053–7063. [Google Scholar] [CrossRef]
- Durbin, T.D.; Johnson, K.; Cocker, D.R.; Miller, J.W.; Maldonado, H.; Shah, A.; Ensfield, C.; Weaver, C.; Akard, M.; Harvey, N.; et al. Evaluation and Comparison of Portable Emissions Measurement Systems and Federal Reference Methods for Emissions from a Back-Up Generator and a Diesel Truck Operated on a Chassis Dynamometer. Environ. Sci. Technol. 2007, 41, 6199–6204. [Google Scholar] [CrossRef]
- Durbin, T.D.; Johnson, K.; Miller, J.W.; Maldonado, H.; Chernich, D. Emissions from heavy-duty vehicles under actual on-road driving conditions. Atmos. Environ. 2008, 42, 4812–4821. [Google Scholar] [CrossRef]
- Giechaskiel, B.; Clairotte, M.; Valverde-Morales, V.; Bonnel, P.; Kregar, Z.; Franco, V.; Dilara, P. Framework for the assessment of PEMS (Portable Emissions Measurement Systems) uncertainty. Environ. Res. 2018, 166, 251–260. [Google Scholar] [CrossRef] [PubMed]
- Johnson, K.C.; Durbin, T.D.; Cocker, D.R.; Miller, W.J.; Bishnu, D.K.; Maldonado, H.; Moynahan, N.; Ensfield, C.; Laroo, C.A. On-road comparison of a portable emission measurement system with a mobile reference laboratory for a heavy-duty diesel vehicle. Atmos. Environ. 2009, 43, 2877–2883. [Google Scholar] [CrossRef]
- Mamakos, A.; Bonnel, P.; Perujo, A.; Carriero, M. Assessment of portable emission measurement systems (PEMS) for heavy-duty diesel engines with respect to particulate matter. J. Aerosol. Sci. 2013, 57, 54–70. [Google Scholar] [CrossRef]
- Kittelson, D.B.; Watts, W.F.; Johnson, J.P.; Schauer, J.J.; Lawson, D.R. On-road and laboratory evaluation of combustion aerosols—Part 2: Summary of spark ignition engine results. J. Aerosol. Sci. 2006, 37, 931–949. [Google Scholar] [CrossRef]
- An, F.; Barth, M.; Ross, M. Vehicle Total Life-Cycle Exhaust Emissions; SAE International: Warrendale, PA, USA, 1995. [Google Scholar]
- Morawska, L.; Ristovski, Z.D.; Johnson, G.R.; Jayaratne, E.R.; Mengersen, K. Novel Method for On-Road Emission Factor Measurements Using a Plume Capture Trailer. Environ. Sci. Technol. 2007, 41, 574–579. [Google Scholar] [CrossRef]
- Wehner, B.; Uhrner, U.; von Löwis, S.; Zallinger, M.; Wiedensohler, A. Aerosol number size distributions within the exhaust plume of a diesel and a gasoline passenger car under on-road conditions and determination of emission factors. Atmos. Environ. 2009, 43, 1235–1245. [Google Scholar] [CrossRef]
- Canagaratna, M.R.; Jayne, J.T.; Ghertner, D.A.; Herndon, S.; Shi, Q.; Jimenez, J.L.; Silva, P.J.; Williams, P.; Lanni, T.; Drewnick, F.; et al. Chase Studies of Particulate Emissions from in-use New York City Vehicles. Aerosol Sci. Technol. 2004, 38, 555–573. [Google Scholar] [CrossRef]
- Burgard, D.A.; Bishop, G.A.; Stedman, D.H.; Gessner, V.H.; Daeschlein, C. Remote Sensing of In-Use Heavy-Duty Diesel Trucks. Environ. Sci. Technol. 2006, 40, 6938–6942. [Google Scholar] [CrossRef]
- Bishop, G.A.; Starkey, J.R.; Ihlenfeldt, A.; Williams, W.J.; Stedman, D.H. IR Long-Path Photometry: A Remote Sensing Tool for Automobile Emissions. Anal. Chem. 1989, 61, 671A–677A. [Google Scholar] [CrossRef]
- Zhang, Y.; Stedman, D.H.; Bishop, G.A.; Guenther, P.L.; Beaton, S.P. Worldwide On-Road Vehicle Exhaust Emissions Study by Remote Sensing. Environ. Sci. Technol. 1995, 29, 2286–2294. [Google Scholar] [CrossRef] [PubMed]
- Popp, P.J.; Bishop, G.A.; Stedman, D.H. Development of a High-Speed Ultraviolet Spectrometer for Remote Sensing of Mobile Source Nitric Oxide Emissions. J. Air Waste Manag. Assoc. 1999, 49, 1463–1468. [Google Scholar] [CrossRef] [PubMed]
- Guenther, P.L.; Bishop, G.A.; Peterson, J.E.; Stedman, D.H. Emissions from 200,000 vehicles: A remote sensing study. Sci. Total Environ. 1994, 146–147, 297–302. [Google Scholar] [CrossRef]
- Burgard, D.A.; Bishop, G.A.; Stadtmuller, R.S.; Dalton, T.R.; Stedman, D.H. Spectroscopy Applied to On-Road Mobile Source Emissions. Appl. Spectrosc. 2006, 60, 135A–148A. [Google Scholar] [CrossRef] [PubMed]


| Method | Error in Measurement Assumptions |
|---|---|
| Cross-road gradient | No instrument drift; differences in up-wind and down-wind monitors are solely due to emissions along I-15 |
| OLS | σx = 0, or σx << σy |
| Orthogonal Regression | σx / σy = 1 |
| Method | Distance from Roadway (m) | Mean | Median | ||
|---|---|---|---|---|---|
| Scaling Ratio | p-Value * | Scaling Ratio | p-Value * | ||
| Cross-road gradient | 25 | 0.94 | 0.43 | 0.96 | 0.92 |
| 115 | 0.90 | 0.25 | 0.99 | 0.62 | |
| 300 | 0.75 | 0.10 | 1.15 | 0.29 | |
| OLS regression | 25 | 0.93 | 0.47 | 1.09 | 0.88 |
| 115 | 0.80 | 0.02 | 0.84 | 0.06 | |
| 300 | 0.73 | 4.59 × 10⁻³ | 0.90 | 0.04 | |
| Orthogonal regression | 25 | 0.59 | 1.42 × 10⁻⁶ | 0.62 | 1.58 × 10⁻⁷ |
| 115 | 0.56 | 8.23 × 10⁻⁷ | 0.56 | 2.14 × 10⁻⁷ | |
| 300 | 0.53 | 2.83 × 10⁻⁶ | 0.67 | 1.36 × 10⁻⁸ | |
Publisher’s Note: MDPI stays neutral with regard to jurisdictional claims in published maps and institutional affiliations. |
© 2020 by the authors. Licensee MDPI, Basel, Switzerland. This article is an open access article distributed under the terms and conditions of the Creative Commons Attribution (CC BY) license (http://creativecommons.org/licenses/by/4.0/).
Share and Cite
Simon, H.; Henderson, B.H.; Owen, R.C.; Foley, K.M.; Snyder, M.G.; Kimbrough, S. Variability in Observation-Based Onroad Emission Constraints from a Near-Road Environment. Atmosphere 2020, 11, 1243. https://doi.org/10.3390/atmos11111243
Simon H, Henderson BH, Owen RC, Foley KM, Snyder MG, Kimbrough S. Variability in Observation-Based Onroad Emission Constraints from a Near-Road Environment. Atmosphere. 2020; 11(11):1243. https://doi.org/10.3390/atmos11111243
Chicago/Turabian StyleSimon, Heather, Barron H. Henderson, R. Chris Owen, Kristen M. Foley, Michelle G. Snyder, and Sue Kimbrough. 2020. "Variability in Observation-Based Onroad Emission Constraints from a Near-Road Environment" Atmosphere 11, no. 11: 1243. https://doi.org/10.3390/atmos11111243
APA StyleSimon, H., Henderson, B. H., Owen, R. C., Foley, K. M., Snyder, M. G., & Kimbrough, S. (2020). Variability in Observation-Based Onroad Emission Constraints from a Near-Road Environment. Atmosphere, 11(11), 1243. https://doi.org/10.3390/atmos11111243