Meteorological Drought Changes and Related Circulation Characteristics in Yulin City of the Northern Shaanxi from 1961 to 2015


Abstract
:1. Introduction
2. Data and Methods
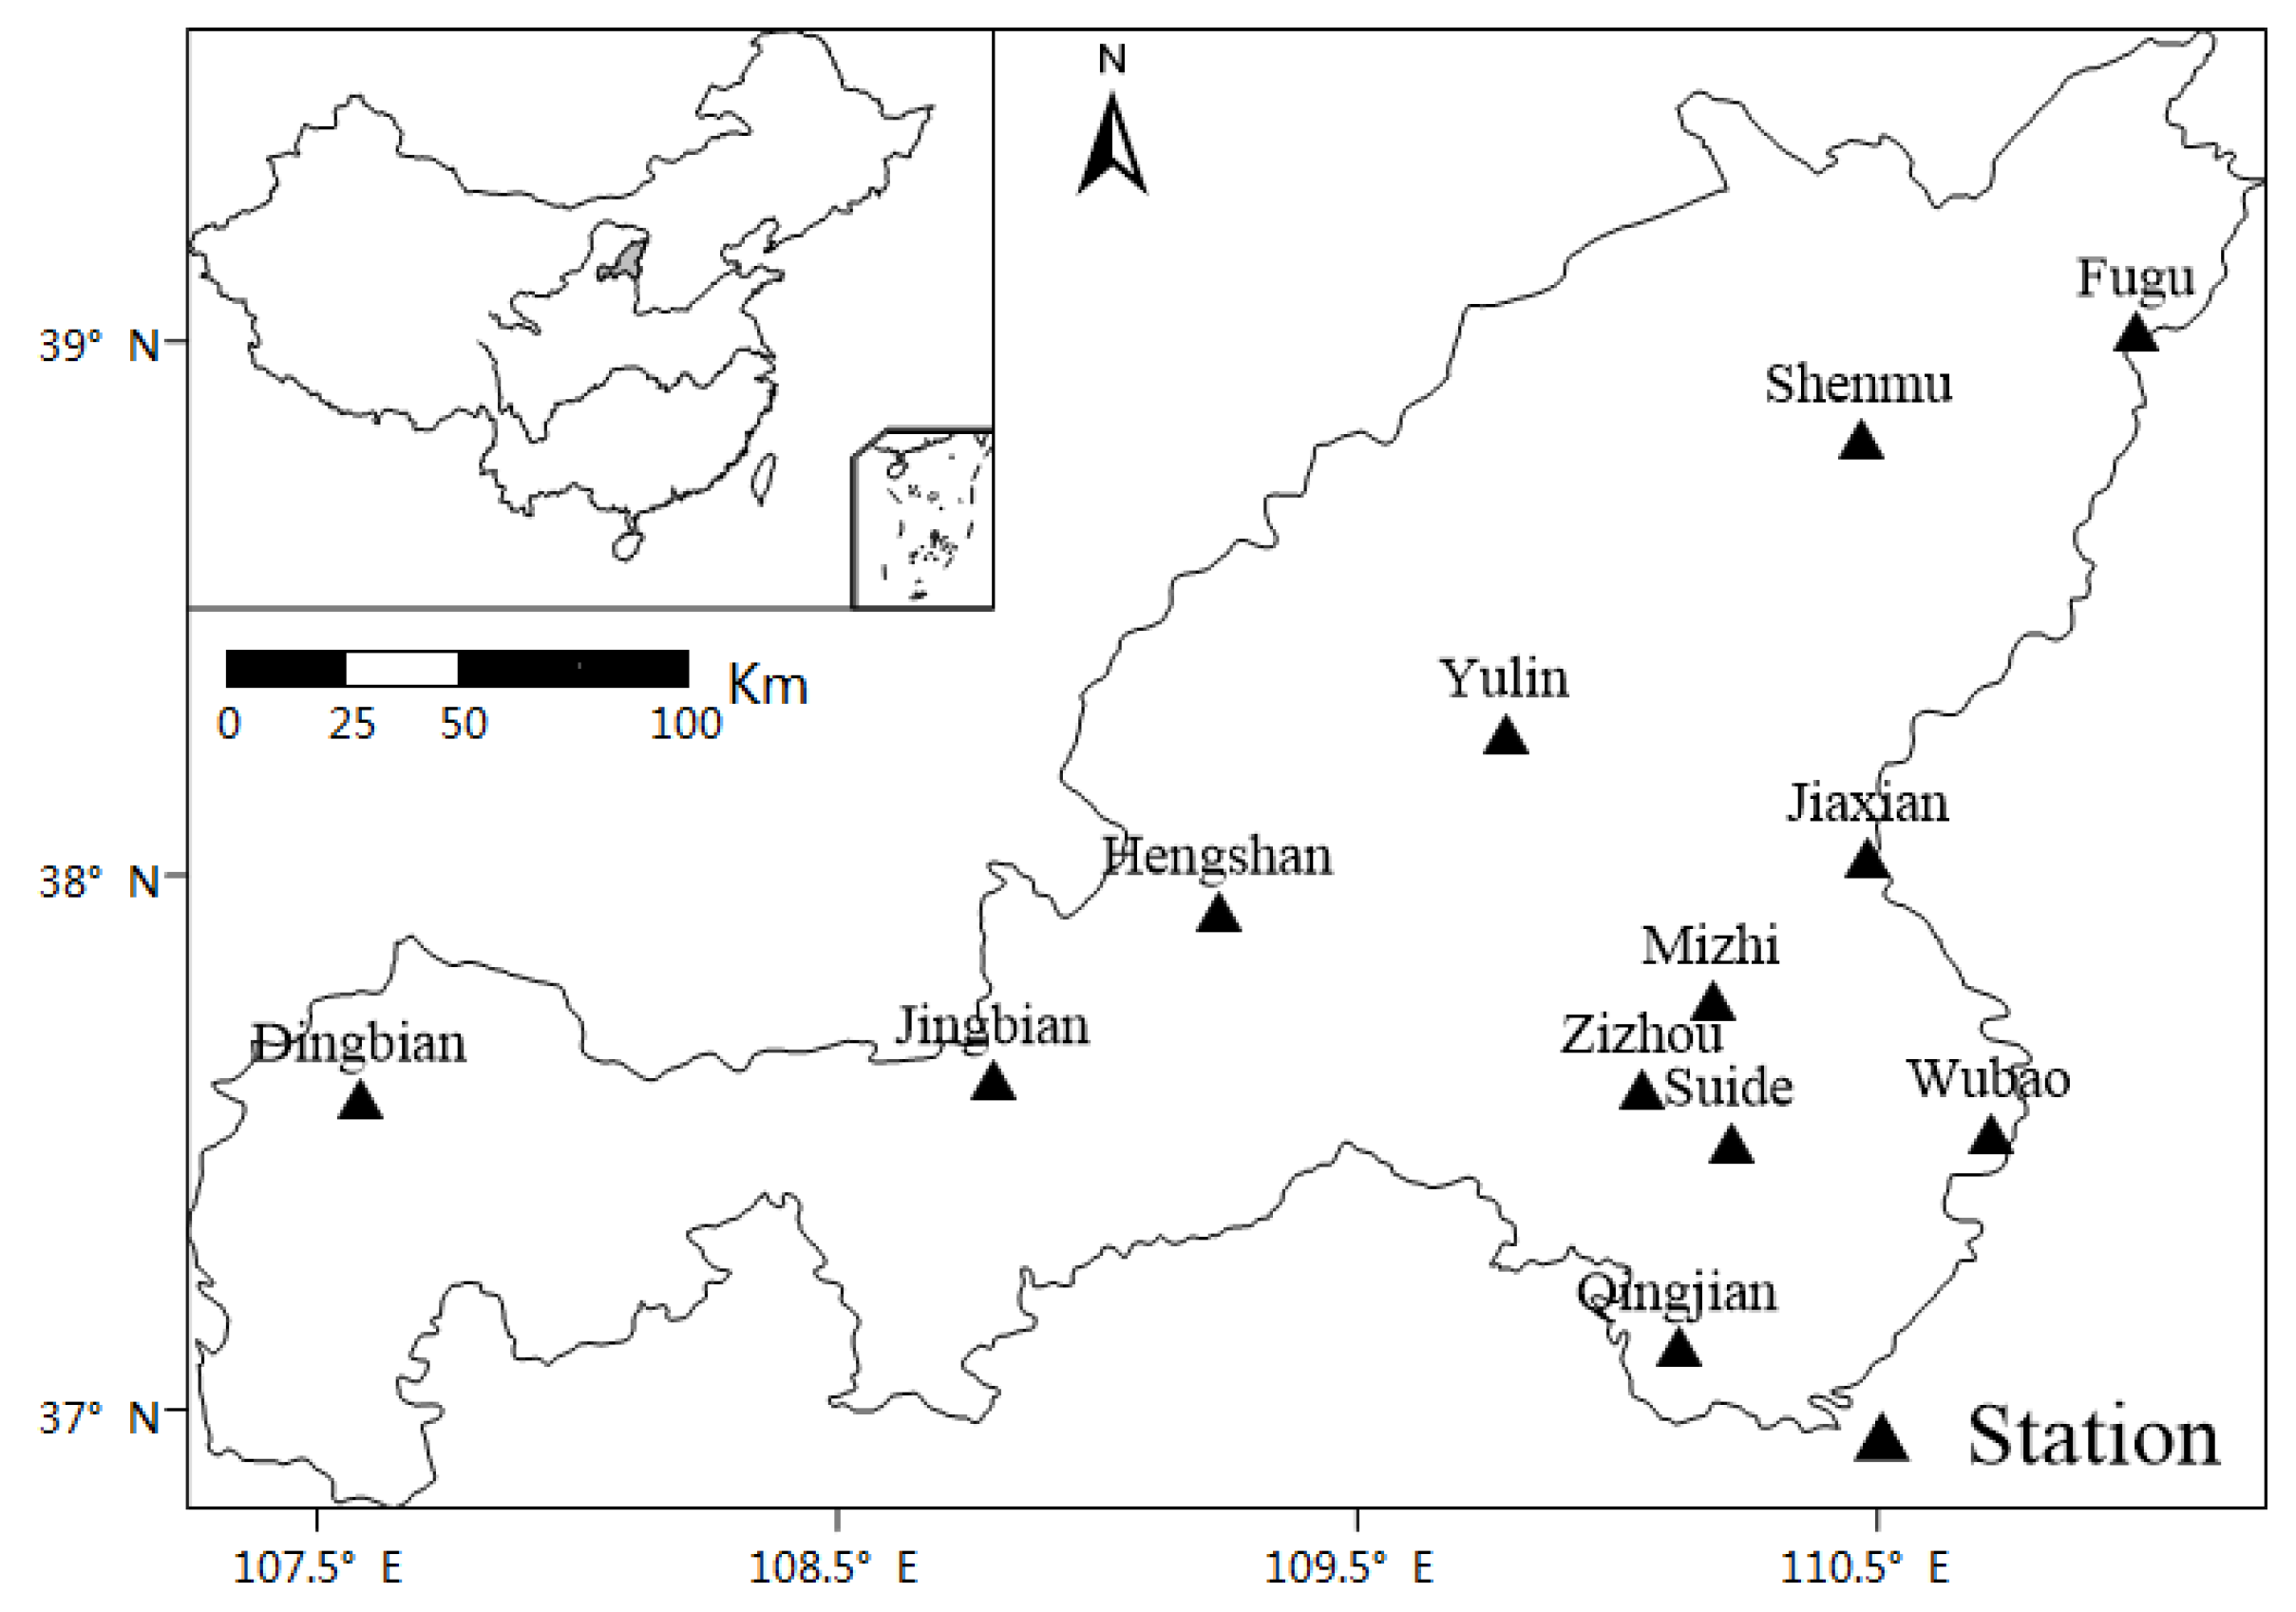
2.1. Data
2.2. Methods
2.2.1. Standardized Precipitation Index
2.2.2. Drought Occurrence Frequency
2.2.3. Empirical Orthogonal Function
3. Results and Analysis
3.1. Spatio-Temporal Changes in Drought
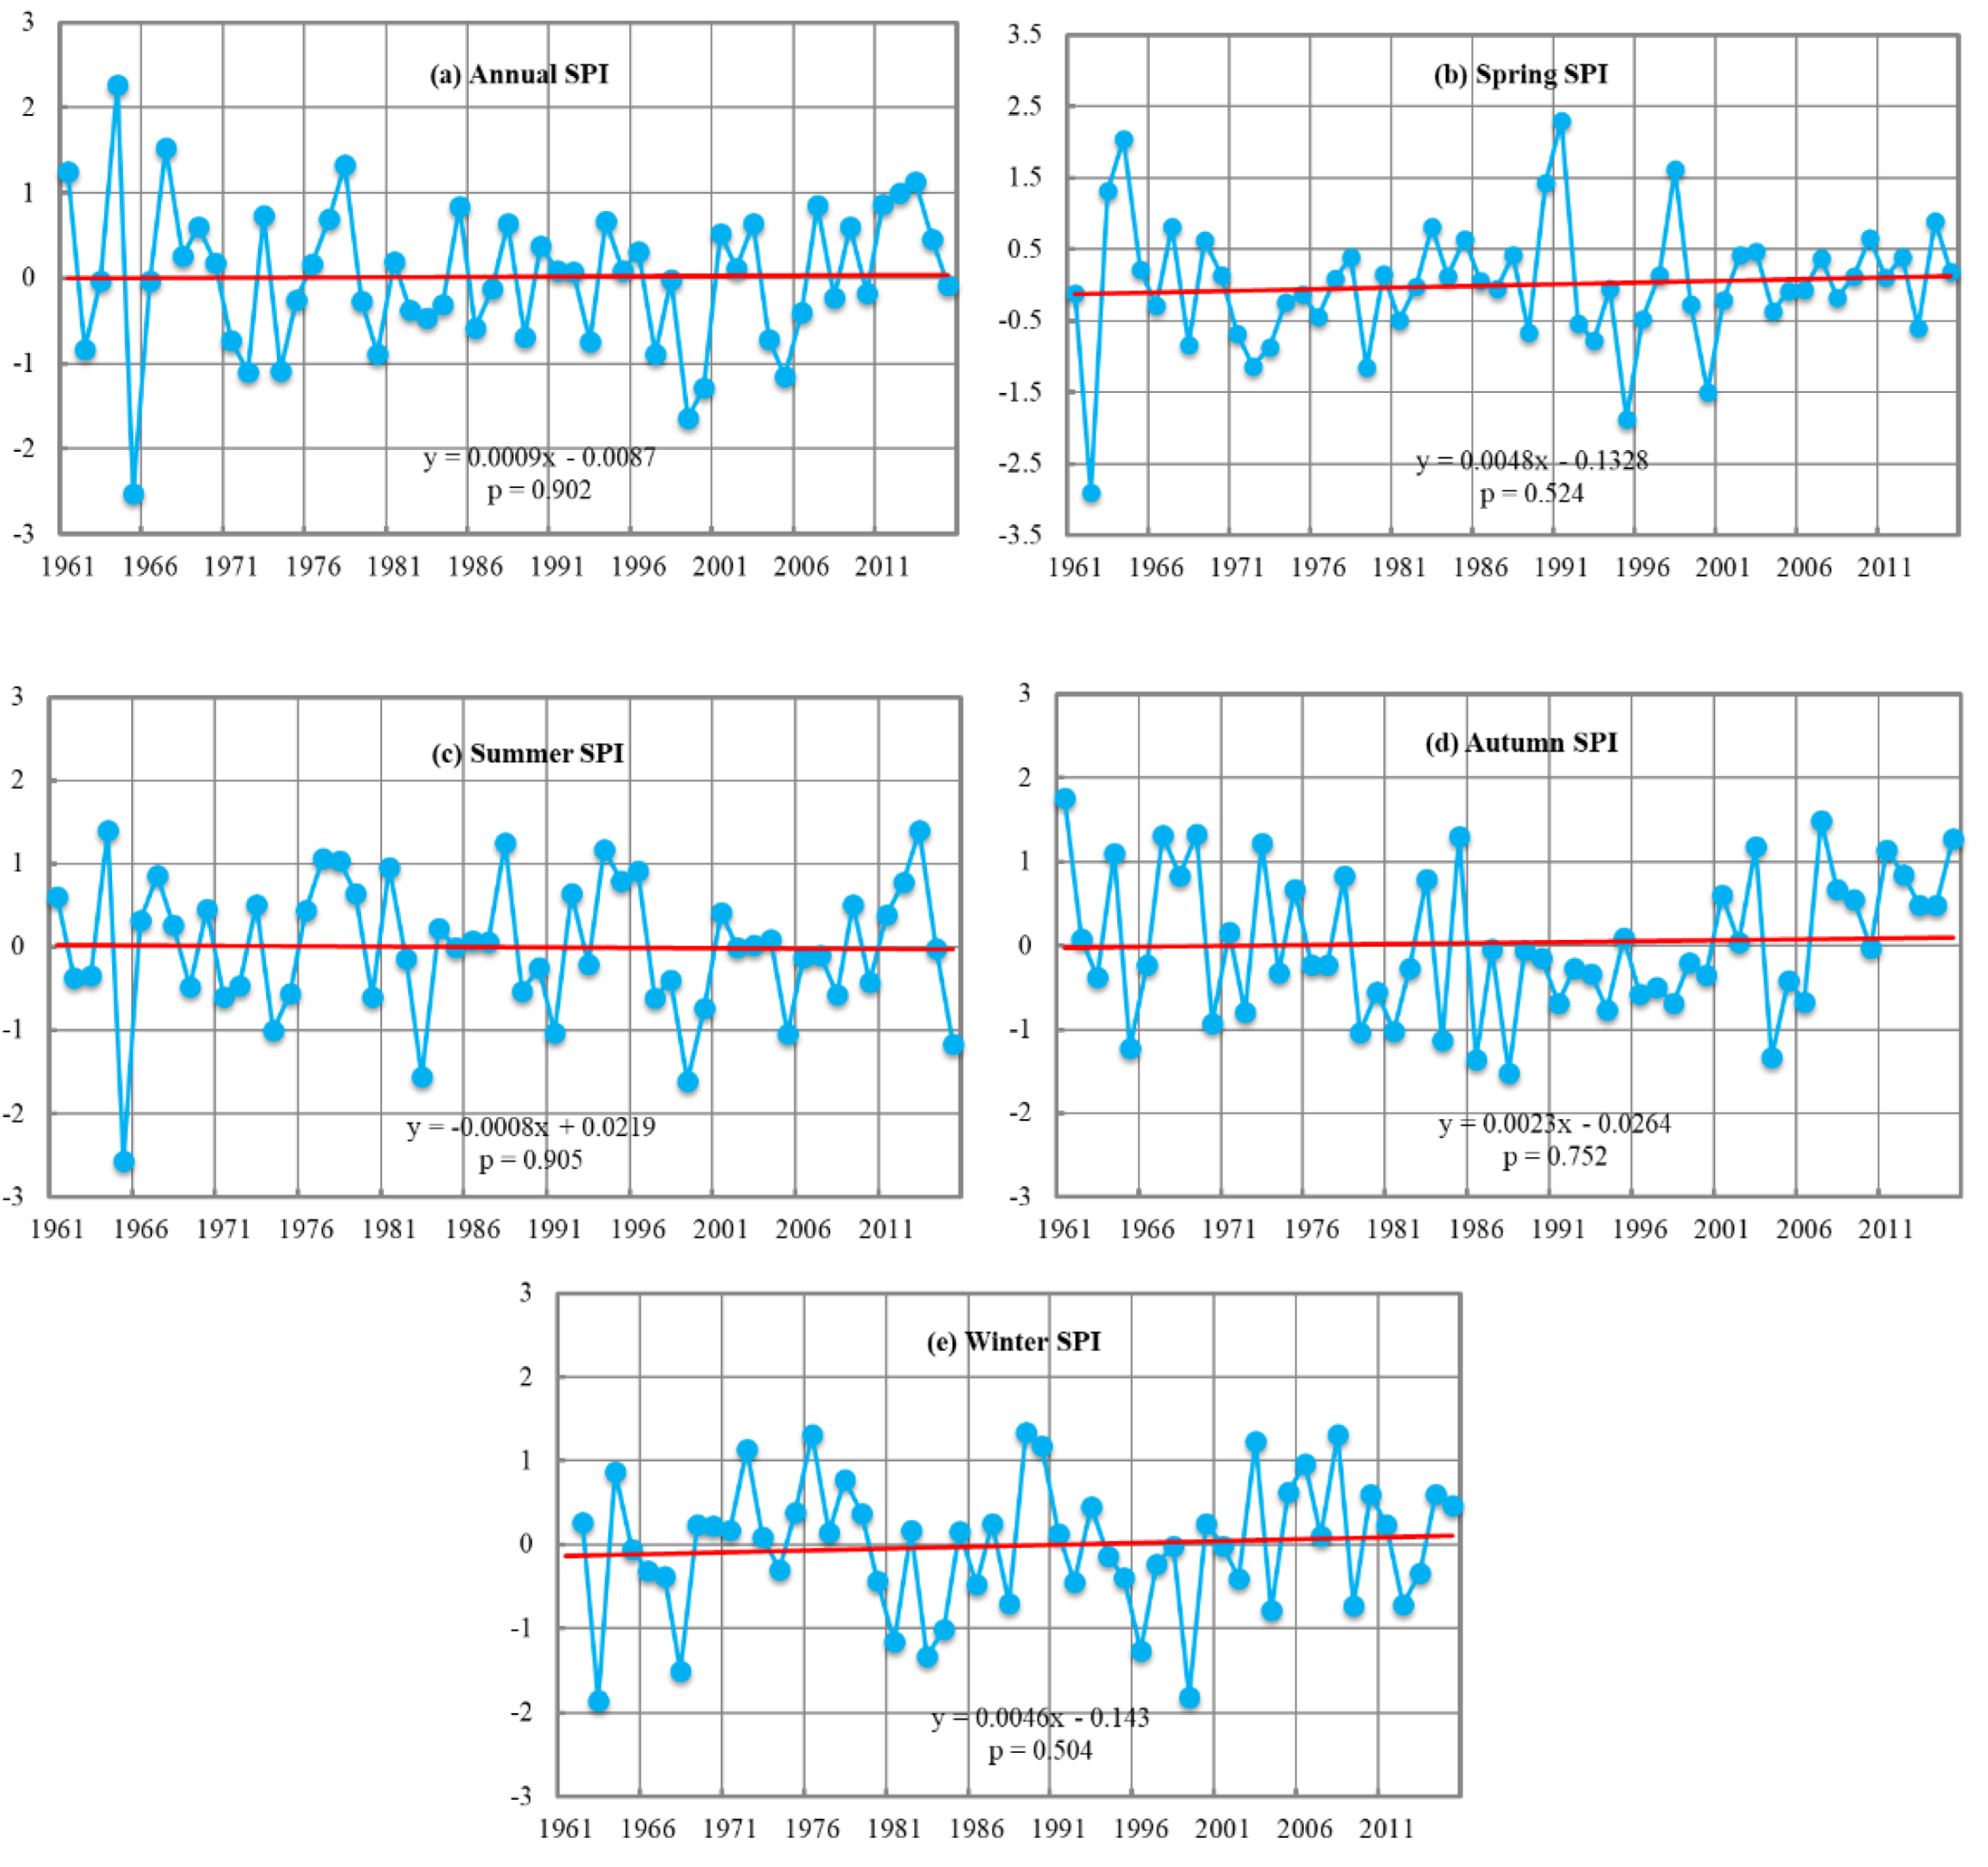
3.1.1. Changes in Annual and Seasonal SPI
3.1.2. Occurrence Frequency of Different Grades of Annual Drought
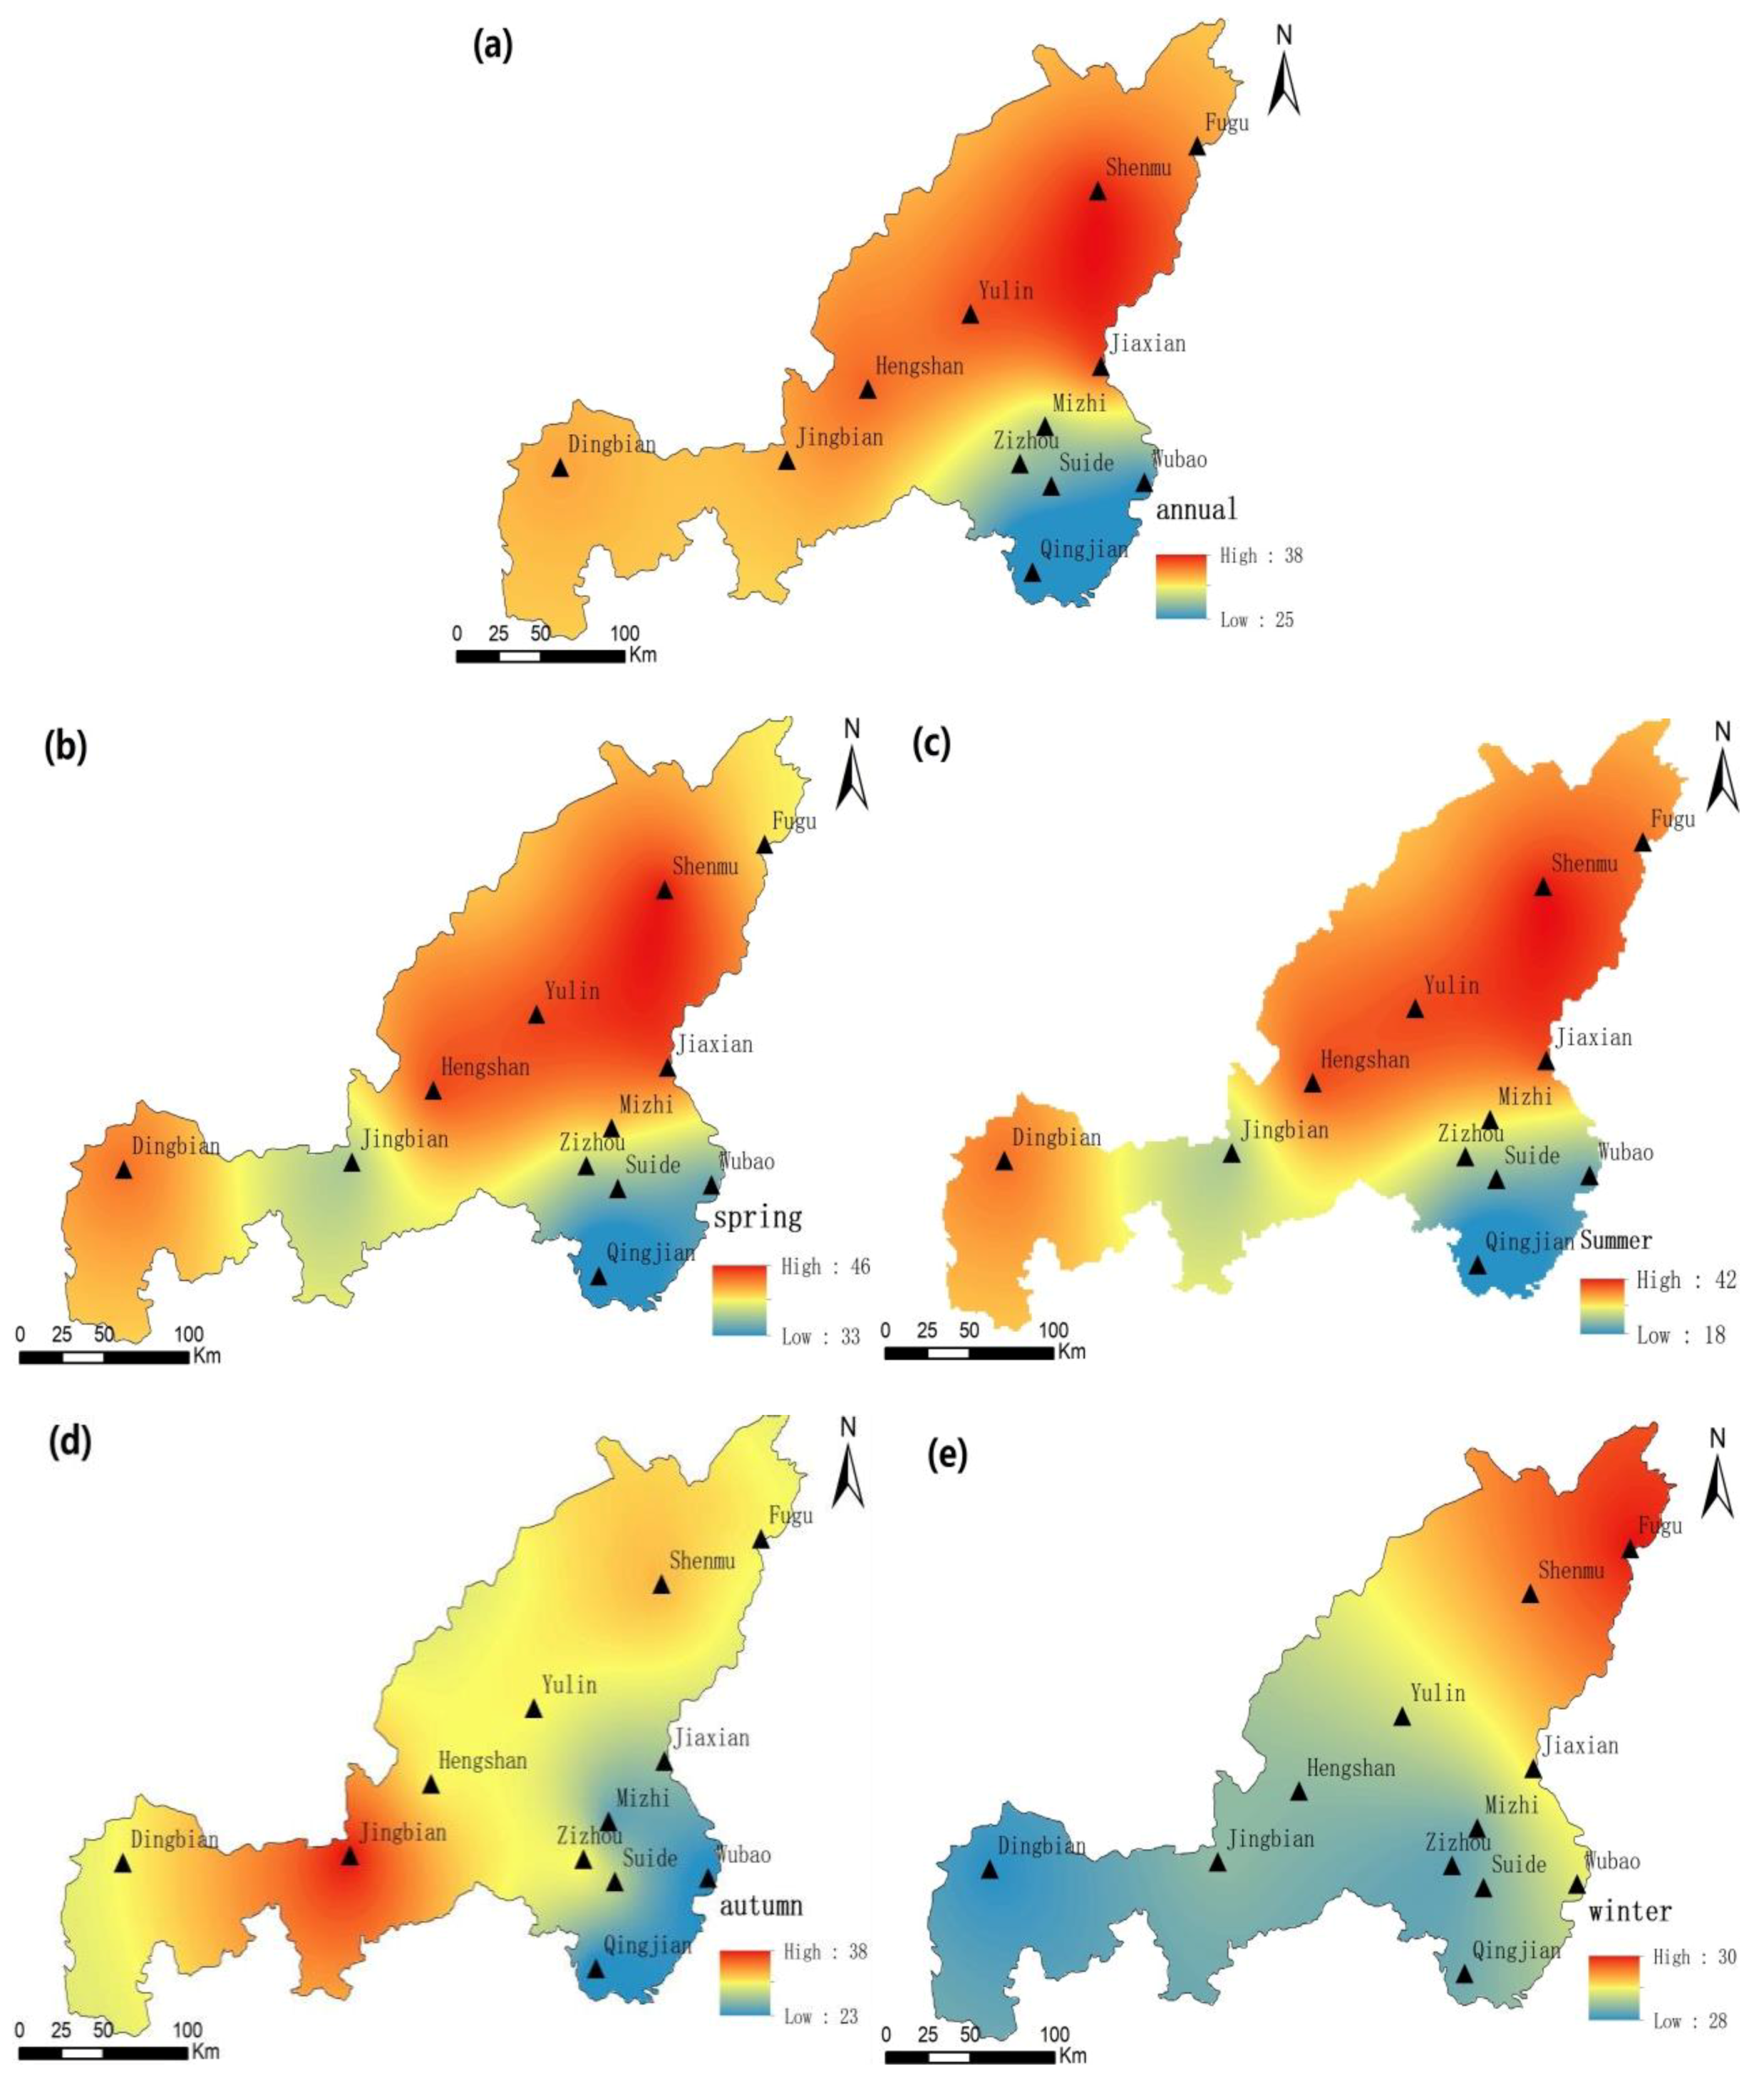
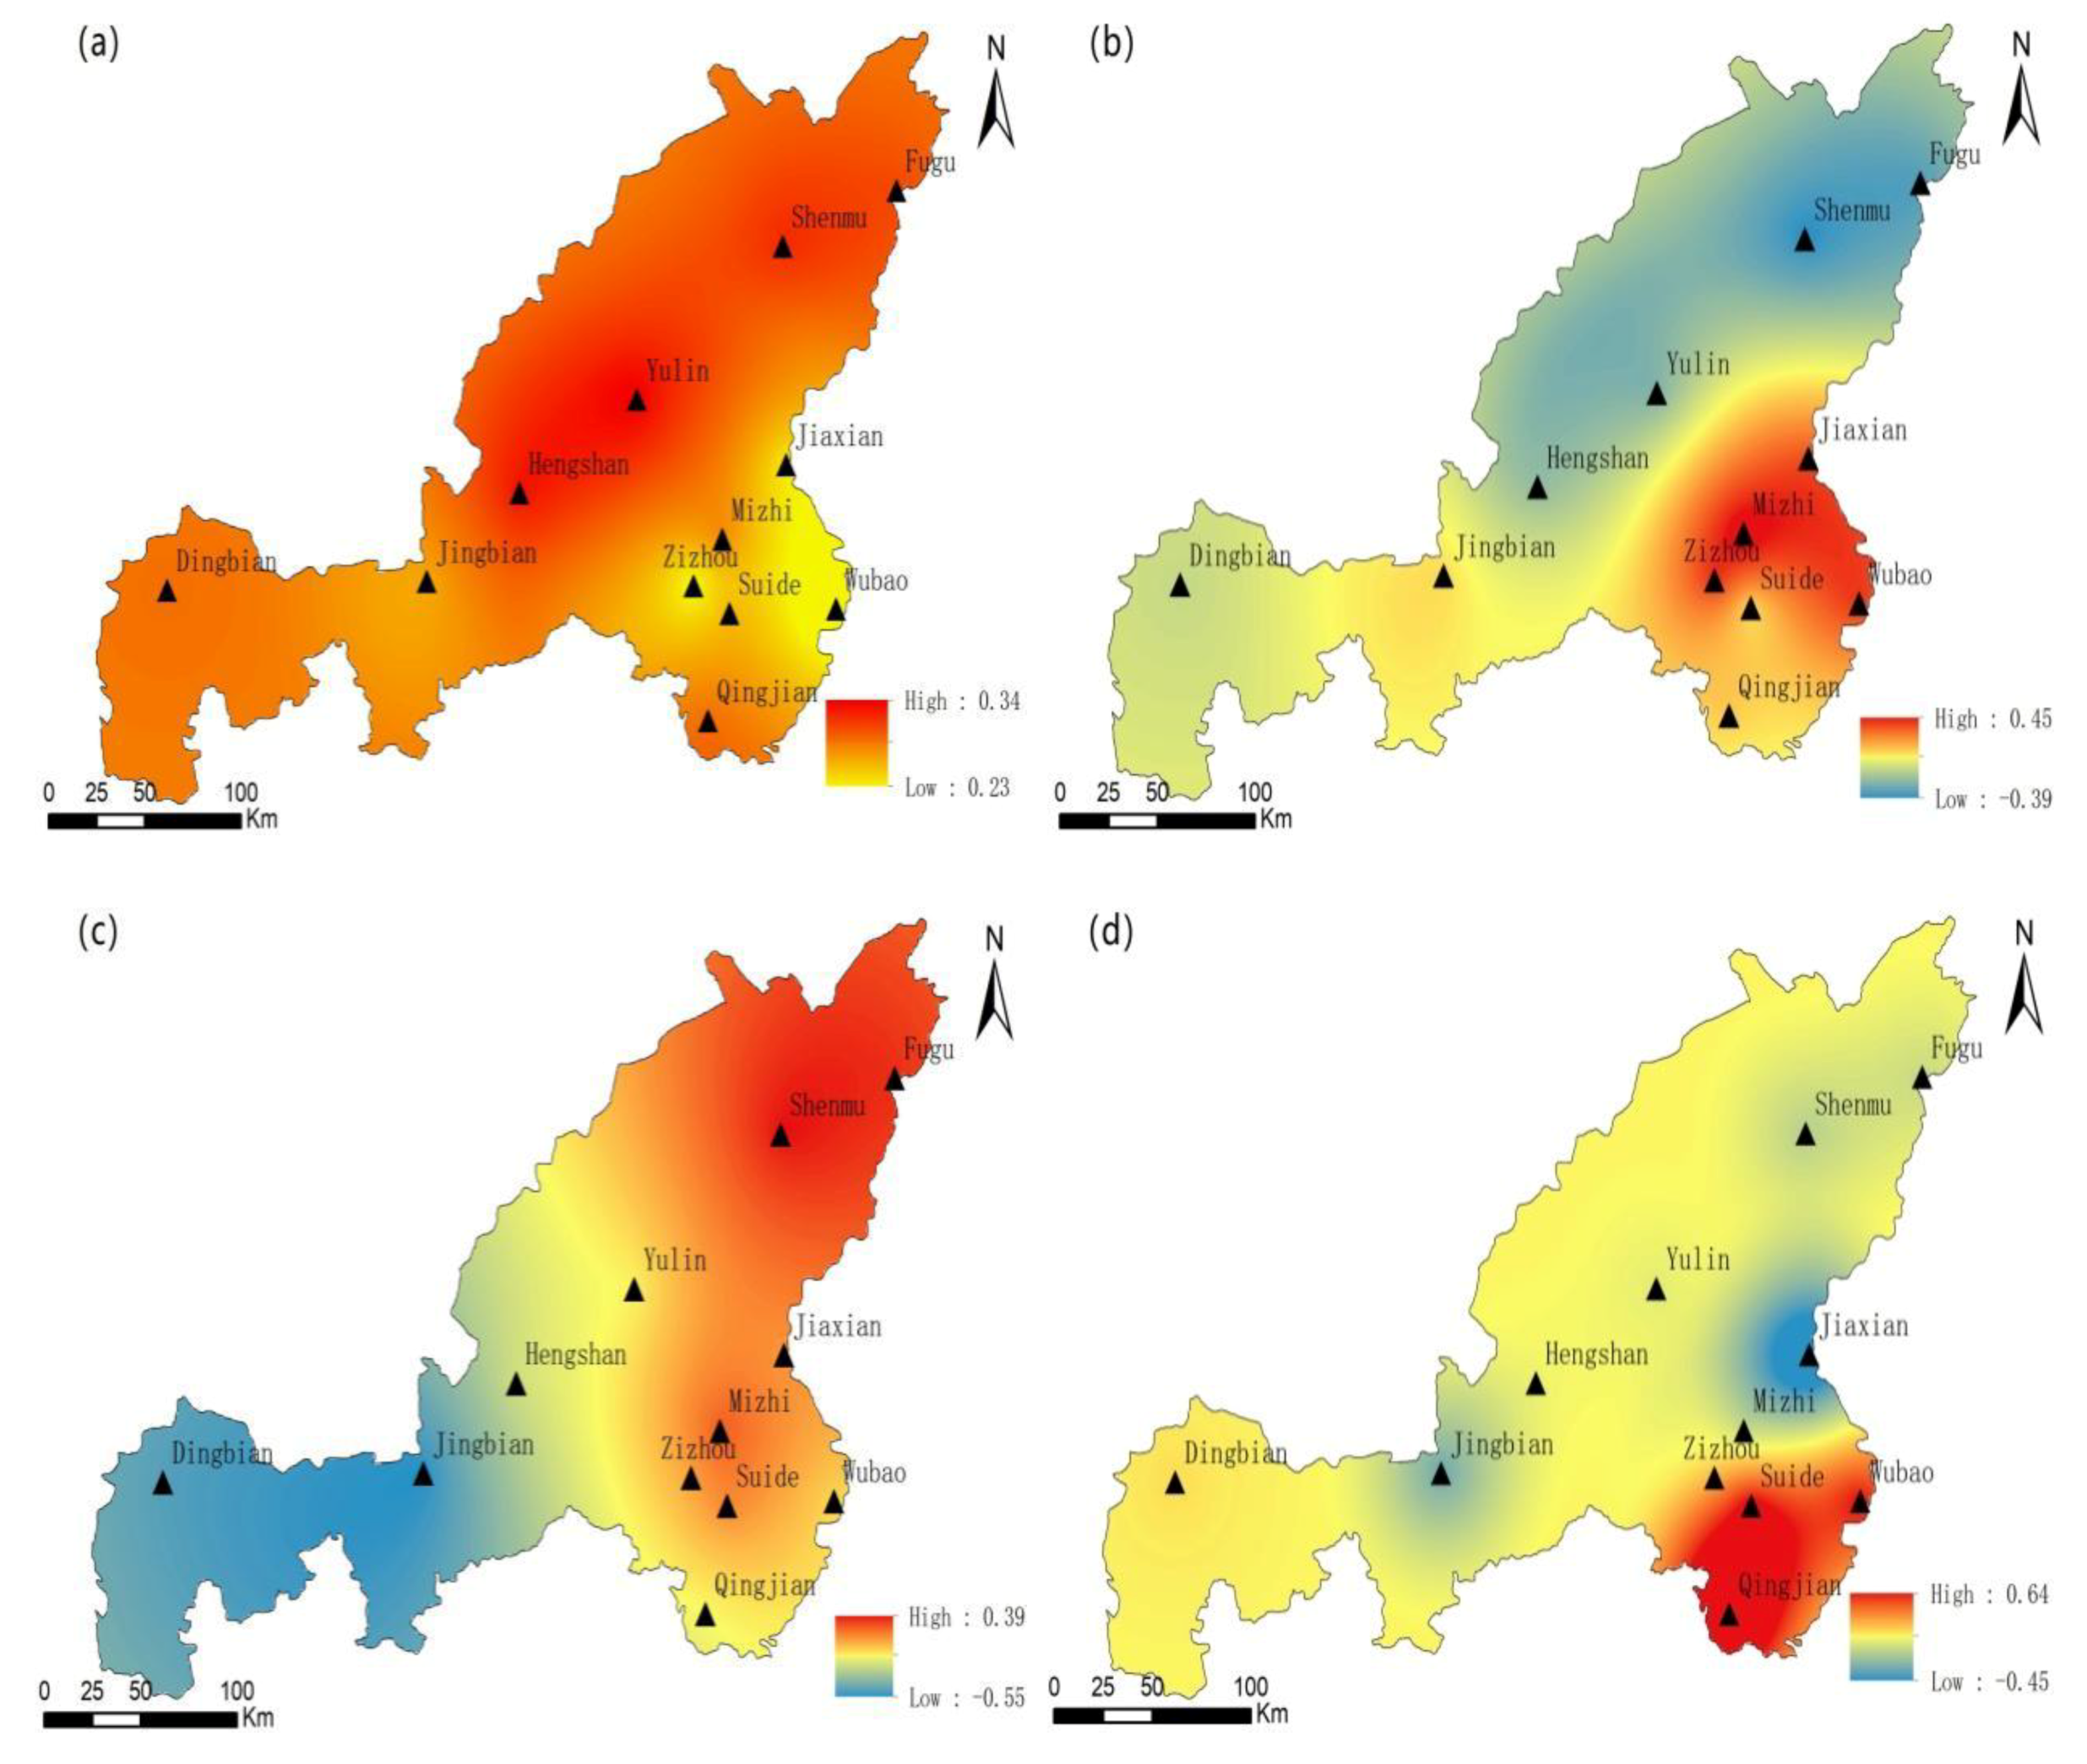
3.1.3. Spatial Distribution of Annual and Seasonal Drought
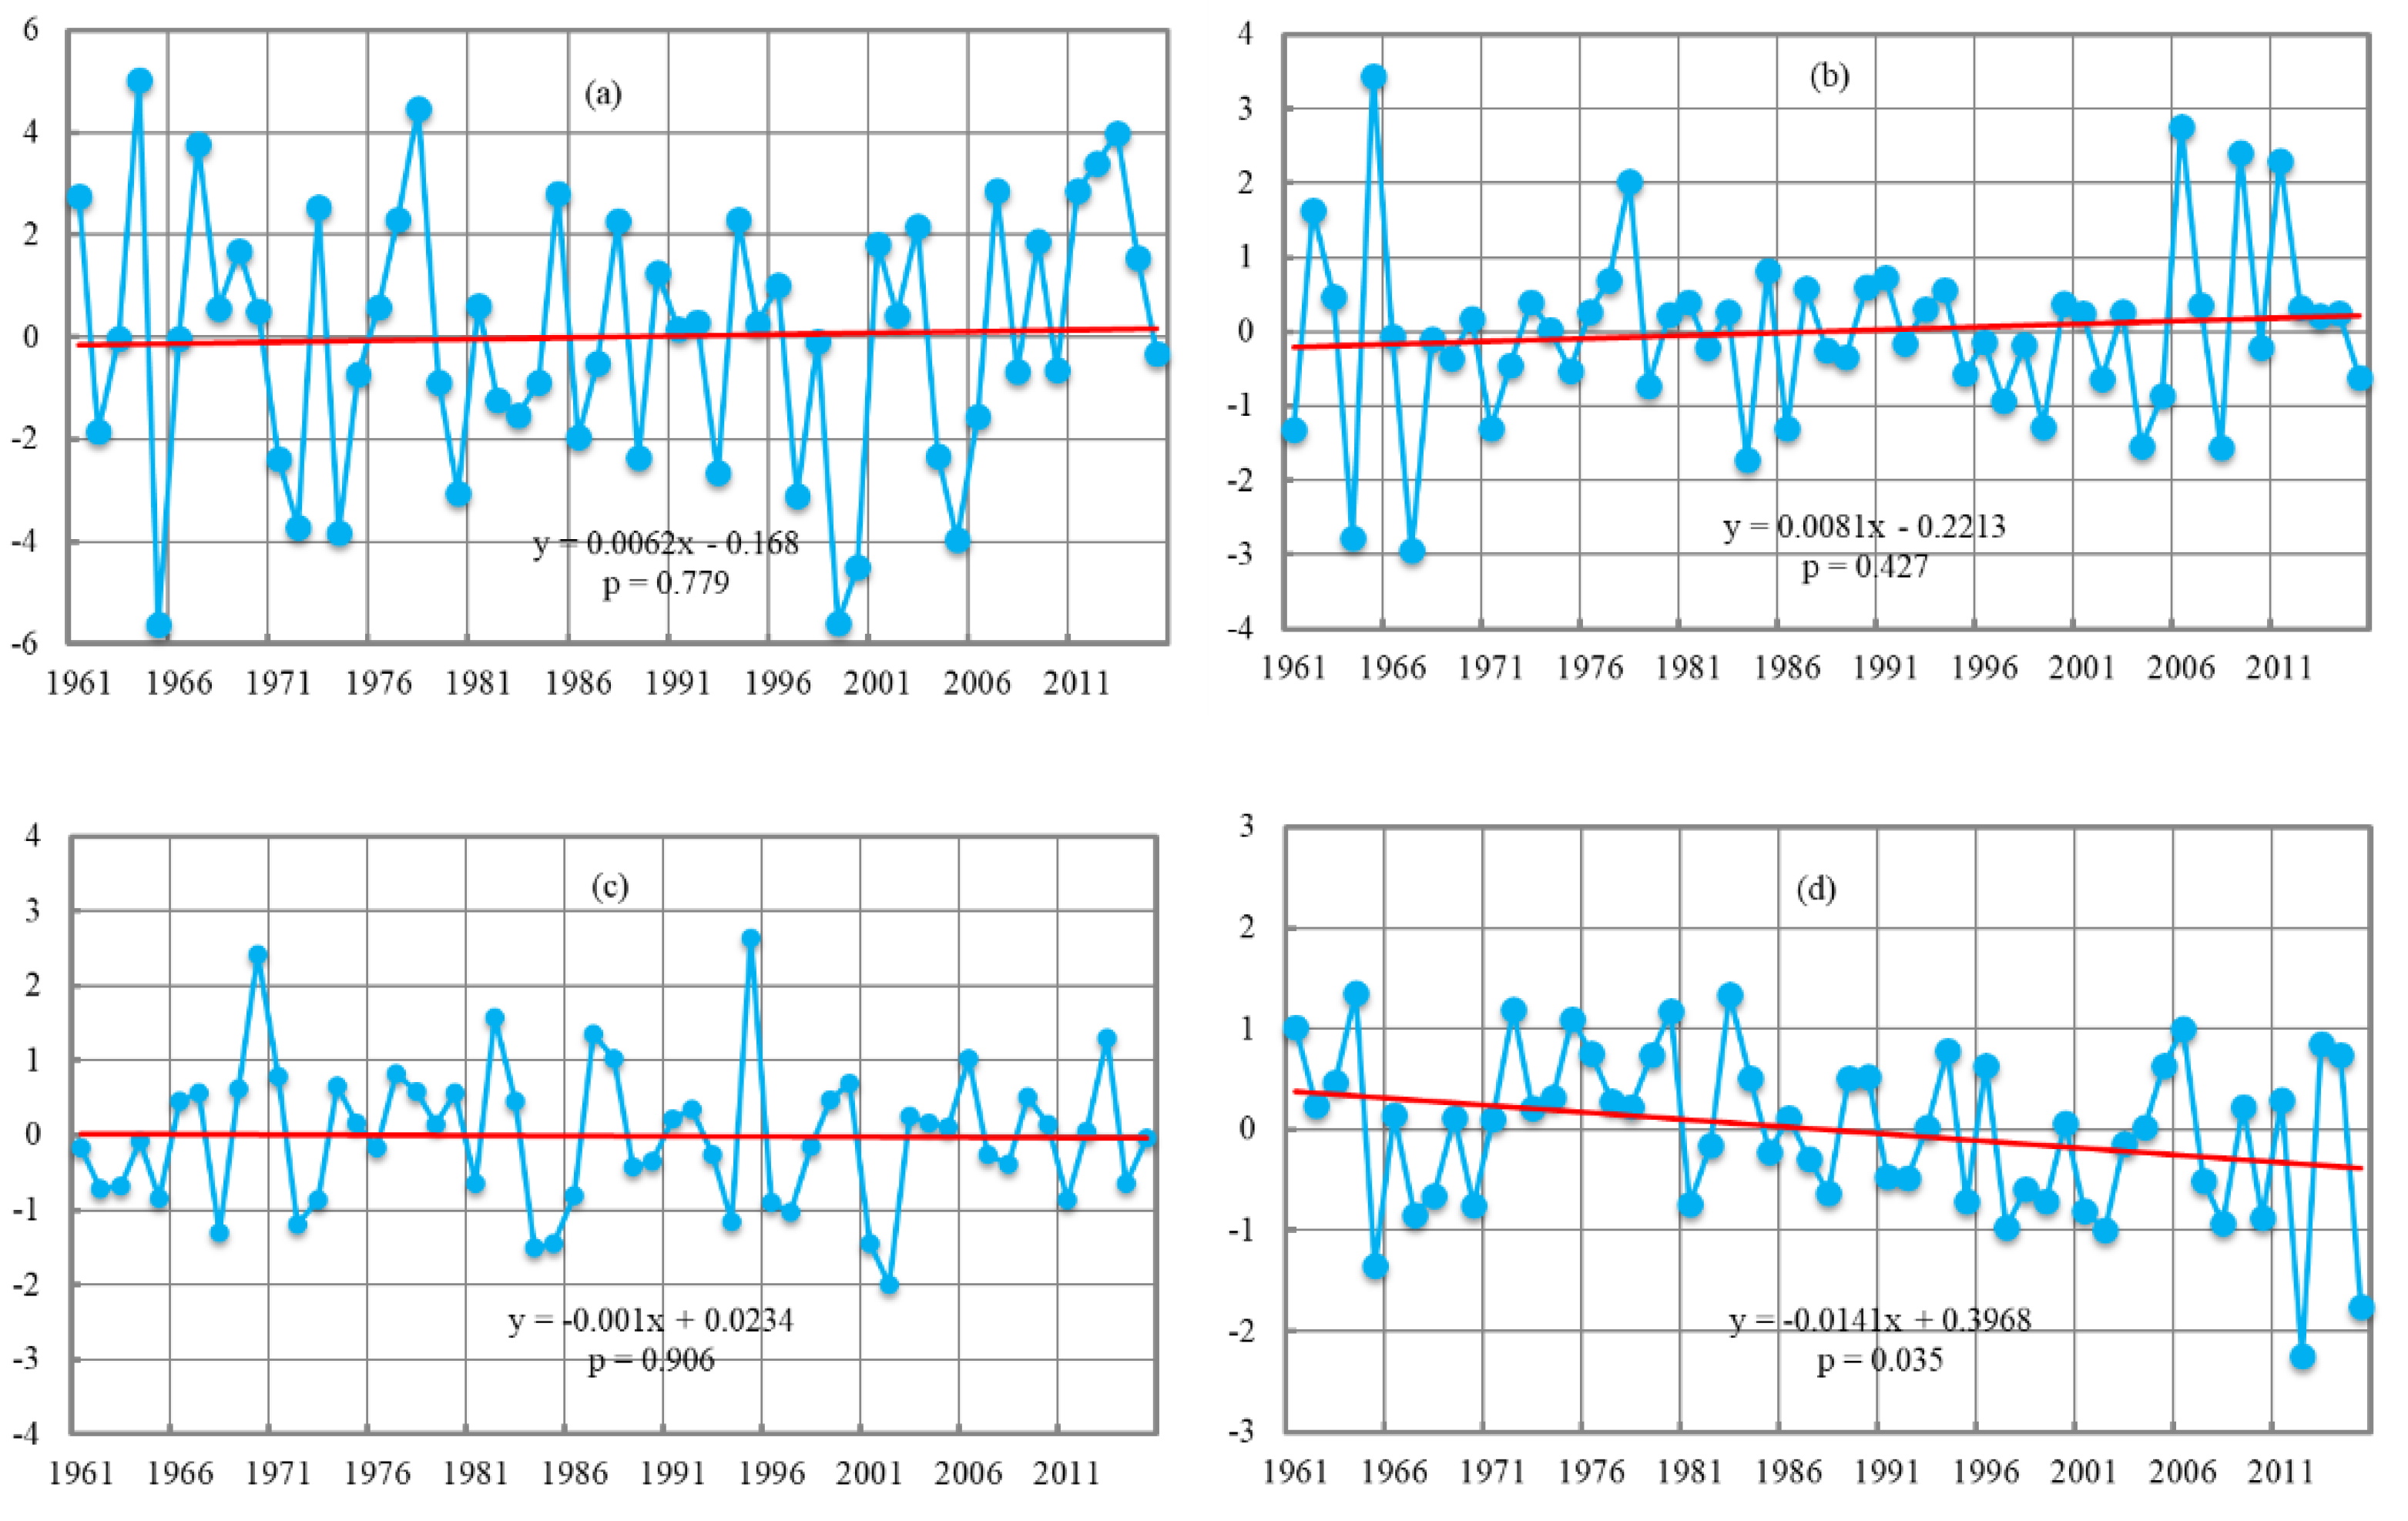
3.2. EOF Analysis of Summer SPI
3.3. Circulation Characteristics in the Summer of Typical Years
3.3.1. Selection of Typical Years
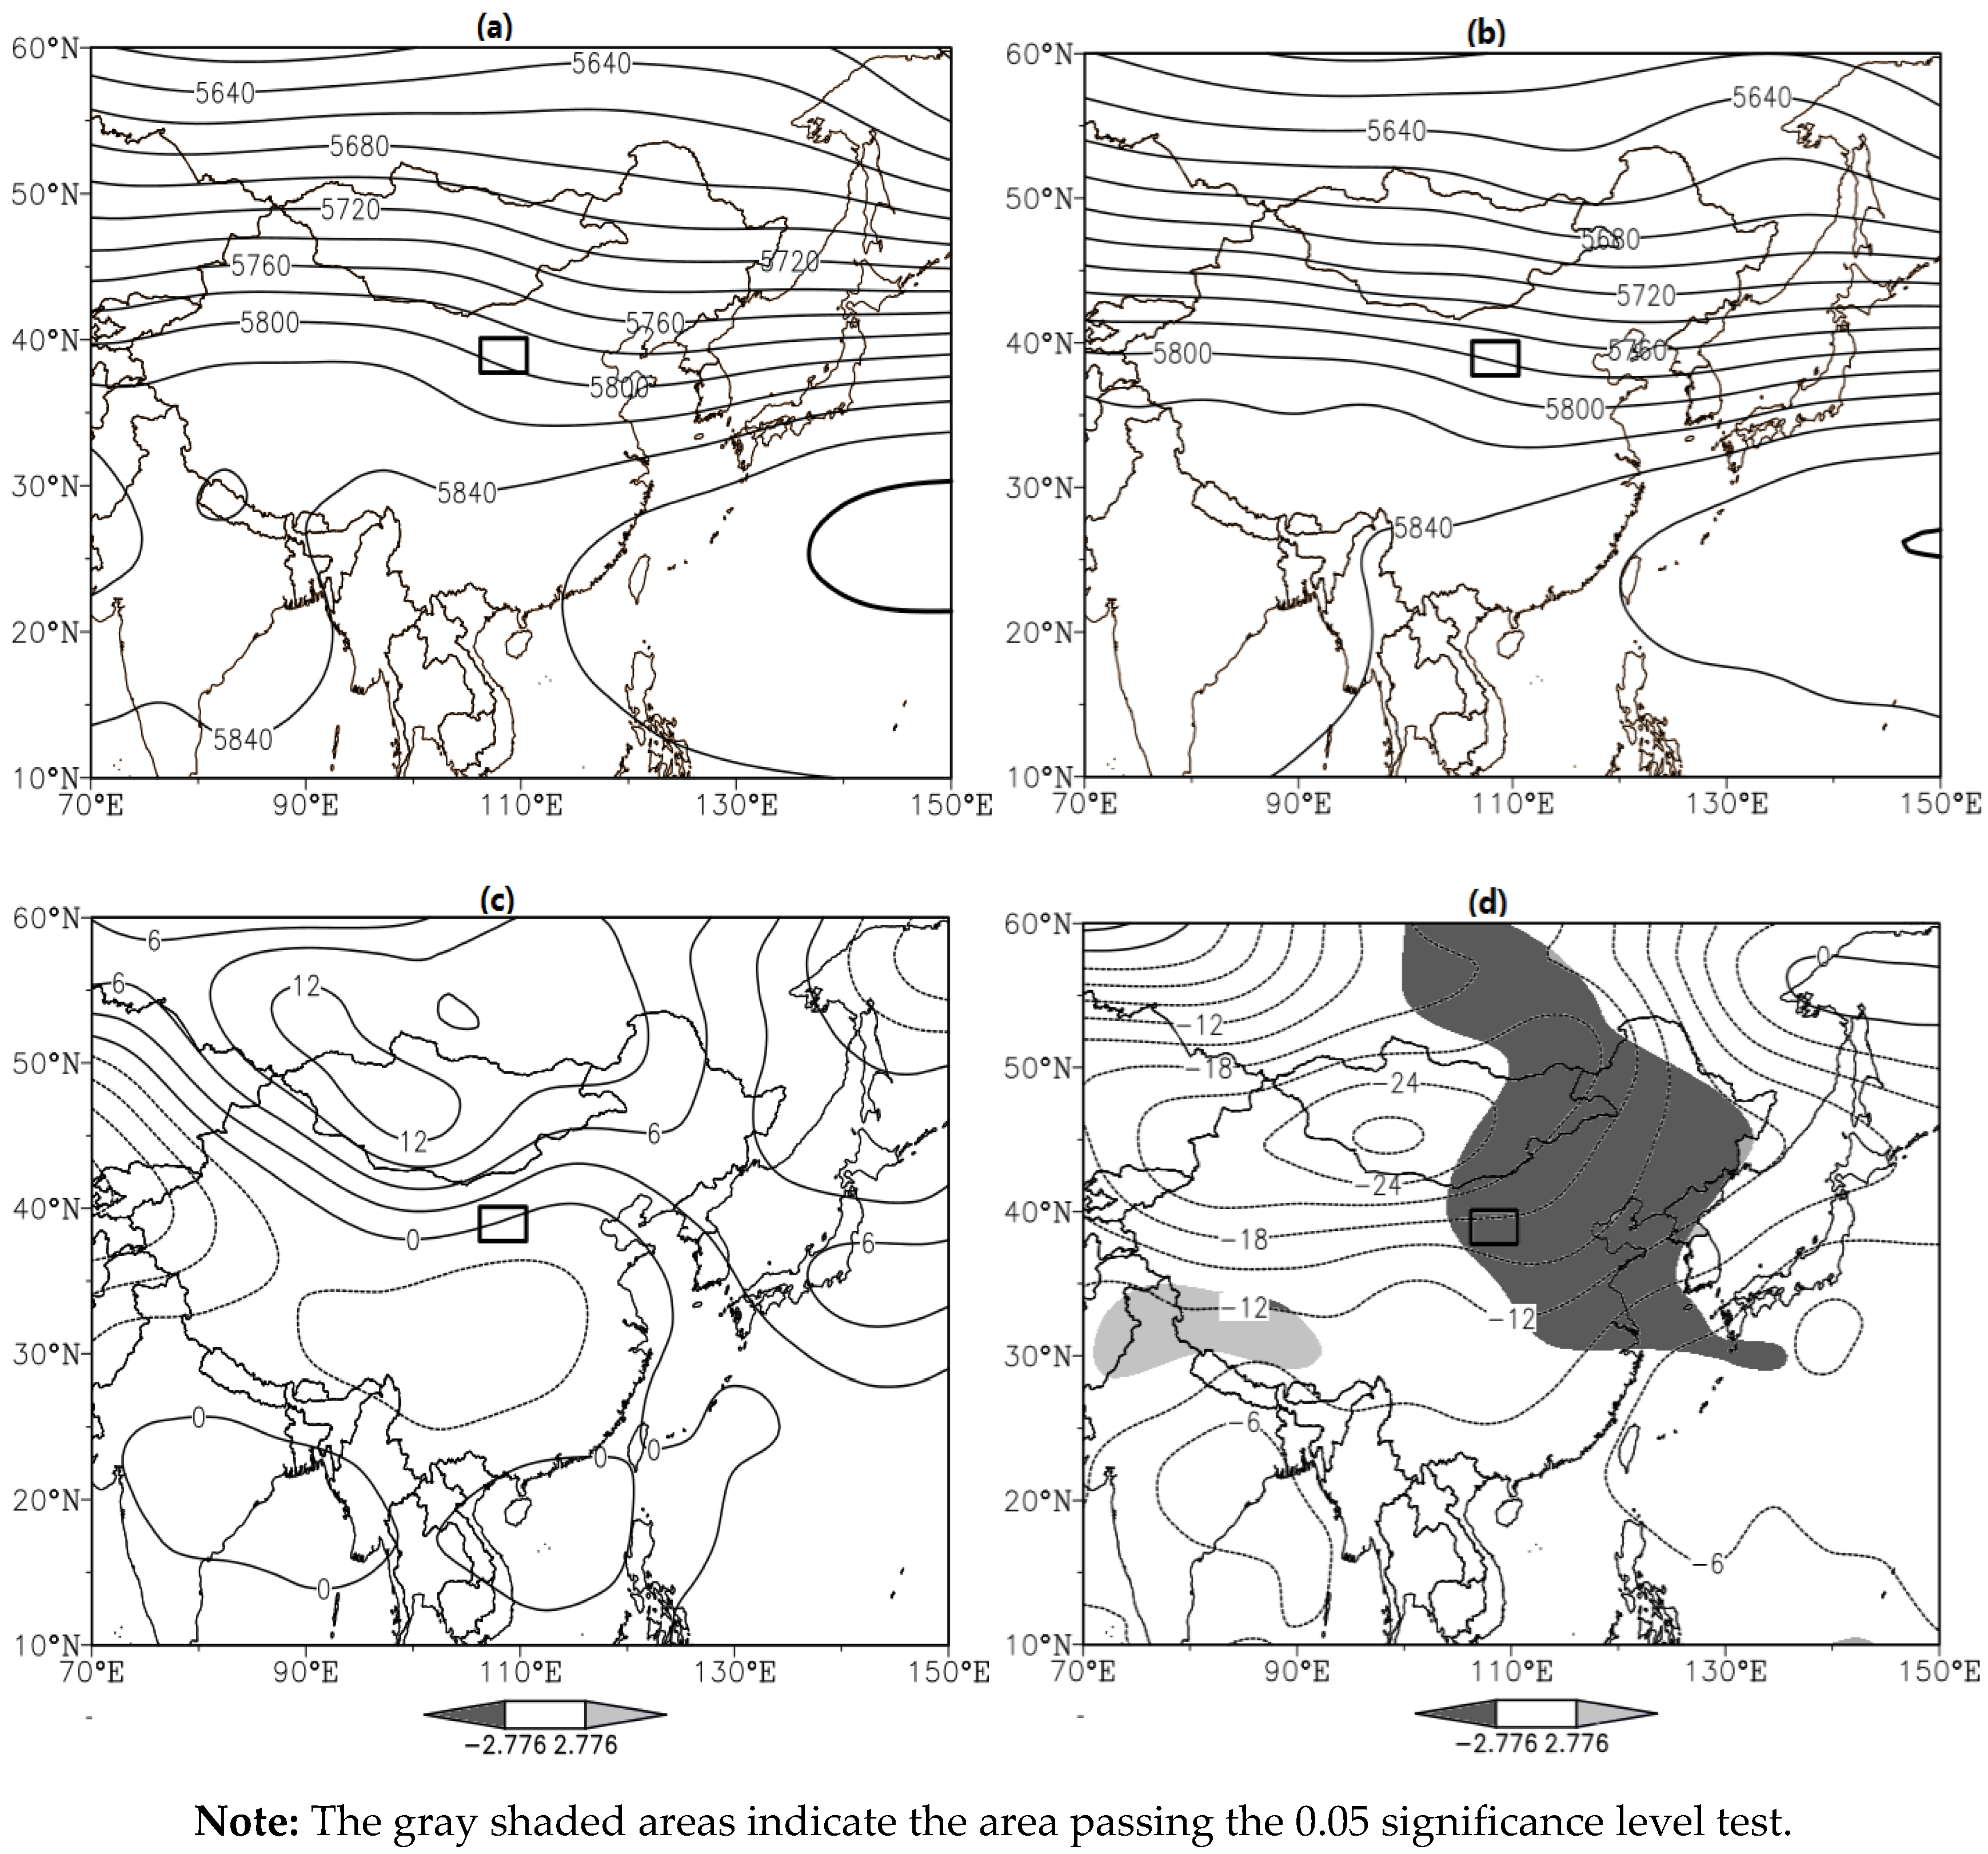
3.3.2. Characteristics of Geopotential Height Field
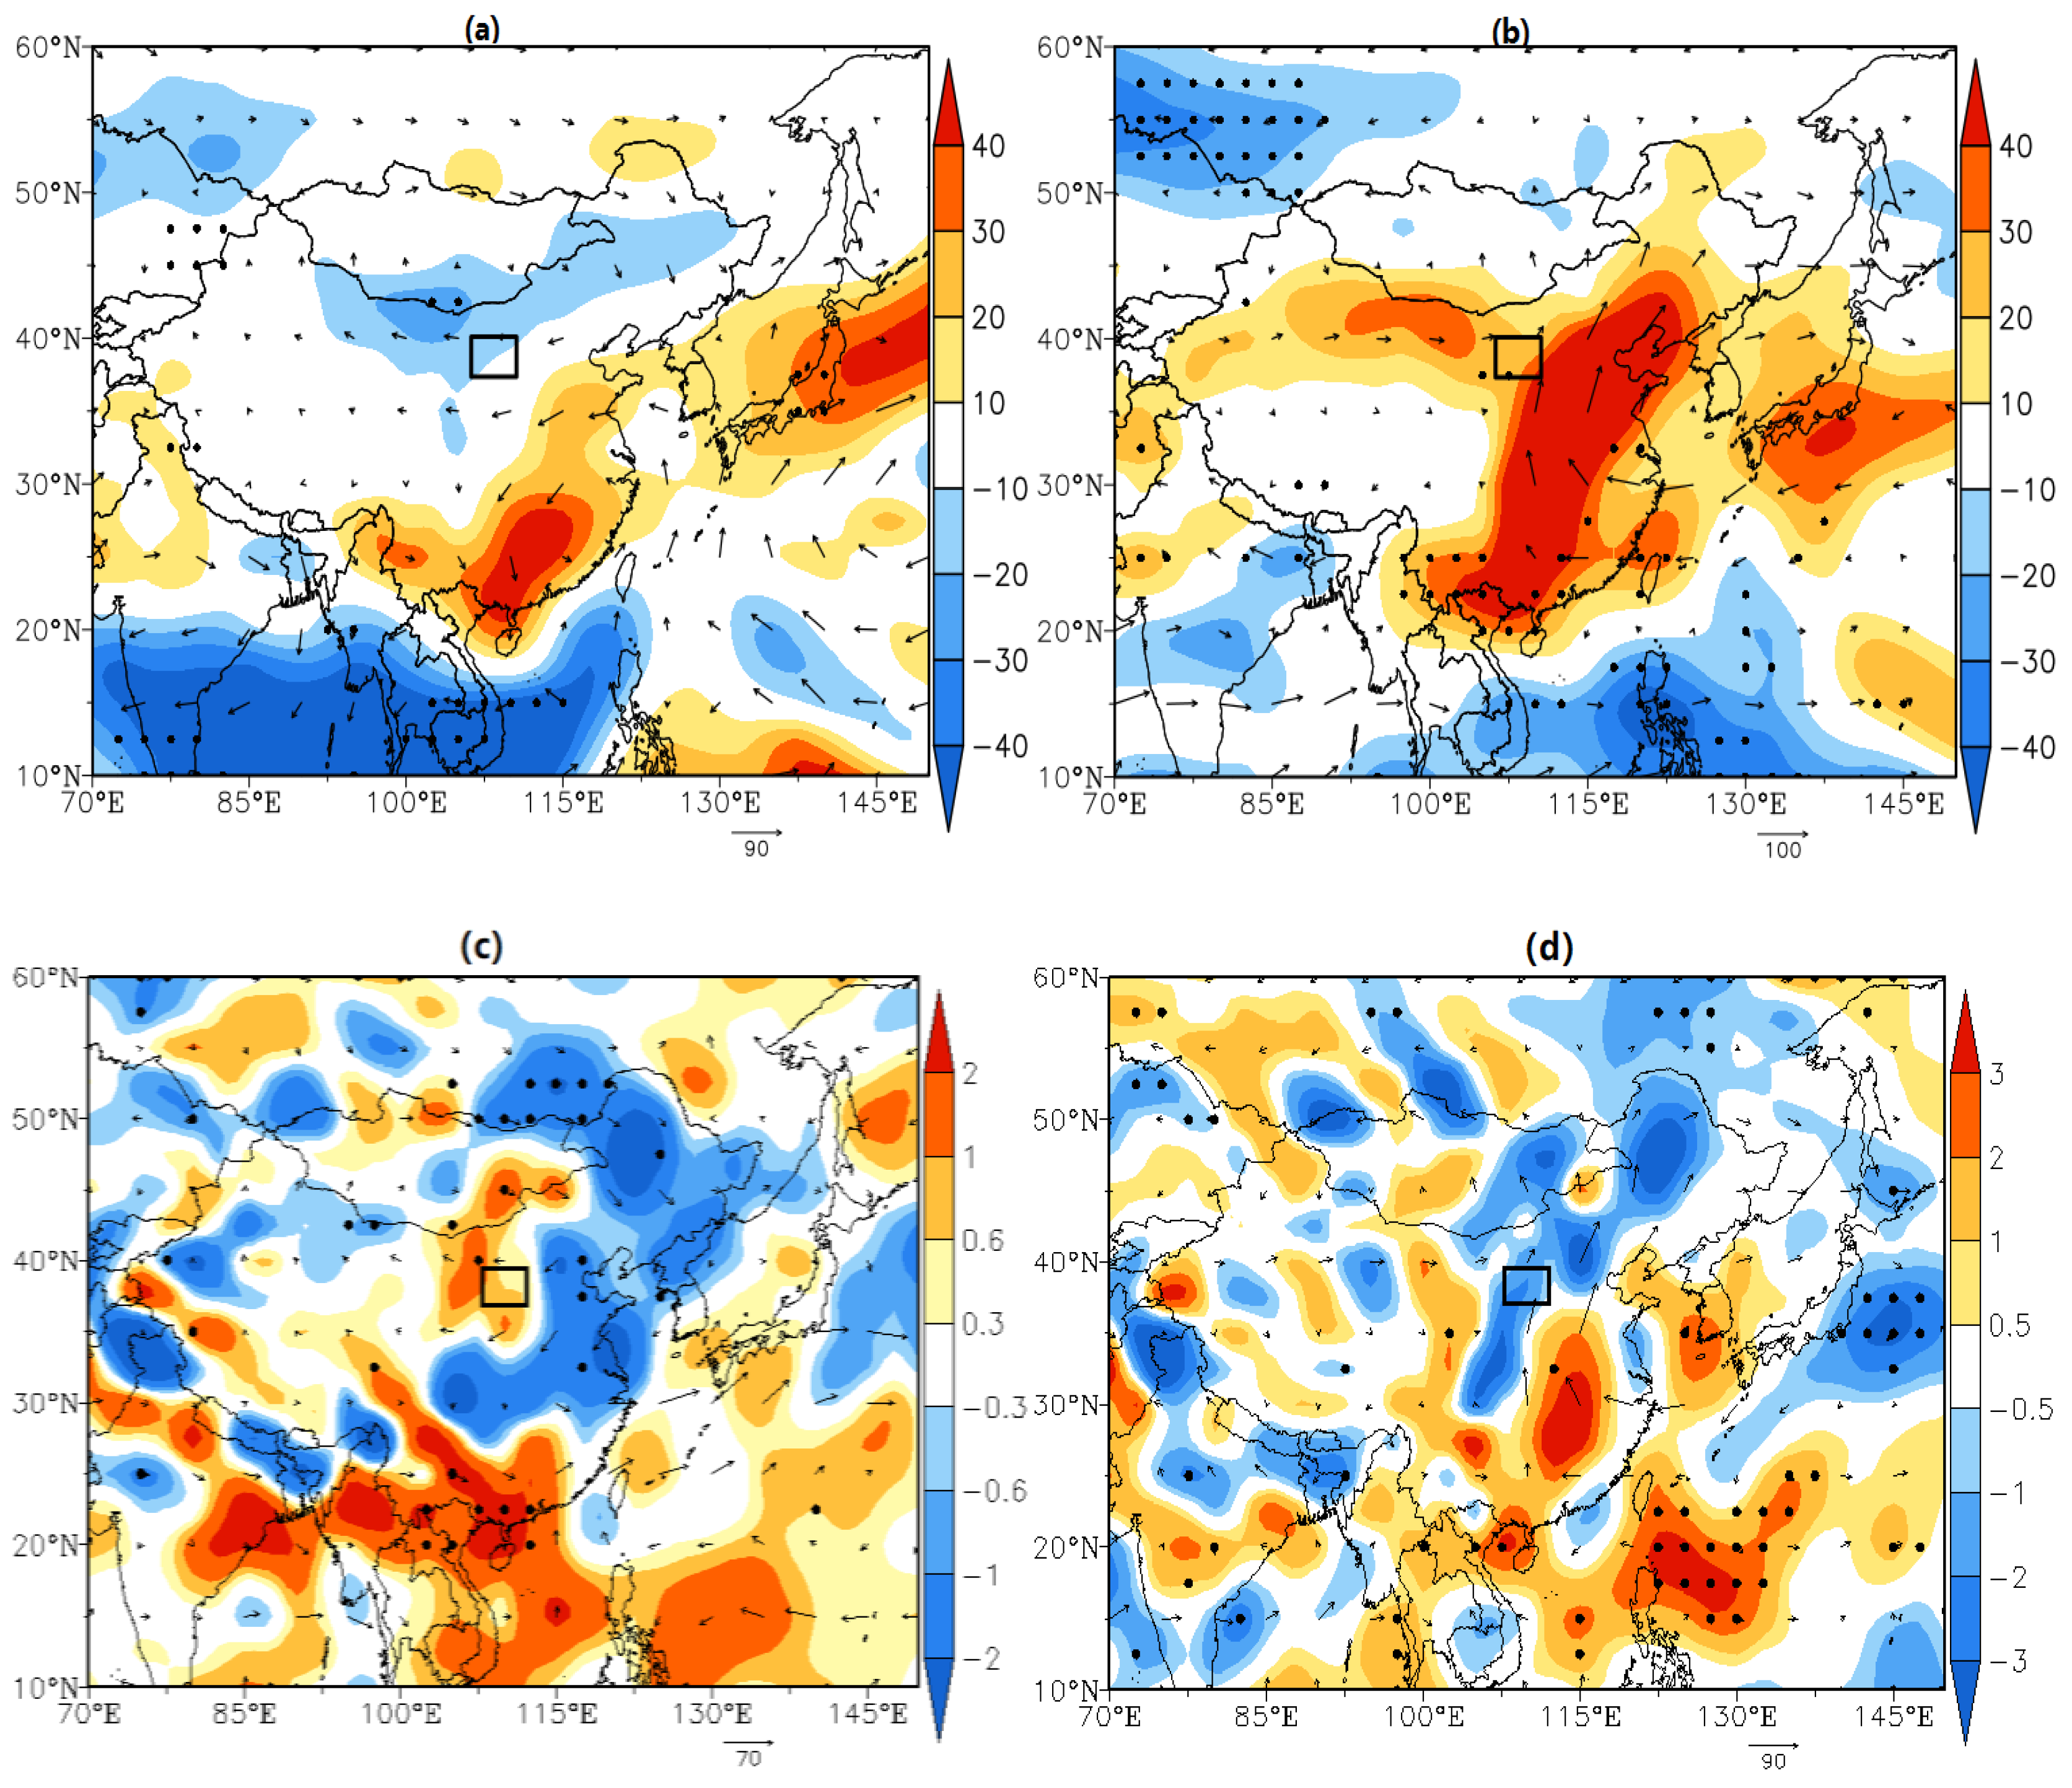
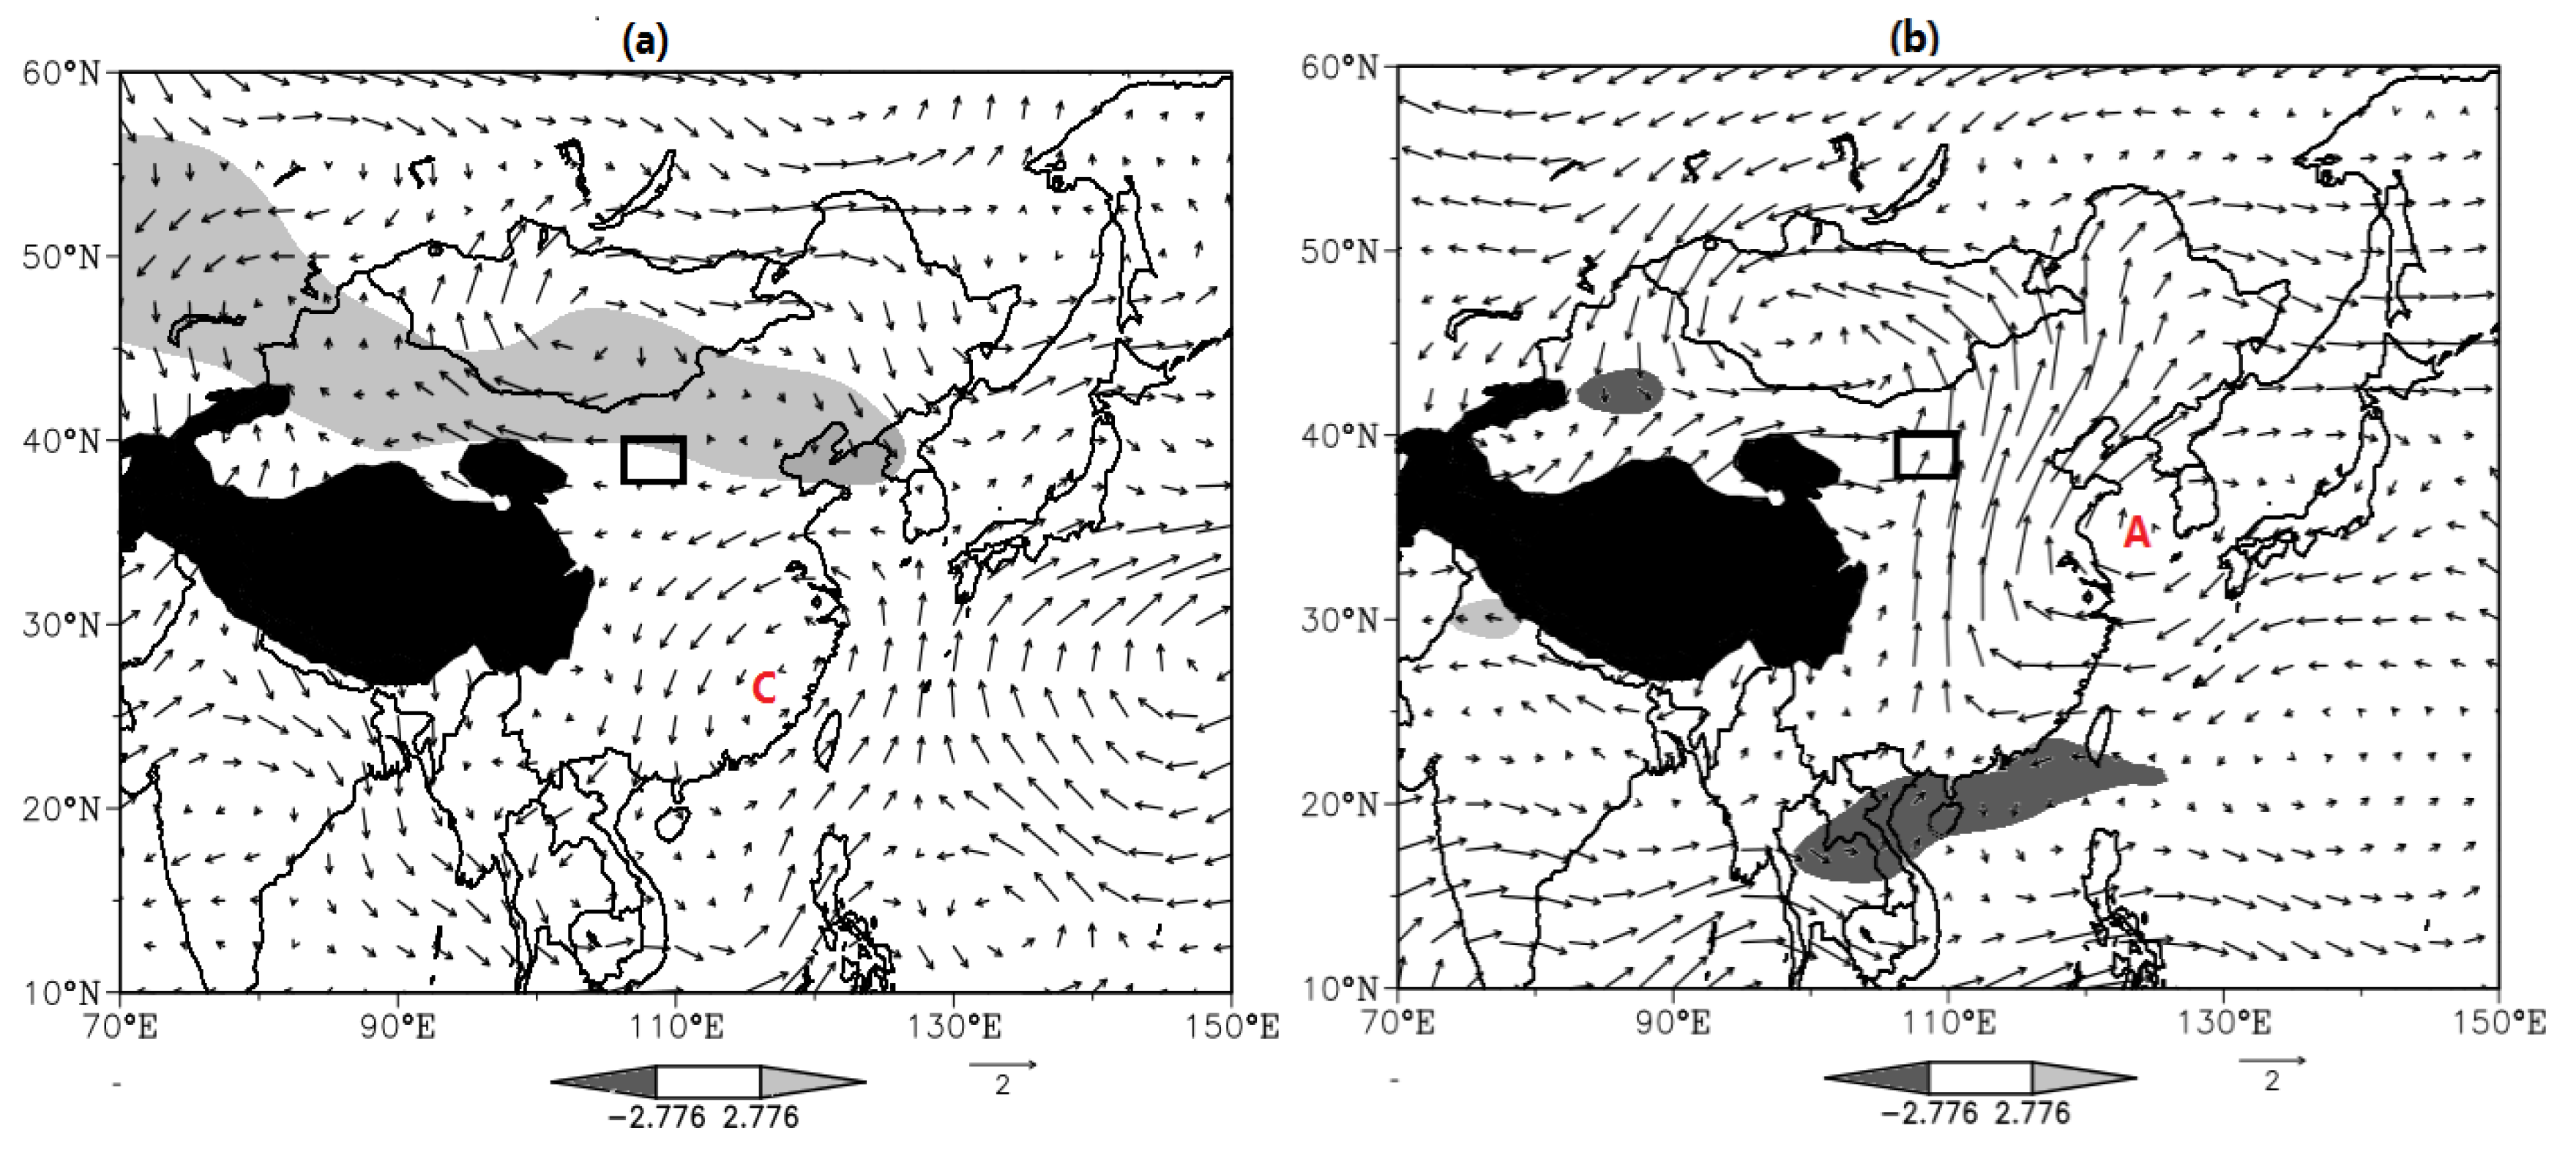
3.3.3. Characteristics of Wind Field
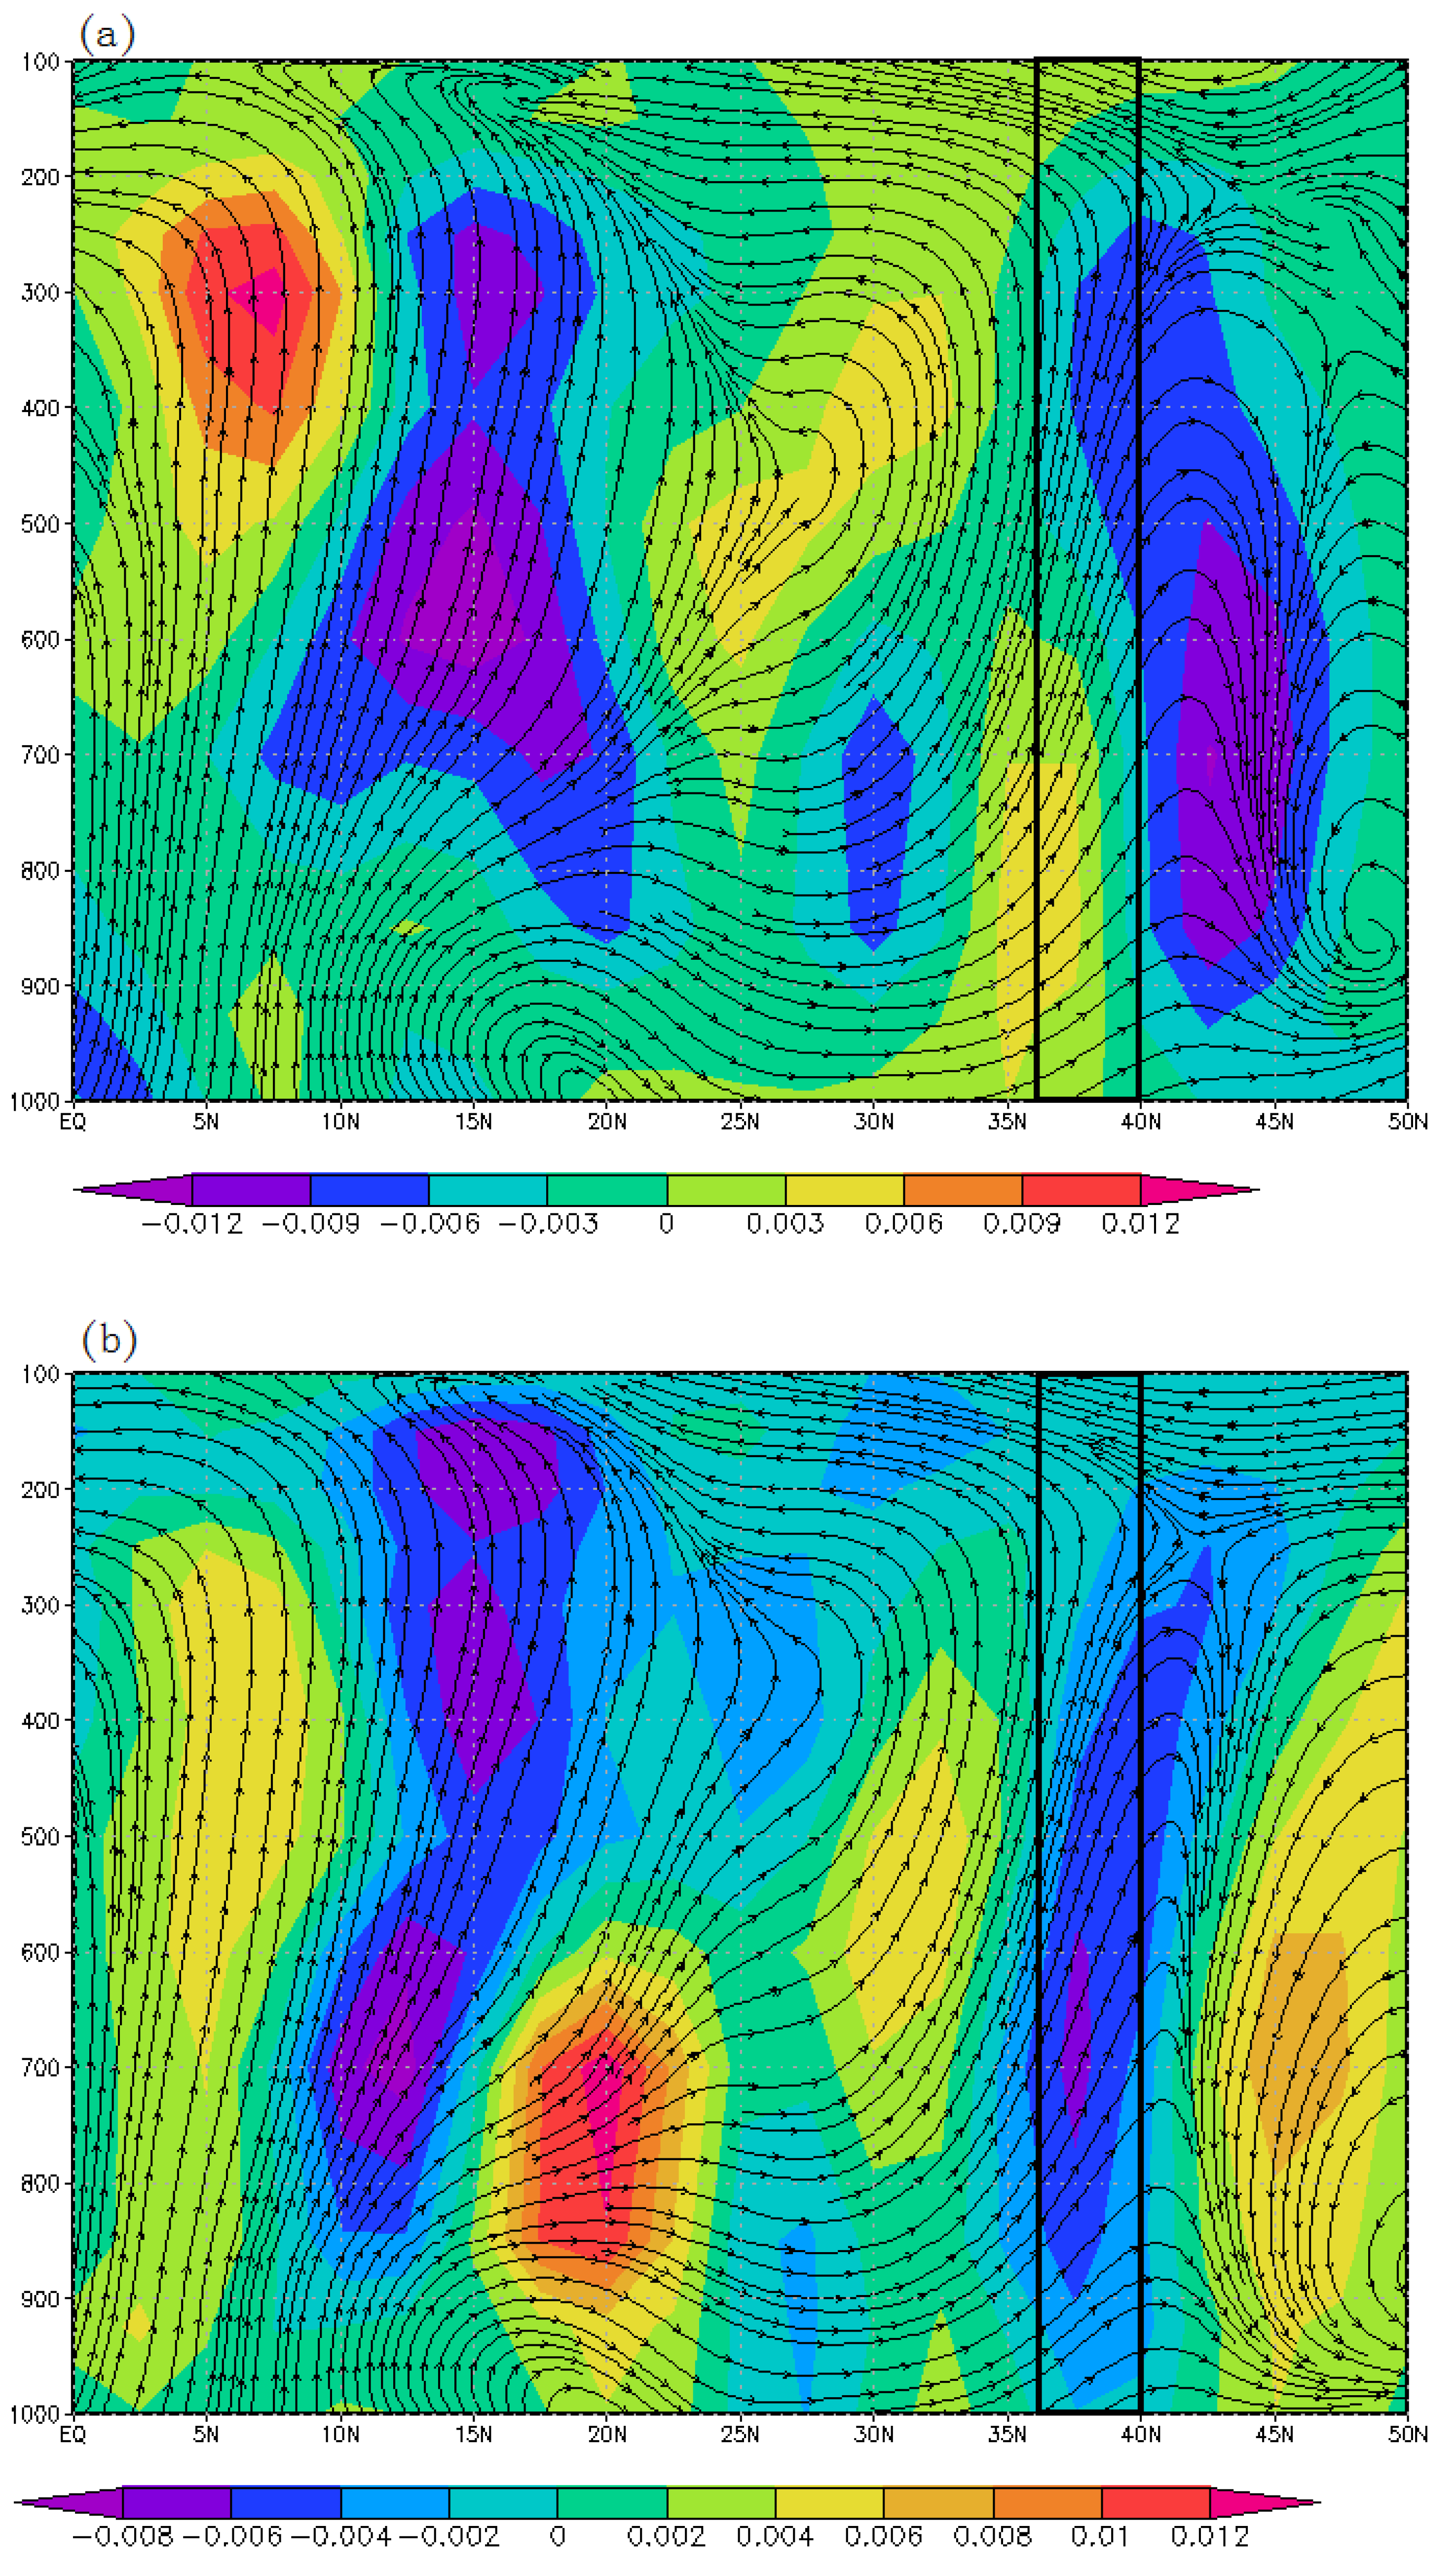
3.3.4. Characteristics of Vertical Circulation
3.3.5. Characteristics of Water Vapor
4. Conclusions
- (1)
- In the annual and seasonal drought series, there is a non-significant trend toward drought in summer, while there are non-significant trends toward wetness for the other series. Overall, the frequency of drought is low in the southeast and high in the west and the north of the study area;
- (2)
- The results of EOF analysis of summer SPI show that EOF1 is characterized by a uniform pattern in the whole region, that is, there exists a feature of consistent drought or flood in Yulin City. EOF2, EOF3 and EOF4 mainly indicate opposite characteristics of the changes in floods and droughts in the eastern/western parts and the southeast/other parts of the study area;
- (3)
- In the summer of the typical drought years, the study area is controlled by the northwest airflow behind the trough, and the meridional circulation is distributed in the mid-latitudes, which is conducive to the intrusion of cold air into the south of China. The cold and warm air intersection area is to the south. The water vapor flux is weak and the water vapor is divergent, which prohibits the precipitation process in the study area;
- (4)
- In the summer of the typical flood years, the study area is controlled by the zonal airflow at the bottom of low-pressure trough, showing the distribution of zonal circulations, which is conducive to the intrusion of cold air into the north of China. The cold and warm air intersection area is to the north. The water vapor flux is strong and the water vapor is convergent, which is conducive to the precipitation process in the study area.
Author Contributions
Funding
Conflicts of Interest
References
- Bruce, J.P. Natural disaster reduction and global change. Bull. Am. Meteorol. Soc. 1994, 75, 1831–1835. [Google Scholar] [CrossRef] [Green Version]
- Obasi, G.O.P. WMO’s role in the international decade for natural disaster reduction. Bull. Am. Meteorol. Soc. 1994, 75, 1655–1661. [Google Scholar] [CrossRef] [Green Version]
- Kogan, F.N. Global drought watch from space. Bull. Am. Meteorol. Soc. 1997, 78, 621–636. [Google Scholar] [CrossRef]
- Wu, Z.Y.; Lu, G.H.; Wen, L.; Lin, C.A. Reconstructing and analyzing China’s fifty-nine year (1951–2009) drought history using hydrological model simulation. Hydrol. Earth Syst. Sci. 2011, 15, 2881–2894. [Google Scholar] [CrossRef] [Green Version]
- Bao, Y.X.; Meng, C.L.; Shen, S.H.; Qiu, X.F.; Gao, P.; Liu, C. Temporal and spatial patterns of droughts for recent 50 years in Jiangsu based on meteorological drought composite index. Acta Geogr. Sin. 2011, 66, 599–608. (In Chinese) [Google Scholar] [CrossRef] [Green Version]
- Niu, J.; Chen, J.; Sun, L. Exploration of drought evolution using numerical simulations over the Xijiang (West River) basin in South China. J. Hydrol. 2015, 526, 68–77. [Google Scholar] [CrossRef]
- Xu, D.F.; Li, D.L.; Wang, H. Autumn dry-wet conditions and main types of atmospheric circulation in anomalous years in southwest China. Chin. J. Atmos. Sci. 2014, 38, 373–385. (In Chinese) [Google Scholar]
- Qin, Y.; Yang, D.W.; Lei, H.M.; Xu, K.; Xu, X.Y. Comparative analysis of drought based on precipitation and soil moisture indices in Haihe basin of North China during the period of 1960–2010. J. Hydrol. 2015, 526, 55–67. [Google Scholar] [CrossRef]
- Xu, Y.D.; Ren, C.Y.; Ma, X.D.; Zhao, D.N.; Chen, W. Change of drought at multiple temporal scales based on SPI/SPEI in Northeast China. Arid. Zone Res. 2017, 34, 1250–1262. (In Chinese) [Google Scholar]
- Wang, X.Y.; Zhuo, L.; Li, C.; Engel, B.A.; Sun, S.K.; Wang, Y.B. Temporal and spatial evolution trends of drought in northern Shaanxi of China: 1960–2100. Appl. Clim. 2020, 139, 965–979. [Google Scholar] [CrossRef]
- Xiao, J.; Zhao, J.B. The study on the characteristics of agricultural drought disasters in recent 54a in Shaanxi Province. J. Arid Land Resour. Environ. 2006, 20, 201–204. (In Chinese) [Google Scholar] [CrossRef]
- Sun, Z.H.; Wang, Z.L.; Cao, X.M.; Yang, Q.; Liu, Z.C.; Lei, Y.P. Characteristics of drought change in the Loess Plateau Area of Shaanxi based on the standardized precipitation index during 1971–2010. J. Desert Res. 2013, 33, 1560–1567. (In Chinese) [Google Scholar]
- Li, H.M.; Wang, Z.; Gao, M.S. The improved of comprehensive meteorological drought index and its application in Shaanxi Province. Agric. Res. Arid Areas 2015, 33, 260–266. (In Chinese) [Google Scholar]
- Jiang, R.G.; Xie, J.C.; He, H.L.; Luo, J.G.; Zhu, J.W. Use of four drought indices for evaluating drought characteristics under climate change in Shaanxi, China: 1951–2012. Nat. Hazards 2015, 75, 2885–2903. [Google Scholar] [CrossRef]
- Zhou, D.; Zhang, B.; Ren, P.; Zhang, C.; Yang, S.; Ji, D. Analysis of drought characteristics of shaanxi province in recent 50 years based on standardized precipitation evapotranspiration index. J. Nat. Res. 2014, 29, 677–688. [Google Scholar]
- He, Y.; Zang, C.E.; Zang, L. Temporal and spatial characteristics of drought for recent 40 years in Shaanxi based on SPEI. Shaanxi Meteorol. 2014, 5, 26–32. (In Chinese) [Google Scholar]
- He, Y.; Wang, Z.; He, H. Application of three dynamic drought-monitoring indexes in Shaanxi Province. Agricultural. Res. Arid Areas 2014, 32, 242–249, 274. (In Chinese) [Google Scholar]
- Sheffield, J.; Wood, E.F. Characteristics of global and regional drought, 1950–2000: Analysis of soil moisture data from off-line simulation of the terrestrial hydrologic cycle. J. Geophys. Res. 2007, 112, D17115. [Google Scholar] [CrossRef] [Green Version]
- Dai, A.G. Drought under global warming: A review. Wiley Interdiscip. Rev. Clim. Chang. 2010, 2, 45–65. [Google Scholar] [CrossRef] [Green Version]
- Vicente-Serrano, S.M.; Beguería, S.; López-Moreno, J.I. A multiscalar drought index sensitive to global warming: The standardized precipitation evapotranspiration index. J. Clim. 2010, 23, 1696–1718. [Google Scholar] [CrossRef] [Green Version]
- Van Lanen, H.A.J.; Wanders, N.; Tallaksen, L.M.; Van Loon, A.F. Hydrological drought across the world: Impact of climate and physical catchment structure. Hydrol. Earth Syst. Sci. 2013, 17, 1715–1732. [Google Scholar] [CrossRef] [Green Version]
- Rajsekhar, D.; Singh, V.; Mishra, A. Hydrologic drought atlas for Texas. J. Hydrol. Eng. 2014, 20, 05014023. [Google Scholar] [CrossRef]
- Hao, Z.; AghaKouchak, A. A nonparametric multivariate multi-index drought monitoring framework. J. Hydrometeorol. 2014, 15, 89–101. [Google Scholar] [CrossRef]
- Houborg, R.; Rodell, M.; Li, B.; Reichle, R.; Zaitchik, B.F. Drought indicators based on model-assimilated Gravity Recovery and Climate Experiment (GRACE) terrestrial water storage observations. Water Resour. Res. 2012, 48, W07525. [Google Scholar] [CrossRef] [Green Version]
- Wang, D.; Hejazi, M.; Cai, X.; Valocchi, A.J. Climate change impact on meteorological, agricultural, and hydrological drought in central Illinois. Water Resour. Res. 2011, 47, W09527. [Google Scholar] [CrossRef] [Green Version]
- Tallaksen, L.M.; Hisdal, H.; van Lanen, H.A.J. Space-time modelling of catchment scale drought characteristics. J. Hydrol. 2009, 375, 363–372. [Google Scholar] [CrossRef]
- Mishra, A.K.; Singh, V.P. Analysis of drought severity-area-frequency curves using a general circulation model and scenario uncertainty. J. Geophys. Res. Atmos. 2009, 114, D06120. [Google Scholar] [CrossRef]
- Madadgar, S.; Moradkhani, H. Drought analysis under climate change using copula. J. Hydrol. Eng. 2013, 18, 746–759. [Google Scholar] [CrossRef]
- Van Loon, A.F.; Tijdeman, E.; Wanders, N.; Van Lanen, H.A.J.; Teuling, A.J.; Uijlenhoet, R. How climate seasonality modifies drought duration and deficit. J. Geophys. Res. Atmos. 2014, 119, 4640–4656. [Google Scholar] [CrossRef]
- Jehanzaib, M.; Kim, T.W. Exploring the influence of climate change-induced drought propagation on wetlands. Ecol. Eng. 2020, 149, 105799. [Google Scholar] [CrossRef]
- Sonh, K.H.; Bae, D.H. Drought analysis according to shifting of climate zones to arid climate zone over Asia monsoon region. J. Hydrol. 2015, 529, 1021–1029. [Google Scholar] [CrossRef]
- Gocic, M.; Trajkovic, S. Spatiotemporal characteristics of drought in Serbia. J. Hydrol. 2014, 510, 110–123. [Google Scholar] [CrossRef]
- Li, Y.H.; Xu, H.M.; Liu, D. Features of the extremely severe drought in the east of Southwest China and anomalies of atmospheric circulation in summer 2006. Acta Meteorol. Sin. 2009, 67, 122–132. (In Chinese) [Google Scholar] [CrossRef]
- Zargar, A.; Sadiq, R.; Naser, B.; Khan, F.I. A review of drought indices. Environ. Rev. 2011, 19, 333–349. [Google Scholar] [CrossRef]
- Heim, R. A review of twentieth-century drought indices used in the United States. Bull. Amer. Meteorol. Soc. 2002, 83, 1149–1165. [Google Scholar] [CrossRef] [Green Version]
- Mishra, A.K.; Singh, V.P. A review of drought concepts. J. Hydrol. 2010, 391, 202–216. [Google Scholar] [CrossRef]
- Wang, H.J.; Chen, Y.N.; Pan, Y.P.; Li, W.H. Spatial and temporal variability of drought in the arid region of China and its relationships to teleconnection indices. J. Hydrol. 2015, 523, 283–296. [Google Scholar] [CrossRef]
- Ayantobo, O.O.; Li, Y.; Song, S.B.; Yao, N. Spatial comparability of drought characteristics and related return periods in mainland China over 1961–2013. J. Hydrol. 2017, 550, 549–567. [Google Scholar] [CrossRef]
- Kim, T.-W.; Jehanzaib, M. Drought Risk Analysis, Forecasting and Assessment under Climate Change. Water 2020, 12, 1862. [Google Scholar] [CrossRef]
- Fang, W.; Huang, S.; Huang, Q.; Huang, G.; Wang, H.; Leng, G.; Wang, L.; Guo, Y. Probabilistic assessment of remote sensing-based terrestrial vegetation vulnerability to drought stress of the Loess Plateau in China. Remote Sens. Environ. 2019, 232, 111290. [Google Scholar] [CrossRef]
- Mortuza, M.R.; Moges, E.; Demissie, Y.; Li, H.Y. Historical and future drought in Bangladesh using copula-based bivariate regional frequency analysis. Theor. Appl. Climatol. 2019, 135, 855–871. [Google Scholar] [CrossRef]
- Ma, Z.G.; Fu, C.B. Interannual characteristics of the surface hydrological variables over the arid and semi-arid areas of northern China. Glob. Planet. Chang. 2003, 37, 189–200. [Google Scholar] [CrossRef]
- Dai, X.G.; Wang, P.; Zhang, K.J. A study on precipitation trend and fluctuation mechanism in northwestern China over the past 60 years. Acta Phys. Sin. 2013, 62, 129201. (In Chinese) [Google Scholar]
- Liu, X.Y.; Wang, J.S.; Li, D.L.; Yue, P.; Li, Y.H.; Yao, Y.B. Interannual and interdecadal atmospheric circulation anomalies of autumn dry/wet over the loess plateau and its multi-scalar correlation to SST. Acta Phys. Sin. 2013, 62, 219202. (In Chinese) [Google Scholar]
- Tan, C.; Yang, J.; Li, M. Temporal-Spatial Variation of Drought Indicated by SPI and SPEI in Ningxia Hui Autonomous Region, China. Atmosphere 2015, 6, 1399–1421. [Google Scholar] [CrossRef] [Green Version]
- Palmer, W.C. Meteorological Drought; Weather Bureau: Washington, DC, USA, 1965; pp. 45–58.
- Alley, W.M. The Palmer Drought Severity Index: Limitations and Assumptions. J. Appl. Meteorol. Clim. 1984, 23, 1100–1109. [Google Scholar] [CrossRef] [Green Version]
- Svensson, C. Empirical orthogonal function analysis of daily rainfall in the upper reaches of the Huai River basin, China. Appl. Clim. 1999, 62, 147–161. [Google Scholar] [CrossRef]
- Smith, A.K.; Semazzi, H.M.F. The Role of the Dominant Modes of Precipitation Variability over Eastern Africa in Modulating the Hydrology of Lake Victoria. Adv. Meteorol. 2014, 2014, 11. [Google Scholar] [CrossRef] [Green Version]
- North, G.R.; Bell, T.L.; Cahalan, R.F.; Moeng, F.J. Sampling errors in the estimation of empirical orthogonal functions. Mon. Wea. Rev. 1982, 110, 699–706. [Google Scholar] [CrossRef]
- Peng, S.; Fyfe, J. The Coupled Patterns between Sea Level Pressure and Sea Surface Temperature in the Midlatitude North Atlantic. J. Clim. 2009, 9, 1824–1839. [Google Scholar] [CrossRef] [Green Version]
- Yin, Y.X.; Pan, X.; Yang, X.Q.; Wang, X.J.; Wang, G.J.; Sun, S.L. Spatio-temporal changes and frequency analysis of multi-day extreme precipitation in the Huai River basin during 1960 to 2014. Adv. Meteorol. 2019, 2019, 6324878. [Google Scholar] [CrossRef] [Green Version]
- Wen, K.; Zhai, W.Q. China Meteorological Disaster Dictionary: Shaanxi Volume; China Meteorological Press: Beijing, China, 2007. [Google Scholar]
- Guo, M.; Li, J.; Wang, Y.; Long, Q.; Bai, P. Spatiotemporal Variations of Meteorological Droughts and the Assessments of Agricultural Drought Risk in a Typical Agricultural Province of China. Atmosphere 2019, 10, 542. [Google Scholar] [CrossRef] [Green Version]
- Cai, X.L.; Li, Q.; Fang, J.G. Variation characteristics of regional meteorological drought events of Shaanxi Province. Arid Land Geogr. 2016, 39, 294–300. (In Chinese) [Google Scholar]


| Station | Mild Drought (%) | Medium Drought (%) | Severe Drought (%) | Extreme Drought (%) | Total (%) |
|---|---|---|---|---|---|
| Dingbian | 12.73 | 13.73 | 6.45 | 0 | 34.91 |
| Fugu | 24.64 | 5.45 | 1.82 | 3.64 | 35.55 |
| Hengshan | 9.27 | 20.36 | 4.64 | 1.82 | 36.09 |
| Jiaxian | 21.18 | 10.09 | 0 | 5.64 | 36.91 |
| Jingbian | 18 | 4 | 8.6 | 4 | 34.6 |
| Mizhi | 13.04 | 8.7 | 9.27 | 0 | 31 |
| Qingjian | 21.22 | 1.64 | 1.02 | 3.04 | 26.71 |
| Shenmu | 10.1 | 11.99 | 12.97 | 1.99 | 37.05 |
| Suide | 21.22 | 6.17 | 2.14 | 1.02 | 30.55 |
| Wubao | 15.08 | 10.11 | 4.34 | 0 | 29.53 |
| Yulin | 15.73 | 15.91 | 1.82 | 2.82 | 36.28 |
| Zizhou | 17 | 11.33 | 1.22 | 1.22 | 30.77 |
Publisher’s Note: MDPI stays neutral with regard to jurisdictional claims in published maps and institutional affiliations. |
© 2020 by the authors. Licensee MDPI, Basel, Switzerland. This article is an open access article distributed under the terms and conditions of the Creative Commons Attribution (CC BY) license (http://creativecommons.org/licenses/by/4.0/).
Share and Cite
Yin, Y.; Zhang, L.; Wang, X.; Xu, W.; Yu, W.; Zhu, Y. Meteorological Drought Changes and Related Circulation Characteristics in Yulin City of the Northern Shaanxi from 1961 to 2015. Atmosphere 2020, 11, 1196. https://doi.org/10.3390/atmos11111196
Yin Y, Zhang L, Wang X, Xu W, Yu W, Zhu Y. Meteorological Drought Changes and Related Circulation Characteristics in Yulin City of the Northern Shaanxi from 1961 to 2015. Atmosphere. 2020; 11(11):1196. https://doi.org/10.3390/atmos11111196
Chicago/Turabian StyleYin, Yixing, Lijuan Zhang, Xiaojun Wang, Wucheng Xu, Wenjun Yu, and Ye Zhu. 2020. "Meteorological Drought Changes and Related Circulation Characteristics in Yulin City of the Northern Shaanxi from 1961 to 2015" Atmosphere 11, no. 11: 1196. https://doi.org/10.3390/atmos11111196
APA StyleYin, Y., Zhang, L., Wang, X., Xu, W., Yu, W., & Zhu, Y. (2020). Meteorological Drought Changes and Related Circulation Characteristics in Yulin City of the Northern Shaanxi from 1961 to 2015. Atmosphere, 11(11), 1196. https://doi.org/10.3390/atmos11111196