Abstract
Air pollution has many adverse effects on health and is associated with an increased risk of mortality. Desert dust outbreaks contribute directly to air pollution by increasing particulate matter concentrations. We investigated the influence of desert dust outbreaks on air quality in Santa Cruz de Tenerife, a city located in the dust export pathway off the west coast of North Africa, using air-quality observations from a six-year period (2012–2017). During winter intense dust outbreaks PM mean (24-h) concentrations increased from 14 g m to 98 g m, on average, and PM mean (24-h) concentrations increased from 6 g m to 32 g m. Increases were less during summer outbreaks, with a tripling of PM and PM daily mean concentrations. We found that desert dust outbreaks reduced the height of the marine boundary layer in our study area by >45%, on average, in summer and by ∼25%, on average, in winter. This thinning of the marine boundary layer was associated with an increase of local anthropogenic pollution during dust outbreaks. NO and NO mean concentrations more than doubled and even larger relative increases in black carbon were observed during the more intense summer dust outbreaks; increases also occurred during the winter outbreaks but were less than in summer. This has public health implications; local anthropogenic emissions need to be reduced even further in areas that are impacted by desert dust outbreaks to reduce adverse health effects.
1. Introduction
It is well known that air pollution has many adverse effects on health [1,2], and recent research suggests substantially higher health impacts than previously assumed, with a near doubling of the global mortality rate attributable to ambient air pollution to 8.8 million [3]. Air pollution has been classified as the biggest environmental risk to health [4], and a recent review highlights how children are uniquely vulnerable to air pollution due to physiological, behavioural, and environmental factors and how exposure to air pollution in early years can lead to a life-long health burden [5]. The World Health Organisation (WHO) sets Air-Quality Guidelines (AQGs) for particulate matter (PM and PM), sulphur dioxide (SO), nitrogen dioxide (NO), and ozone (O) [6]. Globally, 91% of the world’s population and 93% of children live in environments with air-pollution levels exceeding the WHO guidelines [4,7].
Desert dust outbreaks contribute directly to air pollution by increasing particulate matter concentrations, often by orders of magnitude [8,9,10]. Airborne desert dust impacts air quality on both local and global scales as dust can be transported thousands of km in the atmosphere [11]; airborne desert dust also has impacts on climate and biogeochemistry [8]. The most active global dust source regions are located in a broad band or “dust belt” extending from the west coast of North Africa through the Middle East to central Asia [9]. North Africa alone accounts for 55% of global dust emissions while North Africa, the Middle East, and Asia together account for ∼87% of global emissions [9].
The health effects of desert dust are more uncertain than those of, for example, carbonaceous particulate matter, as most of the epidemiological studies of health effects of air pollution have been conducted in urban areas dominated by anthropogenic particles [11,12]. However, various studies have found associations between mortality and coarse particles and/or PM during dust outbreaks in urban areas [13,14,15,16]. Recent studies in Tenerife found that exposure to Saharan dust may be a precipitating factor of hospital admision due to heart failure [17], while a study in the capital cities of both Tenerife and Gran Canaria (Canary Islands) found that fine and coarse particles and NO were associated with an increased risk of emergency hospital admission for respiratory diseases [18]. The processes involved in the adverse health effects of desert dust outbreaks are still being investigated. Desert dust has been shown to be mixed with particulate pollutants as the dust plume encounters polluted air masses, for example, on its way from North Africa to the Western Mediterranean [19] and as it travels westward from North Africa to the North Atlantic [20]. The results of a study in two regions of contrasting African influence found that the mechanism of pollution scavenging by dust was more effective in the wet mode at sites further away from the desert dust source [19].
In addition to direct health effects of desert dust and the increasing particulate concentrations from transport of desert dust, recent studies have indicated there are also indirect health effects of dust outbreaks. For example, the adverse health effects or toxicity of the locally produced particulate matter was also found to increase during dust outbreaks [21]. Studies in southern Europe (Barcelona and Madrid, Spain) have found that the mixing layer height significantly decreased with increasing intensity of Saharan dust events [22,23] and that an increased risk of mortality was observed with the reduction in mixing layer height [22]. This thinning of the mixing layer leads to an accumulation of local anthropogenic pollutants and may favour new particle formation or new species formed from condensation of gaseous precursors on the surface of dust particles [22,24]. A study of PM chemical composition in Seville (Spain) reported that, as well as the expected natural PM load increase during Saharan dust outbreaks, the anthropogenic load also increased to twice the concentration observed in non-dust outbreak days [25].
One of the challenges of investigating the health effect of dust outbreaks is having adequate air-quality observations in dust outbreak regions [11,16,26]. In this study, we use air-quality observations from Santa Cruz de Tenerife (Canary Islands, Spain) as an illustrative case of a city located close to Saharan dust sources. The proximity of Santa Cruz de Tenerife to the west coast of North Africa (∼300 km) in the desert dust export pathway to the North Atlantic (Figure 1) causes it to be frequently subjected to dust outbreaks, which increase the particulate concentrations and affect the air quality. This desert dust export from western Africa to the North Atlantic establishes a dry, warm, and dust-laden air layer that is referred to as the Saharan Air Layer (SAL), which can expand westward to the Americas [27,28,29,30]. In winter and early spring, the Saharan Air Layer intrusions over the North Atlantic occur at low altitude (0–3 km) [29,31,32], while in summer, the SAL and dust transport occurs at higher altitudes (1–5 km) [29,33]. However, although the dust transport largely take place at altitude in the summer, the impact on concentrations at lower altitudes can occur through gravitational settlement of the dust [34].
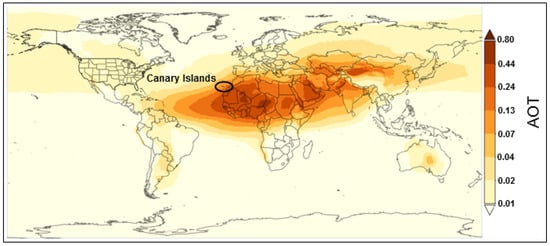
Figure 1.
Annual mean distribution of dust extinction Aerosol Optical Thickness (AOT) in 2017, highlighting the location of the dust belt, the westward transport of dust to the Americas, and the location of Tenerife, Canary Islands: Data obtained from the Modern-Era Retrospective analysis for Research and Applications, Version 2 (MERRA-2).
Santa Cruz de Tenerife is a medium-size coastal city, and in addition to the impact of desert dust particles, it has a mixture of anthropogenic sources of pollutants. Here, we combine air-quality observations and data of the vertical structure of the atmosphere from 2012 to 2017, obtained from both observations and a numerical weather prediction model, to investigate the direct and indirect influence of desert dust outbreaks on air quality in urban areas.
2. Materials and Methods
2.1. Study Area
Santa Cruz de Tenerife is the capital city of Tenerife (Canary Islands) and has 203,700 inhabitants. It is a coastal city of complex topography, boarded by the Anaga peninsula to the NE (1024 m a.s.l.) and built on a slope ranging up to 624 m a.s.l. in the NW direction (Figure A1). It has a mixture of anthropogenic sources of pollutants (both on-road and maritime traffic and industrial emissions from an oil refinery) [35,36,37]. In 2014, the Santa Cruz de Tenerife refinery ceased crude oil refining operations; however, some industrial activity (water vapour production) continues at the refinery. A strong and stable temperature inversion layer is present for most of the year in the Canary Islands and in Tenerife due to quasi-permanent subsidence conditions in the dry free troposphere (FT) coupled with frequent humid trade winds flow in the marine boundary layer (MBL) [38].
2.2. Air-Quality and Meteorological Observations
Hourly ambient concentrations of PM, PM, NO, NO, and O were obtained from the Canary Islands’ ambient Air-Quality Monitoring Network for three urban measurement stations in Santa Cruz de Tenerife for 2012–2017. The measurement sites used were as follows: (1) Tena Artigas (28.455 N, 16.277 W, 169 m a.s.l.); (2) Piscina Municipal (28.458 N, 16.263 W, 68 m a.s.l.); and (3) Vuelta Los Pájaros (28.462 N, 16.276 W, 158 m a.s.l.). See Figure A1 in Appendix A for the location of the measurement sites.
The measurements were conducted following protocols and reference methods specified in the European air-quality directives [39]. Measurements of PM and PM were conducted using a Beta Attenuation Monitor (Met One Instruments-BAM 1020, Grants Pass, OR, USA), NO and NO measurements were performed using chemiluminescence, and O measurements were made using UV absorption. Hourly mass concentrations of black carbon (BC) in the PM fraction were also obtained for the Tena Artigas measurement site during 2014–2017. These measurements were conducted with a Multi Angle Absorption Photometer (Thermo Scientific-Carusso 5012, Waltham, MA, USA), (see Rodríguez et al. for details [40]).
In addition, meteorological data was obtained from the State Meteorological Agency of Spain (AEMET), Santa Cruz de Tenerife measurement site (C449C) (Figure A1). These measurements included hourly measurements of wind speed and wind direction at 10 m, air temperature at 2 m, and precipitation.
2.3. Marine Boundary Layer Height Determination
We obtained modelled data of the marine boundary layer height (BLH) from 2012 to 2017 from the European Centre for Medium-Range Weather Forecasts (ECMWF) Integrated Forecasting System (IFS) numerical weather prediction model [41] for a grid point to the northeast of Tenerife (29.25 N, 15.75 W) at six-hour intervals (00:00, 06:00, 12:00, and 18:00 UTC). In this study, we use the values at 12:00 UTC. In the IFS model, the BLH is defined as the lowest height at which the bulk Richardson number reaches the critical value of 0.25 [41,42]. The ECMWF IFS model was found to realistically simulate the BLH over oceans in a recent evaluation against an extensive dataset of dropsonde observations [43].
In addition, we present data of the marine BLH from 2012 to 2017 from radiosonde observations of vertical profiles of atmospheric pressure, temperature, and relative humidity. The radiosondes (Vaisala, RS92, Vantaa, Finland) are launched daily at 00:00 and 12:00 UTC from the AEMET automatic radiosonde station in Güímar, Tenerife (Global Climate Observing System, Upper-air Network station #60018, 28.318 N, 16.382 W, 105 m a.s.l.). In this study, we use the values at 12:00 UTC and we utilise the same methodology as described above for the IFS to calculate the BLH [42], the lowest height at which the bulk Richardson number reaches a value of 0.25.
2.4. Determination of Desert Dust Outbreaks
The record of desert dust outbreaks affecting the Canary Islands for 2012 to 2017 was obtained from the Spanish ministry responsible for the environment, which analyses and produces a report each year of the natural particulate episodes that have occurred in Spain [44]. The analysis divides Spain up into nine geographical areas, of which the Canary Islands is one area. The EU Directive [39] allows member states to subtract the contribution of natural sources under certain conditions before comparing the ambient air pollutant concentrations to the limit values. Guidelines are provided on which sources can be regarded as natural and on methods to quantify and subtract the contribution of these sources [45]. Following these guidelines, natural particulate episodes that have occurred in Spain are identified using a mix of ground-based particulate measurements, modelled particulate concentrations (using numerical models such as BSC-DREAM8b, https://ess.bsc.es/bsc-dust-daily-forecast; NAAPS-NRL, https://www.nrlmry.navy.mil/aerosol/; and SIKRON, http://forecast.uoa.gr/dustindx.php) satellite imagery (e.g., from MODIS, https://modis.gsfc.nasa.gov/), and air mass back trajectory information (e.g., from HYSPLIT, https://www.arl.noaa.gov/hysplit/hysplit/) [44,45].
A methodology was developed in Spain and Portugal to quantify the contribution of natural dust to daily PM concentrations during dust outbreaks [46,47,48]. The methodology consists of calculating the monthly moving 40th percentile of the PM time series at a regional background (RB) measurement site after previously extracting days with desert dust outbreaks; this is then denoted the regional background level. The daily net dust load in PM attributable to a desert dust outbreak in a given region can subsequently be obtained by subtracting this daily regional background level from the PM concentration value at the RB site [46]. This constitutes one of the official methods recommended by the European Commission for quantifying the contribution of natural sources [45]. Following this methodology, calculations of natural dust contributions to PM concentrations during dust outbreaks are provided throughout Spain at regional background measurement sites [44]. We utilised these calculations of natural dust contribution to daily PM concentrations during dust outbreaks at the regional background measurement site located ∼40 km from Santa Cruz de Tenerife (El Rio site, 28.145 N, 16.524 W, 500 m a.s.l.). This regional background measurement site has been used for numerous studies and characterisations of desert dust outbreaks in the Canary Islands [31,34,49].
Once having established the record of desert dust outbreaks affecting the Canary Islands for 2012 to 2017, we followed a methodology similar to Pandolfi et al. [22] to determine the intensity of these dust outbreaks. We defined moderate and intense desert dust outbreaks as those dust outbreaks for which the natural dust contribution to PM concentrations are <75th percentile (p75) and >p75, respectively. The 75th percentile of the natural dust contribution to daily PM concentrations in the 2012–2017 period in our study area was 34 g m.
3. Results and Discussion
3.1. PM and PM Concentrations
Dust outbreaks have a direct effect on air quality by increasing the particulate concentrations. Although dust outbreaks contribute more in mass percentage terms to the particulate coarse mode fraction (PM), they do also increase the particulate fine fraction (PM). We compared daily (24-h mean) PM and PM concentrations at the three urban measurement sites in Tenerife for 2012–2017 with the record of desert dust outbreaks affecting the Canary Islands for the same period. Data for 2015 illustrates how all episodes of increased PM and PM concentrations and all the exceedances of the WHO 24-h mean PM (50 g m) and PM (25 g m) Air-Quality Guideline occur during dust outbreak days (Figure 2a,b). On average, 38% of days during 2012 to 2017 were affected by dust outbreaks, with a maximum of 55% of days (201 days) in 2017. To assess the indirect influence of desert dust outbreaks on air quality in urban areas, we use data of the marine BLH obtained from radiosonde observations and from a numerical weather prediction model (see Section 2.3 for more details). We see that that, during dust outbreak days, the BLH generally decreases (Figure 2c). Further analysis on this thinning of the marine boundary layer during dust outbreak days is conducted in Section 3.3.
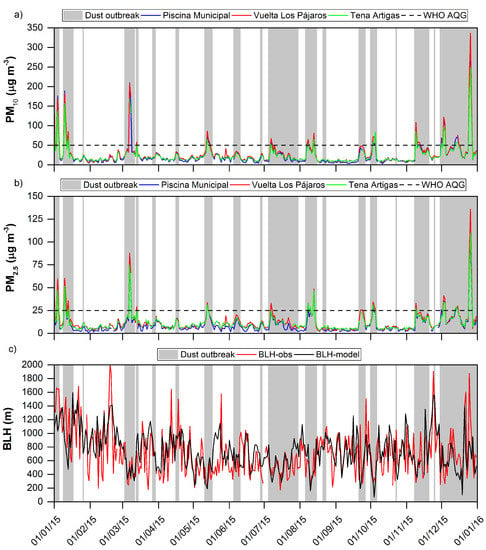
Figure 2.
Daily (24-h mean) concentrations of (a) PM and (b) PM at three urban measurement sites in Santa Cruz de Tenerife and (c) the boundary layer height (BLH), daily values at 12:00 UTC, obtained from radiosonde observations and from the European Centre for Medium-Range Weather Forecasts (ECMWF) Integrated Forecasting System (IFS) numerical weather prediction model for 2015: Also shown in all panels are the desert dust outbreaks affecting the Canary Islands in 2015.
3.2. Seasonal Variation of Desert Dust Outbreaks, PM Concentrations, and BLH in the Study Area
To assess the influence of desert dust outbreaks on air quality, it is useful to first analyse the seasonal variability of the desert dust outbreaks and PM concentrations in the Canary Islands. Examining the seasonal variability for the six-year period (2012 to 2017) demonstrates various features (Figure 3). Firstly we observe that, on average, all months in the Canary Islands experience desert dust outbreaks to a greater or lesser degree; there are no months which experience no dust outbreaks, on average. However, secondly, we observe that desert dust outbreaks affecting the Canary Islands can be divided into two main periods: (1) winter dust outbreaks which occur from December–March, with a maximum observed during 2012 to 2017 in December (67% of days month), and (2) summer dust outbreaks which occur largely in July–August (51% and 56% of days month, respectively). The months of April to June, on average, experience less desert dust outbreaks with the minimum percentage of desert dust outbreaks observed in May (15% of days month). This seasonal variation is in agreement with previous studies [10,33,34]. PM mean monthly concentrations for 2012 to 2017 in Santa Cruz de Tenerife demonstrate that they are consistent with the seasonal distribution of the desert dust outbreaks with maximum concentrations observed in December and minimum concentrations observed in May and June (Figure 3a).
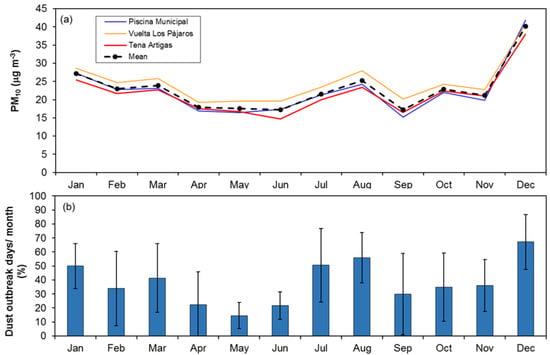
Figure 3.
Seasonal variability of (a) PM concentrations and (b) desert dust outbreaks for 2012 to 2017: The error bars in Figure 3b represent the standard deviation in the mean monthly values.
The seasonal variability of the marine BLH in the Canary Islands demonstrated by radiosonde observations and output from the ECMWF IFS numerical weather prediction model is characterized by a maximum in winter and a minimum in summer (Figure 4). The monthly mean BLH is at a maximum during November to February in both the observations (883 m to 930 m), and the model data (844 to 987 m) and the minimum monthly mean BLH is observed in August in both datasets (Obs: 606 m, Model: 582 m). The model values are generally less dispersive than the radiosonde observations (Figure 4). This is consistent with Lavers et al. [43], who concluded from a recent evaluation of the ECMWF IFS model against an extensive dataset of dropsonde observations that the ECMWF IFS model results did not capture all the dispersion in the observations and considered this to be largely due to representativeness errors, as the ECMWF IFS model represents the grid box average rather than capturing sub-grid atmospheric variability.
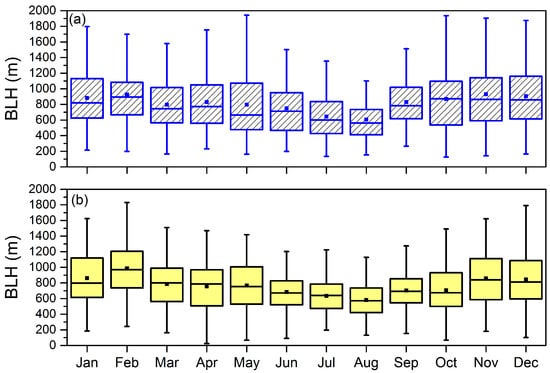
Figure 4.
Seasonal variability of marine boundary layer height (BLH) from (a) radiosonde observations and (b) ECMWF IFS numerical weather prediction model for 2012 to 2017. The horizontal lines and the squares within the box represent the median and mean values, respectively, while the bottom and top of each box are the 25th and 75th percentiles. The whiskers are the 5th and 95th percentiles.
3.3. Thinning of Marine Boundary Layer
The following analysis was conducted separately for the two types of dust outbreaks observed here in the Canary Islands: (1) Winter dust outbreaks (December–March) and (2) summer dust outbreaks (July–August). As described in Section 2.4, we define moderate and intense desert dust outbreaks as those dust outbreaks for which the natural dust contribution to PM concentrations are <75th percentile (p75) and >p75, respectively.
We observe a reduction or “thinning” of the marine boundary layer height during desert dust outbreaks in both the data from radiosonde observations and the ECMWF IFS model BLH data. The mean and median BLH progressively decreased with increasing intensity of Saharan dust outbreaks for both observations and modelled data (Figure 5). This “thinning” is observed in both winter dust outbreaks (Figure 5a) and summer dust outbreaks (Figure 5b) with the effect being stronger in the summer dust outbreaks (Figure 5 and Table 1 and Table 2). In summer, a 45% and 49% reduction in median BLH for more intense dust outbreak days compared to non-dust outbreak days is observed from observations and modelled data, respectively. In winter, a 24% and 33% reduction in median BLH for more intense dust outbreak days compared to non-dust outbreak days is observed from observations and modelled data, respectively.
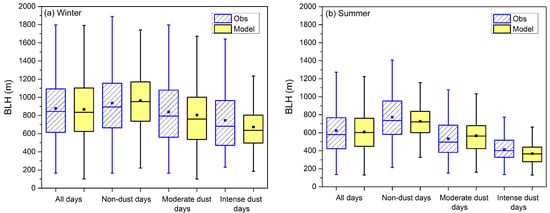
Figure 5.
Box plot of marine boundary layer height (BLH) from radiosonde observations and ECMWF IFS numerical weather prediction model for (a) winter dust outbreaks (Dec–Mar) and (b) summer dust outbreaks (Jul–Aug) calculated for all days, non-dust outbreak days, and different intensities of dust outbreaks (2012 to 2017): The horizontal lines and the squares within the box represent the median and mean values, respectively, while the bottom and top of each box are the 25th and 75th percentiles. The whiskers are the 5th and 95th percentiles.

Table 1.
Statistical metrics for marine boundary layer height (BLH) from radiosonde observations (Obs) and the IFS model during non-dust outbreak days and for different intensities of dust outbreaks in the Canary Islands for the winter season (December–March), 2012–2017: Standard deviation in the mean is given in parentheses.

Table 2.
Same as Table 1 but for the summer season (July–August).
Vertical profiles of median relative humidity from the radiosonde observations (2012 to 2017) for non-dust days and intense-dust days are shown in Figure 6. During non-dust days, a strong MBL and very dry FT are observed in both winter and summer. This dry FT is a result of both a large-scale subsidence regime associated with the descending branch of the Hadley cell above the subtropics (∼30 N) [38] and the free troposphere subsident air masses originating from mid-high latitudes [50,51]. However, during dust days, the air masses come from the African continental boundary layer, which have a higher humidity than the clean free troposphere over the ocean but a lower humidity than the MBL [52,53]. Thus, the Saharan Air Layer dries the MBL and increases the relative humidity in the free troposphere for both winter and summer dust outbreaks (Figure 6).
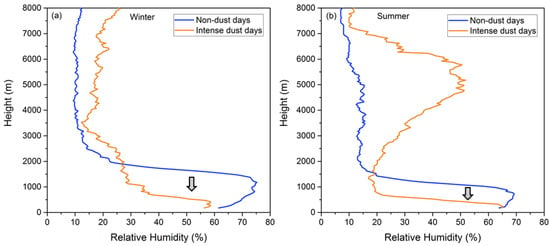
Figure 6.
Vertical profiles of median relative humidity (%) from radiosonde observations for non-dust days and intense-dust days shown for (a) winter dust outbreaks (December–March) and (b) summer dust outbreaks (July–August), 2012 to 2017.
Furthermore, these profiles show how the height of the humid MBL is reduced during the dust outbreaks both in winter and summer. This was also observed in a campaign study in the Canary Islands where the MBL was reduced down to 250 m in a particular Saharan dust episode [49]. In addition, the interaction of dust with radiation heats the lower atmosphere within the dust layer, affecting the radiative budget and enhancing the atmospheric stability [29].
3.4. Increase of Particulate and Gaseous Pollutants during Dust Outbreaks
We examined the mean concentrations of both particulate and gaseous pollutants in non-dust outbreak days compared to increasing intensity of desert dust outbreaks in 2012 to 2017 for both winter and summer dust outbreaks (Figure 7 and Figure 8). The particulate and gaseous pollutant data presented in Figure 7 and Figure 8 are the daily (24-h mean) data averaged for the three urban measurement sites for 2012–2017 except for black carbon data, which was only available at the Tena Artigas measurement site. During winter dust outbreaks, PM mean (24-h) concentrations increased from 14 g m to 98 g m (an increase of ×7.1) and PM mean (24-h) concentrations increased from 6 g m to 32 g m (×5.3 increase), on average, during the more intense dust outbreaks compared to non-dust outbreak days (Figure 7a,b). In addition, the mean concentrations of locally emitted anthropogenic pollutants, NO, NO, and BC, also increased with intensity of desert dust outbreaks. We observed an increase in mean concentrations of NO, NO and black carbon by factors of 1.7, 2.1, and 2.7, respectively, during more intense dust outbreaks compared to non-dust outbreak days in winter (Figure 7c–e). The mean O concentrations decreased by 21% (Figure 7f), consistent with titration by the increasing NO concentrations.
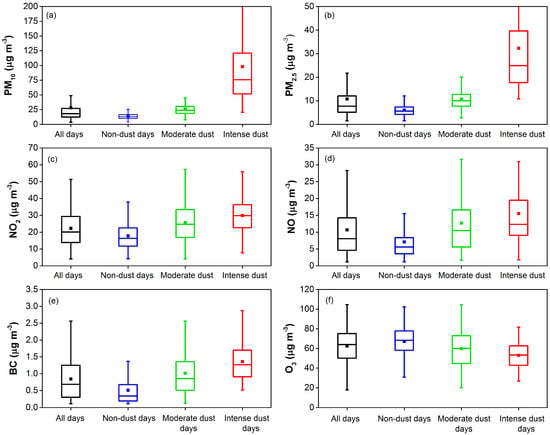
Figure 7.
Mean (24-h) concentrations of (a) PM; (b) PM; (c) NO; (d) NO; (e) Black Carbon (BC) ≤ 10 m, and f) O calculated for all days, non-dust outbreak days, and different intensities of dust outbreaks during winter (December–March): The horizontal lines and the squares within the box represent the median and mean values, respectively, while the bottom and top of each box are the 25th and 75th percentiles. The whiskers are the 5th and 95th percentiles. All data are for the 2012 to 2017 period except for black carbon data, which are for 2014–2017.
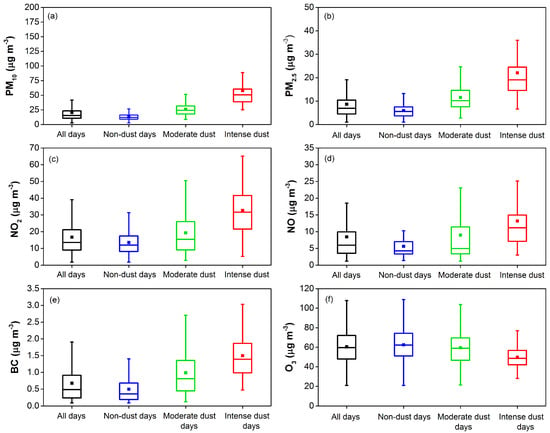
Figure 8.
Same as Figure 7 but for the summer season (July–August).
During summer dust outbreaks, the particulate concentrations increased less than during the winter dust outbreaks; PM mean (24-h) concentrations increased from 14 g m to 49 g m (×3.6 increase) and PM mean (24-h) concentrations increased from 6 g m to 19 g m (×3.4 increase), on average, during the more intense dust outbreaks compared to non-dust outbreak days (Figure 8a,b). This is consistent with the dust transport largely taking place at high altitudes in the summer and the impact on concentrations at lower altitudes being through gravitational settlement of the dust rather than a result of direct transport intruding into the marine boundary layer. In contrast, the mean concentrations of locally emitted anthropogenic pollutants increased more during the summer dust outbreaks than during the winter dust outbreaks; the mean concentrations of NO, NO, and black carbon increased by factors of 2.7, 2.4, and 3.4, respectively, during more intense dust outbreaks compared to non-dust outbreak days (Figure 8c–e). This is consistent with the stronger reduction of the marine boundary layer height during the summer dust outbreaks.
These increases of both particulate and gaseous pollutants observed during dust outbreaks in this study are larger than those observed in the Barcelona study [22], where the mean concentrations of NO and NO increased by around 21% and 15%, respectively, during days with natural dust contribution to PM concentrations in the >90th percentile compared to non-dust outbreak days. These large increases of both particulate and gaseous pollutants during dust outbreaks in this study reflect both the high frequency and high intensity of dust outbreaks experienced in the Canary Islands due to its location in the dust export pathway from North Africa towards the subtropical North Atlantic.
In addition, the wet scavenging processes are less effective in the subtropical region where rainfall is much lower and scarcer in summertime compared with mid-latitude sites, favouring the persistence of particulate and gaseous pollutants in the ambient air. Climatological rainfall values (1981–2010) for Santa Cruz de Tenerife (C449C) and Barcelona Airport (0076) meteorological stations (AEMET) show that the December–March accumulated rainfall is identical (148 mm) while the July–August accumulated rainfall is much less in Santa Cruz de Tenerife (2 mm) compared to Barcelona (83 mm) (Table A1). In wintertime, we do observe rainfall events that reduce the persistence of gas and particulate pollutants due to wet scavenging processes in contrast to the summertime. The mean daily accumulated rainfall in Santa Cruz de Tenerife (C449C) decreased from 0.9 mm to 0.4 mm, a reduction of 55%, during wintertime intense dust outbreaks compared to non-dust days in the 2012–2017 period (data not shown).
We also examined the mean daily surface wind speed in non-dust outbreak days compared to increasing intensity of desert dust outbreaks in 2012 to 2017 for both winter and summer dust outbreaks (Figure A2). The mean daily wind speed decreased from 2.6 m s to 1.9 m s, a reduction of 29%, during summertime intense dust outbreaks compared to non-dust days, while in wintertime, we did not observe a change in mean daily wind speed between intense dust and non-dust days.
4. Conclusions
We combined air-quality observations and marine boundary layer height data for Santa Cruz de Tenerife as an illustrative case of a city located close to and frequently impacted by desert dust sources to address the question of both the direct and indirect influences of desert dust outbreaks on air quality in urban areas. On average, 38% of days during 2012 to 2017 were affected by dust outbreaks, with a maximum of 55% of days in 2017; this led to exceedances above the WHO PM and PM 24-h mean AQGs.
Thinning of the marine boundary layer occurred during dust outbreaks, with >45% reduction in median marine boundary layer height in the more intense dust outbreaks during summer and ∼25% reduction in median marine boundary layer height in the more intense dust outbreaks during winter. Local anthropogenic pollution was shown to increase during dust outbreaks. We observed more than a doubling of NO and NO mean concentrations and even larger relative increases in black carbon during the more intense summer dust outbreaks. Increases in NO, NO. and BC mean concentrations by factors of 1.7, 2.1, and 2.7, respectively, were also observed during the winter outbreaks, but these increases were less than in summer, consistent with the stronger reduction of the marine boundary layer height in summer.
Desert dust outbreaks, through the effect of the reduction in the marine boundary layer height can increase anthropogenic air pollution in urban areas, and it appears from recent health studies that the resulting cocktail of desert dust and local anthropogenic pollutants has a greater effect than solely local pollution or dust. This has public health implications; local anthropogenic emissions need to be reduced even further in areas that are impacted by desert dust outbreaks if we are to achieve the health benefits we expect from emission reductions and to reduce adverse health effects. This is contrary to the current air-quality policy in the European Union, where, from a legislative point of view, the PM concentrations can be discounted during these “natural” episodes [45]. In fact, the health outcomes during desert dust outbreaks cannot be discounted [54] and, as shown here, the adverse health effects can be exacerbated during these events.
Consequently, anthropogenic emissions need to be controlled more strongly in areas that are impacted by desert dust outbreaks to counteract this detrimental coupling of dust outbreaks and anthropogenic air-quality episodes. This is of particular importance for urban areas strongly and frequently impacted by dust outbreaks, and these conclusions need to be taken account of in other geographical areas strongly impacted by desert dust outbreaks such as the Mediterranean, North Africa, the Middle East and Asia.
Author Contributions
C.M. designed the study, analysed the data, and wrote the manuscript. E.C., C.L.M., V.G., S.R. and C.T. contributed to interpretation of the data. V.G. provided air-quality data, while C.L.M., J.J.B. and P.M.R.-C. obtained and analysed meteorological data. All authors have read and agreed to the published version of the manuscript.
Funding
This research received no external funding.
Acknowledgments
The authors would like to thank the Canary Islands Government for data from their Air-Quality Monitoring Network. This activity has been undertaken in the framework of the World Meteorological Organisation Global Atmosphere Watch Urban Research Meteorology and Environment (GURME) project. Analyses and visualizations of MERRA-2 data used in this paper were produced with the Giovanni online data system and developed and maintained by the NASA GES DISC at http://disc.sci.gsfc.nasa.gov/giovanni. We would also like to thank E. Nemitz for his comments on the manuscript. In addition, we wish to thank the Spanish Ministry for the Ecological Transition (MITECO) for data provided as a result of the collaboration agreement for the study and evaluation of air pollution by suspended particulate matter in Spain between MITECO and the Spanish National Research Council (CSIC).
Conflicts of Interest
The authors declare no conflict of interest.
Appendix A
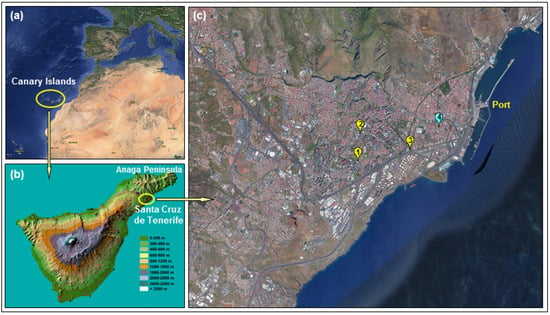
Figure A1.
(a) Location of the Canary Islands; (b) topographic map of Tenerife (Carta Digital v2.0); and (c) plan view of Santa Cruz de Tenerife indicating the location of the air-quality measurement sites (1) Tena Artigas, (2) Vuelta Los Pájaros, (3) Piscina Municipal, and (4) the meteorological station (AEMET: C449C).

Table A1.
Climatological rainfall values (1981–2010) for Santa Cruz de Tenerife (C449C) and Barcelona Airport (0076) meteorological stations (AEMET).
Table A1.
Climatological rainfall values (1981–2010) for Santa Cruz de Tenerife (C449C) and Barcelona Airport (0076) meteorological stations (AEMET).
| Site | Annual Rainfall (mm) | Winter (December–March) Rainfall (mm) | Summer (July–August) Rainfall (mm) |
|---|---|---|---|
| Santa Cruz | 226 | 148 | 2 |
| Barcelona | 588 | 148 | 83 |

Figure A2.
Mean daily surface wind speed (2012 to 2017) calculated for all days, non-dust outbreak days, and different intensities of dust outbreaks during (a) winter (December–March) and (b) summer (July–August): The horizontal lines and the squares within the box represent the median and mean values, respectively, while the bottom and top of each box are the 25th and 75th percentiles. The whiskers are the 5th and 95th percentiles.
References
- Landrigan, P.J.; Fuller, R.; Acosta, N.J.R.; Adeyi, O.; Arnold, R.; Basu, N.N.; Baldé, A.B.; Bertollini, R.; Bose-O’Reilly, S.; Boufford, J.I.; et al. The Lancet Commission on pollution and health. Lancet 2018, 391, 462–512. [Google Scholar] [CrossRef]
- WHO. Review of Evidence on Health Aspects of Air Pollution—REVIHAAP Project; World Health Organization, Regional Office for Europe: Copenhagen, Denmark, 2013. [Google Scholar]
- Lelieveld, J.; Klingmuller, K.; Pozzer, A.; Poschl, U.; Fnais, M.; Daiber, A.; Munzel, T. Cardiovascular disease burden from ambient air pollution in Europe reassessed using novel hazard ratio functions. Eur. Heart J. 2019, 40, 1590–1596. [Google Scholar] [CrossRef] [PubMed]
- WHO. Ambient Air Pollution: A Global Assessment of Exposure and Burden of Disease; World Health Organization: Geneva, Switzerland, 2016. [Google Scholar]
- WHO. Air Pollution and Child Health: Prescribing Clean Air; World Health Organization: Geneva, Switzerland, 2018. [Google Scholar]
- WHO. WHO Air Quality Guidelines: Global Update 2005—Particulate Matter, Ozone, Nitrogen Dioxide and Sulfur Dioxide; World Health Organization, Regional Office for Europe: Copenhagen, Denmark, 2006. [Google Scholar]
- WHO. World Health Statistics 2018: Monitoring Health for the SDGs, Sustainable Development Goals; World Health Organization: Geneva, Switzerland, 2018. [Google Scholar]
- Mahowald, N.M.; Kloster, S.; Engelstaedter, S.; Moore, J.K.; Mukhopadhyay, S.; McConnell, J.R.; Albani, S.; Doney, S.C.; Bhattacharya, A.; Curran, M.A.J.; et al. Observed 20th century desert dust variability: Impact on climate and biogeochemistry. Atmos. Chem. Phys. 2010, 10, 10875–10893. [Google Scholar] [CrossRef]
- Ginoux, P.; Prospero, J.M.; Gill, T.E.; Hsu, N.C.; Zhao, M. Global-scale attribution of anthropogenic and natural dust sources and their emission rates based on MODIS Deep Blue aerosol products. Rev. Geophys. 2010, 50, 10875–10893. [Google Scholar] [CrossRef]
- Viana, M.; Querol, X.; Alastuey, A.; Cuevas, E.; Rodríguez, S. Influence of African dust on the levels of atmospheric particulates in the Canary Islands air quality network. Atmos. Environ. 2002, 36, 5861–5875. [Google Scholar] [CrossRef]
- Giannadaki, D.; Pozzer, A.; Lelieveld, J. Modeled global effects of airborne desert dust on air quality and premature mortality. Atmos. Chem. Phys. 2014, 14, 957–968. [Google Scholar] [CrossRef]
- Lelieveld, J.; Evans, J.; Fnais, M.; Giannadaki, D.; Pozzer, A. The contribution of outdoor air pollution sources to premature mortality on a global scale. Nature 2015, 525, 367–371. [Google Scholar] [CrossRef]
- Perez, L.; Tobias, A.; Querol, X.; Kunzli, N.; Pey, J.; Alastuey, A.; Viana, M.; Valero, N.; González-Cabré, M.; Sunyer, J. Coarse particles from Saharan dust and daily mortality. Epidemiology 2008, 19, 800–807. [Google Scholar] [CrossRef]
- Tobías, A.; Pérez, L.; Díaz, J.; Linares, C.; Pey, J.; Alastruey, A.; Querol, X. Short-term effects of particulate matter on total mortality during Saharan dust outbreaks: A case-crossover analysis in Madrid (Spain). Sci. Total Environ. 2011, 412-413, 386–389. [Google Scholar] [CrossRef]
- Stafoggia, M.; Zauli-Sajani, S.; Pey, J.; Samoli, E.; Alessandrini, E.; Basagaña, X.; Cernigliaro, A.; Chiusolo, M.; Demaria, M.; Díaz, J.; et al. Desert dust outbreaks in Southern Europe: Contribution to daily PM10 concentrations and short-term associations with mortality and hospital admissions. Environ. Health Perspect. 2016, 124, 413–419. [Google Scholar] [CrossRef]
- Zhang, X.; Zhao, L.; Tong, D.; Wu, G.; Dan, M.; Teng, B. A Systematic Review of Global Desert Dust and Associated Human Health Effects. Atmosphere 2016, 7, 158. [Google Scholar] [CrossRef]
- Domínguez-Rodríguez, A.; Baez-Ferrer, N.; Rodríguez, S.; Abreu-González, P.; Harmand, M.G.C.; Amarnani-Amarnani, V.; Cuevas, E.; Consuegra-Sánchez, L.; Alonso-Pérez, S.; Avanzas, P.; et al. Impact of exposure of emergency patients with acute heart failure to atmospheric Saharan desert dust. Emergencias 2019, 31, 161–166. [Google Scholar] [PubMed]
- López-Villarrubia, E.; Iñiguez, C.; Costa, O.; Ballester, F. Acute effects of urban air pollution on respiratory emergency hospital admissions in the Canary Islands. Air Qual. Atmos. Health 2016, 9, 713–722. [Google Scholar] [CrossRef]
- Castillo, S.; Alastuey, A.; Cuevas, E.; Querol, X.; Avila, A. Quantifying Dry and Wet Deposition Fluxes in Two Regions of Contrasting African Influence: The NE Iberian Peninsula and the Canary Islands. Atmosphere 2017, 8, 305–315. [Google Scholar] [CrossRef]
- Rodríguez, S.; Alastuey, A.; Alonso-Pérez, S.; Querol, X.; Cuevas, E.; Abreu-Afonso, J.; Viana, M.; Pérez, N.; Pandolfi, M.; de la Rosa, J. Transport of desert dust mixed with North African industrial pollutants in the subtropical Saharan Air Layer. Atmos. Chem. Phys. 2011, 11, 6663–6685. [Google Scholar] [CrossRef]
- Pérez, L.; Tobías, A.; Pey, J.; Pérez, N.; Alastuey, A.; Sunyer, J.; Querol, X. Effects of local and Saharan particles on cardiovascular disease mortality. Epidemiology 2012, 23, 768–769. [Google Scholar] [CrossRef]
- Pandolfi, M.; Tobias, A.; Alastuey, A.; Sunyer, J.; Schwartz, J.; Lorente, J.; Pey, J.; Querol, X. Effect of atmospheric mixing layer depth variations on urban air quality and daily mortality during Saharan dust outbreaks. Sci. Total Environ. 2014, 494-495, 283–289. [Google Scholar] [CrossRef]
- Salvador, P.; Molero, F.; Fernandez, A.J.; Tobías, A.; Pandolfi, M.; Gómez-Moreno, F.J.; Barreiro, M.; Pérez, N.; Marco, I.M.; Revuelta, M.A.; et al. Synergistic effect of the occurrence of African dust outbreaks on atmospheric pollutant levels in the Madrid metropolitan area. Atmos. Res. 2019, 226, 208–218. [Google Scholar] [CrossRef]
- Nie, W.; Ding, A.; Wang, T.; Kerminen, V.M.; George, C.; Xue, L.; Wang, W.; Zhang, Q.; Petäjä, T.; Qi1, X.; et al. Polluted dust promotes new particle formation and growth. Sci. Rep. 2014, 4, 6634. [Google Scholar] [CrossRef]
- Fernández-Camacho, R.; de la Rosa, J.; Sánchez de la Campa, A. Trends and sources vs air mass origins in a major city in South-western Europe: Implications for air quality management. Sci. Total Environ. 2016, 553, 305–315. [Google Scholar] [CrossRef]
- de Longueville, F.; Ozer, P.; Doumbia, S.; Henry, S. Desert dust impacts on human health: An alarming worldwide reality and a need for studies in West Africa. Int. J. Biometeorol. 2013, 57, 1–19. [Google Scholar] [CrossRef] [PubMed]
- Prospero, J.M.; Glaccum, R.A.; Nees, R.T. Atmospheric transport of soil dust from Africa to South America. Nature 1981, 289, 570–572. [Google Scholar] [CrossRef]
- Wong, S.; Dessler, A.E.; Mahowald, N.M.; Yang, P.; Feng, Q. Maintenance of Lower Tropospheric Temperature Inversion in the Saharan Air Layer by Dust and Dry Anomaly. J. Clim. 2009, 22, 5149–5162. [Google Scholar] [CrossRef]
- Tsamalis, C.; Chédin, A.; Pelon, J.; Capelle, V. The seasonal vertical distribution of the Saharan Air Layer and its modulation by the wind. Atmos. Chem. Phys. 2013, 13, 11235–11257. [Google Scholar] [CrossRef]
- Ravelo-Pérez, L.; Rodríguez, S.; Galindo, L.; García, M.; Alastuey, A.; López-Solano, J. Soluble iron dust export in the high altitude Saharan Air Layer. Atmos. Environ. 2016, 133, 49–59. [Google Scholar] [CrossRef]
- Alonso-Pérez, S.; Cuevas, E.; Querol, X.; Guerra, J.; Pérez, C. African dust source regions for observed dust outbreaks over the subtropical Eastern North Atlantic region, above 25∘ N. J. Arid Environ. 2012, 78, 100–109. [Google Scholar] [CrossRef]
- Cuevas, E.; Camino, C.; Benedetti, A.; Basart, S.; Terradellas, E.; Baldasano, J.M.; Morcrette, J.J.; Marticorena, B.; Goloub, P.; Mortier, A.; et al. The MACC-II 2007-2008 reanalysis: Atmospheric dust evaluation and characterization over northern Africa and the Middle East. Atmos. Chem. Phys. 2015, 15, 3991–4024. [Google Scholar] [CrossRef]
- Rodríguez, S.; Cuevas, E.; Prospero, J.M.; Alastuey, A.; Querol, X.; López-Solano, J.; García, M.I.; Alonso-Pérez, S. Modulation of Saharan dust export by the North African dipole. Atmos. Chem. Phys. 2015, 15, 7471–7486. [Google Scholar] [CrossRef]
- Alonso-Pérez, S.; Cuevas, E.; Querol, E.; Viana, M.; Guerra, J. Impact of the Saharan dust outbreaks on the ambient levels of total suspended particles (TSP) in the Marine Boundary Layer (MBL) of the Subtropical Eastern North Atlantic Ocean. Atmos. Environ. 2007, 41/40, 9468–9480. [Google Scholar] [CrossRef]
- Milford, C.; Marrero, C.; Martin, C.; Bustos, J.; Querol, X. Forecasting the air pollution episode potential in the Canary Islands. Adv. Sci. Res. 2008, 2, 21–26. [Google Scholar] [CrossRef]
- González, Y.; Rodríguez, S. A comparative study on the ultrafine particle episodes induced by vehicle exhaust, a crude oil refinery and ship emissions. Atmos. Res. 2013, 120-121, 43–54. [Google Scholar] [CrossRef]
- Baldasano, J.M.; Soret, A.; Guevara, M.; Martínez, F.; Gassó, S. Integrated assessment of air pollution using observations and modelling in Santa Cruz de Tenerife (Canary Islands). Sci. Total Environ. 2014, 473–474, 576–588. [Google Scholar] [CrossRef] [PubMed]
- Carrillo, J.; Guerra, J.C.; Cuevas, E.; Barrancos, J. Characterization of the Marine Boundary Layer and the Trade-Wind Inversion over the Sub-tropical North Atlantic. Bound.-Layer Meteorol. 2016, 158, 311–330. [Google Scholar] [CrossRef]
- EC. Directive 2008/50/EC of the European Parliament and of the Council of 21 May 2008 on ambient air quality and cleaner air for Europe. Off. J. Eur. Union L 2008, 152, 1–44. [Google Scholar]
- Rodríguez, S.; Cuevas, E.; González, Y.; Ramos, R.; Romero, P.; Pérez, N.; Querol, X.; Alastuey, A. Influence of sea breeze circulation and road traffic emissions on the relationship between particle number, black carbon, PM1, PM2.5 and PM2.5-10 concentrations in a coastal city. Atmos. Environ. 2008, 42, 6523–6534. [Google Scholar] [CrossRef]
- ECMWF. Diagnostic Boundary Layer Height, in IFS Documentation Cy45r1, Part IV: Physical Processes; European Center for Medium-Range Weather Forecasting: Reading, UK, 2018. [Google Scholar]
- Seidel, D.; Zhang, Y.; Beljaars, A.; Golaz, J.; Medeiros, B. Climatology of the planetary boundary layer over continental United States and Europe. J. Geophys. Res. 2012, 117, D17106. [Google Scholar] [CrossRef]
- Lavers, D.A.; Beljaars, A.; Richardson, D.S.; Rodwell, M.; Pappenberger, F. A forecast evaluation of planetary boundary layer height over the ocean. J. Geophys. Res. Atmos. 2019, 124. [Google Scholar] [CrossRef]
- MAPAMA. Episodios Naturales de Partículas 2017; Ministerio de Agricultura, Alimentación y Medio Ambiente: Madrid, Spain, 2018. [Google Scholar]
- European Commission (EC). Commission Staff Working Paper, Establishing Guidelines for Demonstration and Subtraction of Exceedances Attributable to Natural Sources under the Directive 2008/50/EC on Ambient Air Quality and Cleaner Air for Europe; EC: Brussels, Belgium, 2011. [Google Scholar]
- Escudero, M.; Querol, X.; Pey, J.; Alastuey, A.; Pérez, N.; Ferreira, F.; Alonso, S.; Rodríguez, S.; Cuevas, E. A methodology for the quantification of the net African dust load in air quality monitoring networks. Atmos. Environ. 2007, 41, 5516–5524. [Google Scholar] [CrossRef]
- Querol, X.; Alastuey, A.; Pey, J.; Escudero, M.; Castillo, S.; Gonzalez, A.; Pallarés, M.; Jiménez, S.; Cristóbal, A.; Ferreira, F.; et al. Spain and Portugal Methodology for the Identification of Natural African Dust Episodes in PM10 and PM2,5, and Justification with Regards to the Exceedances of the PM10 Daily Limit Value (2006) Modified Version from November 2009; Ministerio de MedioAmbiente, y Medio Rural y Marino–Spain: Madrid, Spain, 2006. [Google Scholar]
- Viana, M.; Salvador, P.; Artíñano, B.; Querol, X.; Alastuey, A.; Pey, J.; Latz, A.; Cabañas, M.; Moreno, T.; García, S.; et al. Assessing the performance of methods to detect and quantify African dust in airborne particulates. Environ. Sci. Technol. 2010, 44, 8814–8820. [Google Scholar] [CrossRef]
- Alastuey, A.; Querol, X.; Castillo, S.; Escudero, M.; Avila, A.; Cuevas, E.; Torres, C.; Romero, P.; Exposito, F.; Garcia, O.; et al. Characterisation of TSP and PM2.5 at Izana and Sta. Cruz de Tenerife (Canary Islands, Spain) during a Saharan Dust Episode (July 2002). Atmos. Environ. 2005, 39, 4715–4728. [Google Scholar] [CrossRef]
- Rodríguez, S.; Torres, C.; Guerra, J.C.; Cuevas, E. Transport pathways of ozone to marine and free-troposphere sites in Tenerife, Canary Islands. Atmos. Environ. 2004, 38, 4733–4747. [Google Scholar] [CrossRef]
- Cuevas, E.; González, Y.; Rodríguez, S.; Guerra, J.C.; Gómez-Peláez, A.J.; Alonso-Pérez, S.; Bustos, J.; Milford, C. Assessment of atmospheric processes driving ozone variations in the subtropical North Atlantic free troposphere. Atmos. Chem. Phys. 2013, 13, 1973–1998. [Google Scholar] [CrossRef]
- Andrey, J.; Cuevas, E.; Parrondo, M.; Alonso-Pérez, S.; Redondas, A.; Gil-Ojeda, M. Quantification of ozone reductions within the Saharan air layer through a 13-year climatologic analysis of ozone profiles. Atmos. Environ. 2014, 84, 28–34. [Google Scholar] [CrossRef]
- González, Y.; Schneider, M.; Dyroff, C.; Rodríguez, S.; Christner, E.; García, O.E.; Cuevas, E.; Bustos, J.J.; Ramos, R.; Guirado-Fuentes, C.; et al. Detecting moisture transport pathways to the subtropical North Atlantic free troposphere using paired H2O-δD in situ measurements. Atmos. Chem. Phys. 2016, 16, 4251–4269. [Google Scholar] [CrossRef]
- Pérez, L.; Künzli, N. Saharan dust: No reason to exempt from science or policy. Occup. Environ. Med. 2011, 68, 389–390. [Google Scholar] [CrossRef]
© 2019 by the authors. Licensee MDPI, Basel, Switzerland. This article is an open access article distributed under the terms and conditions of the Creative Commons Attribution (CC BY) license (http://creativecommons.org/licenses/by/4.0/).