Article

Stepwise Assessment of Different Saltation Theories in Comparison with Field Observation Data

Department of Environmental Engineering, Sunchon National University, Suncheon 57922, Korea
*
Author to whom correspondence should be addressed.
Atmosphere 2020, 11(1), 10; https://doi.org/10.3390/atmos11010010
Submission received: 8 November 2019 / Revised: 11 December 2019 / Accepted: 17 December 2019 / Published: 20 December 2019
(This article belongs to the Special Issue Recent Advances of Air Pollution Studies in South Korea)

Abstract

:
Wind-blown dust models use input data, including soil conditions and meteorology, to interpret the multi-step wind erosion process and predict the quantity of dust emission. Therefore, the accuracy of the wind-blown dust models is dependent on the accuracy of each input condition and the robustness of the model schemes for each elemental step of wind erosion. A thorough evaluation of a wind-blown model thus requires validation of the input conditions and the elemental model schemes. However, most model evaluations and intercomparisons have focused on the final output of the models, i.e., the vertical dust emission. Recently, a delicate set of measurement data for saltation flux and friction velocity was reported from the Japan-Australia Dust Experiment (JADE) Project, which enabled the step-by-step evaluation of wind-blown dust models up to the saltation step. When all the input parameters were provided from the observations, both the two widely used saltation schemes showed very good agreement with measurements, with the correlation coefficient and the agreement of index both being larger than 0.9, which demonstrated the strong robustness of the physical schemes for saltation. However, using the meteorology model to estimate the input conditions such as weather and soil conditions, considerably degraded the models’ performance. The critical reason for the model failure was determined to be the inaccuracy in the estimation of the threshold friction velocity (representing soil condition), followed by inaccurate estimation of surface wind speed. It was not possible to determine which of the two saltation schemes was superior, based on the present study results. Such differentiation will require further evaluation studies using more measurements of saltation flux and vertical dust emissions.

1. Introduction

Asian dust, which refers to the wind-blown soil dust particles emitted from arid regions in North China and Mongolia and transported eastward on the prevailing westerlies [1], influences the air quality of North-East Asian countries [2,3,4]. In particular, the frequency of the outbreak of Asian dust storms in winter significantly increased in the 2000s. Although the frequency and intensity of the winter season Asian dust storms remain lower than those of spring [5], they are often accompanied by other toxic air pollutants emitted from residential heating and hence can be a considerable threat to public health [6]. In order to predict the dust storms and prepare countermeasures, a well-designed numerical wind-blown dust model, which simulates the wind erosion phenomenon to predict the wind-blown dust emission in arid regions, is required [7].
In wind-blown dust models, dust emission is calculated through a series of sequential steps to interpret the wind erosion. Therefore, the accuracy of a wind-blown dust model depends on the robustness of the schemes used for the elemental steps [8]. The first step of wind erosion interpretation is the determination of the vulnerability of the surface of potential dust source regions to wind erosion [9], based on the soil characteristics, including land-use type and soil texture [10]. In this step, the drag partitioning effect due to nonerodible elements [11,12,13] and the soil moisture effect [14] are also calculated. By combining this information, the threshold friction velocity, which quantifies the minimum wind speed to trigger the wind erosion, is determined as the final output of the first step [15]. When the actual friction velocity exceeds the threshold friction velocity, saltation (horizontal leapfrogging movement of soil grains) takes place [16,17]. When the leaping soil grains return to the ground, they release fine dust particles attached to them or are broken into pieces, resulting in the vertical emission of dust particles, which is called sandblasting [18,19]. These steps have been interpreted in various different ways in several modeling studies [20].
Several studies on wind-blown dust in East Asia have been reported. Kang et al. [21] compared the performances of three vertical dust flux schemes suggested by Marticorena and Bergametti [17] and Lu and Shao [22] for an intense dust storm episode that broke out in the Gobi desert in winter. Reportedly, all three schemes overpredicted the dust emission owing to the inaccuracies in input meteorology and soil conditions, while the scheme of Lu and Shao predicted the smallest amount of dust emission. The model overprediction was reduced when the soil conditions were modified using observed values.
The predictions of eight different wind-blown dust models consisting of different element schemes, COAMPS [23], ADAM [24,25], NARCM [26], DREAM [27], CEMSYS5 [28,29,30], CFORS [31], NAAPS [32], and MASINGAR [33], were compared with the observations produced in the Aeolian Dust Experiment on Climate impact (ADEC) project, conducted for the main dust source regions in East Asia, to evaluate their performances [20]. The dust emissions estimated by different models differed by a factor of 2~4. It was suggested that the accuracy of the model prediction depended mainly on the accuracy of meteorology and soil/surface information available in the dust source regions [34].
Darmenova et al. [10] incorporated two physics-based wind-blown dust emission schemes, Shao’s and Marticorena’s, that consisted of different elemental schemes for the soil moisture effect, threshold friction velocity, saltation flux, and vertical dust flux, into the wind-blown dust model for the Weather Research and Forecasting (WRF) model, WRF-DuMo [35]. They evaluated the two schemes at each elemental step for the interpretation of wind erosion in Central and East Asia. Although two different elemental schemes for the saltation flux, those of White [36] and Owen [37], were compared, the effects of the difference in the methodology of the saltation flux scheme could not be evaluated because different threshold friction velocities, drag partitioning effects, and soil moisture effects were applied for the two schemes.
Despite these numerous modeling studies on the wind-blown dust emission in North-East Asia, each elemental scheme has mostly been evaluated only for the quantity of vertical dust emission owing to the absence of observation at each elemental step [4,38]. For instance, the estimation of saltation flux, which is a key component of the dust emission models, has hardly been validated directly.
Recently, one-minute data for the friction velocity and saltation flux obtained during the Japan-Australia Dust Experiment (JADE) project conducted in the Australian dust source regions in 2006 were reported to the public [39]. The land-use type of observation site was barren land, with the soil texture classified as sandy loam or loamy sand, and the roughness length was reported to be 0.48 mm [40]. These soil conditions of the observation site were seemingly similar to those of the Gobi desert, a representative wind-blown dust source region in North-East Asia. The land-use type of the Gobi desert was mostly classified as barren land and shrubland and the soils consisted of sandy loam, loam, and sandy clay loam [41]. Laurent et al. [42] reported that 70% of the Gobi desert had a roughness length range of 0.15 to 1 mm, while the rest had a range of 1 to 5 mm. Therefore, in this study, we evaluated the existing saltation schemes step-by-step by accounting for land-use condition, soil moisture effect, drag partitioning effects, threshold friction velocity, and saltation flux in comparison with observation data.
The next section provides the information of observation data and a detailed explanation of the elemental steps composing wind-blown dust models. In Section 3, different saltation flux schemes are evaluated by comparing their predictions with observations. The conclusions are presented in Section 4.

2. Data and Method

2.1. Observational Data

The observational data provided by the JADE project (Ishizuka et al. 2018) were used for the model evaluation in this study. Observations were conducted in Australia (33° 50′ 42.4″ S, 142° 44′ 9.0″ E) from 23 February to 14 March 2006. The 1-min raw data for the friction velocity and saltation flux are available to the public, as shown in Figure 1. The information on the parameters such as soil properties and the roughness length required for the model evaluation were obtained from the literature: Shao et al. [43], Ishizuka et al. [44,45], and Liu et al. [40]. More detailed information is provided in Section 3.
The model-predicted friction velocities and saltation fluxes were compared with the observation in this study to evaluate the wind-blown dust models. For this purpose, 4 distinct periods when sufficient saltation fluxes for model validation were observed, during the JADE project—Julian days 56~57, 61~62, 65, and 71—were designated as Dust Events 1, 2, 3, and 4, respectively (Figure 1).

2.2. Wind-Blown Dust Model

2.2.1. Domain and Configuration of Meteorological Model

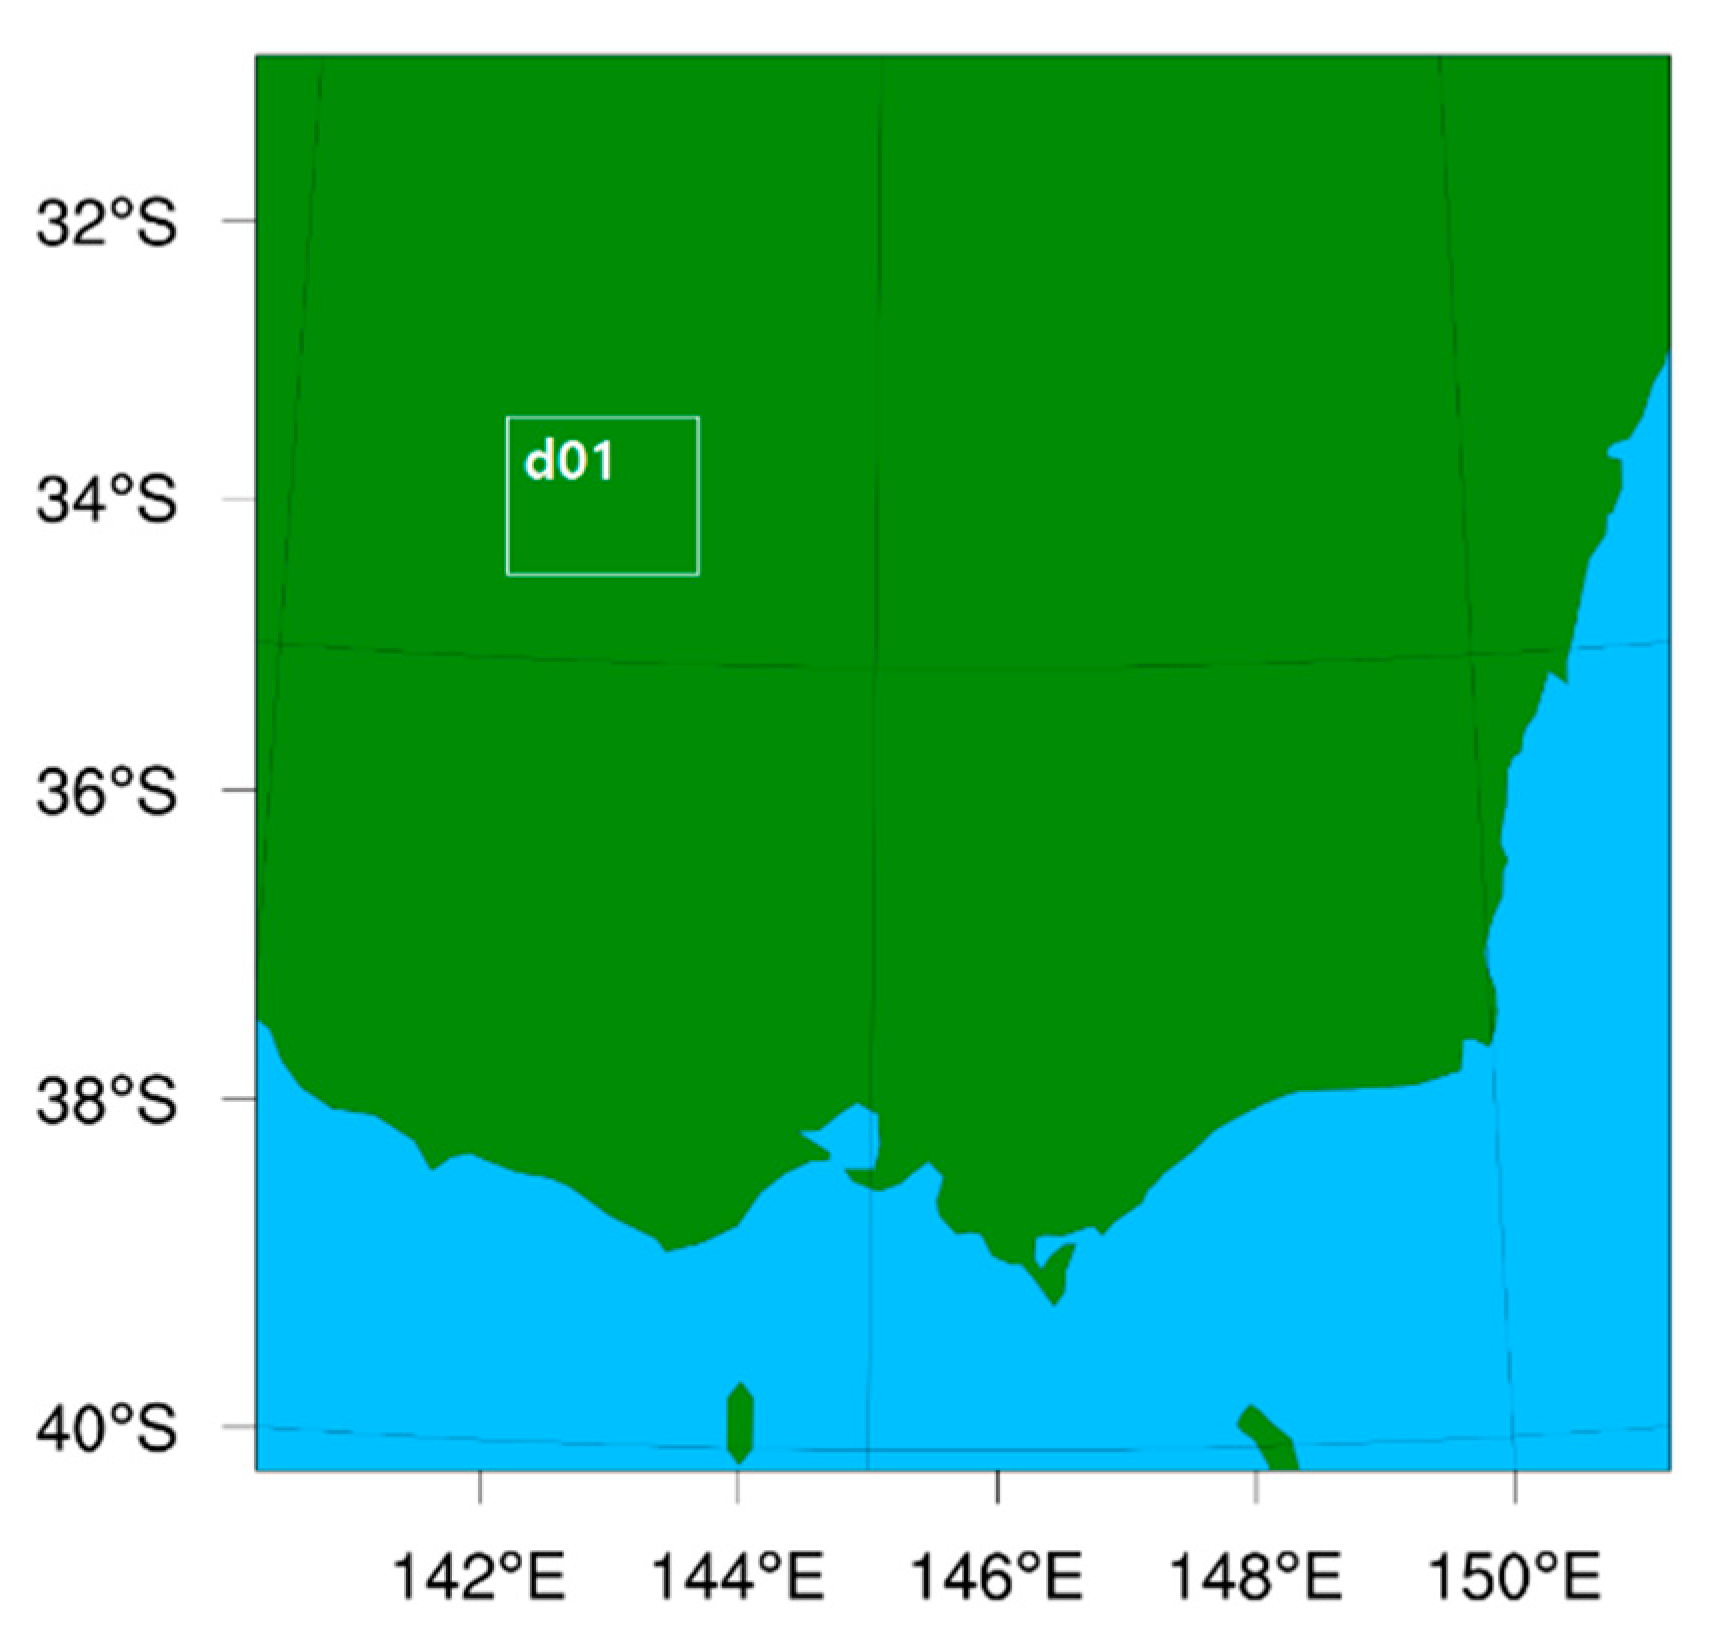
Meteorological fields required for the dust emission simulation were obtained by running the meteorology model WRF v3.8.1. The horizontal resolution of the meteorological model was set to 5 km × 5 km because, according to Liu et al. [40], the size of the observation site was about 4 km from north to south and about 1 km from east to west. The NCEP FNL (final analysis) data were used. The simulation was conducted from 15 February to 16 March 2006, thus that the whole observation period was included. Table 1 shows the summarized information of model attributes set for the WRF running. Figure 2 shows the meteorological model domain.

2.2.2. Friction Velocity

Friction velocity ( u * ) can be determined by using Equation (1):
u * = k u ( Z ) ln ( Z / z 0 )
where k (=0.4) is the von Karman constant, u ( Z ) the wind speed at height Z from the surface in the planetary boundary layer at which a logarithmic wind profile can be applied, and z 0 the roughness length due to the nonerodible elements present on the surface. The value of z 0 varies depending on the vegetation fraction and the distribution of obstacles [46]. Therefore, reliable information on surface conditions is essential for accurate estimation of the friction velocity. In this study, the effects of land-use and vegetation fraction on the roughness length and the resulting friction velocity were investigated by comparing the model-predicted friction velocity with observed values.

2.2.3. Roughness Length

The surface roughness length, which was an important parameter to determine the friction velocity, was widely used to determine the exchange of heat, momentum, and water between the surface and atmosphere and the characteristics of the planetary boundary layer [12]. Marticorena et al. [47] and Hebrard et al. [48] assumed that the roughness length ( z 0 ) was proportional to the physical height of obstacles ( h ) when the total roughness density ( λ ) was larger than the threshold value of 0.045. Shao and Yang [13] argued that 0.045 was too small for North-East Asia with various land types such as dense tall vegetation and sparse short vegetation, and suggested a new value of 0.2.
Recently, Foroutan et al. [49] suggested Equation (2) for the roughness length based on the data reported in previous studies of Shao and Yang [13] and King et al. [50]:
z 0 / h   =   { 0.96   λ 1.07 ,       λ < 0.2 0.083 λ 0.46 ,       λ   0.2
where the roughness length decreases with increasing λ when λ is larger than the threshold value 0.2 suggested by Shao and Yang [13]. This modification was made to take into account the observation that the disturbance of wind by highly dense roughness elements was weaker than that by roughness elements with an intermediate level of density [13,49].
Equation (2) was used for the determination of the friction velocity in this study. In order to examine whether the model accounts for the surface properties at the observation site properly, the land-use and vegetation fraction used in the model were compared with field observations, and their effects on the roughness length were investigated.

2.2.4. Threshold Friction Velocity of Dry Bare Soil

The threshold friction velocity ( u t * ) represents the minimum wind speed for the mobilization of soil grains. Its value for dry bare soil can be calculated by considering the balance among the wind drag, gravity, and interparticle cohesion [15]. Then the effects of soil moisture and roughness elements (drag partitioning) that increase the value of u t * are taken into account.
Most wind-blown dust models adopt Equation (3) [15] or Equation (4) [17]:
u t * ( D s ) = 0.0123 ( g D s ρ p ρ a + γ ρ a D s )
u t * ( D s ) = { 0.129 K 1.928 B 0.092 1 for     0.03 < B 10 0.129 K [ 1 0.0858 exp { 0.0617 ( B 10 ) } ] for     B > 10
where γ = 1.65 × 10 4 kg s−2, g is gravitational acceleration, D s the soil grain diameter, ρ p the density of soil particles, ρ a the air density, K = ρ p g D s ρ a ( 1 + 0.006   g   cm 0.5   s 2 ρ p g D s 2.5 ) , a = 1331   cm 1.56 , and B   ( = a D s 1.56 + 0.38 ) an approximate soil grain Reynolds number [51,52,53]. Equation (3) is used in the dust model of Community Multiscale Air Quality modeling system (CMAQ) [49] and the Sunchon National University (SCNU) dust model [52], whereas Equation (4) is used in Kok’s dust model [54,55] and the NMMB/BSC-Dust model [56]. In this study, both Equations (3) and (4) combining the effects of drag partitioning and soil moisture are evaluated by comparing with the measured threshold friction velocity during the JADE project [40].

2.2.5. Drag Partitioning Effect

The drag partitioning effect factor ( f R ) accounts for the reduction in the influence of wind on soil grains due to the physical obstacles existing on surface [41]. When drag partitioning takes place, a stronger wind is required to mobilize soil grains, which leads to a larger value of the threshold friction velocity. The WRF-DuMo and the CMAQ dust model use the drag partitioning effect factor suggested recently by Darmenova et al. (2009), expressed by Equation (5), which was a modification of the original suggestion of Raupach et al. (1993) by separating the effects of vegetation and solid (nonvegetation) elements:
f R = ( 1 σ v m v λ v ) ( 1 + β v m v λ v ) ( 1 σ B m B λ B 1 A v ) ( 1 + β B m B λ B 1 A v )
where the subscripts v and B represent vegetation and nonvegetation, respectively, and A v is the vegetation fraction. The “VEG” value simulated by WRF was used as A v . λ v ( = C λ ln ( 1 A v ) ) is the roughness density of the vegetated surface with vegetation, C λ the coefficient indicating the direction and distribution of roughness elements, and λ B the roughness density of the non-vegetated surface. According to the measurement of Marticorena et al. (2006), λ B varies in the range of 0.01~0.16. Xi and Sokolik [41] suggested different λ B values corresponding to the land-use condition. The values of the constant parameters are σ v = 1.45 , m v = 0.16 , β v = 202 , σ B = 1.0 , m B = 0.5 , β B = 90 , and C λ = 0.35 [11]. According to Raupach (1992), the value of m lies between 0 and 0.5 for a flat erodible surface and is close to 1 for a geomorphologically stable surface. The observation-based values of σ , m , and β were determined by Wyatt and Nickling [57] using multiple nonlinear regression of observations. Equation (5) was used in this study to calculate the drag partitioning effect factor.

2.2.6. Soil Moisture Effect

The soil moisture effect factor ( f w ) was a key point multiplied to the threshold friction velocity for dry soil to take into account the reduced soil erodibility due to soil moisture [41,58]. Most wind-blown dust models use the formula suggested by Fecan et al. (1999), expressed by
f w ( w ) = {                                     1                                         for   w < w 1 + 1.21 ( w w ) 0.68   for   w w
where w is the soil moisture (kg/kg), w the threshold soil moisture calculated as w =   0.14 ( M c l a y ) 2 + 0.17 ( M c l a y ) , and M c l a y the mass fraction of clay. Equation (6) was used in this study to calculate the soil moisture effect factor.
The soil moisture used in Equation (6) must be the value for the top soil (0~1 cm deep) because the dust emission takes place solely from this top soil. However, most current land-surface models adopted in the meteorology models are using a top layer depth of 10 cm. Usually, the top 10 cm average soil moisture is larger than that of the top 1 cm, and hence its use in a wind-blown dust model may lead to considerable overestimation of the threshold friction velocity and underestimation of dust emission. Three different solutions have been suggested to circumvent this problem:
  • Use the Noah’s land and surface scheme [59,60,61,62] with 10 cm top soil layer to obtain the soil moisture content and multiply it by a modifying factor smaller than 1 [11];
  • Use the Pleim-Xiu scheme [63], whose top soil layer is 1 cm thick [49]; or
  • Modify the soil layer-related pretreatment part of the WRF code to construct a 1 cm top soil layer in Noah’s scheme [58].
In this study, the 2nd and 3rd methods were used to determine the soil moisture effect factor. Two different versions of the Noah’s scheme, the Noah land surface model (LSM) [59,60,61,62] and Noah-MP [64], were used for the 3rd method. The Noah LSM simulates the changes in skin temperature, soil moisture, and snow cover state of the surface based on water and energy balance equations for 4 soil layers. This scheme has been reported to suffer a few problems such as impermeable frozen soil with snow cover and overestimation of runoff [65]. Noah-MP (Noah LSM with Multiple Physics options) is an advanced scheme developed to resolve the problems of the Noah LSM and improve various physics processes such as snow physics and soil hydrology [66]. The Noah-MP scheme also provides multiparameterization options to extend the choice for the vegetation fraction, ground surface albedo, and radiative transfer, depending on local characteristics [67]. However, this advantage may also lead to a disadvantage of having to check the combination of all physical processes to find the optimal combination [68]. The soil moisture effect factors obtained in this way were evaluated by comparing with satellite observation data.

2.2.7. Saltation Flux

Saltation flux ( F h ) refers to the amount of soil grains moving horizontally by frog leaping when the friction velocity exceeds its threshold value. The value of F h depends on the friction velocity and on the variables that affect the threshold friction velocity: soil texture, soil moisture content, vegetation fraction, soil grain size distribution, etc. [15,69,70].
Most saltation schemes adopt the mathematical forms that can be represented by Equation (7):
S a l t a t i o n   f l u x   = { k   u * n ( 1 u t * 2 u * 2 )         u * > u t *                                               0                       u * > u t *                                
According to this formula, the saltation flux increases proportionally to the n th power of the friction velocity when the friction velocity is larger than its threshold value. The parameters k and n can be tuned by comparing the model prediction with the measured saltation flux. In this study, we tried to determine the values of k and n simultaneously by curve-fitting observed saltation data using Equation (7).
The most widely used formula for the saltation flux is that suggested by Kawamura [71] and supported by White (1979):
F h = C   u * 3 ( 1 u t * 2 u * 2 ) ( 1 + u t * u * )
Equation (8) is adopted in the CMAQ dust model [49] and in the SCNU model [52]. When the friction velocity is large enough, Equation (8) can be approximated by Equation (7) with n = 3 .
On the other hand, Kok et al. [72] suggested the following formula using theoretical reasoning and validated it through elaborate field experiments [73]:
F h = C ρ a g   u t * u * 2 ( 1 u t * 2 u * 2 )
Equation (9) corresponds to n = 2 when compared to Equation (7). Both Equations (8) and (9) are evaluated in this study by comparing their predictions with the observed saltation flux.

3. Results and Discussion

3.1. Effect of the Roughness Length on the Friction Velocity

As was explained in the previous section, the friction velocity depends on the roughness length that varies with land-use condition and vegetation fraction. This necessitates checking the land-use type and vegetation fraction provided to the wind-blown dust model.
The gridded land-use type and vegetation fraction are determined in the meteorology model using the 20-category IGBP-Modified MODIS data. Shao et al. [43] reported that the surface of the observation site consisted of 84% bare surface, 1% rock, 1% tree litter, 12% litter, and 2% crust, with little vegetation. The roughness length was reportedly 0.48 mm, which was within the range of the roughness length values reported for East Asian dust source regions 0.00382~0.642 mm [42]. This indicated that the land-use condition and the roughness length of the observation site were similar to those of the Gobi desert.
On the other hand, the land-use type and vegetation fraction determined for the observation site in the model were shrubland and 25.28%, respectively, showing considerable difference from the report of Shao et al. [43]. To assess the effects of the model input for the land-use type and vegetation fraction on the friction velocity, the roughness lengths and friction velocities were calculated under three different conditions and compared with one another. In CASE 1, the model input land-use type and vegetation fraction were used. The land-use type was changed from shrubland to barren land in CASE 2, whereas in CASE 3 the vegetation fraction was also changed to 2% thus that the roughness length became the same as the 0.48 mm reported by Liu et al. [40]. As shown in Table 2 and Figure 3, CASE1 and CASE2 based on the vegetation fraction and/or land-use type that did not correspond with observed surface conditions resulted in the overestimation of the roughness length and the friction velocity. On the other hand, the index of agreement (IOA) was the highest in CASE 3, in which the roughness length was adjusted to the reported value by using more realistic land-use type and vegetation fraction value. Therefore, the accuracy of the vegetation fraction as well as the land-use type was considered to contribute significantly to the prediction accuracy of the wind-blown dust model.

3.2. Drag Partitioning Effect

As is indicated in Equation (5), the drag partitioning effect factor was also dependent on the vegetation fraction and land-use condition. Therefore, the drag partitioning effect factor was calculated under three conditions shown in Table 2: 3.438, 2.074, and 1.110 for CASE 1, CASE 2, and CASE 3, respectively. The validity of these values was discussed in Section 3.4.

3.3. Effect of Land Surface Scheme on Soil Moisture

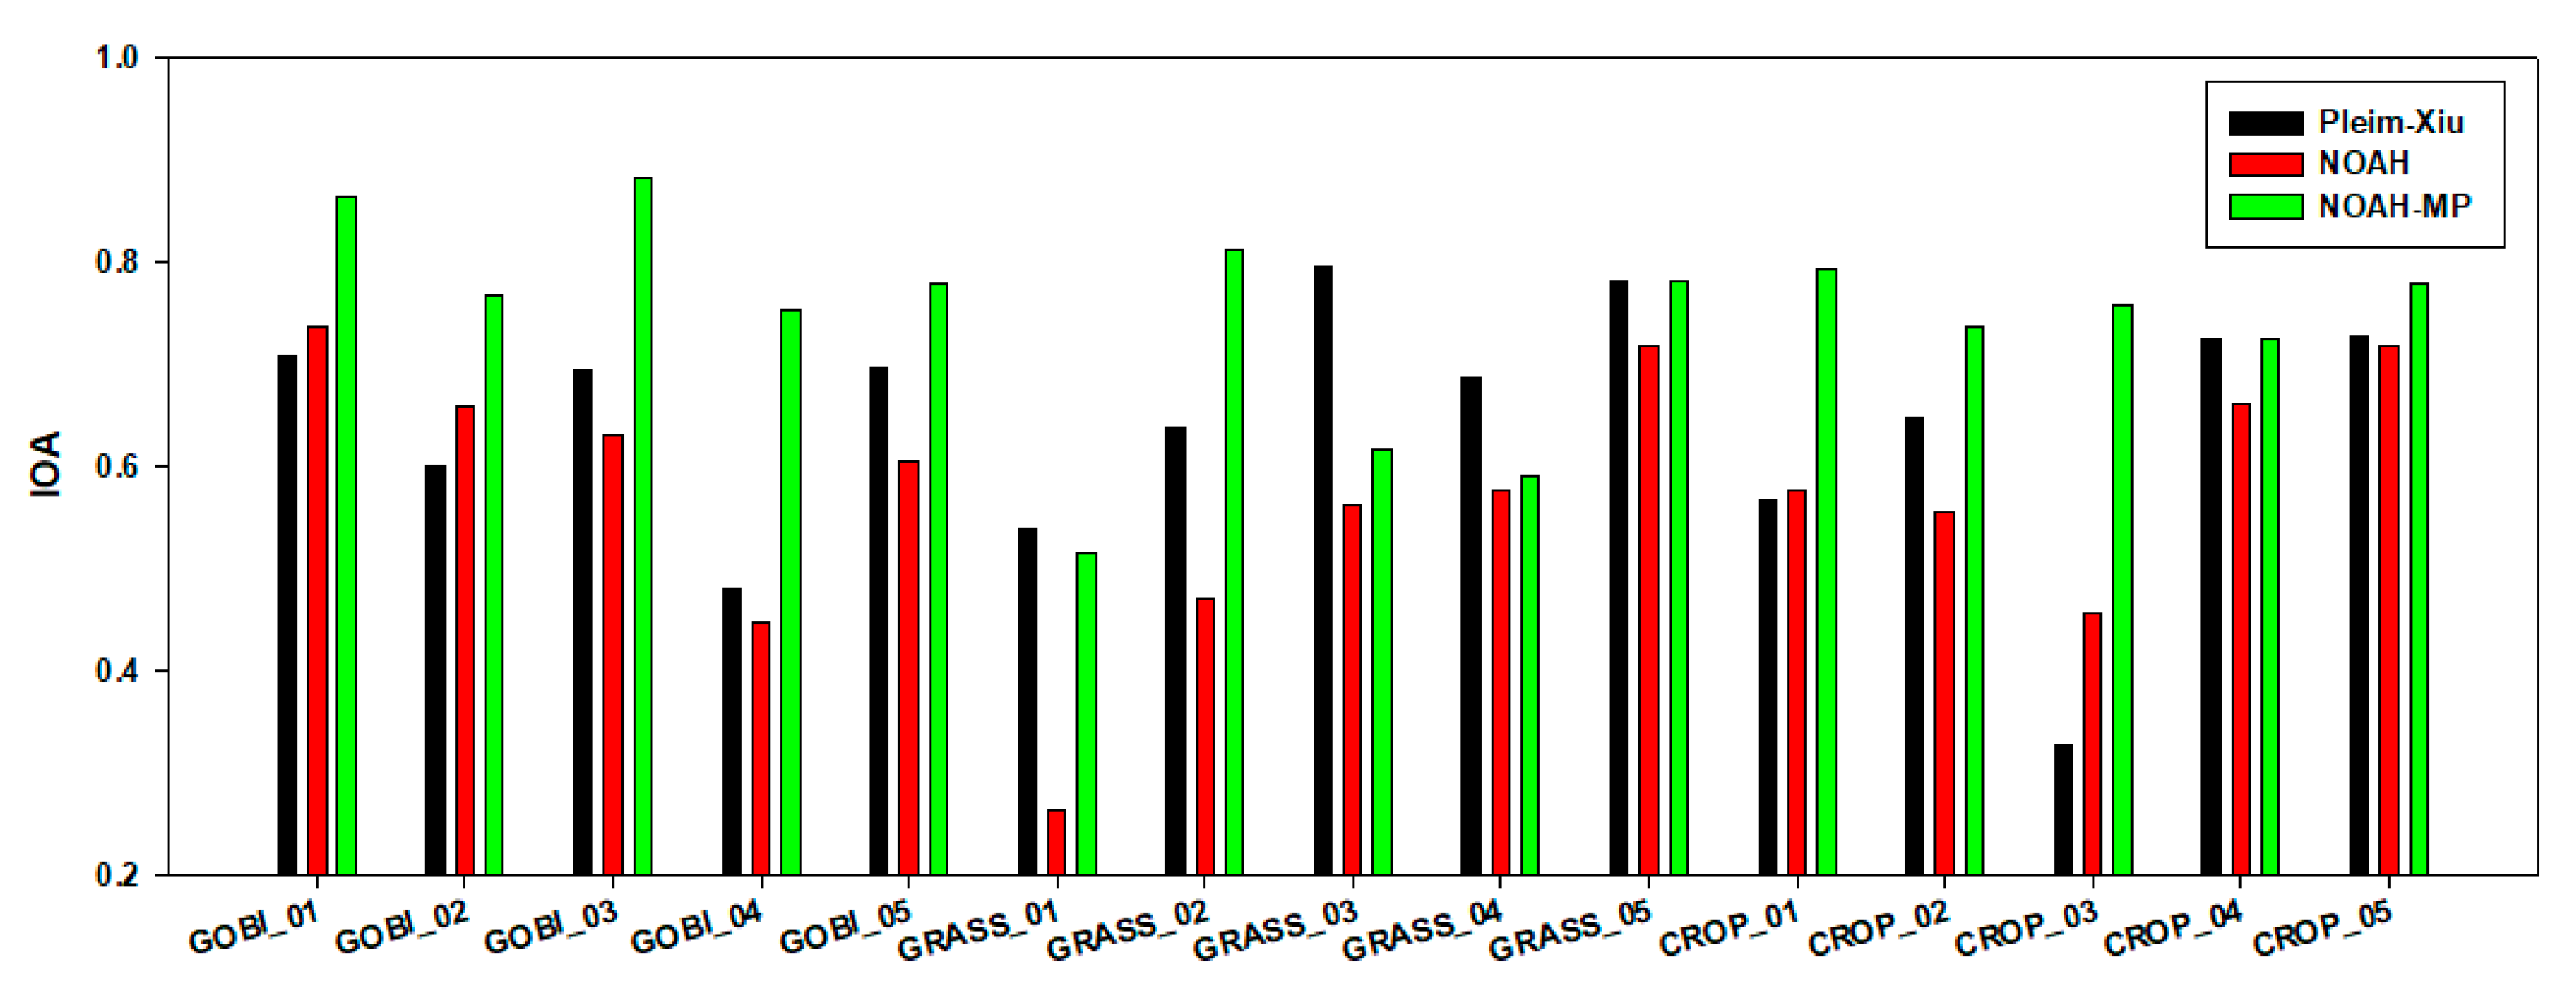
The three land surface schemes introduced in Section 2.2.6 were evaluated by the soil moisture values for 2016 predicted by them with measured values. The SMAP satellite observation data provide the 5-cm top layer soil moisture contents with a temporal resolution of 3 h and a spatial resolution of 9 km × 9 km. The characteristics of the observation dataset and the land surface schemes evaluated are summarized in Table 3. Fifteen points (5 each from the Gobi desert, grassland, and cropland) were chosen arbitrarily from the main wind-blown dust source regions of North-East Asia, as shown in Figure 4. The meteorology model WRF was run with the top soil layer thickness of 5 cm for consistency with observation.
Table 4 shows the results of the model-observation comparison expressed in terms of the correlation coefficient and IOA. The scatterplots are given as Supplemental Information. The Noah-MP scheme showed the best agreement with observation in most regions. However, all three schemes tended to overestimate the soil moisture content on average. Therefore, compensation factors were calculated as the average ratios of observed and model-predicted soil moisture content values, 0.670, 0.769, and 0.745 for Noah, Noah-MP, and Pleim-Xiu scheme, respectively, and they were multiplied to each model-predicted value. Figure 5 shows the results of the comparison of the revised model predictions with observation. The IOA of the Noah-MP scheme remained the highest.
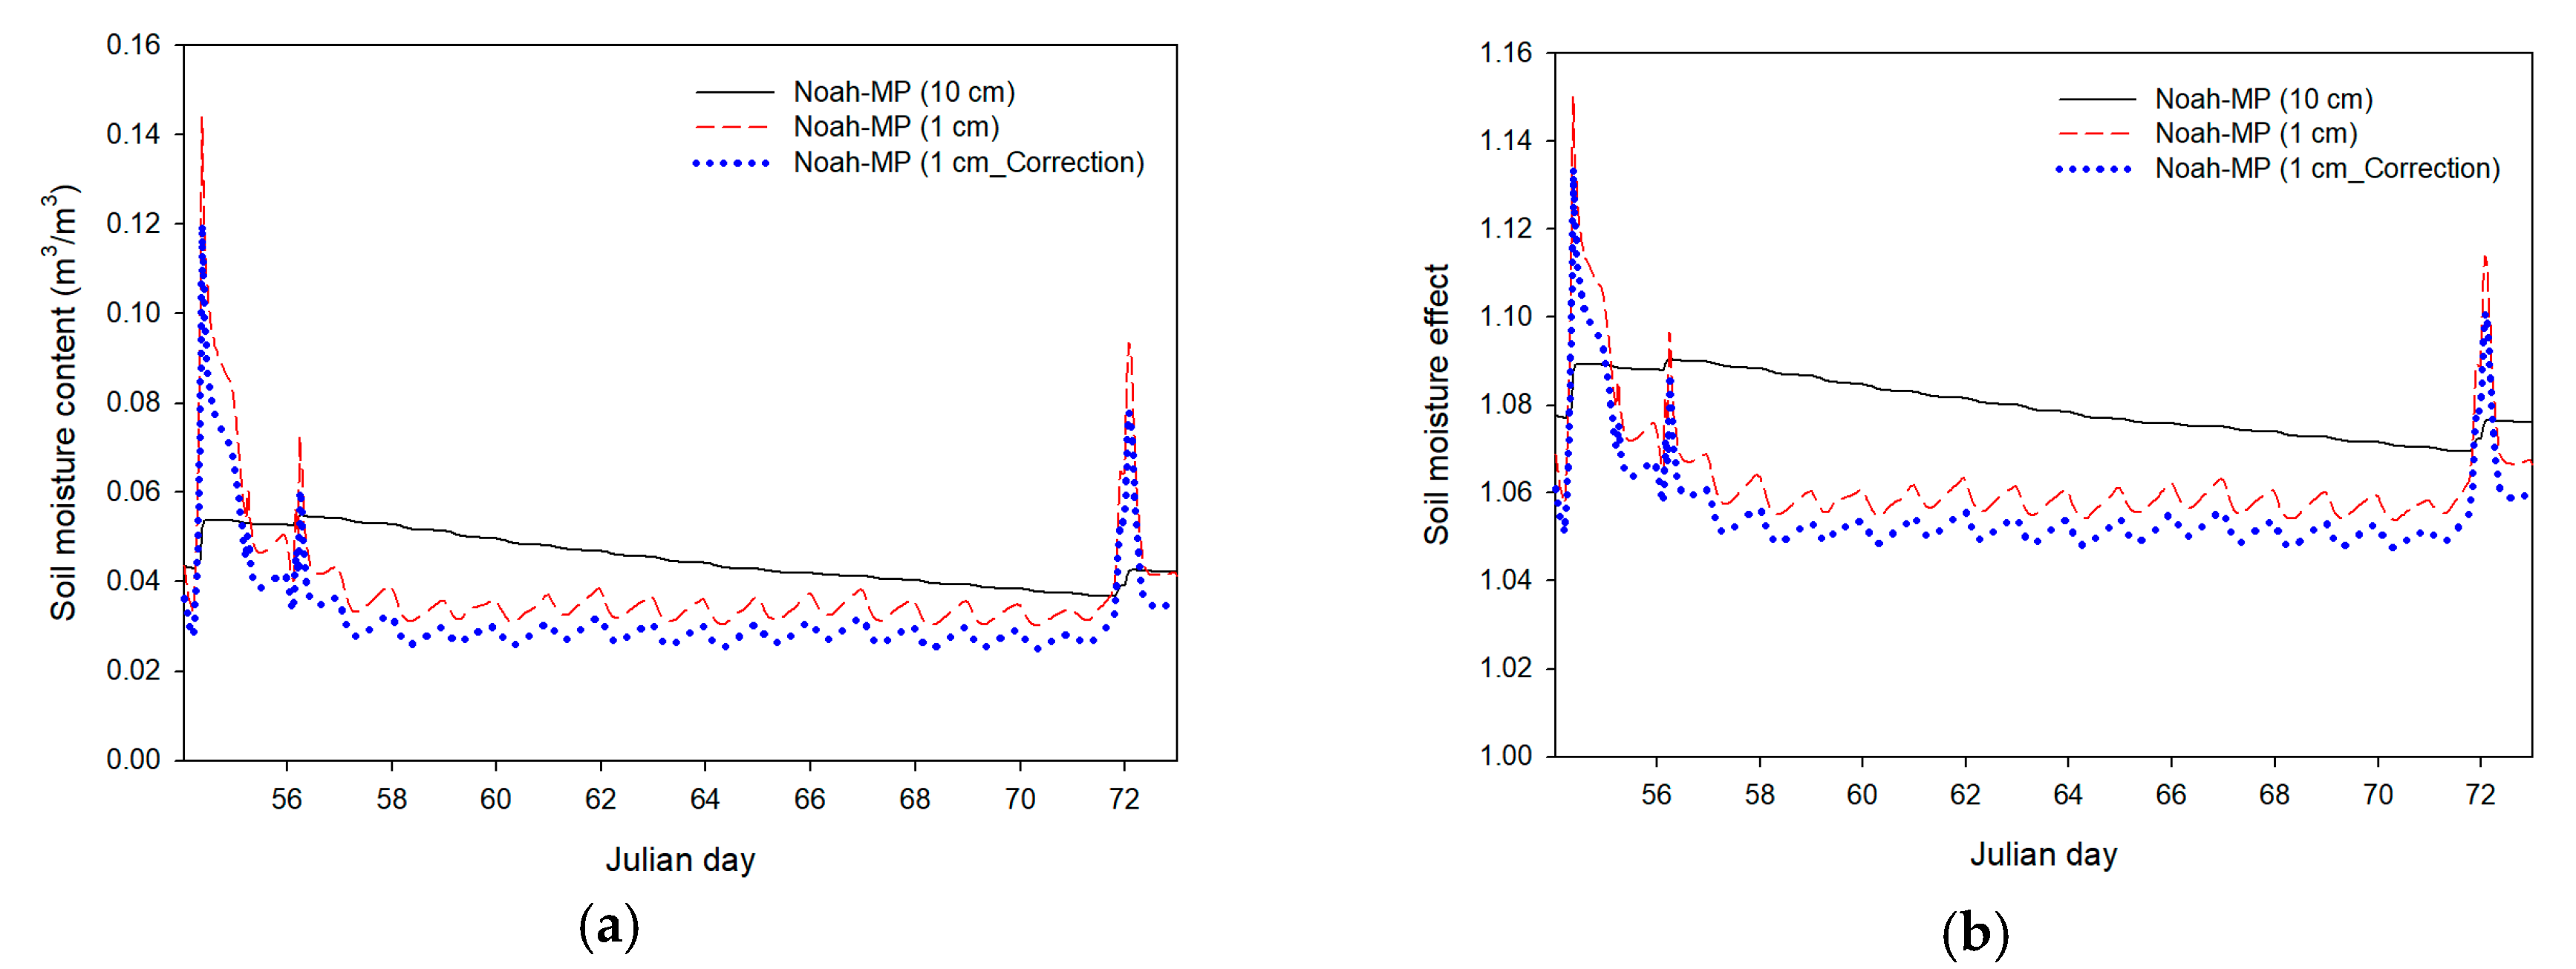
Therefore, the Noah-MP scheme was selected for further validation through the comparison with the soil moisture measurements made in the JADE project. Liu et al. [40] and Shao et al. [43] reported that the soil moisture contents at the soil depth of 0.2~2 cm ranged within 0.02~0.04 m3/m3 during the JADE project. The Noah-MP scheme was run with two different options for the top soil layer depth: 10 cm (conventional value) and 1 cm (modified value by pre-treatment). Figure 6a shows the soil moisture content values with two different top soil layer depths. The third plot shows the values obtained with 1 cm top soil layer depth multiplied by the compensation factor of 1.341. The soil moisture contents obtained with the 10 cm top soil layer depth were larger than those obtained with 1 cm top soil layer depth, except right after precipitation. The average soil moisture contents obtained with the three options were 0.054 m3/m3 (10 cm), 0.039 m3/m3 (1 cm), and 0.032 m3/m3 (1 cm with correction). It was encouraging that the average soil moisture value obtained with the 1 cm top soil layer depth option and the compensation ratio determined based on the observations in the North-East Asian dust source regions was very close to the median value (0.03 m3/m3) of the soil moisture range reported by Liu et al. [40] and Shao et al. [43] for an Australian dust source region. Figure 6b compares the corresponding soil moisture effect factors: 1.079, 1.063, and 1.056 on average for the three options. The effects of these factors on the threshold friction velocity are discussed in Section 3.4.

3.4. Estimation of the Threshold Friction Velocity

The threshold friction velocity of the bare soil was determined, using Equations (3) and (4) independently, to be 0.209 m s−1 and 0.227 m s−1, respectively. These two values differed by less than 10%, which was in agreement with a previous study that reported a small difference in the threshold friction velocities calculated using these two formulas [52]. It was not possible to determine the superiority of one of the two schemes over the other based solely on the predicted threshold friction velocity. Therefore, Equation (3), which was simpler and delivers the physical meaning of the formula more intuitively [52], was chosen for further analysis.
The drag partitioning effect factors calculated in Section 3.2 were multiplied to the threshold friction velocity of bare soil (0.209 m s−1) to determine the threshold friction velocity of dry surface with nonerodible elements: 0.716 m s−1 for CASE 1, 0.434 m s−1 for CASE 2, and 0.231 m s−1 for CASE 3. Liu et al. [40] and Shao et al. [43] reported that the threshold friction velocities determined for Dust Events 2 and 4 were 0.2 m s−1 and 0.28 m s−1, respectively. Therefore, even without taking the soil moisture effect into account, the threshold friction velocity of dry surface determined for CASE 1 or 2 was much larger than the observed values. This comparison further demonstrated the need to use the land-use and vegetation fraction (CASE 3), which can match the measured roughness length.
The soil moisture effect factors determined in Section 3.3 were multiplied to the threshold friction velocity of dry surface (0.231 m/s) to determine the threshold friction velocity of wet surface: 0.250 m s−1, 0.247 m s−1, and 0.245 m s−1 for 10 cm top soil, 1 cm top soil, and 1 cm top soil with compensation factor, respectively. These three values differed by much less than those caused by the difference in the land-use and vegetation fraction. This result indicates that the Australian desert contains such a low soil moisture that the soil moisture effect was very low and the effect of the top soil layer depth may not be important. However, the dust source regions of North-East Asia are known to have relatively high soil moisture contents. Therefore, the effect of the top soil layer depth may be much more important in North-East Asia. The detailed results for the threshold friction velocity of wet soil determined under various conditions are summarized in Table 5.

3.5. Saltation Flux

3.5.1. Determination of the Exponent of the Saltation Scheme

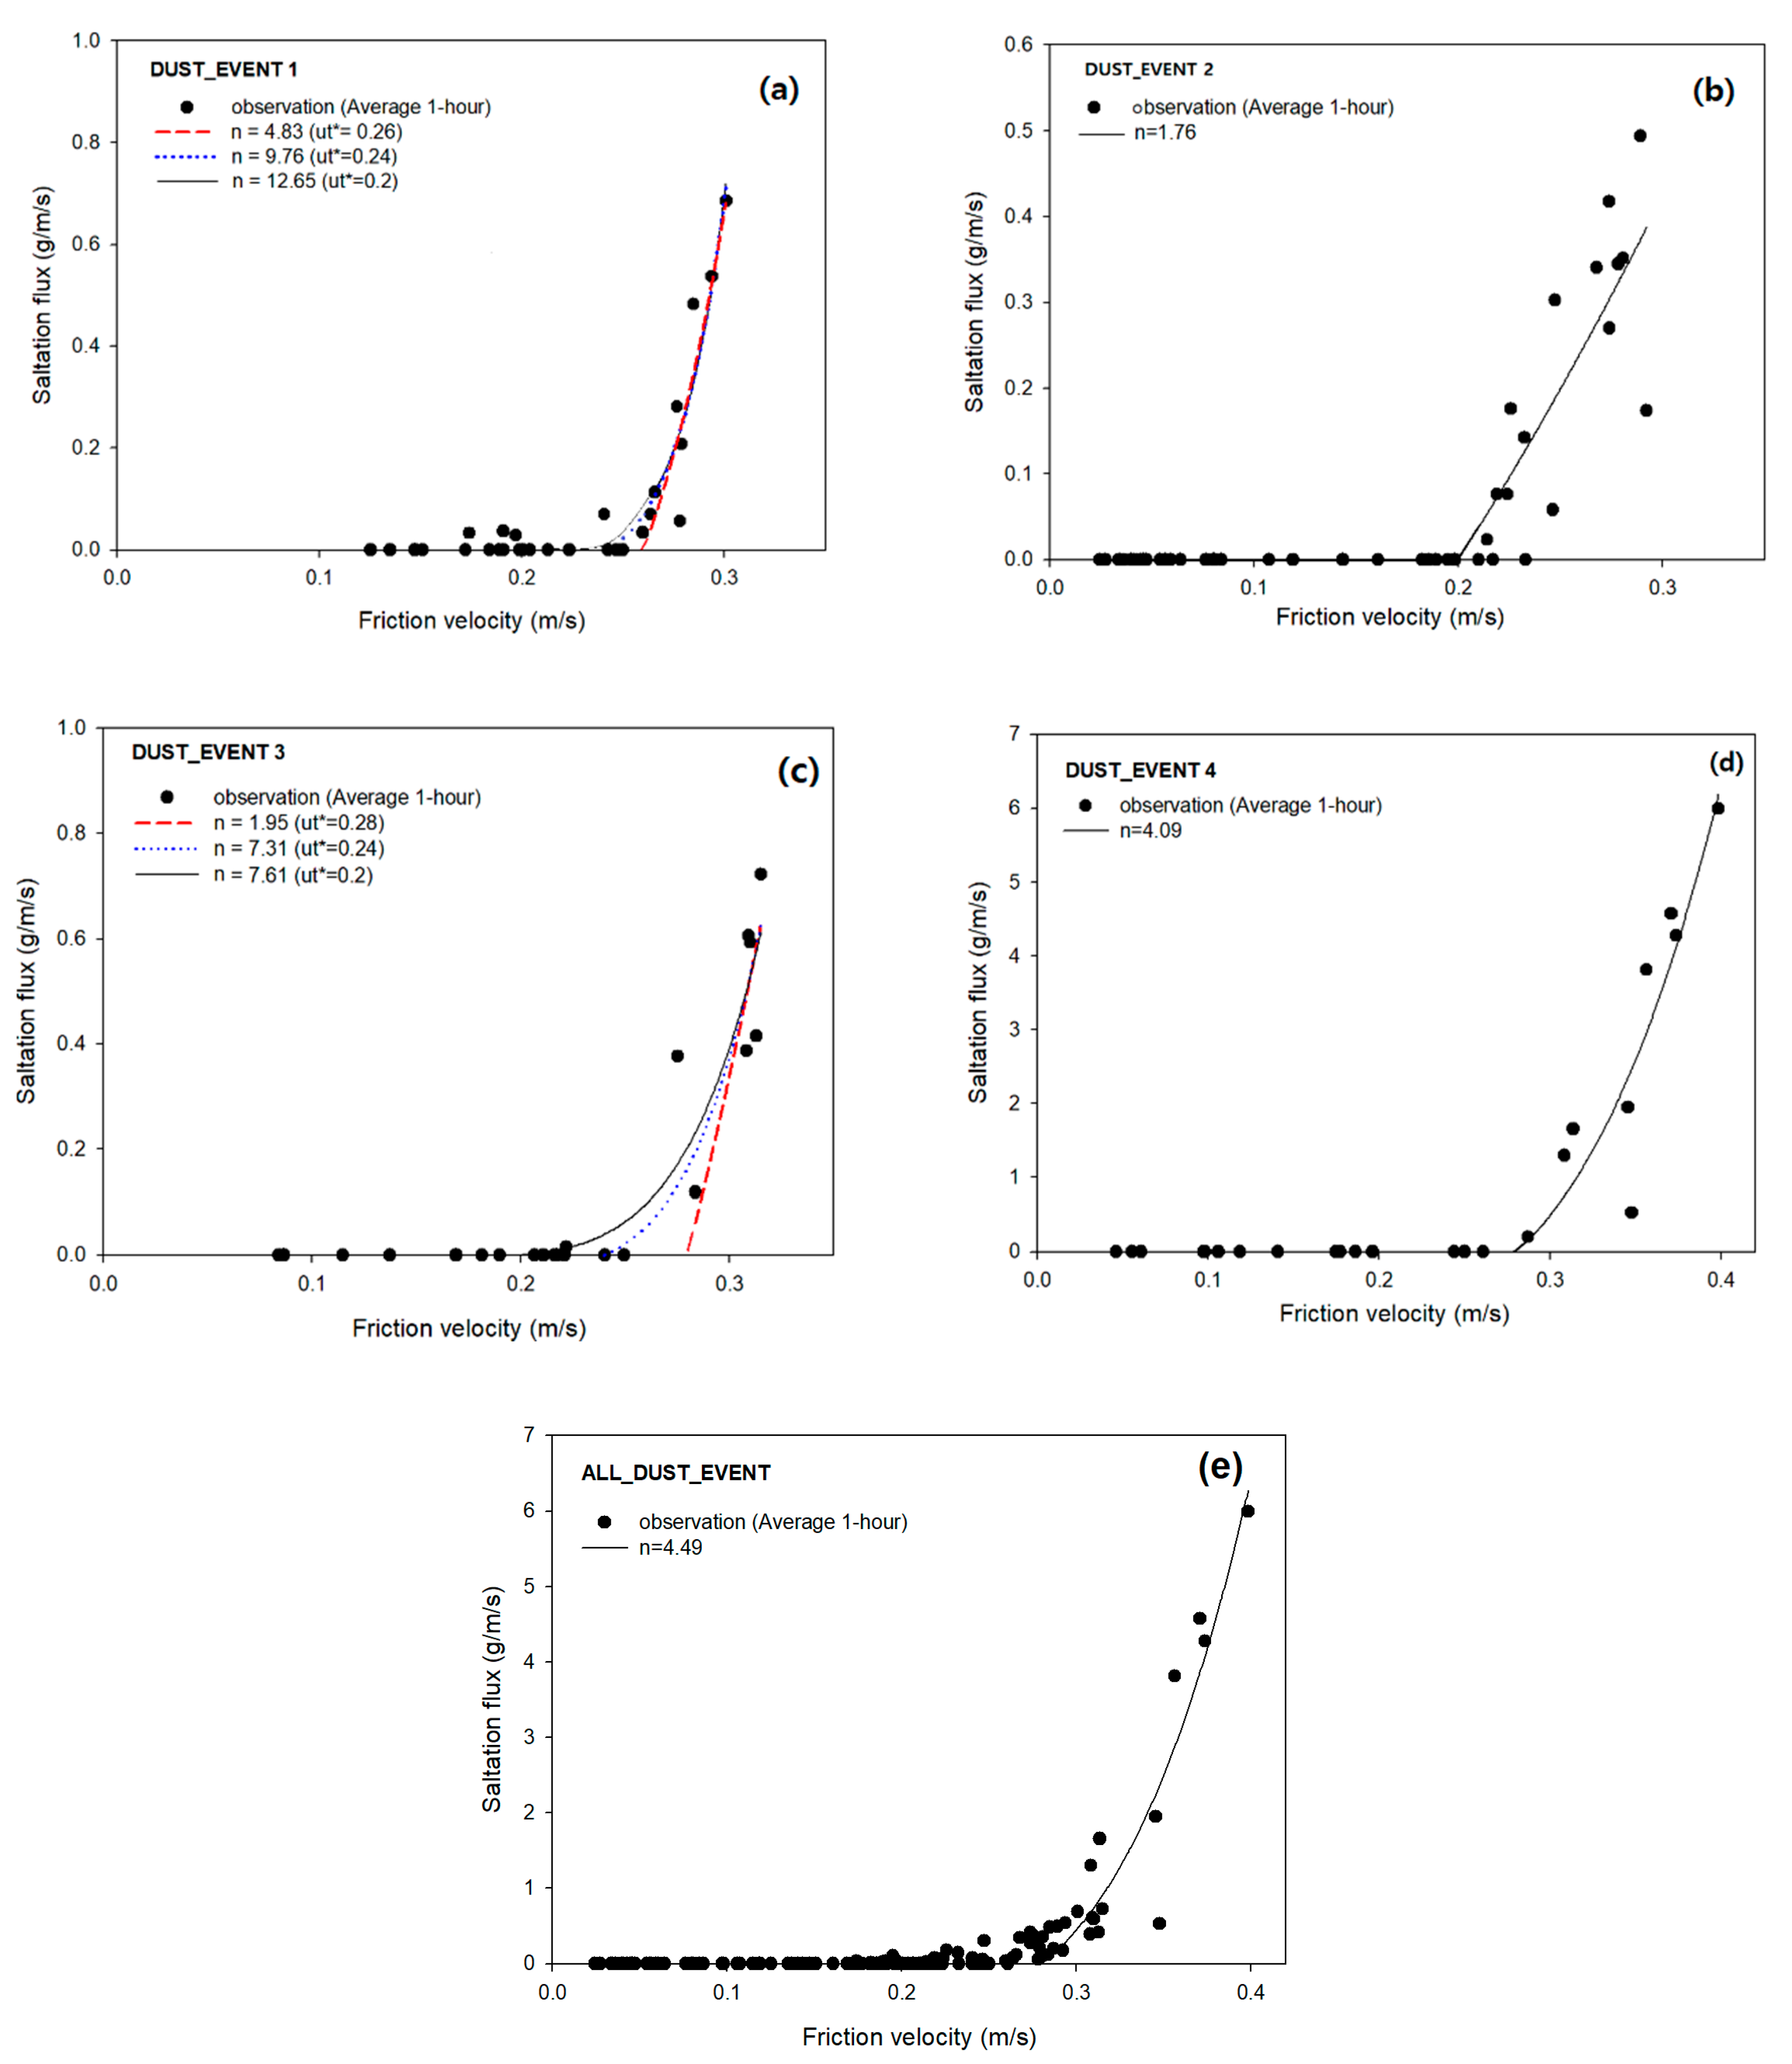
Because of the disagreement over the functional dependency of the saltation flux on the friction velocity, we tried to determine the value of the exponent n appearing in Equation (7) based on the measured saltation flux values. First, the saltation flux values measured during each of the four dust event periods of the JADE project (Figure 1) were curve-fitted separately using Equation (7) to determine the values of n and k. The threshold friction velocities for Dust Events 2 and 4 were set to the observed values 0.2 m s−1 and 0.28 m s−1, respectively, whereas those for Dust Events 1 and 3, for which no threshold friction velocity measurements were conducted, were set to three different values between 0.2 m s−1 and 0.28 m s−1 as a sensitivity test. All the saltation flux and friction velocity values used in Figure 7 are 1 h average values because most meteorology models and chemical transport models, such as WRF and CMAQ, which are combined with the wind-blown dust models use 1 h time steps. The value of the exponent n varied over a very wide range of 1.76~12.65 and it showed a strong dependence on the threshold friction velocity setting for Dust Events 1 and 3.
The soil condition during the JADE project was reported to be largely unchanged, implying that the threshold friction velocity must be represented by a single value. Therefore, in Figure 7e we curve-fitted all the measured saltation flux values together. The most adequate fitting was obtained when the threshold friction velocity value was set to 0.28 m s−1. In this case the optimum exponent was determined to be 4.49. Ishizuka et al. [45] reported the optimum exponent of about 4 for the same project data set using a formula similar to Equation (7), which was very close to the value obtained in this study.

3.5.2. Comparison of Two Saltation Schemes with the Measured Friction Velocity

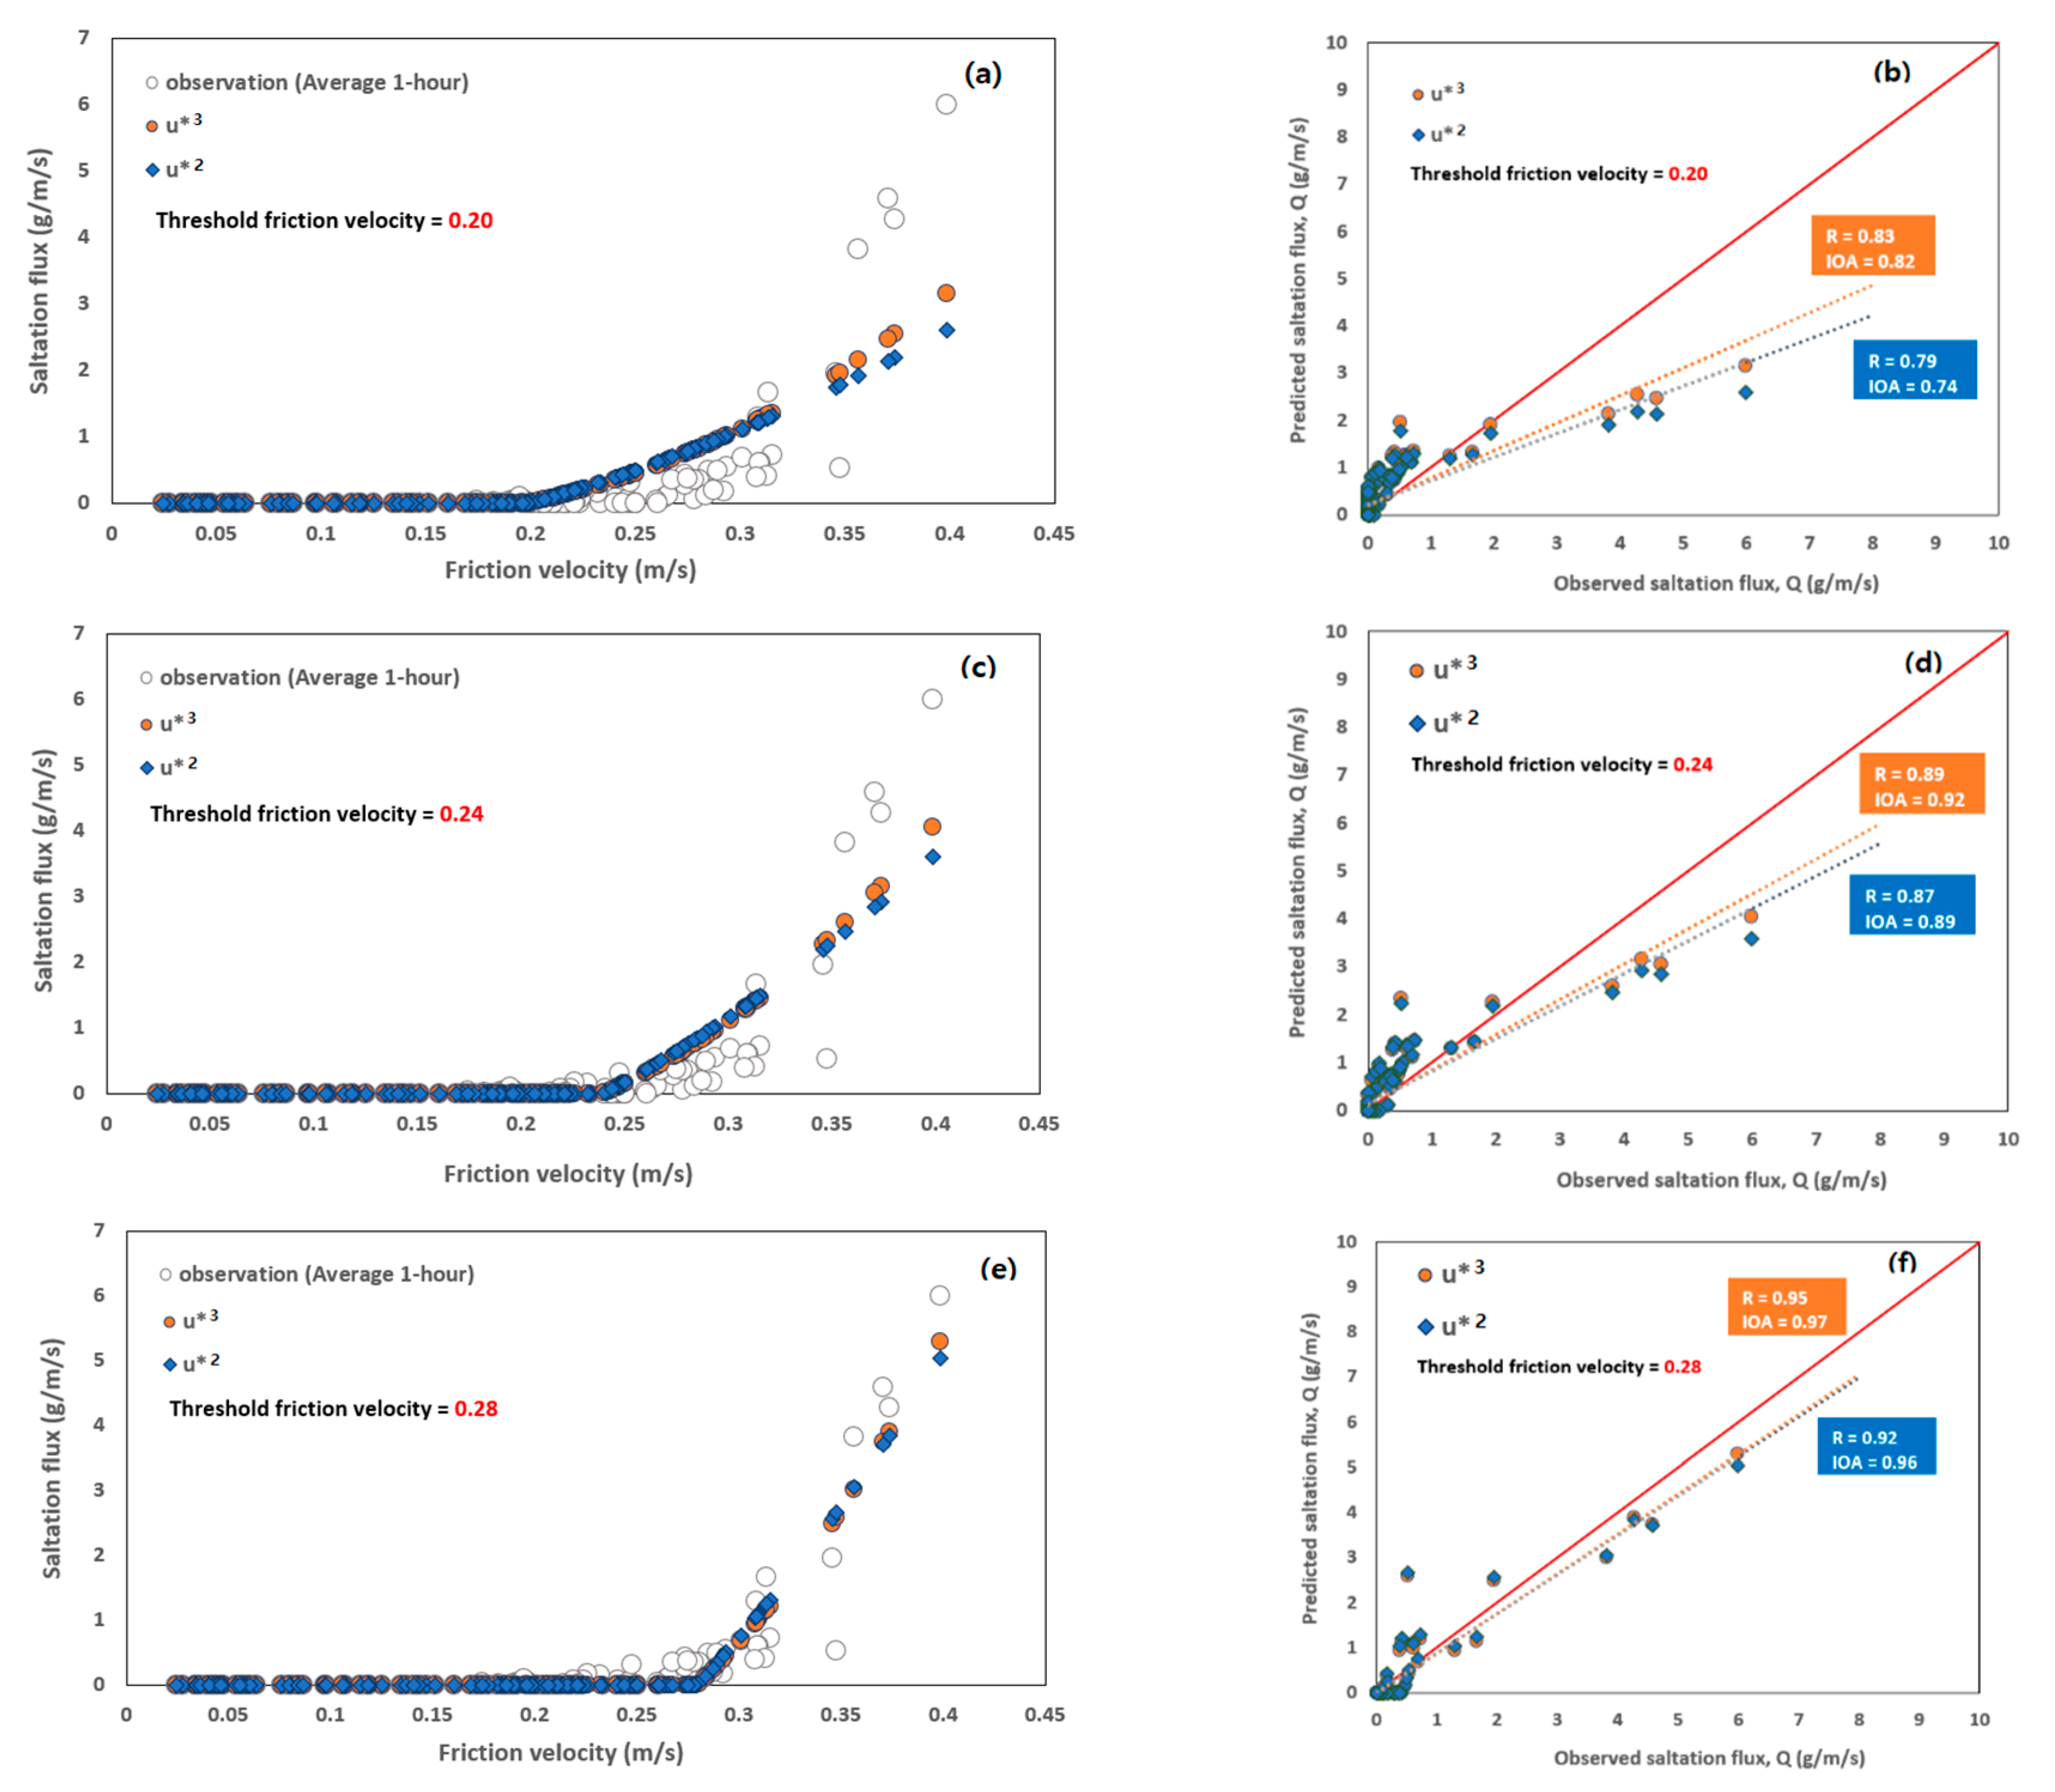
Wind-blown dust models show different results when calculating the saltation flux, depending on the exponent of the saltation flux scheme. In this subsection, the two representative saltation schemes introduced in Section 2.2.7, Kawamura and White (Equation (8)) and Kok (Equation (9)) expressed as u*3 and u*2, respectively, to focus on the exponent value, were evaluated by comparing their predictions for the saltation flux with the measurements. In Figure 8, the saltation flux values measured during all the dust event periods were curve-fitted as a function of the measured friction velocity using Equations (8) and (9) with three different threshold friction velocity values of 0.2 m s−1, 0.24 m s−1, and 0.28 m s−1. Again, the best fitting was obtained with the threshold friction velocity value of 0.28 m s−1. The value of the coefficient k determined for this case was 0.828 for the Kawamura and White scheme and 1.910 for the Kok scheme. Both of these values are smaller than the coefficients suggested originally by the scheme developers: 2.6 [36] and 5 [72,73], respectively. CMAQ used the coefficient of 1.0, rather than the original value of 2.6, when it adopted the Kawamura and White scheme in its wind-blown dust emission module. The result of this study seems to support the coefficient taken by CMAQ. The two schemes showed very similar levels of correlation coefficients and IOAs.

3.5.3. Comparison of Two Saltation Schemes with the Model-Predicted Friction Velocity

In this subsection, a similar analysis was performed to that reported in Section 3.5.2 but the model-predicted threshold friction velocities, instead of the measured ones, were used to calculate the saltation flux using the two saltation schemes.
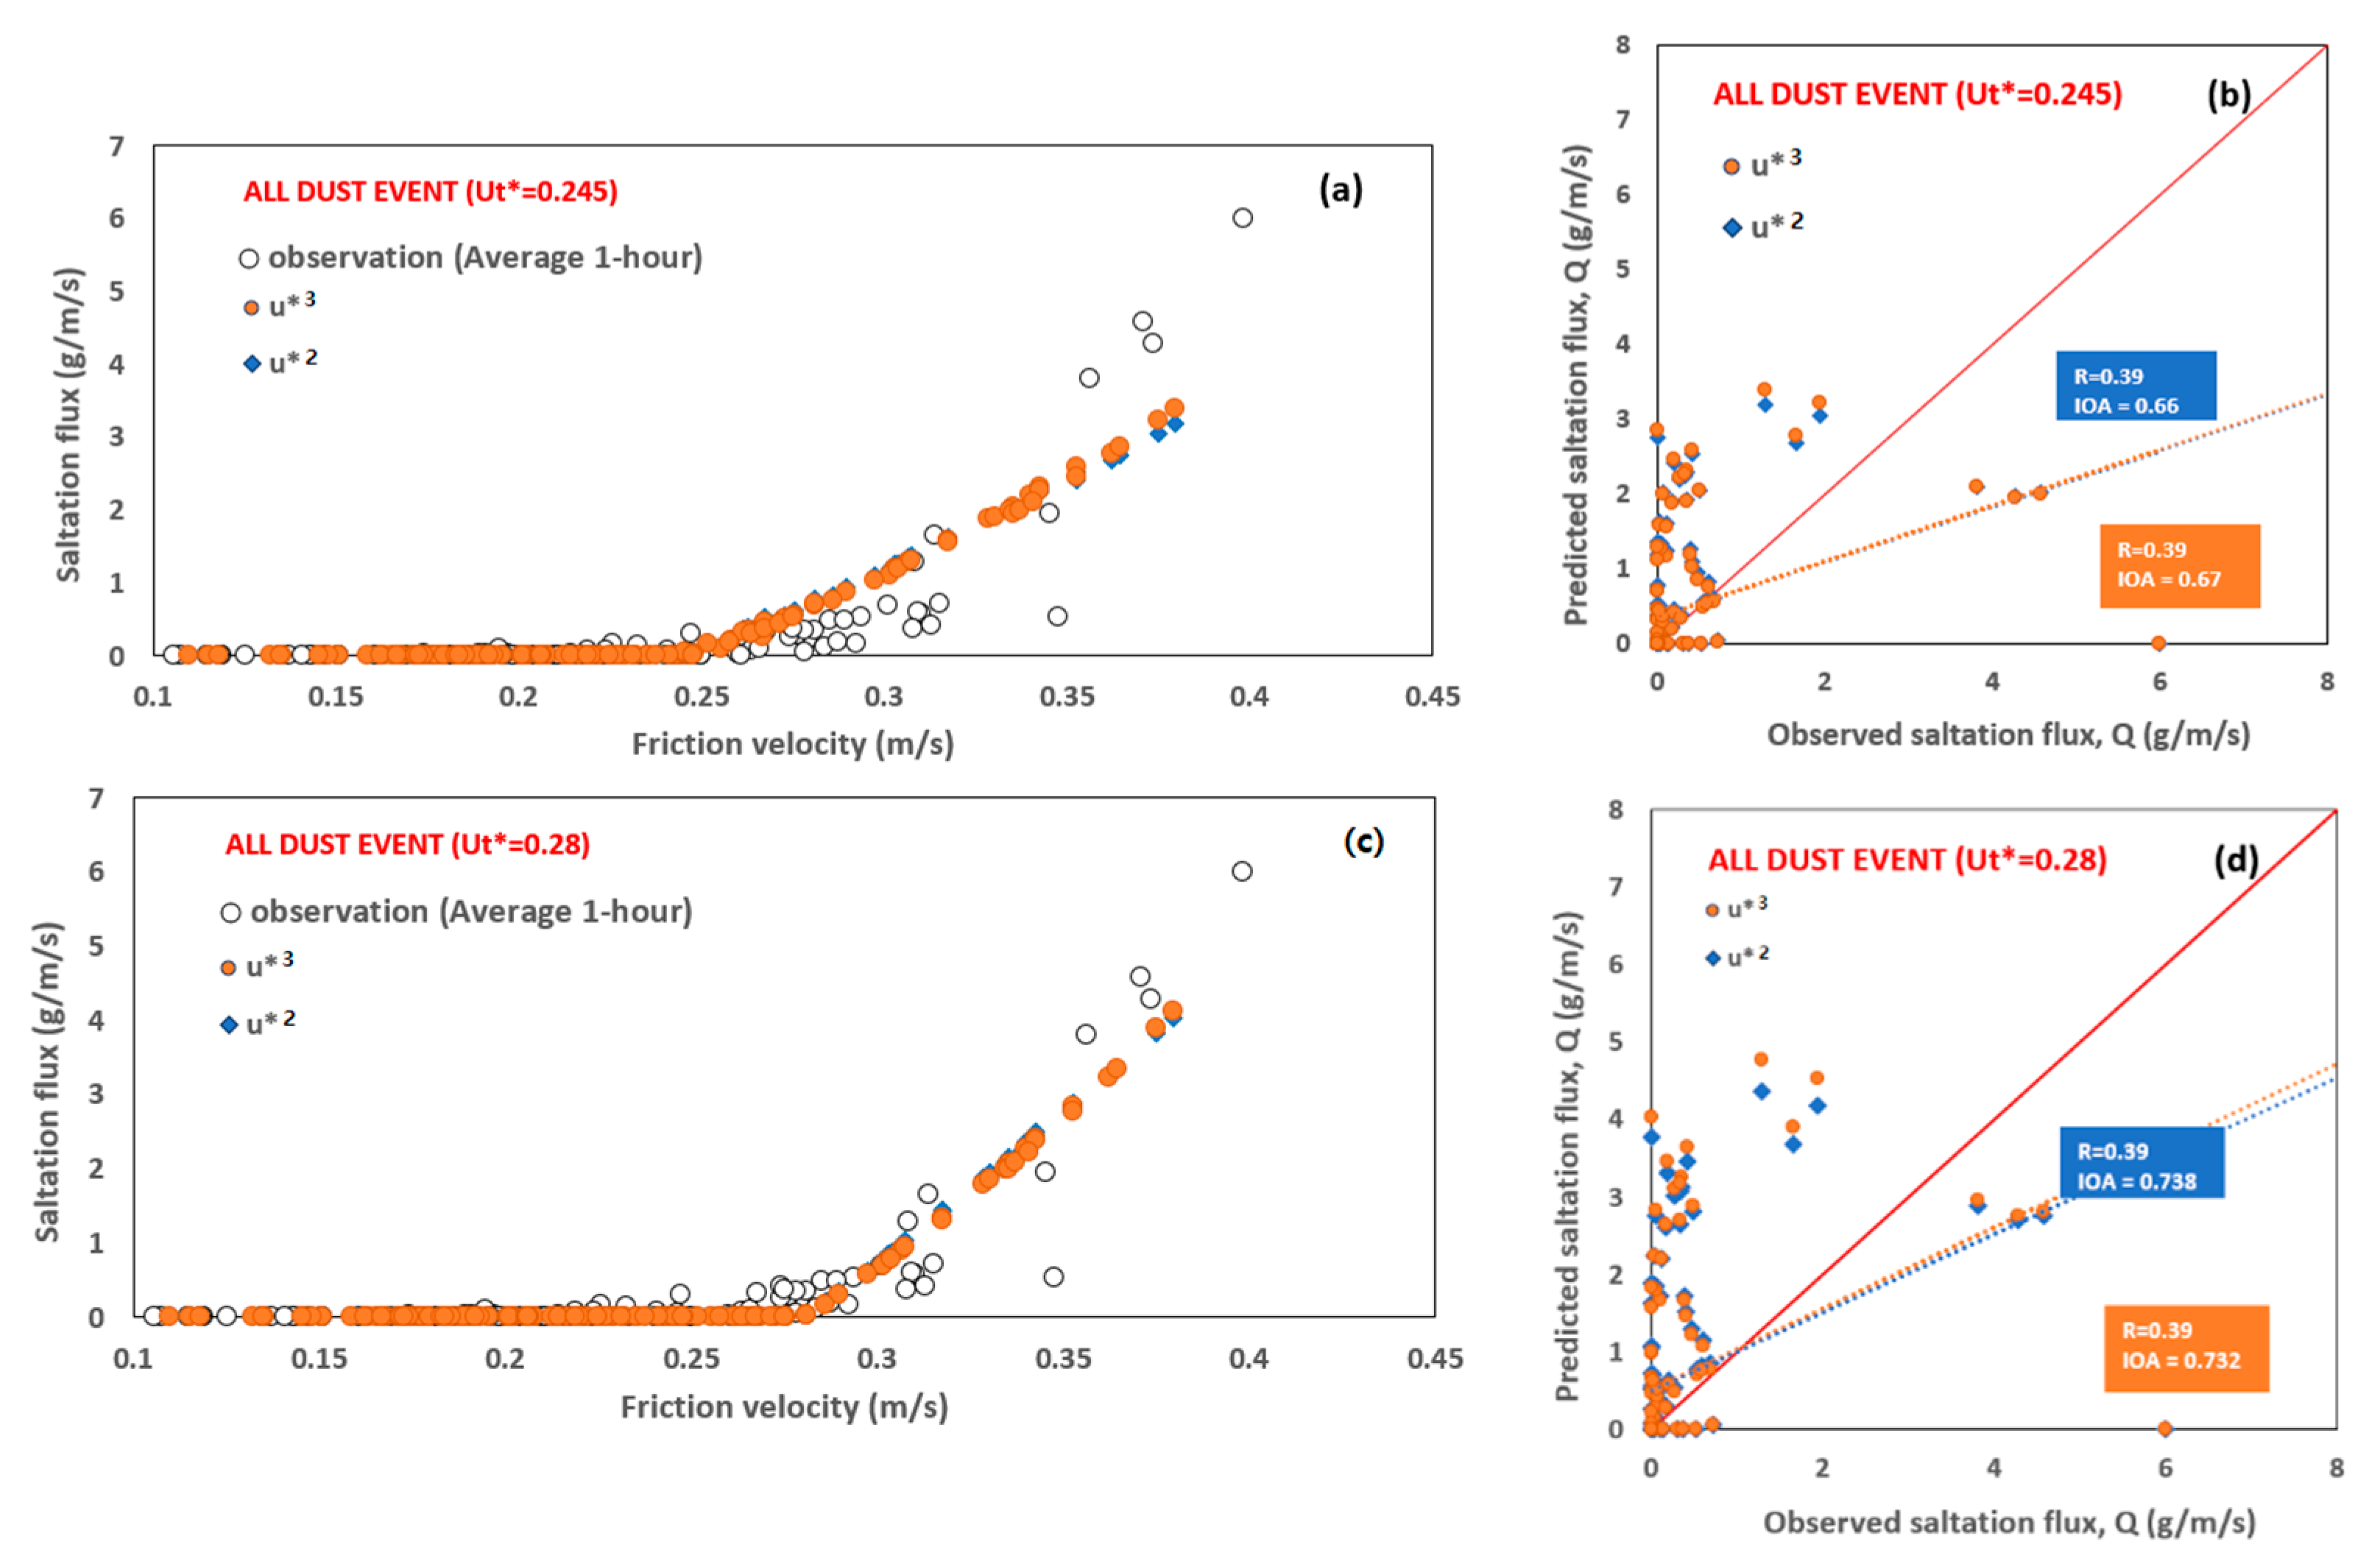
Figure 9a,b show the results obtained using the model-predicted average threshold friction velocity for the whole project period of 0.245, whereas Figure 9c,d show the results obtained using a measured threshold friction velocity of 0.28 that provided the best fitting in the previous subsection. Again, the threshold friction velocity of 0.28 led to higher IOA values for both schemes and the two saltation schemes did not show a large difference in their performances. However, both the correlation coefficients and IOAs obtained for both schemes were much smaller than those obtained with measured friction velocities when Figure 8e,f and Figure 9c,d were compared. This result indicates that inaccurate estimation of wind field by the meteorology model degrades the accuracy of the saltation schemes and that accurate estimation of the input parameters is more important than the functional form (i.e., the value of the exponent n) of the saltation schemes for accurate prediction of the saltation flux.

4. Conclusions

The saltation flux measurements obtained from a desert region of Australia, whose surface characteristics were similar to those of the Gobi desert, were used to evaluate two widely used physics-based saltation schemes. The accurate prediction of the threshold friction velocity was shown to be the most important element to enhance the accuracy of the saltation schemes, which requires the realistic representation of land use, vegetation fraction, and soil conditions. The Australian desert where the JADE project was conducted has very low soil moisture content, precluding quantitative assessment of the effects of the soil moisture, which may be much more important in North-East Asian dust source regions. Both schemes tested in this study simulated the saltation process reasonably well when using measured input conditions. Further evaluation of the wind-blown dust models will require comparison with more measurements of the saltation flux and vertical dust emissions in other desert regions, including North-East Asia.

Supplementary Materials

The following are available online at https://www.mdpi.com/2073-4433/11/1/10/s1. Figure S1: Scatterplots comparing the soil moisture contents predicted by different land surface schemes with observation at different sites. The information of the land surface schemes used and the observation sites is provided in each sub-figure.

Author Contributions

Conceptualization, S.H.P.; methodology, H.L. and S.H.P.; software, H.L.; validation, H.L. and S.H.P.; formal analysis, H.L. and S.H.P.; investigation, H.L. and S.H.P.; resources, H.L. and S.H.P.; data curation, H.L.; writing—original draft preparation, H.L. and S.H.P.; writing—review and editing, S.H.P.; visualization, H.L.; supervision, S.H.P.; project administration, S.H.P.; funding acquisition, S.H.P. All authors have read and agreed to the published version of the manuscript.

Funding

This research was supported by the National Strategic Project-Fine particle of the National Research Foundation of Korea (NRF) funded by the Ministry of Science and ICT (MSIT), the Ministry of Environment (ME), and the Ministry of Health and Welfare (MOHW) (NRF-2017M3D8A1092022).

Conflicts of Interest

The authors declare no conflict of interest.

References

  1. Uno, I.; Eguchi, K.; Yumimoto, K.; Takemura, T.; Shimizu, A.; Uematsu, M.; Liu, Z.; Wang, Z.; Hara, Y.; Sugimoto, N. Asian Dust Transported One Full Circuit Around the Globe. Nat. Geosci. 2009, 2, 557–560. [Google Scholar] [CrossRef]
  2. Sun, J.M.; Zhang, M.Y.; Liu, T.S. Spatial and Temporal Characteristics of Dust Storms in China and its Surrounding Regions, 1960–1999: Relations to Source Area and Climate. J. Geophys. Res. 2001, 106, 10325–10333. [Google Scholar] [CrossRef]
  3. Wang, X.; Dong, Z.; Zhang, J.; Liu, L. Modern Dust Storms in China: An Overview. J. Arid Environ. 2004, 58, 559–574. [Google Scholar] [CrossRef]
  4. Kimura, R.; Shinoda, M. Spatial Distribution of Threshold Wind Speeds for Dust Outbreaks in Northeast Asia. Geomorphology 2010, 114, 319–325. [Google Scholar] [CrossRef]
  5. Jung, M.; Son, S.; Kim, H.C.; Kim, S.; Park, R.J.; Chen, D. Contrasting Synoptic Weather Patterns between Non-Dust High Particulate Matter Events and Asian Dust Events in Seoul, South Korea. Atmos. Environ. 2019, 214. [Google Scholar] [CrossRef]
  6. Tsedendamba, P.; Dulam, J.; Baba, K.; Hagiwara, K.; Noda, J.; Kawai, K.; Sumiya, G.; McCarthy, C.; Kai, K.; Hoshino, B. Northeast Asian Dust Transport: A Case Study of a Dust Storm Event from 28 March to 2 April 2012. Atmosphere 2019, 10, 69. [Google Scholar] [CrossRef] [Green Version]
  7. Uno, I.; Amano, H.; Emori, S.; Kinoshita, N.; Matsu., I.; Sugimoto, N. Trans-Pacific Yellow Sand Transport Observed in April 1998: Numerical Simulation. J. Geophys. Res. 2001, 106, 331–344. [Google Scholar] [CrossRef]
  8. Ravi, S.; Zobeck, T.M.; Oer, T.M.; Okin, G.S.; D’odorico, P. On the Effect of Moisture Bonding Forces in Air-Dry Soils on Threshold Friction Velocity of Wind Erosion. Sedimentology 2006, 53, 597–609. [Google Scholar] [CrossRef]
  9. Webb, N.P.; Strong, C.L. Soil Erodibility Dynamics and its Representation for Wind Erosion and Dust Emission Models. Aeolian Res. 2011, 3, 165–179. [Google Scholar] [CrossRef]
  10. Yin, D.; Nickovic, S.; Sprigg, W.A. The Impact of using Different Land Cover Data on Wind-Blown Desert Dust Modeling Results in the Southwestern United States. Atmos. Environ. 2007, 41, 2214–2224. [Google Scholar] [CrossRef]
  11. Darmenova, K.; Sokolik, I.N.; Shao, Y.; Marticorena, B.; Bergametti, G. Development of a Physically Based Dust Emission Module within the Weather Research and Forecasting (WRF) Model: Assessment of Dust Emission Parameterizations and Input Parameters for Source Regions in Central and East Asia. J. Geophys. Res. 2009, 114. [Google Scholar] [CrossRef]
  12. Raupach, M.R. Drag and Drag Partition on Rough Surfaces. Bound.-Layer Meteorol. 1992, 60, 375–395. [Google Scholar] [CrossRef]
  13. Shao, Y.; Yang, Y. A Scheme for Drag Partition Over Rough Surfaces. Atmos. Environ. 2005, 39, 7351–7361. [Google Scholar] [CrossRef]
  14. Fecan, F.; Marticorena, B.; Bergametti, G. Parametrization of the Increase of the Aeolian Erosion Threshold Wind Friction Velocity due to Soil Moisture for Arid and Semi-Arid Areas. Ann. Geophys. 1999, 17, 149–157. [Google Scholar] [CrossRef] [Green Version]
  15. Shao, Y.; Lu, H. A Simple Expression for Wind Erosion Threshold Friction Velocity. J. Geophys. Res. 2000, 105, 437–443. [Google Scholar] [CrossRef]
  16. Bagnold, R.A. The Physics of Blown Sand and Desert Dunes; Courier Corporation: Morrow, NY, USA, 1941; p. 265. [Google Scholar]
  17. Marticorena, B.; Bergametti, G. Modeling the Atmospheric Dust Cycle. Part 1: Design of a Soil-Derived Dust Emission Scheme. J. Geophys. Res. 1995, 100, 16415–16430. [Google Scholar] [CrossRef] [Green Version]
  18. Alfaro, S.C.; Gaudichet, A.; Gomes, L.; Maille, M. Modeling the Size Distribution of a Soil Aerosol Produced by Sandblasting. J. Geophys. Res. 1997, 102, 11239–11249. [Google Scholar] [CrossRef]
  19. Gillette, D. A Wind Tunnel Simulation of the Erosion of Soil: Effect of Soil Texture, Sandblasting, Wind Speed, and Soil Consolidation on Dust Production. Atmos. Environ. 1978, 12, 1735–1743. [Google Scholar] [CrossRef]
  20. Uno, I.; Wang, Z.; Chiba, M.; Chun, Y.S.; Gong, S.L.; Hara, Y.; Jung, E.; Lee, S.; Liu, M.; Mikami, M.; et al. Dust Model Intercomparison (DMIP) Study Over Asia: Overview. J. Geophys. Res. 2006, 111. [Google Scholar] [CrossRef] [Green Version]
  21. Kang, J.; Yoon, S.; Shao, Y.; Kim, S. Comparison of Vertical Dust Flux by Implementing Three Dust Emission Schemes in WRF/Chem. J. Geophys. Res. 2011, 116. [Google Scholar] [CrossRef] [Green Version]
  22. Lu, H.; Shao, Y. A New Model for Dust Emission by Saltation Bombardment. J. Geophys. Res. 1999, 104, 827–842. [Google Scholar] [CrossRef] [Green Version]
  23. Liu, M.; Westphal, D.L.; Wang, S.; Shimizu, A.; Sugimoto, N.; Zhou, J.; Chen, Y. A High-Resolution Numerical Study of the Asian Dust Storms of April 2001. J. Geophys. Res. 2003, 108, 8653. [Google Scholar] [CrossRef]
  24. In, H.; Park, S. A Simulation of Long-Range Transport of Yellow Sand Observed in April 1998 in Korea. Atmos. Environ. 2002, 36, 4173–4187. [Google Scholar] [CrossRef]
  25. Park, S.U.; In, H.J. Parameterization of Dust Emission for the Simulation of the Yellow Sand (Asian Dust) Event Observed in March 2002 in Korea. J. Geophys. Res. 2003, 108, 4618. [Google Scholar] [CrossRef]
  26. Gong, S.L.; Zhang, X.Y.; Zhao, T.L.; McKendry, I.G.; Jaffe, D.A.; Lu, N.M. Characterization of Soil Dust Distributions in China and its Transport during ACE-ASIA: 2. Model Simulation and Validation. J. Geophys. Res. 2003, 108, 4262. [Google Scholar]
  27. Nickovic, S.; Kallos, G.; Papadopoulos, A.; Kakaliagou, O. A Model for Prediction of Desert Dust Cycle in the Atmosphere. J. Geophys. Res. 2001, 106, 113–129. [Google Scholar] [CrossRef] [Green Version]
  28. Shao, Y.; Raupach, M.R.; Findlater, P.A. Effect of Saltation Bombardment on the Entrainment of Dust by Wind. J. Geophys. Res. 1993, 98, 12719–12726. [Google Scholar] [CrossRef] [Green Version]
  29. Shao, Y.; Raupach, M.R.; Leys, J.F. A Model for Predicting Aeolian Sand Drift and Dust Entrainment on Scales from Paddock to Region. Aust. J. Soil Res. 1996, 34, 309–342. [Google Scholar] [CrossRef] [Green Version]
  30. Shao, Y. A Model for Mineral Dust Emission. J. Geophys. Res. 2001, 106, 20239–20254. [Google Scholar] [CrossRef]
  31. Uno, I.; Carmichael, G.; Streets, D.; Satake, S.; Takemura, T.; Woo, J.; Uematsu, M.; Ohta, S. Analysis of Surface Black Carbon Distributions during ACE-Asia using a Regional-Scale Aerosol Model. J. Geophys. Res. 2003, 108, 8636. [Google Scholar] [CrossRef]
  32. Christensen, J.H. The Danish Eulerian Hemispheric ModelAa Three-Dimensional Air Pollution Model used for the Arctic. Atmos. Environ. 1997, 31, 4169–4191. [Google Scholar] [CrossRef]
  33. Tanaka, T.Y.; Chiba, M. Global Simulation of Dust Aerosol with a Chemical Transport Model, MASINGAR. J. Meteorol. Soc. Jpn. Ser. II 2005, 83, 255–278. [Google Scholar] [CrossRef] [Green Version]
  34. Luo, C.; Mahowald, N.; Jones, C. Temporal Variability of Dust Mobilization and Concentration in Source Regions. J. Geophys. Res. 2004, 109. [Google Scholar] [CrossRef]
  35. Darmenova, K.; Sokolik, I.; Shao, Y.; Bergametti, G.; Marticorena, B.; Uno, I. Development of a Regional Dust Modeling System for Central and East Asia Under the NEESPI Initiative; American Geophysical Union: San Francisco, CA, USA, 2006. [Google Scholar]
  36. White, B.R. Soil Transport by Wind on Mars. J. Geophys. Res. Solid Earth 1979, 84, 4643–4651. [Google Scholar] [CrossRef]
  37. Owen, P.R. Saltation of Uniform Grains in Air. J. Fluid Mech. 1964, 20, 225–242. [Google Scholar] [CrossRef]
  38. Mikami, M.; Yamada, Y.; Ishizuka, M.; Ishimaru, T.; Gao, W.; Zeng, F. Measurement of Saltation Process Over Gobi and Sand Dunes in the Taklimakan Desert, China, with Newly Developed Sand Particle Counter. J. Geophys. Res. 2005, 110. [Google Scholar] [CrossRef] [Green Version]
  39. Ishizuka, M. JADE Data, Mendeley Data v1; Elsevier: Amsterdam, The Netherlands, 2018. [Google Scholar]
  40. Liu, D.; Ishizuka, M.; Mikami, M.; Shao, Y. Turbulent Characteristics of Saltation and Uncertainty of Saltation Model Parameters. Atmos. Chem. Phys. 2018, 18, 7595–7606. [Google Scholar] [CrossRef] [Green Version]
  41. Xi, X.; Sokolik, I.N. Seasonal Dynamics of Threshold Friction Velocity and Dust Emission in Central Asia. J. Geophys. Res. Atmos. 2015, 120, 1536–1564. [Google Scholar] [CrossRef] [Green Version]
  42. Laurent, B.; Marticorena, B.; Bergametti, G.; Chazette, P.; Maignan, F.; Schmechtig, C. Simulation of the Mineral Dust Emission Frequencies from Desert Areas of China and Mongolia using an Aerodynamic Roughness Length Map Derived from the POLDER/ADEOS 1 Surface Products. J. Geophys. Res. 2005, 110. [Google Scholar] [CrossRef]
  43. Shao, Y.; Ishizuka, M.; Mikami, M.; Leys, J.F. Parameterization of Size-resolved Dust Emission and Validation with Measurements. J. Geophys. Res. Atmos. 2011, 116. [Google Scholar] [CrossRef]
  44. Ishizuka, M.; Mikami, M.; Leys, J.; Yamada, Y.; Heidenreich, S.; Shao, Y.; McTainsh, G.H. Effects of Soil Moisture and Dried Raindroplet Crust on Saltation and Dust Emission. J. Geophys. Res. 2008, 113. [Google Scholar] [CrossRef] [Green Version]
  45. Ishizuka, M.; Mikami, M.; Leys, J.F.; Shao, Y.; Yamada, Y.; Heidenreich, S. Power Law Relation between Size-Resolved Vertical Dust Flux and Friction Velocity Measured in a Fallow Wheat Field. Aeolian Res. 2014, 12, 87–99. [Google Scholar] [CrossRef]
  46. Sugita, F.; Kishii, T.; Kuzuha, Y.; Yamanaka, T. A Wind Tunnel Investigation of Roughness Properties over Non-Homogeneous Rough Surfaces. Hydrol. Process. 1998, 12, 2149–2161. [Google Scholar] [CrossRef]
  47. Marticorena, B.; Kardous, M.; Bergametti, G.; Callot, Y.; Chazette, P.; Khatteli, H.; Le Hégarat-Mascle, S.; Maillé, M.; Rajot, J.; Vidal-Madjar, D.; et al. Surface and Aerodynamic Roughness in Arid and Semiarid Areas and their Relation to Radar Backscatter Coefficient. J. Geophys. Res. 2006, 111. [Google Scholar] [CrossRef] [Green Version]
  48. Hébrard, E.; Listowski, C.; Coll, P.; Marticorena, B.; Bergametti, G.; Määttänen, A.; Montmessin, F.; Forget, F. An Aerodynamic Roughness Length Map Derived from Extended Martian Rock Abundance Data. J. Geophys. Res. 2012, 117, E04008. [Google Scholar] [CrossRef] [Green Version]
  49. Foroutan, H.; Young, J.; Napelenok, S.; Ran, L.; Appel, K.W.; Gilliam, R.C.; Pleim, J.E. Development and Evaluation of a Physics-Based Windblown Dust Emission Scheme Implemented in the CMAQ Modeling System. J. Adv. Model. Earth Syst. 2017, 9, 585–608. [Google Scholar] [CrossRef] [Green Version]
  50. King, J.; Nickling, W.G.; Gillies, J.A. Representation of Vegetation and Other Nonerodible Elements in Aeolian Shear Stress Partitioning Models for Predicting Transport Threshold. J. Geophys. Res. Earth Surf. 2005, 110. [Google Scholar] [CrossRef]
  51. Zhao, T.L.; Gong, S.L.; Zhang, X.Y.; Abdel-Mawgoud, A.; Shao, Y.P. An Assessment of Dust Emission Schemes in Modeling East Asian Dust Storms. J. Geophys. Res. 2006, 111. [Google Scholar] [CrossRef] [Green Version]
  52. Park, Y.; Park, S.H. Development of a New Wind-Blown-Dust Emission Module using Comparative Assessment of Existing Dust Models. Part. Sci. Technol. 2010, 28, 267–286. [Google Scholar] [CrossRef]
  53. Park, Y.; Park, S.H. Estimation of Threshold Friction Velocity using a Physical Parameterization Over the Asian Dust Source Region. Particul. Sci. Technol. 2013, 31, 119–127. [Google Scholar] [CrossRef]
  54. Kok, J.F.; Mahowald, N.M.; Fratini, G.; Gillies, J.A.; Ishizuka, M.; Leys, J.F.; Mikami, M.; Park, M.; Park, S.; Van Pelt, R.S. An Improved Dust Emission model–Part 1: Model Description and Comparison against Measurements. Atmos. Chem. Phys. 2014, 14, 13023–13041. [Google Scholar] [CrossRef] [Green Version]
  55. Kok, J.F.; Albani, S.; Mahowald, N.M.; Ward, D.S. An Improved Dust Emission model–Part 2: Evaluation in the Community Earth System Model, with Implications for the use of Dust Source Functions. Atmos. Chem. Phys. 2014, 14, 13043–13061. [Google Scholar] [CrossRef] [Green Version]
  56. Pérez, C.; Haustein, K.; Janjic, Z.; Jorba, O.; Huneeus, N.; Baldasano, J.M.; Black, T.; Basart, S.; Nickovic, S.; Miller, R.L.; et al. Atmospheric Dust Modeling from Meso to Global Scales with the Online NMMB/BSC-Dust Model—Part 1: Model Description, Annual Simulations and Evaluation. Atmos. Chem. Phys. 2011, 11, 13001–13027. [Google Scholar] [CrossRef] [Green Version]
  57. Wyatt, V.E.; Nickiing, W.G. Drag and Shear Stress Partitioning in Sparse Desert Creosote Communities. Can. J. Earth Sci. 1997, 34, 1486–1498. [Google Scholar] [CrossRef]
  58. Campbell, P.C.; Bash, J.O.; Spero, T.L. Updates to the Noah Land Surface Model in WRF-CMAQ to Improve Simulated Meteorology, Air Quality, and Deposition. J. Adv. Model. Earth Syst. 2019, 11, 231–256. [Google Scholar] [CrossRef]
  59. Pan, H.-L.; Mahrt, L. Interaction between Soil Hydrology and Boundary-Layer Development. Bound.-Layer Meteorol. 1987, 38, 185–202. [Google Scholar] [CrossRef]
  60. Chen, F.; Mitchell, K.; Schaake, J.; Xue, Y.; Pan, H.; Koren, V.; Duan, Q.Y.; Ek, M.; Betts, A. Modeling of Land Surface Evaporation by Four Schemes and Comparison with FIFE Observations. J. Geophys. Res. 1996, 101, 7251–7268. [Google Scholar] [CrossRef] [Green Version]
  61. Chen, F.; Dudhia, J. Coupling an Advanced Land Surface-Hydrology Model with the Penn State-NCAR MM5 Modeling System. Part I: Model Implementation and Sensitivity. Mon. Wea. Rev. 2001, 129, 569–585. [Google Scholar] [CrossRef] [Green Version]
  62. Ek, M.B.; Mitchell, K.E.; Lin, Y.; Rogers, E.; Grunmann, P.; Koren, V.; Gayno, G.; Tarpley, J.D. Implementation of Noah Land Surface Model Advances in the National Centers for Environmental Prediction Operational Mesoscale Eta Model. J. Geophys. Res. 2003, 108, 8851. [Google Scholar] [CrossRef]
  63. Pleim, J.E.; Chang, J.S. A Non-Local Closure Model for Vertical Mixing in the Convective Boundary Layer. Atmos. Environ. 1992, 26, 965–981. [Google Scholar] [CrossRef]
  64. Niu, G.; Yang, Z.; Mitchell, K.E.; Chen, F.; Ek, M.B.; Barlage, M.; Kumar, A.; Manning, K.; Niyogi, D.; Rosero, E.; et al. The Community Noah Land Surface Model with Multiparameterization Options (Noah-MP): 1. Model Description and Evaluation with Local-Scale Measurements. J. Geophys. Res. 2011, 116. [Google Scholar] [CrossRef] [Green Version]
  65. Yang, Z.; Niu, G.; Mitchell, K.E.; Chen, F.; Ek, M.B.; Barlage, M.; Longuevergne, L.; Manning, K.; Niyogi, D.; Tewari, M.; et al. The Community Noah Land Surface Model with Multiparameterization Options (Noah-MP): 2. Evaluation Over Global River Basins. J. Geophys. Res. 2011, 116. [Google Scholar] [CrossRef]
  66. Cai, X.; Yang, Z.; Xia, Y.; Huang, M.; Wei, H.; Leung, L.R.; Ek, M.B. Assessment of Simulated Water Balance from Noah, Noah-MP, CLM, and VIC Over CONUS using the NLDAS Test Bed. J. Geophys. Res. Atmos. 2014, 119, 751–770. [Google Scholar] [CrossRef]
  67. Cai, X.; Yang, Z.; David, C.; Niu, G.; Rodell, M. Hydrological Evaluation of the Noah-MP Land Surface Model for the Mississippi River Basin. J. Geophys. Res. Atmos. 2014, 119, 23–38. [Google Scholar] [CrossRef]
  68. Hong, S.; Park, S.K.; Yu, X. Scheme-Based Optimization of Land Surface Model using a Micro-Genetic Algorithm: Assessment of its Performance and Usability for Regional Applications. SOLA 2015, 11, 129–133. [Google Scholar] [CrossRef] [Green Version]
  69. Mckenna Neuman, C. Effects of Temperature and Humidity upon the Entrainment of Sedimentary Particles by Wind. Bound.-Layer Meteorol. 2003, 108, 61–89. [Google Scholar] [CrossRef]
  70. Gillett, D.A. Environmental factors affecting dust emission by wind erosion. In Saharan Dust; Morales, C., Ed.; Wiley: New York, NY, USA, 1979; pp. 71–94. [Google Scholar]
  71. Kawamura, R. Study of Sand Movement by Wind Translated. In Hydraulics Engineering Laboratory Report HEL 2.8; University of California: Berkeley, CA, USA, 1951. [Google Scholar]
  72. Kok, J.F.; Parteli, E.J.R.; Michaels, T.I.; Karam, D.B. The Physics of Wind-Blown Sand and Dust. Rep. Prog. Phys. 2012, 75, 106901. [Google Scholar] [CrossRef] [Green Version]
  73. Martin, R.L.; Kok, J.F. Wind-Invariant Saltation Heights Imply Linear Scaling of Aeolian Saltation Flux with Shear Stress. Sci. Adv. 2017, 3, e1602569. [Google Scholar] [CrossRef] [Green Version]
Figure 1. Time evolution of friction velocity (grey) and saltation flux (yellow) measured during the Japan-Australia Dust Experiment (JADE) project.
Atmosphere 11 00010 g001
Figure 2. The meteorological model domain.
Atmosphere 11 00010 g002
Figure 3. Comparison of the model-predicted and measured friction velocity values under different roughness length conditions.
Atmosphere 11 00010 g003
Figure 4. Locations of the 15 points selected for the model-observation comparison of soil moisture content: (a) MODIS land-use type for Gobi desert, grassland, and cropland; (b) locations of 15 points.
Atmosphere 11 00010 g004
Figure 5. Index of agreement of the soil moisture contents predicted using different land surface schemes and corrected with the compensation factors.
Atmosphere 11 00010 g005
Figure 6. Comparison of soil moisture obtained with different options for the top soil layer depth: (a) Soil moisture content; (b) soil moisture effect factor.
Atmosphere 11 00010 g006
Figure 7. Saltation flux curve-fitted as a function of friction velocity for four dust events during the JADE Project: (a) Dust event 1; (b) Dust event 2; (c) Dust event 3; (d) Dust event 4; (e) All dust event.
Atmosphere 11 00010 g007
Figure 8. Comparison of the two representative saltation schemes with observations when measured friction velocities were used: (a) for u t * = 0.2 m s−1; (c) for u t * = 0.24 m s−1; (e) for u t * = 0.28 m s−1; (b), (d) and (f) are scatterplots for (a), (c) and (e), respectively.
Atmosphere 11 00010 g008
Figure 9. Comparison of the two representative saltation schemes with observations when model-predicted friction velocities were used: (a) for u t * = 0.245 m s−1; (c) for u t * = 0.28 m s−1; (b) and (d) are scatterplots for (a) and (c), respectively.
Atmosphere 11 00010 g009
Table 1. Information on the domain and physics options set for WRF running.
Model AttributeWRFV3.8.1
Domain (Horizontal grid)Australia (74 × 61)
Horizontal resolution5 km
Land-use dataIGBP (International Geosphere-Biosphere Programme)-Modified MODIS (Modarate Resolution Imaging Spectroradiometer) 20-category
MicrophysicsWRF Single-Moment 6-class
Longwave radiationRRTMG (The Rapid Radiative Transfer Model for GCMs)
Shortwave radiationRRTMG
Land surfaceModified Noah-MP
Planetary Boundary layerYonsei University (YSU)
Cumulus parameterizationGrell-Devenyi
Initial dataNCEP FNL Operational Model Global Tropospheric Analyses (ds083.2)
Simulation period (Spin-up)15 February to 16 March 2006 (8-day)
Table 2. Sensitivity test conditions and the index of agreement (IOA) for the friction velocity predicted in each case.
CASELand-use TypeVegetation Fraction (%)Roughness Length (mm)Friction Velocity IOA
CASE 1Shrub land25.2513.610.55
CASE 2Barren land25.258.590.56
CASE 3Barren land2.000.480.61
Table 3. Information of the two soil moisture observation datasets used for the evaluation of the land surface schemes.
Contents
Analysis SiteEast AsiaAustralia
Observation dataSatellite dataMeasured field data
(SMAP L4 Global 9 km Surface and Rootzone Soil Moisture, topmost layer 5 cm)(Soil moisture content (topmost layer 0.2~2 cm) reported by Liu et al. (2018) and Shao et al. (2011))
Land surface schemeNoah, Noah-MP, Pleim-XiuNoah-MP
Period2016 (1-year)JADE project (2006.2.23~3.12, 18-day)
Table 4. Comparison of the soil moisture contents predicted using different land surface schemes with observations.
SchemeGobi_1Gobi_2Gobi_3Gobi_4Gobi_5
IOARIOARIOARIOARIOAR
Pleim-Xiu0.820.580.740.350.820.570.690.500.800.52
Noah0.550.490.530.250.540.640.510.520.490.19
Noah-MP0.780.680.810.520.850.750.810.480.720.38
SchemeGrass_1Grass_2Grass_3Grass _4Grass _5
IOARIOARIOARIOARIOAR
Pleim-Xiu0.730.390.780.430.670.500.490.610.650.62
Noah0.320.610.720.530.730.460.690.640.650.49
Noah-MP0.500.730.830.770.700.420.530.700.640.60
SchemeCrop_1Crop_2Crop_3Crop_4Crop_5
IOARIOARIOARIOARIOAR
Pleim-Xiu0.420.540.560.390.240.270.680.340.630.50
Noah0.630.590.450.390.480.310.520.590.580.46
Noah-MP0.690.610.640.420.620.360.630.590.700.45
Table 5. Threshold friction velocity of wet surface with nonerodible elements calculated under various surface conditions.
CASELand-Use TypeVegetation Fraction (%)Drag Partitioning Effect FactorSoil Moisture Effect FactorThreshold Friction Velocity (m/s)
CASE 1Shrub land25.253.43810 cm: 1.0790.781
1 cm: 1.0630.769
Correction 1 cm: 1.0560.764
CASE 2Barren land25.252.07410 cm: 1.0790.471
1 cm: 1.0630.464
Correction 1 cm: 1.0560.461
CASE 3Barren land2.001.11010 cm: 1.0790.250
1 cm: 1.0630.247
Correction 1 cm: 1.0560.245