Article

A Methodology for Verifying Cloud Forecasts with VIIRS Imagery and Derived Cloud Products—A WRF Case Study

1
Center for Space Research, The University of Texas at Austin, Austin, TX 78759, USA
2
Cloud Systems Research, Austin, TX 78748, USA
3
Institute for Meteorology, Universität Leipzig, 04109 Leipzig, Germany
*
Author to whom correspondence should be addressed.
Atmosphere 2019, 10(9), 521; https://doi.org/10.3390/atmos10090521
Submission received: 7 August 2019 / Revised: 7 August 2019 / Accepted: 3 September 2019 / Published: 5 September 2019
(This article belongs to the Special Issue Cloud Forecasts from NWP and Climate Models)

Abstract

:
A methodology is presented to evaluate the accuracy of cloud cover fraction (CCf) forecasts generated by numerical weather prediction (NWP) and climate models. It is demonstrated with a case study consisting of simulations from the Weather Research and Forecasting (WRF) model. In this study, since the WRF CCf forecasts were initialized with reanalysis fields from the North American Mesoscale (NAM) Forecast System, the characteristics of the NAM CCf products were also evaluated. The procedures relied extensively upon manually-generated, binary cloud masks created from VIIRS (Visible Infrared Imager Radiometry Suite) imagery, which were subsequently converted into CCf truth at the resolution of the NAM and WRF gridded data. The initial results from the case study revealed biases toward under-clouding in the NAM CCf analyses and biases toward over-clouding in the WRF CCf products. These biases were evident in images created from the gridded NWP products when compared to VIIRS imagery and CCf truth data. Thus, additional simulations were completed to help assess the internal procedures used in the WRF model to translate moisture forecast fields into layered CCf products. Two additional sets of WRF CCf 24 h forecasts were generated for the region of interest using WRF restart files. One restart file was updated with CCf truth data and another was not changed. Over-clouded areas in the updated WRF restart file that were reduced with an update of the CCf truth data became over-clouded again in the WRF 24 h forecast, and were nearly identical to those from the unchanged restart file. It was concluded that the conversion of WRF forecast fields into layers of CCf products deserves closer examination in a future study.

1. Introduction

The accuracies of cloud model predictions play critical roles in many real-time meteorological applications including air quality [1] and solar energy management [2] as well as a host of military and civilian aerodrome operations [3]. However, the verification of cloud model forecasts can be challenging [4], which has led the WMO (World Meteorological Organization) to recommend methods for evaluating clouds and related parameters [5].
In an earlier publication, new procedures that conform to these WMO recommendations were presented. They exploit remotely-sensed satellite imagery and derived cloud data products in the quantitative assessment of clouds in datasets commonly used in numerical weather prediction (NWP) and climate modeling [6]. The procedures were applied to quantitatively assess cloud model performance of lower-level water clouds. That study focused on these clouds because they play a critical role in cloud feedbacks, which have been identified as the leading source of spread in estimates of climate sensitivity [7,8]. The procedures relied extensively upon manually-generated cloud/no cloud (MGCNC) masks created from satellite imagery as the basis for establishing cloud cover fraction (CCf) truth or CCftruth data. In the application that was demonstrated, CCftruth was derived from imagery collected by the VIIRS (Visible Infrared Imager Radiometry Suite) sensor flying on the NASA/NOAA (National Aeronautics and Space Administration/National Oceanic and Atmospheric Administration) Suomi NPP (National Polar-orbiting Partnership) mission. The procedures were applied to reanalysis fields created from the North American Mesoscale (NAM) Forecast System and simulations generated with them using the Weather Research and Forecasting (WRF) model. In essence, VIIRS imagery and cloud data products derived from them were temporally and spatially collocated within NAM gridded fields to identify grid cells for comparison against the CCftruth data. VIIRS cloud phase products, quality controlled using color-composites of VIIRS imagery, were used to ensure only lower-level water clouds were considered in the match-up data sets. Comparisons between NAM CCf or CCfNAM and the CCftruth data, created from the VIIRS imagery for the case study presented, revealed a bias toward under-clouding in the NAM re-analysis data [6]. An in-depth analysis of the WRF cloud forecast products was not completed at that time.
Therefore, the focus of this study is a more detailed analysis of the WRF cloud cover fraction (CCfWRF) forecast characteristics of lower-level water clouds, for the same case study of 18–19 September 2014. The initial CCfWRF results presented below, suggest a tendency for WRF to over-specify clouds compared to CCftruth. Since WRF cloud forecasts are predicted at each vertical layer in the model and then composited into a total cloud cover for a given grid point while CCfNAM is a single-valued parameter at each grid point in the dataset, additional tools were needed to investigate the internal WRF model logic that translates forecast moisture parameters in the layered CCfWRF fields. To support this analysis, it also became necessary to evaluate the cloud spin-up characteristics of the WRF model to ensure the reliability of CCfWRF forecasts, which is highlighted in Section 2 along with an overview of the study domain and data used in the WRF simulations. In Section 3, procedures to match-up VIIRS cloud products with CCfNAM and CCfWRF data are presented along with initial results from comparisons between CCftruth, CCfNAM, and CCfWRF data. In Section 4, the techniques used in this analysis are presented to characterize and update CCfWRF data products in a WRF restart (WRFrst) file. Comparisons between CCftruth and CCfWRF data created from simulations based upon the modified and unmodified WRFrst files are also shown. A summary is provided in Section 5 along with implications for future research.

2. Data Sources

Since characteristics of the datasets and procedures used in this research were reported earlier [6], they are only briefly highlighted here. However, methods of exploiting these datasets are covered in greater detail to describe new procedures developed for this study.

2.1. NAM Analysis Fields

A number of datasets have been developed by NCAR (the National Center for Atmospheric Research) for use as input in the WRF Preprocessing System (WPS) including the NAM datasets, which can be downloaded from the NCAR Research Data Archive (RDA) website: http://www2.mmm.ucar.edu/wrf/users/download/free_data.html. Different cycles of NAM (ds609.0) datasets were used to initialize WRF in this study as discussed in Section 2.3. NAM data archived at the NCAR RDA cover the continental United States at a 12 km spatial resolution every six hours, continuously from 0000 UTC on January 1, 2012. Variables contained in the ds609.0 datasets are shown at the NCAR RDA website: http://rda.ucar.edu/datasets/ds609.0/. These NAM data include a total cloud cover fraction (CCfNAM) variable that can be compared to collocated CCftruth data generated from VIIRS data, as discussed in Section 3.2. A graphic of the NAM region of interest is shown in Figure 1 along with the general area where VIIRS satellite data are temporally and spatially coincident with these data.

2.2. VIIRS Satellite Data

The VIIRS imagery and cloud data products used in this study were collected by the NASA NPP spacecraft that was launched on 28 October 2011. The satellite is in a sun-synchronous, near-circular polar orbit at an altitude of 824 km with an inclination of 98.74 deg, which creates a period of 101 min. The satellite ascends, heading north, across the equator at about 13:30. http://database.eohandbook.com/database/missionsummary.aspx?missionID=413. The VIIRS sensor collects data in 22 spectral bands between about 0.4–12.0 µm. At nadir, the cross-track scanning sensor captures imagery (375 m or high resolution) data and radiometric (750 m or moderate resolution) data. The resolution of both types of data increases by a factor of 2 as the VIIRS sensor scans from nadir to the edge of its 3000 km data swath. Comprehensive details about the VIIRS instrument design have been published [9]. An overview can be found at http://database.eohandbook.com/database/instrumentsummary.aspx?instrumentID=412.
VIIRS clouds products are created at the NASA NPP ground processing segment, including the VIIRS cloud mask (VCM) product that contains both cloud mask and cloud phase analyses [10,11], which were used extensively in this research. These VIIRS products are available via the NOAA (National Oceanic and Atmospheric Administration) CLASS (Comprehensive Large Array-data Storage System) server: https://www.bou.class.noaa.gov/saa/products/catSearch. The performance characteristics of the VCM algorithms, which create cloud confidence and cloud phase products at a horizontal cell size (HCS) of the VIIRS moderate resolution data [9] are well documented [12,13,14]. VIIRS images are used to create manually-generated cloud/no cloud (MGCNC) masks, which becomes the basis for the CCftruth data as demonstrated in Section 3.2, using procedures that have been well documented [9,13,15].
Figure 1 shows the approximate location of the VIIRS granules used in this case study. Two sets of VIIRS imagery were used. The first consists of VIIRS data collected at approximately 1800 UTC on 18 Nov 2014 while the second set was collected approximately 24 h later. The VIIRS observation time interval for 18 Nov 2014 data ranged from 1813 to 1820 UTC over the WRF region of interest. These data were used to create the CCftruth data needed to assess and update cloud fields in a WRFrst file valid at 1800 UTC on this date. The observation times for the second set of VIIRS granules, which were used to quantitatively assess the CCfNAM data and to verify the WRF cloud terminus forecasts valid at 1800 UTC on 19 Nov 2014, ranged from 1757 to 1803 UTC over the region of interest. These data were also used to evaluate the cloud spin-up characteristics of the WRF model as discussed in the next section. Imagery from the two sets of VIIRS data are further discussed in Section 3.2.

2.3. WRF Simulations

Five relatively short-range (6–24 h) forecasts were generated using WRF ver. 3.7.1 from different cycles of the NAM data. The first three sets of simulations were used to assess the cloud spin-up characteristics of the WRF model while the remaining simulations were used first to evaluate clouds in the WRFrst file and then to assess the utility of assimilating VIIRS cloud products into the final WRF forecast, sometimes called the WRFout file. Key parameters used in these WRF simulations are summarized in Table 1. No nesting was used in the simulations. The WRF model was configured to create restart files every six hours. The WRFrst file contains all the information needed to restart a simulation while the final WRFout file does not. Thus, WRFrst was considered as an intermediate forecast while the WRFout files were considered for the terminus forecast files.
In the WRF system, QCLOUD (i.e., liquid water mixing ratio (LWMR)) is converted into cloud fractional coverage at each WRF output (eta or pressure) level, as described by Equation (4) in Xu and Randall [16]. Total cloud fractional coverage can then be derived from the cloud fractional cover layers using different methods as described by the Unified Post Processing (UPP) User’s Guide, [17,18,19,20]. Since this study focuses on single-layered water clouds in the truth data, ideally the values for layered cloud cover fraction and total cloud cover fraction in WRF should be the same. However, that was not always found to be the case.
In the first phase of this study, three cycles of NAM data were used to generate WRF forecasts of variable length with each terminating at 1800 UTC on 19 Nov 2014. These simulations were used to examine the cloud spin-up characteristics of the WRF model. The WRF forecast length and NAM datasets used for these simulations were: a 24 h forecast from NAM data at 1800 UTC on 18 Nov 2014, a 12 h forecast from NAM data at 0600 UTC on 19 Nov 2014, and a 6 h forecast from NAM data at 1200 UTC on 19 Nov 2014. Comparisons between CCfWRF and CCftruth data for each simulation provide insight into the cloud spin-up forecast characteristics of the WRF model. (Note that the VIIRS data are within ± 3 min of the WRF forecast valid time, i.e., 1800 UTC on 19 Nov 2018.) Comparisons between these WRF forecasts and the manually-generated cloud truth from VIIRS imagery, revealed (results not shown) that all key cloud features present in the 24 h forecast were captured in the 6 h forecast, including the lower-level water clouds. Therefore, it was determined sufficient that the second set of WRF forecasts, valid at 1800 UTC on 19 Nov 2014, be generated from NAM data at 1200 UTC on the same date in order to ensure cloud and moisture levels were not deficient in the WRFrst file.
Thus, for the second phase of the study, a WRFrst file valid at 1800 UTC on 18 Nov 2014 was created from the 1200 UTC NAM data. This WRFrst file was analyzed extensively, as noted in Section 4.3, using results from the CCftruth data on 18 Nov 2014. A copy of this WRFrst file was then modified using procedures outlined in Section 4.2. Subsequently, two additional WRF simulations, of 24 h forecast length, were generated based upon the modified and unmodified WRFrst files using the settings listed in Table 1. The results from these simulations were then compared to the corresponding set of VIIRS CCftruth data, valid between 1757–1803 UTC on 19 Nov 2014, to further evaluate the cloud products generated by the WRF model.

3. Methods and Procedures

3.1. Generating VIIRS and NAM(WRF) Match-Up Data

VIIRS moderate resolution data were temporally and spatially collocated with the NAM (WRF) gridded data to identify regions that contain either cloud-free or single-layered water clouds. These procedures were applied first with the NAM profile datasets to characterize CCfNAM and again with the CCfWRF forecasts generated by WRF from the NAM data to characterize model cloud forecast performance. First, an extended bow-tie trim was applied to the VIIRS data to reduce any overlapping pixels that occur toward the edge of the VIIRS scan. The NAM (WRF) data were mapped to a Lambert Conformal projection where the data were essentially equally spaced. An N × M grid was established with the NAM (WRF) data at the center of each grid. VIIRS data were matched to the NAM (WRF) grid by mapping the VIIRS data into the same projection and calculating the NAM (WRF) grid index into which it falls. VIIRS data outside the bounds of the NAM (WRF) grid and NAM (WRF) grid cells not containing VIIRS data were eliminated for further analyses. Next, temporal and spatial restrictions were applied to the VIIRS data. In general, scan times of the VIIRS data were checked to include only those that fall within ± 30 min of NAM analysis or WRF forecast times. However, as mentioned earlier, the temporal differences between match-up datasets used in this study were much smaller. Distances from the grid center were calculated using the Vincenty formula to identify every VIIRS cloud product within 6.5 km of each 12 km NAM (WRF) grid center. The VIIRS cloud products were then used again to identify occurrences where only cloud-free and/or single-layered water clouds exist in the match-up data, since this phase of the research was focused on these types of clouds as previously noted. Cloudy and cloud-free pixels were identified in a binary, manually-generated cloud/no cloud (MGCNC) mask product [14,15], which is derived from the moderate resolution VIIRS imagery. The process of generating this mask is discussed in the next section. The cloud phase product, created by the VCM algorithm and quality controlled with VIIRS imagery, was used to establish the cloud top phase of the pixels in the cloud truth product. NAM (WRF) grid locations found to contain any ice clouds or mixed phase clouds were excluded from further analysis with only pixels containing clear pixels, low-level water clouds or their combination remaining. Finally, a 12 km resolution CCftruth was determined by calculating the mean of the MGCNC data matched to each cell. This CCftruth was used to quantify CCfNAM and CCfWRF performance in the match-up data.

3.2. Generating VIIRS Mean Cloud Cover Fraction Truth Data

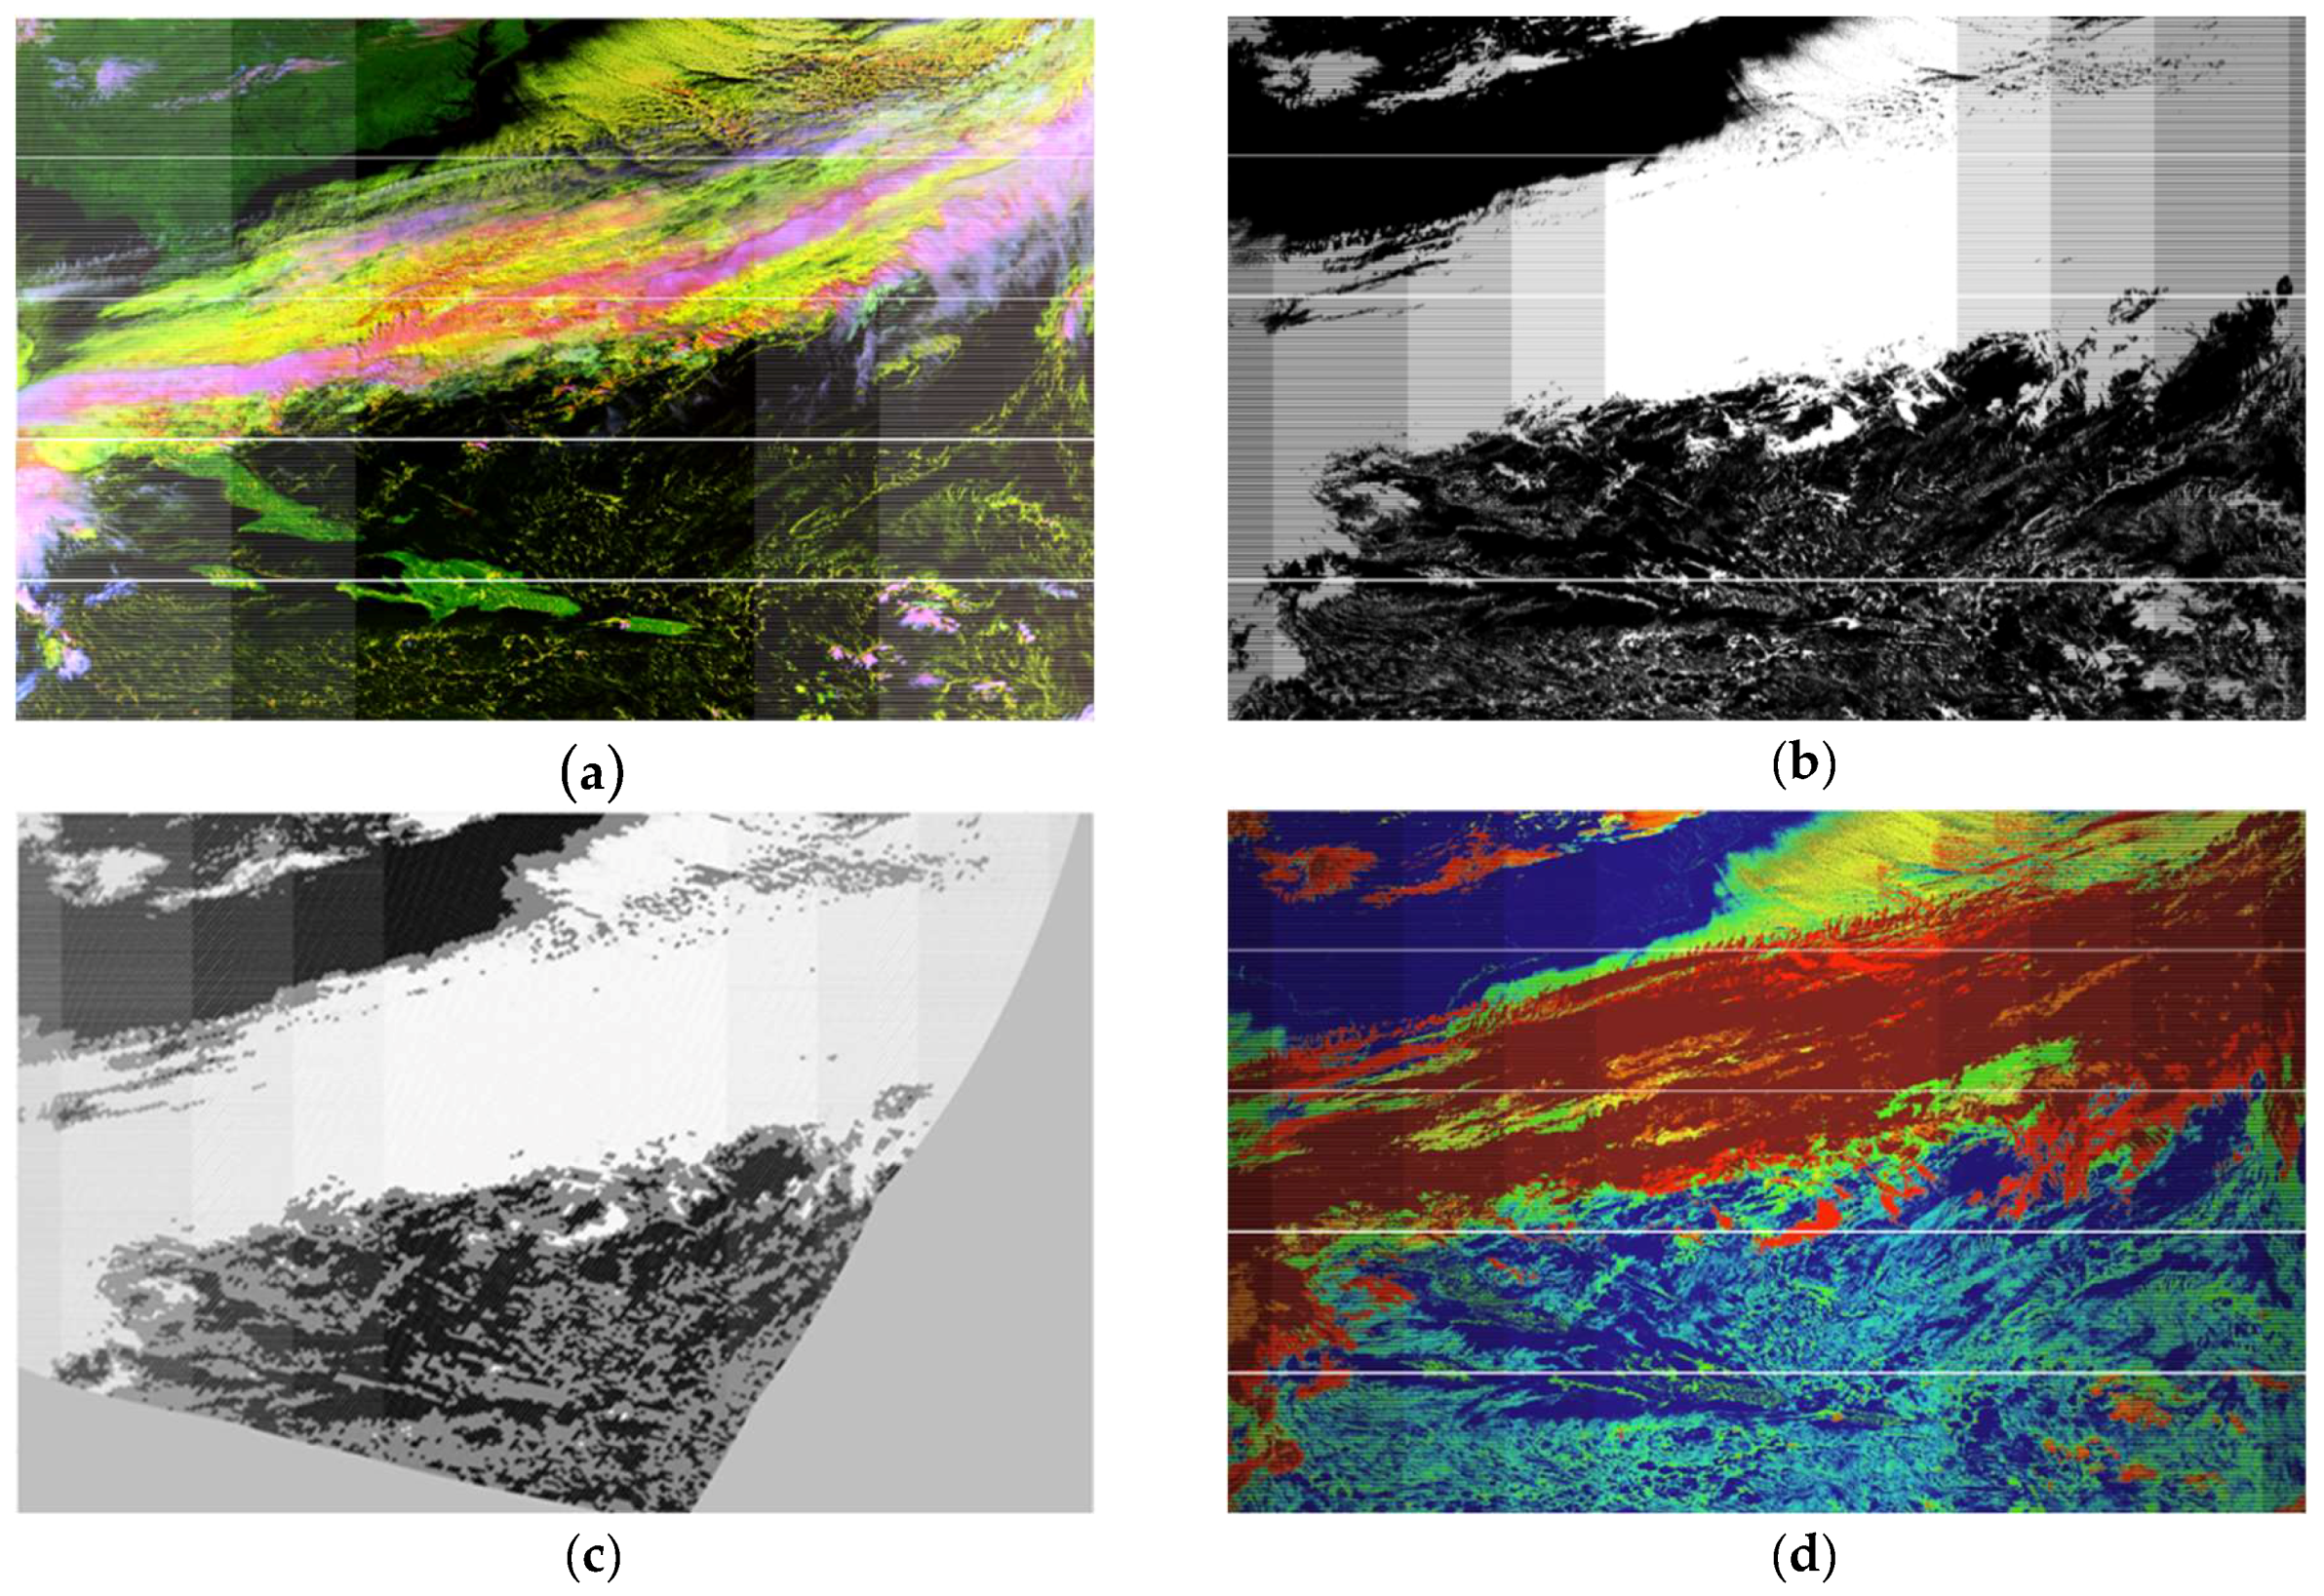
VIIRS mean cloud cover fraction was derived from the MGCNC data product. This (offline) process of generating the MGCNC data product is demonstrated with the VIIRS imagery used to construct the VIIRS-WRF match-up data at 1800 UTC on 19 Nov 2014. First, color composites of the VIIRS data for the set of granules collected between 1757–1803 UTC on 19 Nov 2014 are shown in Figure 2a. The corners of this set of images have the following latitude/longitude pairs starting with the upper-left corner and proceeding clockwise: 35° 36′ N, 91° 18′ W; 40° 48′ N, 56° 43′ W; 16° 06′ N, 53° 48′ W; 11° 54′ N, 81° 48′ W. Spaces are inserted between the granules to emphasize granule boundaries. The color composites are created by placing the 0.65 µm VIIRS (M5) channel in the red gun of the display, the 1.6 µm (M10) channel in the green gun and the 1.38 µm (M9) band in the blue gun [21]. In this display, water clouds appear yellow, thin ice clouds blue and thick ice clouds purple. See Chapters 6 and 7 in Hutchison and Cracknell for more examples of cloud and background signatures in false color composites [9]. Land appears green, snow (if present) is red, and the ocean black. The south-eastern coast of the USA is clearly visible in the color composite images as are the islands of Cuba, Haiti, the Dominican Republic and Puerto Rico.
The manually-generated cloud/no cloud (MGCNC) masks are based upon binary analyses of the moderate resolution VIIRS granules [9,15]. Figure 2b contains the binary MGCNC for the 19 Nov 2014 imagery shown in Figure 2a, where white is cloud and black is cloud-free. A similar truth analysis for one of the VIIRS granules collected on 18 Nov 2014 is shown in Figure 2 of Hutchison et al. [6]. This MGCNC mask was then converted into a mean cloud cover fraction truth (CCftruth) dataset by aggregating it into the 12 km NAM (WRF) grid projected as shown in Figure 2c. (Note that in this image, only the intersection of the NAM and VIIRS region is shown.) The cloud-filled grids are white while the cloud-free grids are black. Grids with CCf values in the 10–90% range are assigned the middle shade of gray and can be seen to contain water clouds through comparisons with the clouds found in the false color image shown in Figure 2a. In this study, a cloud phase restriction was enforced and the MGCCf truth data became the CCftruth for low-level water clouds after the MG-CCftruth data were further merged with the VCM cloud phase analysis, similar to the one shown in Figure 2d. This particular cloud phase analysis revealed that the scene contains relatively few water clouds (green) compared to ice clouds (red, brown, and orange) and mixed phase clouds (yellow). Partly cloudy (light blue) pixels indicate sub-pixel water clouds, since this condition is determined from a spatial test of VIIRS 0.65 µm imagery resolution (375 m) data that is applied only over oceans backgrounds [10]. This same test does not detect sub-pixel (optically thin) ice clouds, which are (1) highly transparent at this wavelength and (2) readily detected and identified using the M9 band.
Quality control of the MGCNC data occurs at several stages in the process. First, color composites are essential to differentiate between cloudy and cloud-free surfaces and to understand the phase of cloud features in the scene. For the case shown in Figure 2a, scene interpretation, i.e., understanding which pixels are cloud-contaminated and which are not, is easy with VIIRS data under most global, daytime conditions. However, the task can become daunting under some conditions, e.g., during polar night-time conditions when thermal contrasts between clouds and backgrounds can be very small and no reflectance data are available [22]. Thus, a thorough understanding of the scene content is the starting point for making the MGCNC analysis. Secondly, several color composites are useful to discriminate between water-clouds and those containing ice particles. In Figure 2a, lower-level water clouds appear yellow since they are highly reflective in the M5 band (red gun) and M10 band (green gun) but reflect much lower in the M9 band (blue gun). Similarly, thin ice (cirrus) clouds are blue since they reflect highest in the M9 (blue gun) compared to the other channels in the composite, while thicker ice clouds appear purple since they can be highly reflective in the M9 band (blue gun) and M5 band (red gun) but have a low reflectance in the M10 (green gun). Middle level water clouds in this display may appear a shade of gray because they are reflective in all three of the display bands. Replacing the M9 band in Figure 2a with the VIIRS M15 band (12.0 µm), inverted to show colder objects as lighter than warmer objects, provides information on cloud top temperatures, which assists in separating lower-level water clouds from higher-level water clouds. In the color combination using the M15 band (not shown) water clouds with colder temperatures have an orange hue compared to the warmer low-level water clouds, which would appear yellow to gray. If additional insight is needed, a gray-scale image of the VIIRS M9 band is useful to accentuate thin cirrus clouds along with higher level water clouds since the 15 nm wide M9 band (see Table 4.4; Hutchison and Cracknell [9]) is centered on a strong water vapor absorption line (see Figure 4.9; Hutchison and Cracknell [9]) that suppresses the signatures of lower-level clouds under most global atmospheric moisture conditions [15,23,24].

3.3. Clouds in the NAM Dataset

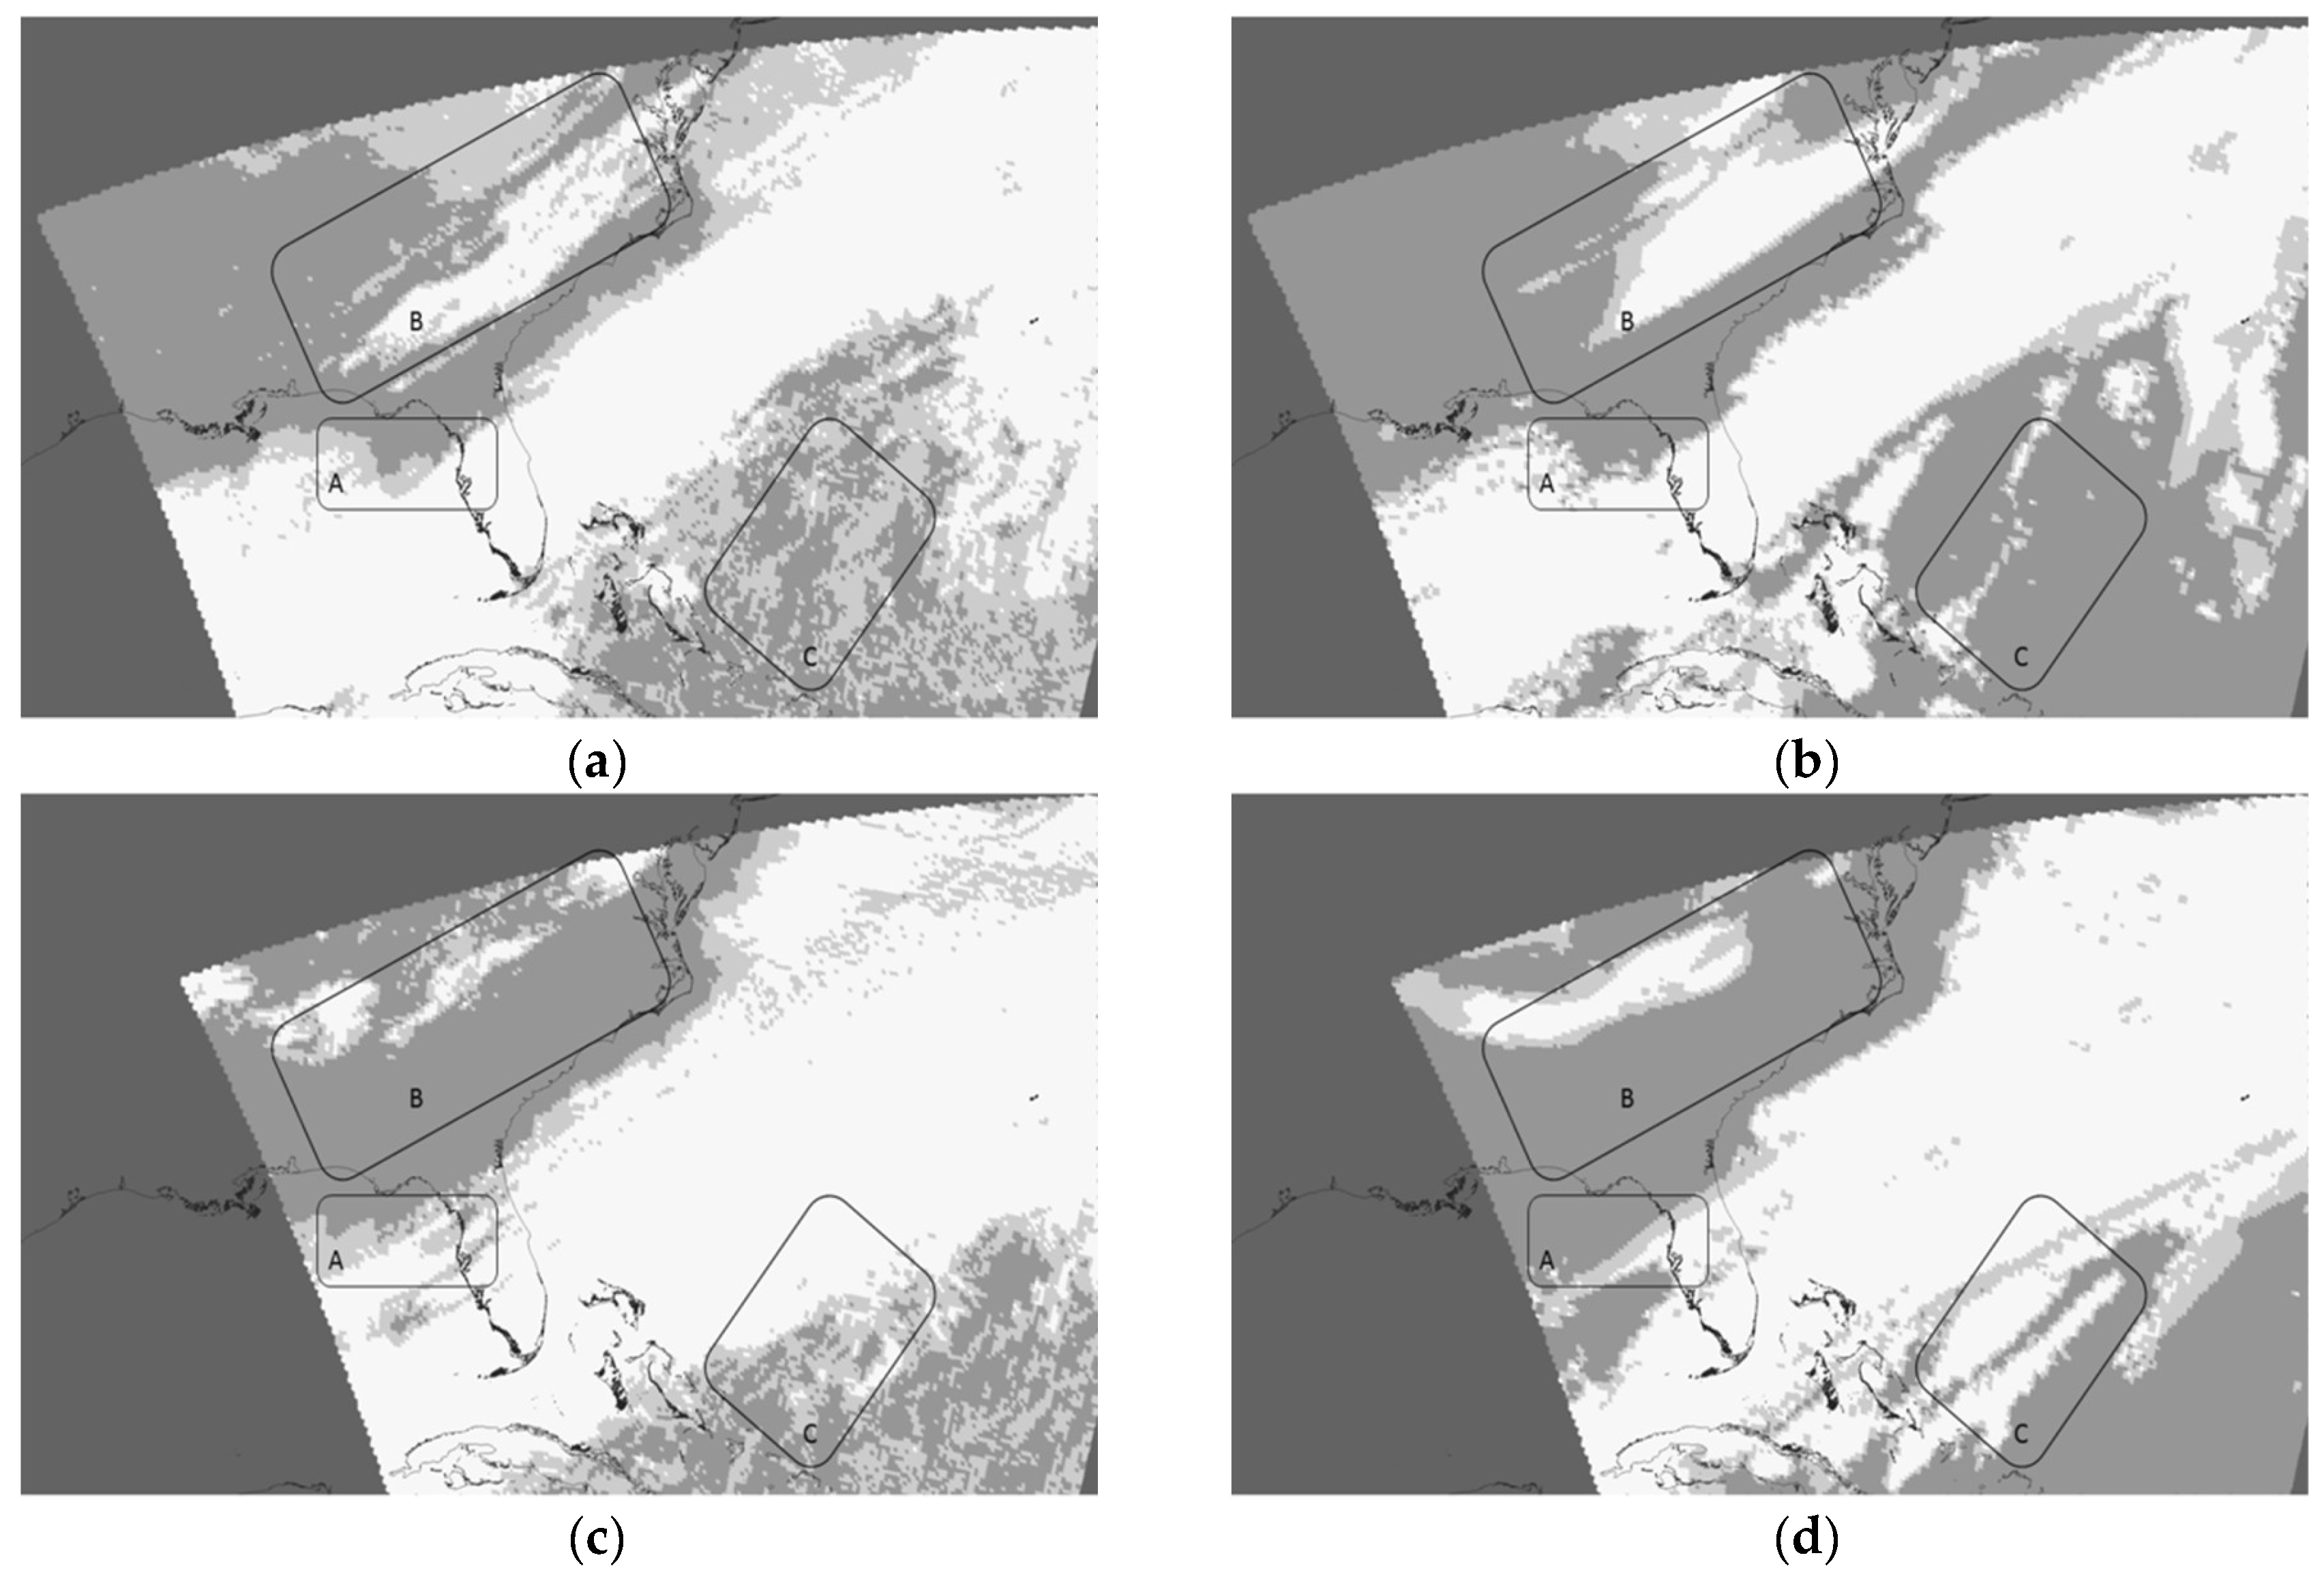
Figure 3 shows qualitative comparisons between the CCfNAM values for all clouds, i.e., all cloud phases contained in the ds609.0 datasets on 18 and 19 Nov 2014 at 1800 UTC and the CCftruth data created from the MGCNC images of the collocated VIIRS data collected on the same dates. These data were projected into the WGS 84 (World Geodetic System 1984) reference frame and show only those regions of the NAM/VIIRS grid intersections. The 18 Nov 2014 NAM data were used to generate the initial WRF simulations, discussed in the next section, using settings listed in Table 1. In all images shown in Figure 3, coastlines are black followed by mostly cloud-free conditions (<10%) which are darker gray (as shown in most regions between areas A and B), partly cloudy conditions (10–90%) which are lighter gray (as best seen in the lower-right corner of Figure 3a) with cloudy grids (>90%) in white, as most evident along the prominent frontal boundary extending from the upper right toward the lower-left in each figure. As noted previously, partly cloudy pixels, in general, may be considered lower-level water clouds, which can be confirmed by comparing them with the water cloud pixels found in the color image shown in Figure 2a. Comparisons, between Figure 3a (based upon the MGCNC cloud mask mapped to the NAM grid) and Figure 3b (CCfNAM for all clouds in the intersection of the NAM and VIIRS dataset) showed NAM under-clouds the lower-level water clouds (i.e., middle gray shade) in areas A, B, and especially in area C. Similar results are found in Figure 3c,d for the NAM and CCftruth images, respectively, on 19 Nov 2014 at 1800 UTC.
Table 2 shows quantitative results for matchups of NAM grids at 1800 UTC on 19 Nov 2014 that contain only lower-level water clouds in the VIIRS data collected between 1757–1803 UTC. These data are presented in a format similar to those shown earlier for the 18 Nov 2014 timeframe [6], i.e., they are binned in 10% mean CCftruth intervals (column 2). With an additional bin for 100% CCftruth, there are 11 CCftruth bins (column 1). The performance metrics, shown in column 3, include the total number of VIIRS-NAM matchups for each bin (counts) contained in the CCftruth data, along with the mean and standard deviation. Column 4 shows the performance statistics for the CCfNAM data while column 5 shows similar results for the CCftruth data. The results revealed similar biases toward under-clouding in the NAM data for single-layered, lower-level water clouds, as was reported in the earlier study [6]. For the most cloud-free bin (0 ≤ CCftruth < 10), the mean CCfNAM is within the 0 to 10% CCftruth bin range at 8.0% but higher than the mean CCftruth, which is 1.6%. For the remaining CCftruth bins, the CCfNAM mean values appear to be about 60% less than the CCftruth mean values in all the bins except for bins 2 and 11 where mean CCfNAM values are about 40% of the mean CCftruth values. The standard deviations for CCfNAM results are also substantial, which suggests the NAM data are composed largely of completely cloudy and cloud-free CCf values, i.e., the data tend not to capture the smaller-scale clouds that are present in the VIIRS imagery. When the CCftruth equals 100%, the CCfNAM is 63.1% and the standard deviation is 43.5%.
For the two datasets used in this case study, NAM data appear to lack skill in analyzing lower-level water clouds across the full range of cloud cover fraction. Thus, it is reasonable to assume that WRF would under-predict these clouds in simulations based upon NAM these datasets. However, just the opposite was found to occur and this is discussed in the next section.

3.4. Cloud Cover Fraction in the Initial WRF Simulations

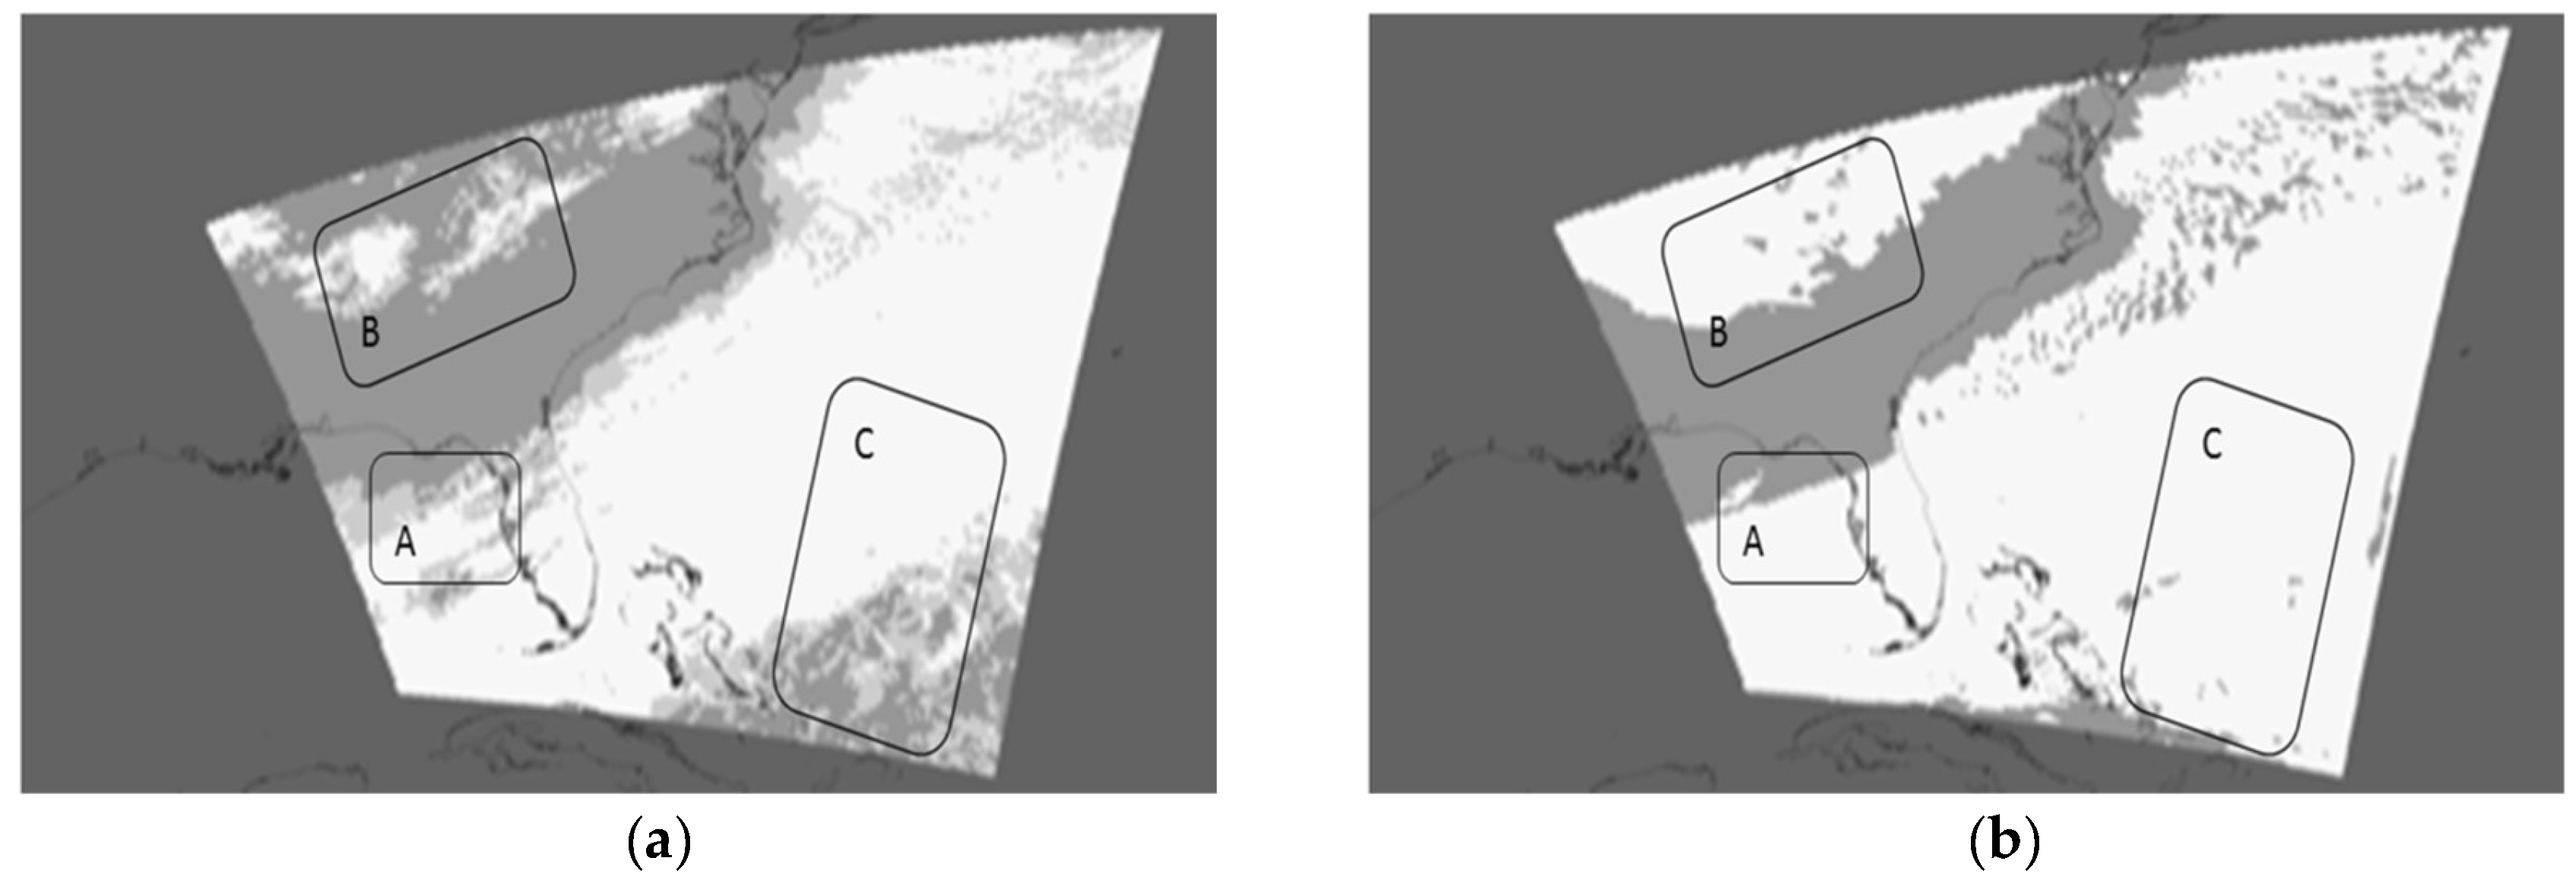
A baseline 24 h WRF simulation was generated from the NAM dataset valid at 1800 UTC on 18 Nov 2014; thus, making the WRF forecast terminus 1800 UTC on 19 Nov 2014. The results of that simulation are shown qualitatively in Figure 4, which contains the mean CCftruth data in Figure 4a,b shows the CLDFRAmax (i.e., WRF maximum cloud cover fraction at any single eta level in the WRF profile for a given grid point). The WRF CLDFRAmax represents a minimum of the total CCfWRF value at each WRF grid point since stacking of multiple cloud layers is not taken into consideration. In this case, the mean CCftruth data was created by mapping the MGCNC cloud mask from VIIRS imagery, as shown in Figure 2b, into the WRF grid. The VIIRS imagery has an observation time between 1757–1803 UTC on 19 Nov 2014. Figure descriptions are identical to those used in Figure 3. Again, all partly cloudy pixels are lower-level water clouds as confirmed by examining the yellow pixels in the color image shown in Figure 2a. The qualitative results in these data clearly show that WRF generates substantially more fully cloudy grids but fewer partly cloudy grids than were found in the CCftruth data. In addition, WRF generates extensive areas of cloudy conditions in Areas A, B, and C in grids that are less cloudy in the CCftruth data. The reason for this over-prediction of cloudy grids by the WRF model in this case study, in light of the fact that NAM data was found to underspecify clouds in the image of the CCfNAM data, warrants additional analyses; this is highlighted in the next section.

4. Evaluating the WRF Moisture to Cloud Conversion Process

4.1. Background

A simple experiment was undertaken to input lower-level water clouds from the CCftruth data into a WRFrst file, in order to help better evaluate the moisture to cloud conversion process used in the WRF model. It was postulated that improved WRF CLDFRAmax data fields might be achieved in the terminus forecast by initializing the WRF model with more accurate cloud cover fraction data from the truth dataset. The approach follows operational cloud forecasting techniques employed for decades at the United States Air Force (USAF) Weather Central and involves a concept known as “bogusing”. The bogusing concept relies upon the use of satellite imagery to quality control the clouds at some intermediate time, by adding or removing clouds from the forecast fields based upon those observed in the satellite imagery before restarting the forecast model. This bogus process has been described in the literature [25,26].
The bogusing experiment requires a thorough examination of the atmospheric profiles in the WRF eta level coordinate system, i.e., to avoid interpolations of moisture from eta into pressure coordinates or vice versa, and to ensure clouds are bogused at the correct eta level. It also requires some knowledge of cloud spin-up time in the WRF model to ensure any changes to a WRFrst file are allocated time to reach equilibrium in the next forecast cycle, since CCftruth was used to update a WRF simulation based upon an earlier NAM data set. Thus, in the bogusing approach used herein, a WRFrst file was created from the WRF simulation that was initialized from a NAM data set at 1200 UTC on 18 Nov 2014. The simulation generated two WRFrst files valid at 1800 UTC on the same date, which were evaluated using the CCftruth data set. Cloud fields in one WRFrst file were then bogused while those in the other WRFrst file were unchanged. Results based upon the unchanged WRFrst file were used to establish the baseline. The WRF simulations were restarted to reach a terminus point at 1800 UTC on 19 Nov 2014 where another CCftruth data set was used to quantify the forecast performance of both WRF simulations, i.e., using the baseline (unmodified) and bogused WRFrst files.

4.2. WRF Forecast Parameters to Cloud Conversion Procedures

As noted above, in the WRF system, QCLOUD (i.e., LWMR) is converted into cloud fractional coverage at each WRF eta level using Equation (4) of Xu and Randall [16]. Therefore, the procedures developed to bogus VIIRS clouds into the WRFrst file employ an inversion of the Xu and Randall equation using the WRF relative humidity data along with CCftruth as the parameter to bogus the QCLOUD variable in the WRFrst file. Thus, in this bogus process, the Xu and Randall relationship is inverted to solve for QCLOUD given CCftruth and relative humidity from the WRF profiles, as shown in Equation (1):
QCLOUD = (b/α0) ln [1/(1 − CCftruth/rhk)]
where rh (relative humidity) < 1.0 and b, α0, and k are empirically determined constants. The inversion uses the following procedures:
  • First, the eta-level of the maximum cloud cover fraction (CLDFRAmax) in the WRF restart file cloud (CCfWRFrst) is located for a given WRF grid. Then a decision is made to bogus the QCLOUD field for each grid that contains only a single-layered water cloud. (Note: all analyses are conducted on the WRFrst file eta-levels to avoid interpolations of moisture fields onto standard pressure levels.)
  • Next, the temperature, pressure and relative humidity at the eta-level of the clouds are retrieved from the WRF data.
  • Finally, CCfWRFrst, calculated from the Xu and Randall Equation (4), is replaced by CCftruth and the updated QCLOUD (QCLOUDnew) is calculated for the eta-level using Equation (1). The WRFrst file is updated for that grid by replacing CCfWRFrst with CCftruth while QCLOUD is replaced with QCLOUDnew at the eta-level.

4.3. Identifying Grids for Bogusing in the WRF Restart File

Figure 5 shows comparisons between CCftruth and CCfWRFrst (i.e., CLDFRAmax) results with cloud legends identical to those in Figure 3. Figure 5a contains the mean CCftruth for all clouds in the VIIRS data on 18 Nov 2014 after mapping the MGCNC image to the WRF grid. Figure 5b displays the CLDFRAmax value in all eta levels for each grid location in the baseline WRFrst file which is valid for 1800 UTC 18 Nov 2014 from a WRF simulation initialized with a NAM dataset at 1200 UTC 18 Nov 2014.
The images in Figure 5a,b show two key deficiencies in the WRF simulations. First, the CLDFRAmax values tend to be binary, as expected based upon the results shown in Section 3.4. Far fewer WRFrst grids contain clouds in the lighter gray shade in Figure 5b, i.e., within the 10–90% CCf range, than are found in the CCftruth image (Figure 5a). Table 3 quantifies the difference between the CCftruth values and those in the CLDFRAmax image created from the WRFrst file. Binary cloud fields account for 99.5% of the forecasts in the CCfWRFrst file while they account for only 76.9% of the grids in the CCftruth image. Secondly, the WRFrst file contains too many clouds, i.e., the model over-clouds the low as well as high level clouds in most regions of the scene. For example, over-clouding in the WRFrst file is seen in the stratocumulus fields (Area A) over the Gulf of Mexico, in most areas over the southeastern-eastern US landmass (Area B), and over the open Atlantic Ocean area northeast of Cuba (Area C). Thus, matchups that contain lower-level water clouds, which appear as the middle gray shade in Figure 3a and Figure 5a, become key candidates for update (bogusing).

4.4. WRF Simulation Results with Baseline and Updated WRF Restart Files

Therefore, an update was made to the WRFrst file using the procedures described above. After this update, another image was generated of all cloud fields in the WRFrst file using the CLDFRAmax from each WRF profile. That image is shown in Figure 5c. It is evident that clouds in the updated WRFrst file are in better agreement with those in Figure 5a than was found in the unmodified WRFrst file in Figure 5b, although Figure 5c still contains far too many clouds compared to the truth image.
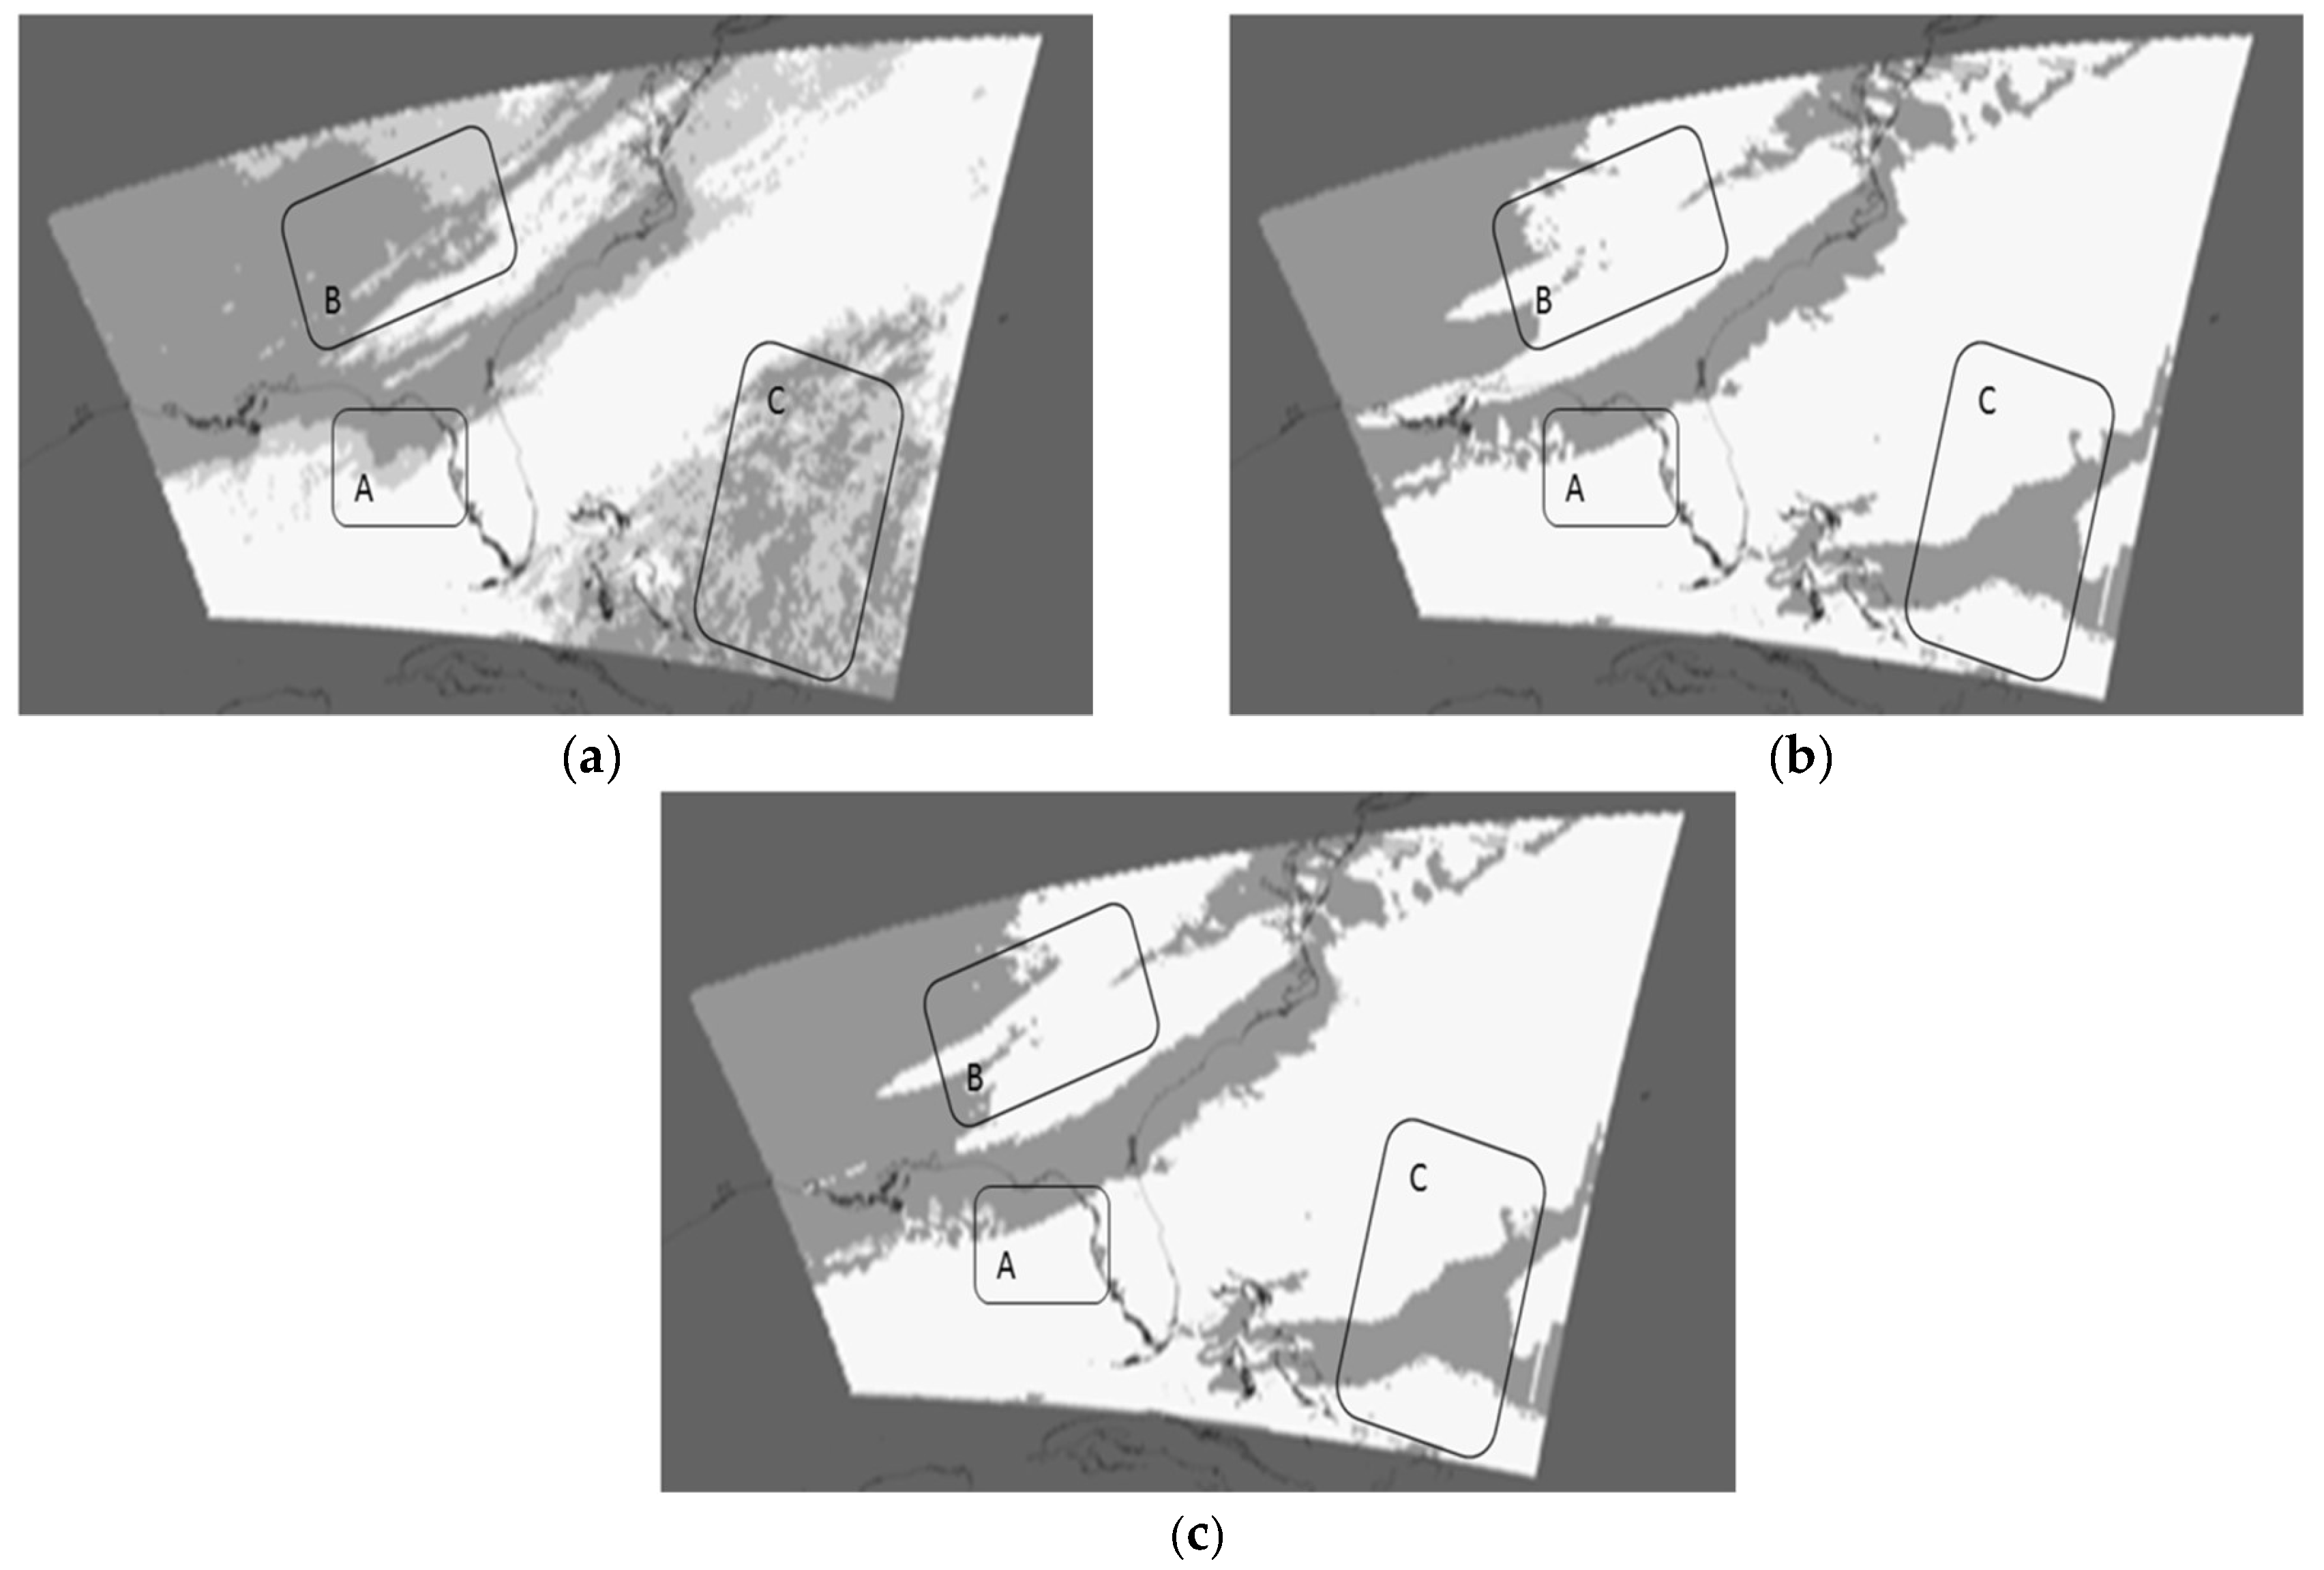
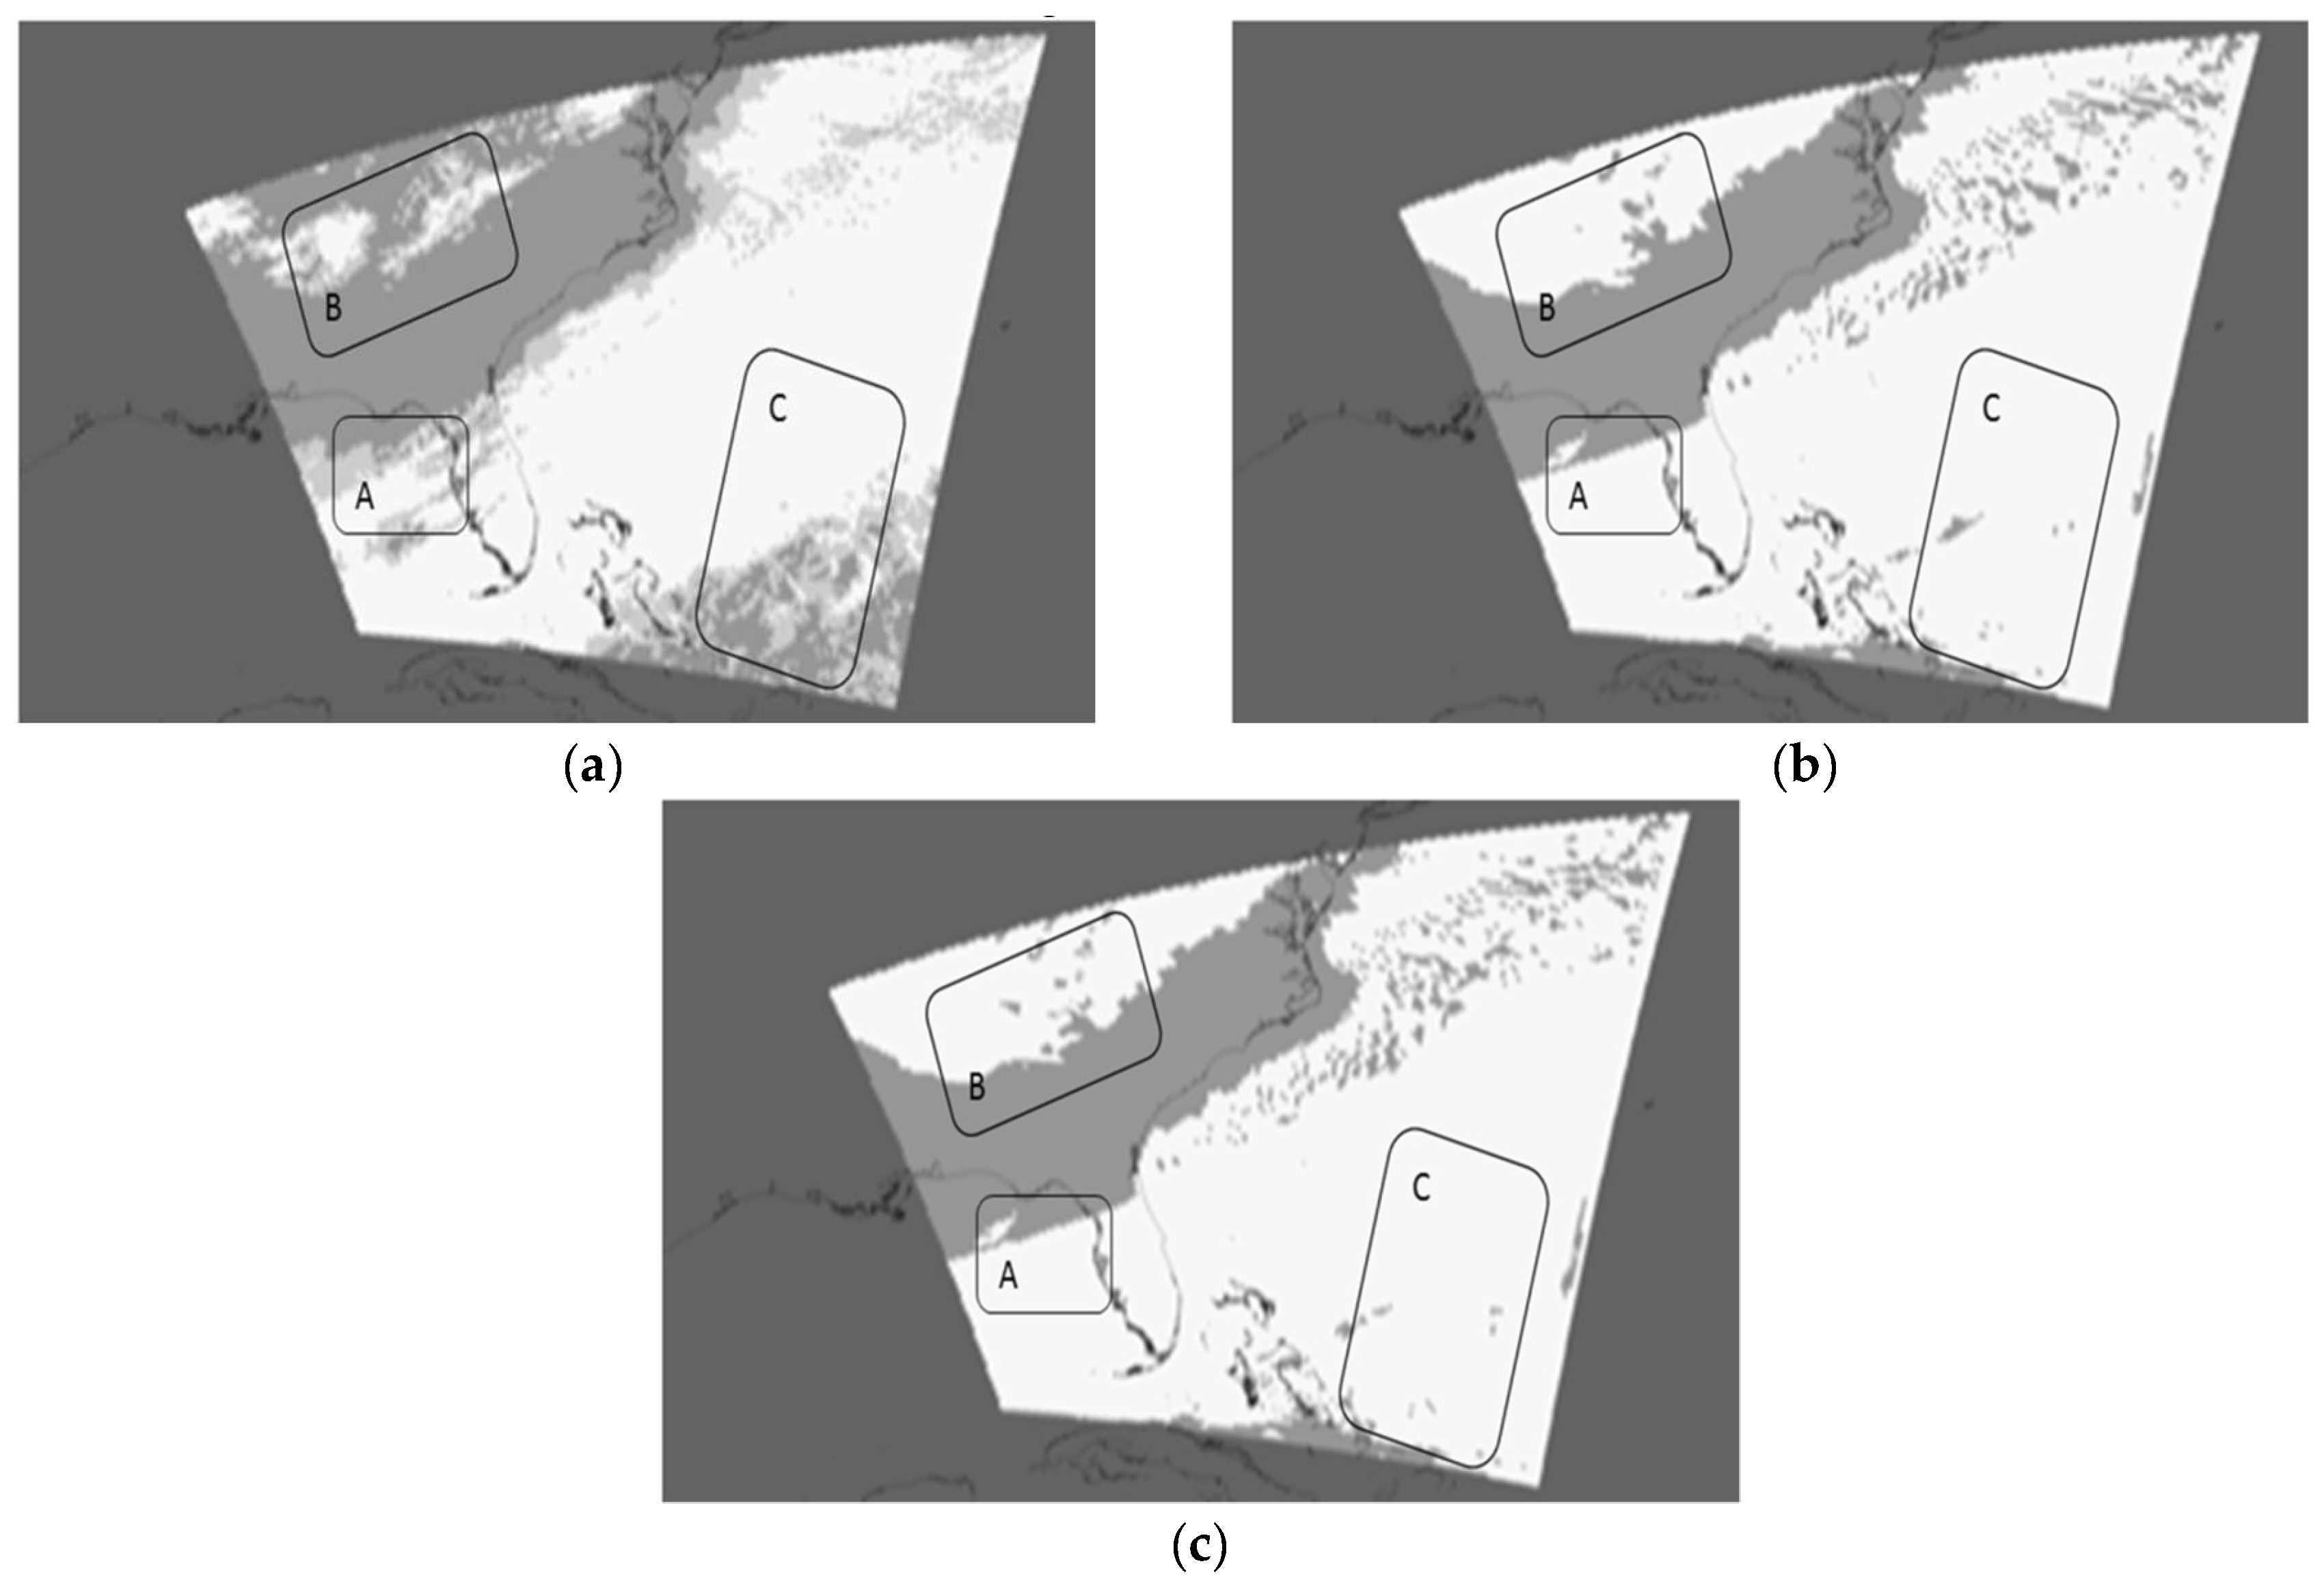
Next, an additional WRF simulation was generated to confirm whether or not the improved cloud fields bogused into the WRFrst file would persist through a 24 h forecast cycle. These WRF simulations were generated from the modified and unmodified WRFrst files valid at 1800 UTC on 18 Nov 2014. Both the baseline WRF run, shown in Figure 4b, and the updated forecasts from the bogused WRFrst file, shown in Figure 5c, used the original simulation settings listed in Table 2. Each has a forecast length of 24 h, and both are valid at 1800 UTC on 19 Nov 2014. Images of these results are shown in Figure 6b,c, respectively along with the mean CCftruth image in Figure 6a, which was created from VIIRS imagery collected within minutes of the forecast termination time. Images in Figure 6 are displayed in the same manner described in Figure 3, Figure 4 and Figure 5.
The results in Figure 6 revealed that WRF simulations based upon the modified WRFrst file show few differences from simulations based upon the unmodified WRFrst file. Additionally, the reduction in over-clouding obtained through the bogusing of the WRFrst file does not persist across a 24 h forecast cycle. CCfWRF forecasts continue to be highly binary with little to no cloud fields found in the 10–90% cloud cover fraction range. This tendency to create binary forecasts is most evident in area C, but is also obvious in area A and B. The over-clouding is qualitatively evident in all areas, where large regions of clouds are seen in the WRF results that are not contained in the CCftruth imagery. Thus, it is concluded that the over-clouding of WRF forecasts coupled with the binary nature of them suggests a lack of skill in the internal procedures used to translate WRF forecast variables into cloud cover fractional coverage within the WRF model.

5. Conclusions

In this case study, techniques originally developed to quantitatively assess the accuracy of cloud cover fraction (CCf) in the 12 km NAM ds609.0 databases were extended to analyze CCf forecasts from the WRF model. While the procedures focused on quantitatively evaluating single-layered water clouds are considered responsible for most of the variations in the simulation sensitivities found in global climate models, they also support qualitatively assessing all clouds created in the WRF simulations.
The procedures require the registration of VIIRS imagery and cloud products, including manually-generated cloud analyses generated from VIIRS imagery, with NAM initialization and WRF forecast datasets. The manually-generated cloud masks created from VIIRS imagery serve as truth measurements of mean cloud cover fraction (CCftruth) once mapped to the WRF and NAM grids along with the cloud phase analysis from the VIIRS cloud mask.
The results from this case study suggest that NAM data are biased toward under-clouding of lower-level water clouds as reported previously [6]. However, the bias shifts strongly toward over-clouding in the WRF forecasts based upon these NAM data. In addition, the WRF cloud forecast fields are highly binary, i.e., predictions are mostly all clear or completely cloudy, even across large geographic areas shown to contain large areas of stratocumulus as evident in temporally and spatially coincident satellite imagery. Furthermore, WRF was found in this case study to over-predict cloud cover fraction for lower-level water as well as higher-level clouds and frequently forecasts multiple cloud layers (high and low) when only a single layer is present. While it is possible to assimilate, through the bogus process, more accurate cloud analyses into the WRF simulations, e.g., using VIIRS imagery and cloud products to update a WRFrst file, it was found that corrections to improve these cloud fields do not persist through a 24 h forecast cycle. Based upon the results of this case study, it is postulated that the current methodology to translate the WRF forecast parameters into cloud cover fraction at each of the WRF eta levels is shown to be inadequate in the current WRF implementation. It is concluded that additional studies with larger datasets are needed to more fully evaluate this conversion process and possibly improve the parameterization of the WRF cloud cover fraction forecast methodology.

Author Contributions

This article contains the results of research completed by the authors. K.D.H. is credited with the satellite imagery interpretation, the truth software, and MGCNC analyses; B.D.I. is credited with the collocation and processing results with the datasets. S.D. is credited with the generation of WRF simulations using the NAM datasets and bogused WRF forecasts. J.Q. is credited along with K.D.H. in the conceptual development and oversight of the project. X.J. and R.M. are credited developing the tools and converting WRF standard files into formats analyzed by B.D.I. with QGIS.

Funding

This research received no external funding.

Acknowledgments

Data used in this study were obtained from the NCEP North American Mesoscale (NAM) 12 km Analysis, Research Data Archive at the National Center for Atmospheric Research, Computational and Information Systems Laboratory. http://rda.ucar.edu/datasets/ds609.0/ (http://rda.ucar.edu/datasets/ds609.0/).

Conflicts of Interest

The authors declare no conflict of interest.

References

  1. Pour-Biazar, A.; McNider, R.T.; Roselle, S.J.; Suggs, R.; Jedlovec, G.; Byun, D.W.; Kim, S.; Lin, C.J.; Ho, T.C.; Haines, S.; et al. Correcting photolysis rates on the basis of satellite observed clouds. J. Geophys. Res. Atmos. 2007, 112. [Google Scholar] [CrossRef] [Green Version]
  2. Mathiesen, P.J.; Collier, C.; Kleissl, J.P. Development and validation of an operational, cloud-assimilating numerical weather prediction model for solar irradiance forecasting. In Proceedings of the ASME 2012 6th International Conference on Energy Sustainability, San Diego, CA, USA, 23–26 July 2012; pp. 955–964. [Google Scholar]
  3. Fitch, K.E.; Hutchison, K.D.; Bartlett, K.S.; Wacker, R.S.; Gross, K.C. Assessing VIIRS cloud base height products with data collected at the Department of Energy Atmospheric Radiation Measurement sites. Int. J. Remote Sens. 2016, 37, 2604–2620. [Google Scholar] [CrossRef]
  4. Jakob, C.; Pincus, R.; Hannay, C.; Xu, K.-M. The use of cloud radar observations for model evaluation: A probabilistic approach. J. Geophys. Res. Atmos. 2004, 109. [Google Scholar] [CrossRef]
  5. World Meteorological Organization (WMO). Recommended Methods for Evaluating Clouds and Related Parameters; World Weather Research Program (WWRP); WWRP 2012-1; WMO: Geneva, Switzerland, 2012; p. 34. Available online: http://www.wmo.int/pages/prog/arep/wwrp/new/documents/WWRP_2012_1_web.pdf (accessed on 20 May 2019).
  6. Hutchison, K.D.; Iisager, B.D.; Jiang, X. Quantitatively assessing cloud cover fraction in numerical weather prediction and climate models. Remote Sens. Lett. 2017, 8, 723–732. [Google Scholar] [CrossRef]
  7. Bader, D.; Covey, C.; Gutowski, W.; Held, I.; Kunkel, K. Climate Models: An Assessment of Strengths and Limitations. US Dep Energy, Paper 8. 2008. Available online: http://digitalcommons.unl.edu/usdoepub/8 (accessed on 20 May 2019).
  8. Bony, S.; Colman, R.; Kattsov, V.M.; Allan, R.P.; Bretherton, C.S.; Dufresne, J.-L.; Hall, A.; Hallegatte, S.; Holland, M.M.; Ingram, W.; et al. How well do we understand and evaluate climate change feedback processes? J. Clim. 2006, 19, 3446–3482. [Google Scholar] [CrossRef]
  9. Hutchison, K.D.; Cracknell, A.P. VIIRS—A New Operational Cloud Imager; CRC Press of Taylor and Francis Ltd.: London, UK, 2006; p. 218. [Google Scholar]
  10. Baker, N. VIIRS Cloud Cover/Layers Algorithm Theoretical Basis Document, Joint Polar Satellite System (JPSS) Ground Project Code 474, 474-00044. 2011; p. 92. Available online: https://www.star.nesdis.noaa.gov/jpss/documents/ATBD/D0001-M01-S01-014_JPSS_ATBD_VIIRS-Cloud-Cover-Layers.pdf (accessed on 20 May 2019).
  11. Hutchison, K.D.; Roskovensky, J.K.; Jackson, J.M.; Heidinger, A.K.; Kopp, T.J.; Pavolonis, M.J.; Frey, R. Automated cloud detection and typing of data collected by the Visible Infrared Imager Radiometer Suite (VIIRS). Int. J. Remote Sens. 2005, 20, 4681–4706. [Google Scholar] [CrossRef]
  12. Hutchison, K.D.; Iisager, B.D.; Hauss, B.I. The use of global synthetic data for pre-launch tuning of the VIIRS cloud mask algorithm. Int. J. Remote Sens. 2012, 33, 1400–1423. [Google Scholar] [CrossRef]
  13. Kopp, T.J.; Thomas, W.M.; Heidinger, A.K.; Betombekov, F.R.; Frey, R.; Hutchison, K.D.; Iisager, B.D.; Bruske, K.F.; Reed, B. The VIIRS Cloud Mask: Progress in the first year of S-NPP towards a common cloud detection scheme. J. Geophys. Res. Atmos. 2014, 119, 2441–2456. [Google Scholar] [CrossRef]
  14. Hutchison, K.D.; Heidinger, A.K.; Kopp, T.J.; Iisager, B.D.; Frey, R. Comparisons between VIIRS cloud mask performance results from manually-generated cloud masks of VIIRS imagery and CALIOP-VIIRS match-ups. Int. J. Remote Sens. 2014, 35, 4905–4922. [Google Scholar] [CrossRef]
  15. Hutchison, K.D.; Iisager, B.D. Creating Truth Data to Quantify the Accuracy of Cloud Forecasts from Numerical Weather Prediction and Climate Models. Atmosphere 2019, 10, 177. [Google Scholar] [CrossRef]
  16. Xu, K.-N.; Randall, D.A. A semiemperical cloudiness parameterization for use in climate models. J. Atmos. Sci. 1996, 53, 3084–3102. [Google Scholar] [CrossRef]
  17. User’s Guide for the NCEP Unified Post Processor (UPP) Version 3 (Undated). Available online: https://dtcenter.org/upp/users/downloads/index.php (accessed on 20 May 2019).
  18. Arbizu-Barren, C.; Pozo-Vázquez, D.; Ruiz-Arias, J.A.; Tovar-Pescador, J. Macroscopic cloud properties in the WRF NWP model: An assessment using sky camera and ceilometer data. J. Geophys. Res. Atmos. 2015, 120, 10297–10312. [Google Scholar] [CrossRef]
  19. Boer, G.J. Diagnostic equations in isobaric coordinates. Mon. Weather Rev. 1982, 110, 1801–1820. [Google Scholar] [CrossRef]
  20. Trenberth, K.E. Climate diagnostics from global analyses: Conservation of mass in ECMWF analyses. J. Clim. 1991, 4, 707–722. [Google Scholar] [CrossRef]
  21. D’Entremont, R.P.; Thomason, L.W.; Bunting, J.T. Color-composite image processing for multispectral meteorological satellite data. In Proceedings of the SPIE 0846, Digital Image Processing and Visual Communications Technologies in Meteorology, San Diego, CA, USA, 27–29 October 1987. [Google Scholar] [CrossRef]
  22. Hutchison, K.D.; Mahoney, R.L.; Iisager, B.D. Discriminating sea ice from low-level water clouds in split-window, mid-wavelength IR imagery. Int. J. Remote Sens. 2013, 34, 7131–7144. [Google Scholar] [CrossRef]
  23. Hutchison, K.D.; Choe, N.J. Application of 1.38 µm imagery for thin cirrus detection in daytime imagery collected over land surfaces. Int. J. Remote Sens. 1996, 17, 3325–3342. [Google Scholar] [CrossRef]
  24. Gao, B.-C.; Goetz, A.F.H.; Wiscombe, W.J. Cirrus cloud detection from Airborne Imaging Spectrometer data using the 1.38 µm water vapor band. Geophys. Res. Lett. 1993, 20, 301–304. [Google Scholar]
  25. Reinke, D.L.; Vonder Haar, T.H. Weather Forecast Adjustment Using Model Output Cloud Fields and Digital Satellite Data, Air Force Geophysics Laboratory—TR-82-0168. 1982, p. 119. Available online: http://www.dtic.mil/dtic/tr/fulltext/u2/a123702.pdf (accessed on 20 May 2019).
  26. Hamill, T.M.; d’Entremont, R.P.; Bunting, J.T. A description of the Air Force real-time nephanalysis model. Weather Forecast. 1992, 7, 288–306. [Google Scholar] [CrossRef]
Figure 1. A graphical representation of the areal coverage of the North American Mesoscale (NAM) ds609.0 datasets (light gray) with National Polar-orbiting Partnership (NPP) Visible Infrared Imager Radiometry Suite (VIIRS) data (darker) at approximately 1800 UTC on 18 Nov 2014. The darkest gray shade corresponds to VIIRS granules used in the matchup with NAM data for this study.
Atmosphere 10 00521 g001
Figure 2. VIIRS products at 1757–1803 UTC on 19 Nov 2014. (a) The color composite of VIIRS imagery shows water clouds as yellow, ice clouds as pink-blue, land as green and ocean as black. The image was created by placing the 0.65 µm VIIRS (M5) channel in the red gun of the display, the 1.6 µm (M10) channel in the green gun and the 1.38 µm (M9) band in the blue gun. (b) The manually generated cloud mask (MGCNC) of VIIRS imagery at 1815 UTC on 18 Nov 2014, where clouds are white and cloud free pixels are black, (c) the mean cloud cover fraction (CCf) truth (CCftruth) from mapping MGCNC to NAM grid and (d) VIIRS cloud mask (VCM) phase shows water clouds as green, ice clouds as red (thin cirrus), brown (overlap of cirrus with lower-level water clouds) and orange (opaque cirrus). Mixed phase (ice and water) clouds are yellow. Light blue shows sub-pixel water cloud edges.
Atmosphere 10 00521 g002
Figure 3. Comparisons between CCftruth and CCfNAM at 1800 UTC. (a) Mean CCftruth for all clouds in the VIIRS data on 18 Nov 2014 after mapping the MGCNC image to the NAM grid and (b) CCfNAM for all clouds in the NAM dataset. Similar images for 19 Nov 2014 are shown in (c) and (d) respectively. In all images, coastlines are the black followed by background and mostly cloudless (<10%) conditions which are darker gray, partly cloudy (10–90%) areas which are lighter gray and cloudy grids (>90%) which are white.
Atmosphere 10 00521 g003
Figure 4. Comparisons between CCftruth and baseline CCfWRF results at 1800 UTC on 19 Nov 2014. (a) Mean CCftruth for all clouds in the VIIRS data after mapping the MGCNC image to the WRF grid and (b) CCfWRF for all clouds in the baseline 24 h WRF simulation based upon CLDFRAmax at each WRF grid for all eta levels. Legends are identical to those used in Figure 3.
Atmosphere 10 00521 g004
Figure 5. Comparisons between CCftruth and CCfWRFrst results valid at 1800 UTC on 18 Nov 2104. (a) Mean CCftruth for all clouds in the VIIRS data 2014 after mapping the MGCNC image to the WRF grid, (b) CLDFRAmax of all eta levels for each WRF grid (i.e., CCfWRF for all clouds) in the 6 h baseline WRF simulation from NAM data at 1200 UTC and (c) CLDFRAmax image after the bogus process has been applied using CCftruth data. Legends are same as those used in Figure 3.
Atmosphere 10 00521 g005
Figure 6. Comparisons between CCftruth and CCfWRF for 24 h WRF simulations valid at 1800 UTC on 19 Nov 2014. (a) CCftruth, (b) CCfWRFrst (CLDFRAmax) results from baseline (unmodified) WRFrst file for all clouds in the VIIRS data 2014 after mapping the MGCNC image to the WRF grid, and (c) CCfWRFrst (CLDFRAmax) results modified WRFrst file. Legends are the same as those used in Figure 3.
Atmosphere 10 00521 g006
Table 1. Weather Research and Forecasting (WRF) ver. 3.7.1 simulation configuration for verification of cloud cover fraction.
Simulation CharacteristicsParameter Settings
Period of simulationVariable (e.g., 6, 12, and 24 h case 1800 UTC 18–19 November 2014)
Meteorological dataNAM reanalysis (ds609.0)
Horizontal spatial resolution12 km
Time step60 s
Number of vertical levels42
Top pressure in profiles10 hPa
Shortwave radiationDudhia scheme
Longwave radiationRRTM scheme
Surface boundary layerMonin-Obukhov similarity
Land surface layerUSGS
Planetary boundary layerYSU
Cloud microphysicsMilbrandt 2-mom
Cumulus physicsGrell-Devenyi
Demonstrated model spin-up6 h
Table 2. Comparisons between cloud cover fraction in NAM data (CCfNAM) and truth (CCftruth) for 19 Nov 2014 at 1800 UTC from manual masks of VIIRS imagery between 1757–1803 UTC on 19 Nov 2014.
Bin NumberCCftruth Interval (%)Performance MetricCCfNAMCCftruth
10 ≤ CCftruth < 10count12,689
mean (%)8.01.6
standard deviation (%)24.62.7
210 ≤ CCftruth < 20count 2365
mean (%)8.914.5
standard deviation (%)25.82.8
320 ≤ CCftruth < 30count1342
mean (%)9.824.6
standard deviation (%)26.52.8
430 ≤ CCftruth < 40count 731
mean (%)10.134.5
standard deviation (%)25.62.9
540 ≤ CCftruth < 50count388
mean (%)16.744.4
standard deviation. (%)33.22.8
650 ≤ CCftruth < 60count 238
mean (%)18.954.6
standard deviation (%)34.42.8
760 ≤ CCftruth < 70count165
mean (%)26.864.5
standard deviation (%).39.72.9
870 ≤ CCftruth < 80count90
mean (%)28.474.0
standard deviation (%)38.62.7
980 ≤ CCftruth < 90count63
mean (%)30.584.9
standard deviation (%)42.03.0
1090 ≤ CCftruth < 100count71
mean (%)38.095.5
standard deviation (%)46.72.8
11CCftruth = 100count71
mean (%)63.1100.0
standard deviation (%)43.50.0
Table 3. Frequency of cloud cover fraction (CCf) for all clouds contained in the mean CCftruth data and the maximum value found at all eta levels for each collocate grid in the WRFrst file.
CCf Interval (%)CCfWRF CountsCCftruth Counts
0 ≤ CCf ≤ 10 949611,011
10 < CCf ≤ 20671646
20 < CCf ≤ 30231059
30 < CCf ≤ 4016781
40 < CCf ≤ 5020709
50 < CCf ≤ 606655
60 < CCf ≤ 7012649
70 < CCf ≤ 8011774
80 < CCf ≤ 904961
90 < CCf ≤ 10021,67213,082
Total31,32731,327