Abstract
Low-level warm clouds are a major component in multilayered cloud systems and they are generally hidden from the top-down view of satellites with passive measurements. This study conducts an investigation on oceanic warm clouds embedded in multilayered structures by using spaceborne radar data with fine vertical resolution. The occurrences of warm cloud overlapping and the geometric features of several kinds of warm cloud layers are examined. It is found that there are three main types of cloud systems that involve warm cloud layers, including warm single layer clouds, cold-warm double layer clouds, and warm-warm double layer clouds. The two types of double layer clouds account for 23% and in the double layer occurrences warm-warm double layer subsets contribute about 13%. The global distribution patterns of these three types differ from each other. Single-layer warm clouds and the lower warm clouds in the cold-warm double layer system they have nearly identical geometric parameters, while the upper and lower layer warm clouds in the warm-warm double layer system are distinct from the previous two forms of warm cloud layers. In contrast to the independence of the two cloud layers in cold-warm double layer system, the two kinds of warm cloud layers in the warm-warm double layer system may be coupled. The distance between the two layers in the warm-warm double layer system is weakly dependent on cloud thickness. Given the upper and lower cloud layer with moderate thickness of around 1 km, the cloudless gap reaches its maximum when exceeding 600 m. The cloudless gap decreases in thickness as the two cloud layers become even thinner or thicker.
1. Introduction
Clouds play a crucial role in modifying the energy budget of the Earth–Atmosphere system, through their interaction with solar radiation and longwave radiation [1,2,3]. Both microphysical properties and macrophysical features of clouds determine cloud radiative effects. The primary microphysical parameter of clouds, the droplet size distribution, determines cloud optical properties, and in turn affects scattering and absorption. The horizontal cover and vertical structure of clouds result in additional impacts on cloud radiative effects. These two macrophysical features represent geometric properties of cloud systems on the large scale. A number of numerical simulations and satellite observations have proved that diverse cloud vertical structures greatly affect regional and the global radiation budget, and thus act to modify atmospheric circulation [4]. Accurate knowledge regarding the vertical structure of cloud systems and their global distribution is vital for quantitatively understanding cloud radiative effects.
For single-layer clouds, the vertical structure simply manifests as the vertical distribution of liquid/ice water content or droplet size distribution inside clouds [5]. However, for overlapping cloud layers in the same atmospheric column, known as multilayered clouds, the vertical distribution of multiple cloud layers forms another structural feature. When compared with the varying cloud microphysical properties within a single cloud layer, these vertical structures originate from disconnected cloud layers and cloudless gaps. In such a multilayered cloud system, the altitude aspects of each cloud layer is described by the individual top and bottom height of each cloud layer, as well as their geometrical thickness [6].
Multilayered clouds are common in routine weather observations and they have been frequently recorded in many field experiments. The radiosonde is the major approach that was traditionally employed in ground-based meteorological sites to identify the overlapping appearances of multiple cloud layers [7]. Relying mostly on the vertical gradient of relative humidity, the top and bottom boundary of a cloud layer can be detected, and thus the occurrence of multilayered clouds is straightforwardly derived. Many facts regarding multilayered clouds have been revealed by these ground-based observations. By using data from weather observations, both over land and ocean, Warren et al. [8] found that the existence of cirrus is often accompanied by altostratus at lower levels on a global scale, forming a very common appearance of a double-layered cloud system. On the contrary, there are rather few occurrences where altostratus and cumulus coexist. The occurrences of multilayered clouds are also found to be highly dependent on geographic regions [9]. For instance, the coexistence of upper cirrus and lower cumulonimbus occurs frequently in the tropics, while it infrequently occurs in the extratropical regions. Wang et al. [9] conducted a comprehensive investigation on 20-years of radiosonde measurements and revealed that multilayered clouds account for about 42% of total cloud occurrences. Double-layered clouds were found to be the predominant form in multilayered systems, regardless of geographic regions.
However, the representative domain by a radiosonde measurement is very limited. The drift of sounding balloon driven by upper strong winds may induce false overlapping of multiple cloud layers, and in turn lead to biases in the sampling of multilayered clouds. Moreover, the meteorological sites that deploy radiosondes are limited in number, only covering a very small area globally. Such a deficiency inevitably affects global-scale cloud observations, especially for the identification of multilayered cloud systems over oceans.
Satellite remote sensing is suitable for spatially consistent cloud observations on the global scale [10]. For most spaceborne meteorological observations, scene classification or cloud detection is the first step in data processing flow. For a certain pixel, making the decision, whether it is a cloudy or cloudless one, is required for subsequent cloud or surface parameter retrieval. For typical passive sensors, like shortwave and infrared-band spectral radiometers, the scene classification is mainly based on spectral contrasts between cloudy and clear scenes. Texture or structural information emerging from spatially successive pixels were also used to help distinguish cloudy pixels from clear ones for those imaging sensors that have fine horizontal resolution. When cloudy scenes are acquired, these measurements are used to identify various cloud forms and perform cloud retrieval at the pixel scale [11]. For instance, Baum et al. [12] developed a fuzzy-logic based scheme by using the Advanced Very High Resolution Radiometer (AVHRR) measurements, which is based on a domain of 32 × 32 pixels (the pixel is about 1.1 km × 1.1 km) and outputs four types of cloudy scenes, including low-level clouds, middle-level clouds, high-level clouds, and multilayered clouds. Although many efforts [13,14,15,16] have been carried out identifying multilayered clouds based upon passive measurements, their availability is limited. This deficiency is in principle due to the shallow optical depth that visible and infrared radiation can penetrate into clouds. Thus, it is hard for passive measurements to be sensitive to lower clouds in a multilayered system, and only if the upper ones are optically thin. Multilayered systems with optically thick upper clouds cannot be correctly identified while using passive measurements.
When compared with spaceborne radiometers, the active sensors, like microwave radars, are inherently advantageous for detecting the multilayered structure of cloud systems, which benefit from their capability of radial resolution [17,18]. For general configurations of operational meteorological radars, the vertical resolution reaches the order of magnitude of 100 m, which is sufficient for differentiating the most detached cloud layers. The Cloud Profiling Radar (CPR) aboard CloudSat is designed for cloud observations. With a high signal sensitivity of about −30 dBZ and a horizontal resolution of 1.4 km × 1.7 km, the CPR is of great value for cloud structure detection from space. Wang et al. [19] conducted a comparison of cloud layer data from Moderate Resolution Imaging Spectroradiometer (MODIS) and CPR. It was found that the consistent ones only account for 25.4% of the samples, and it is 17.7% for single-layered clouds and 7.7% for multilayered clouds. Yuan et al. [20] suggested that, on the global scale, about 30% of low-level clouds overlap with various clouds at higher levels, accounting for 12% of total observations. They also found a notable cloudless separation between low-level and high-level cloud layers, with a thickness of least 5 km in terms of zonal averaging.
The lower cloud layers in the multilayered structures tend to be obstructed in the top-down perspective, especially for passive measurements [21]. These cloud layers are mostly composed of pure liquid hydrometeors and they are generally termed as warm liquid clouds or warm clouds. In traditional investigations that concern warm clouds, those that are embedded in the multilayered system were probably ignored due to the usage of cloud top temperature criterion, since only the cloud top temperature of the uppermost layer can be derived by using the upward radiance measurement in most cases. This inevitably leads to insufficient sampling of warm cloud layers. Therefore by using active measurements from spaceborne radar, the present study focuses on the warm clouds contained in multilayered systems. Their appearances would be analyzed on the global scale and relevant geometric features of these clouds would be examined.
2. Data and Methodology
The operational product, 2B-GEOPROF, from CloudSat is used as the primary dataset in this study. It contains the basic information about cloud detection at 240 m intervals, generally labeled as the cloud mask profile. The accessorial parameters that have been merged in the product of 2B-GEOPROF and 2C-PRECIP-COLUMN, such as surface type, sea surface temperature, and freezing level, were also used. The data in 2009 are used and only oceanic samples are concerned.
2.1. CPR Measurements and Cloud Data
The A-Train satellite constellation is in a sun-synchronous orbit, observing a certain geographic location at a fixed local time, 1:30 p.m. and 1:30 a.m. for ascending and descending orbits, respectively. CloudSat is one of the key components of the A-Train constellation, launched in April 2006. The main scientific mission of CloudSat is collecting measurements of global clouds, especially their vertical structures and radiative properties. As many kinds of sensors are loaded on multiple satellite platforms of the A-Train constellation, such as radiometers, radars, and lidars, these joint measurements are useful for advancing knowledge on clouds, precipitation, and aerosols.
CPR on the CloudSat platform is the first spaceborne millimeter-wavelength radar, working at 3.2 mm wavelength (or 94 GHz frequency). When compared with weather radar usually working at the centimeter band, CPR is advantageous for detecting small-sized hydrometeors, which are mainly cloud droplets or ice crystals, rather than large-sized raindrops or ice crystals [22,23]. This detecting capability is further strengthened by its high signal sensitivity of approximately −30 dBZ. The high spatial resolution also helps CPR to sample sufficient cloud targets, in particular for effectively resolving the cloud layers or inner-cloud structures. CPR steadily operates at the nadir-viewing mode without cross-track scanning, and the successive profiles generate a vertical section in the atmosphere. For a certain profile, it represents a horizontal effective field of view of about 1.7 km along-track and 1.4 km across-track. The vertical resolution is 480 m, resulting in 125 gate bins along the 30 km range. Note that, in the processed profile data, the nominal vertical interval has been enhanced to 240 m by using the oversampling technique. This forms the elementary unit in the CPR profile data and it is called a bin for convenience. Thus, the minimum geometric thickness of a cloud layer or a gap between vertically adjacent cloud layers is 240 m.
It is noteworthy that CPR seriously suffers from ground clutter, and accordingly the lowest several bins above surface are invalid. This leads to the truncation of the profiles at about 1 km elevation over oceans [24]. The sampling on terrestrial warm clouds has considerable uncertainties since the truncation level would depend on complicated topography over lands. For sampling consistency, the present study is restricted to only considering oceanic warm cloud layers. Note that warm clouds occur much more frequently over oceans than over land, and oceanic warm clouds account for about 80% of the total warm clouds throughout the globe [25].
2.2. Cloud Layers in CPR Profile
Using surface type information in 2B-GEOPROF first screened out the profile data over land. For the remaining oceanic data, the cloud mask information in 2B-GEOPROF was used to identify clouds in each bin. The valid values of the cloud mask parameter in 2B-GEOPROF range from 0 to 40, with large values indicating a high probability of clouds. According to Marchand et al. [26], as the value of cloud mask parameter reaches 30 and 40, the likelihood of wrong cloud identification is reduced to 4.3% and 0.6%, respectively, which suggests at least 95% reliability of the presence of clouds for cloud mask values that are larger than 30. Hence, the value of 30 was taken as a threshold for differentiating cloudy or clear situations for each bin in the CPR profile.
In a CPR profile, successive cloudy bins are considered as a cloud element, which actually represents a sampling column in a broad domain of a real cloud layer. Given such measurements, single-layered or multilayered clouds are readily derived by summarizing all 125 bins. This is very useful for quantifying the overlapping characteristics of clouds over the global oceans. Without any restriction on cloud type, the frequencies of all cloud profiles with one or more cloud layers are shown in Figure 1. It is evident that single-layered clouds are the dominant cloud form. Multilayered clouds occur more infrequently, but they cannot be ignored due to their nearly 30% contribution. Double-layered clouds account for about 20% of the total cloud profiles. This percentage of double-layered clouds is lower than ~26% from Wang et al. [19], which could likely be attributed to the land-ocean contrast. It is very likely that double-layered clouds occur more frequently over land than over ocean. Since the overall frequency of cloud appearances with three or more individual layers is below 10%, double-layer is indeed the predominant form of multilayered cloud systems. Only single-layered and double-layered ones were analyzed in this study while taking into account such a sample distribution.
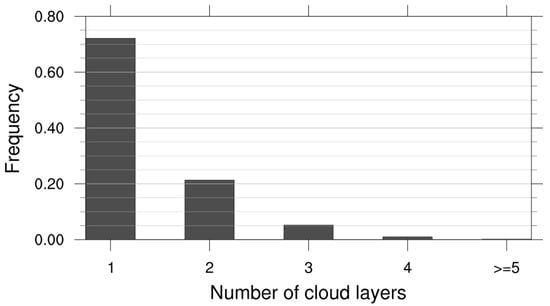
Figure 1.
Occurrences of cloud profiles with diverse cloud layers over global oceans.
2.3. Profiles with Warm Cloud Layers
The warm cloud layers, either in the form of a single-layered cloud system or as an individual layer in a multilayered cloud system, are thus extracted to ascertain their occurrence frequency, characteristics, and geometric features. In most investigations involving warm clouds, in particular those that are based on radiometer measurements, a cloud top temperature of 273 K [24] is a standard criterion for isolating warm clouds that are only composed of liquid-phased hydrometeors. However, in the presence of multilayered clouds, it is hard to correctly interpret the derived cloud top temperature, since a single-layer assumption is generally adopted to make the cloud retrieval feasible. It is plausible to take the retrieved cloud top temperature as representing the uppermost cloud layer in an atmospheric column. However, this treatment inevitably causes ambiguities that would deteriorate as the optical depth of the upper cloud layer gets smaller [27]. Even though the retrieved cloud top temperature is sometimes right for the uppermost cloud layer, the cloud top temperature of the lower cloud layers is always unknown. Therefore, such a cloud top temperature-based scheme cannot capture all warm cloud layers and many samples would be ignored. Many warm cloud layers would be lost due to the overlap of an upper cloud layer with cloud top temperature lower than 273 K. This is actually one of the several motivations for the present study, which is designed to investigate warm clouds that are embedded in multilayered structures.
The freezing level data are derived from reanalysis meteorological fields by the European Centre for Medium-Range Weather Forecasts (ECMWF) and are used to distinguish warm cloud layers from mixed-phase and ice layers. It is straightforward to compare the top height of a cloud layer with the altitude of freezing level at the pixel scale. Such a screening scheme of warm clouds is, in principle, rigorous and able to capture all warm cloud layers, despite the possible multilayered situations.
The cloud profiles were divided into two parts, according to the presence or absence of warm cloud layers. The first one includes those without any warm cloud layer, while the other includes those containing at least one warm cloud layer. Within the latter group, there is a distinctive subgroup that includes profiles containing only warm cloud layers. It is this subgroup that corresponds to the warm clouds that are derived from the cloud top temperature criterion of 273 K. In other words, the ratio of these two kinds of profiles reflect, to some extent, the possible biases in warm cloud sampling from the cloud top temperature scheme. The global distributions of the relevant ratios are shown in Figure 2 to clarify the quantitative relation among these categories.
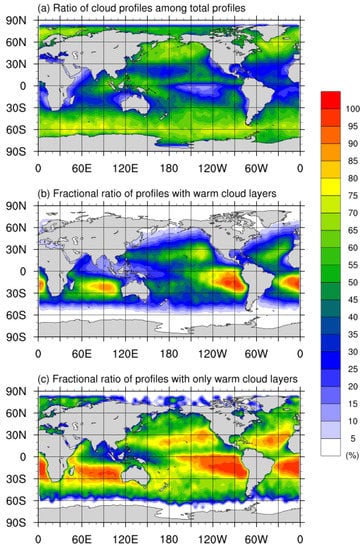
Figure 2.
Ratio of cloud profiles among total profiles (a), ratio of profiles with warm cloud layers among cloud profiles (b), and ratio of profiles with only warm cloud layers among those with warm cloud layers (c), in each 2.5° × 2.5° grid over global oceans.
Figure 2a shows the ratio of cloud profiles among the total profiles. For each grid, this quantity reflects the averaged cloud cover that could be also derived from the radiometer-based cloud mask data. As for the overall oceanic clouds, their occurrences show a general increase from low latitudes to middle and high latitudes in both hemispheres. In the tropics and subtropics, most regions have cloud cover below 40%, except for two distinct zones, the intertropical convergence zone (ITCZ) and the South Pacific convergence zone (SPCZ). From 30°N and 30°S poleward, the quantities of cloud cover are universally higher than 50%. The highest values reach 75% and they mostly occur around 60°S and 60°N, representing the most overcast regions on the earth. This basic spatial pattern of total cloud occurrences over global oceans is largely determined by large-scale meteorological conditions. Although warm clouds are an important component in the cloud ensemble, their spatial distributions are a bit different.
Figure 2b provides the ratios of profiles with warm cloud layers to all cloud profiles, indicating the warm cloud fraction. For the annual average, the majority of warm clouds appear between 60°N and 60°S. At higher latitudes, the cloud cover contribution from warm clouds is nearly negligible. The regions with high values, exceeding 50%, are mostly within subtropical oceans. In particular, the warm cloud fractions approach 70% at the northeastern Pacific and northern Atlantic, and they even approach 90% at southeastern Pacific Ocean, southern Atlantic Ocean, and central Indian Ocean. Most of the above regions are well known for their semipermanent subtropical marine stratocumulus sheets, suggesting that stratocumulus significantly contribute to the warm clouds there [25]. It is evident that, although these several regions have the maximal occurrences of warm clouds throughout the globe, the total cloud cover over there is just moderate as compared with the distribution of total cloud cover shown in Figure 2a. This is probably due to the absence of mixed-phase or ice clouds in these regions, and warm clouds thus become the only component of total cloud cover. In other regions, the fractions of warm clouds are very low. Warm cloud fractions generally decrease westward within each ocean, exhibiting a notable east-west gradient.
Furthermore, Figure 2c shows the ratios of profiles with only warm cloud layers to those with warm cloud layers. The regions with high quantities are almost consistent with those of warm cloud fraction. Their spatial correlation is high, with a correlation coefficient of about 0.76. In the five regions, the maximum quantities exceed 90%. However, it is noteworthy that the quantities are not very low in other regions, mostly above 50%, which implies ubiquitous occurrences of the overlapping of low-level warm clouds and upper non-warm clouds on the global scale. In the zone between 60°N and 80°N, although the profiles with warm cloud layers are few, this fractional ratios are a bit notable. There are exceptionally low values over the narrow regions adjacent to west coast of continents. These should be attributed to the deficiency of CPR for detecting clouds at very low levels, which are mostly coastal stratus and they occur very frequently in these regions [24,28,29].
3. Results
3.1. Occurrences of the Three Categories of Cloud Systems
Warm cloud layers are present in three distinct structures, i.e., warm single layer cloud system, cold-warm double layer cloud system, and warm-warm double layer cloud system. Figure 3 shows the respective occurrences of these three categories of cloud systems. The fraction of warm single layer clouds is about 77%, which indicates that most warm cloud layers occur as isolated ones, without concurrent cloud layers in the same atmospheric column. Cold-warm double layer clouds account for about 20% while warm-warm ones account for 3%. The inability of CPR to detect clouds near the sea surface may have some effects on the above individual proportions, but the quantitative contrast among these three parts should be meaningful. In the lower troposphere, two independent warm cloud layers are possible to overlap with each other. Such occurrences account for about 13% in the total double layer cases that involve a warm cloud component and represent a distinctive appearance of warm clouds. It is apparent that, by using the cloud top temperature of 273 K to identify warm clouds, the samples contain merely warm single layer and warm-warm double layer clouds. Cold-warm double layer ones, approximately 20% of the total, would be excluded, and thus the warm cloud layer at the lower portion in these systems cannot be involved in the sampling of warm clouds.
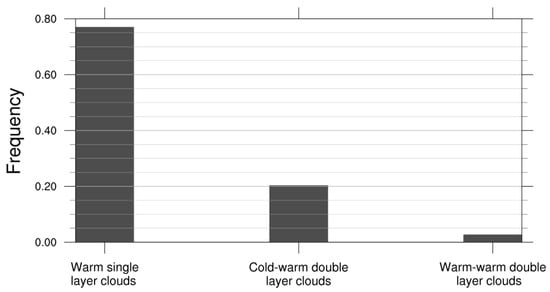
Figure 3.
Occurrences of the three kinds of profiles containing warm cloud layer.
Figure 4 shows the spatial distributions on the global scale for the three cloud system types that contain warm cloud layer. When considering the notable differences of sample volumes among the three categories, the global distribution of each category are normalized, which means that the global sum of all local frequencies is a unit. Such a pattern emphasizes the spatial distributions of each cloud system, rather than the occurrence differences among the three cloud systems at a certain geolocation. Since at least one warm cloud layer is present, the required atmospheric temperature conditions that lead to most of the three cloud systems are distributed in the zone between 60°N and 60°S.
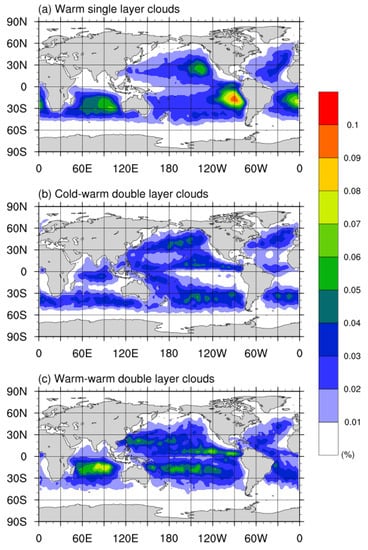
Figure 4.
Normalized spatial distribution for warm single layer clouds (a), cold-warm double layer clouds (b), and warm-warm double layer clouds (c). For each panel, the normalization ensures the global sum to be a unit.
As for the specific geographic pattern, the differences are prominent among the three categories. The spatial pattern of cold-warm double layer clouds that is shown in Figure 4b resembles that of the total cloud cover shown in Figure 2a, where the few occurrences are correlated with relatively low surface sea temperature and large-scale subsidence that jointly inhibit the development of vigorous cloud systems. When compared to the other two categories, cold-warm double layer clouds tend to be more evenly distributed throughout global oceans, without notable maximum centers. The majority of frequencies are around 0.03% and the local maxima are below 0.05%. The rather weak regional differences for cold-warm double layer clouds are shown to be mostly dependent on latitude. Such relatively even distributions imply that excluding these samples from the warm cloud ensemble does not strongly affect the global distribution pattern of warm clouds. There are three appreciable oceanic regions, with very few occurrences of cold-warm double layer clouds, all being located in low latitudes of southern hemisphere, i.e., central Indian Ocean, southeastern Pacific Ocean, and southern Atlantic Ocean. As a contrast, these three regions all have very large occurrences of warm single layer clouds, as shown in Figure 4a. The frequencies of warm single layer clouds within these regions exceed 0.07%, while they are below 0.03% at the other regions. Especially, in the low latitudes, the occurrences of warm single layer clouds lowest in the equatorial western Pacific warm pool and the ITCZ. There exists a marked zonal gradient, where the occurrences reach the maximum nearly at the east boundary of oceans and gradually decrease westward. The warm-warm double layer clouds, as shown in Figure 4c, mostly occur between 30°N and 30°S. Although their overall occurrences are few, warm-warm double layer clouds are highly widespread throughout the tropics and subtropics, except for some nearshore regions. The relatively high occurrences are distributed along several extensive zonal belts with notable meridional gradient. The highest occurrences of such double layer clouds arise in the central Indian Ocean, where single layer clouds also frequently occur. It is noteworthy that the several regions with massive warm single layer clouds do not have high occurrences of warm-warm double layer clouds and the central Indian Ocean is the sole exception.
3.2. Geometric Features of the Warm Cloud Layers
Since two warm cloud layers coexist in the warm-warm double layer structure, there are, in practice, four appearances for warm cloud layers that are present in the previous three categories of cloud systems. Besides single-layer warm clouds, the other three forms include the lower layer in a cold-warm double layer structure, the upper layer in a warm-warm double layer structure, and the lower layer in a warm-warm double layer structure. Although they all belong to the warm cloud category according to their cloud top phase, they get different treatment in passive measurements based remote sensing. Only single-layer warm clouds can be correctly identified. The ones that are embedded to the cold-warm double layer structures are mostly missed, while the two layers in the warm-warm double layer structure may have been mistaken as a single layer. Therefore, the occurrences of warm clouds would be underestimated. Based on the improved sampling of cloud layers by CPR, the geometric parameters, including cloud top height, cloud base height, and cloud layer thickness, are analyzed for the four kinds of warm cloud layers. The frequency distributions are displayed in Figure 5, with an interval of 240 m for the ordinate. The detailed statistical parameters are given in Table 1 for a straightforward comparison.
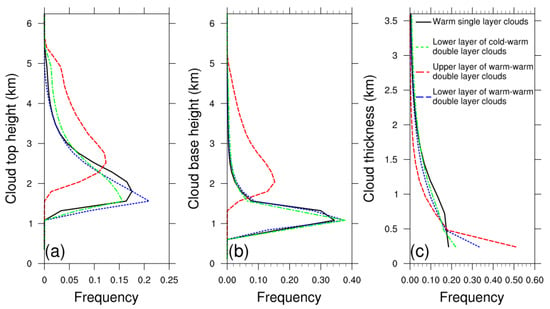
Figure 5.
Frequency distribution of cloud top height (a), base height (b), and geometric thickness (c) of the four types of warm cloud layers.

Table 1.
Statistics of geometric features for the four kinds of warm cloud layer.
The warm single layer clouds and lower layer of cold-warm double layer clouds have quite similar frequency distributions of the geometric parameters, as shown in Figure 5. The top height of these two types of warm cloud layers are mostly around 1.5–2.5 km, and their base heights are mostly around 0.5–1.5 km. The maximum, minimum, and average values are similar. At least for these geometric parameters, there is no difference between these two kinds of warm cloud layers, although they are involved in different cloud systems. Such a similarity suggests that the concurrence of a cold cloud layer at an upper level hardly impact the warm cloud layer at the lower level, and thus the two cloud layers in the cold-warm double layer system are independent to each other. In this way, those that are embedded in the cold-warm double layer system are indistinguishable from those appearing as a single layer system in terms of geometric properties. The upper and lower cloud layer in the warm-warm double layer system are found to have distinct features from the previous two kinds of warm cloud layers. Their geometric thickness is much smaller, especially the upper one that is only 0.5 km on average. When comparing the cloud top and base height with the previous two kinds of warm clouds, the upper (lower) cloud layer in the warm-warm double layer system tend to be higher (lower). Taking cloud top height as an example, those of the upper one appear around 3.0 km altitude, while those of the lower one tend to occur below 2.0 km, as provided in Table 1. In contrast to the independence between the two cloud layers in the cold-warm double layer system, these two cloud layers in the warm-warm double layer system are likely to be coupled, which makes the geometric properties of both these two cloud layers differ from those as a single layer system.
The above statistics all are globally derived. When considering their distinct patterns of occurrences on the global scale, the cloud layer altitude and thickness characteristics may also be dependent on geographic regions. The averaged top height and thickness of these four kinds of warm cloud layers are shown in Figure 6 and Figure 7, respectively. The regional dependence is found to be evident, but it is not alike that of the occurrences of each kind of clouds. There is a clear gradient from equator to the poles, with the maxima being located in the tropics. For all four kinds of cloud structures, without considering the absolute quantities, their spatial distribution patterns are similar. The relatively low cloud top and corresponding small thickness both arise in the several oceanic regions near the west coast of continents. Such a pattern may be correlated to the global pattern of the sea surface temperature, which determines the lower-tropospheric stability to a large extent, and in turn dominates the evolution of warm clouds [25]. The above coastal regions have cold sea surface temperatures, forcing the cloud layer to be thin. In the ITCZ and warm pool regions, all of the warm clouds tend to reach higher levels. As for the cloud top comparison among the four types, for any given location, upper layer and lower layer clouds in the warm-warm double layer system have the highest and lowest cloud top, respectively. In particular, the cloud top of upper layer ones reaches about 3.5 km in many regions. As for the thickness, warm single layer clouds and lower layer of cold-warm double layer clouds have the largest thickness, and followed by lower layer of warm-warm double layer clouds. The upper layer of warm-warm double layer clouds has the smallest thickness. In terms of grid averaging, there is no region with cloud layer thickness exceeding 720 m. In contrast, there are extensive regions with a cloud thickness above 1440 m for warm single layer clouds.
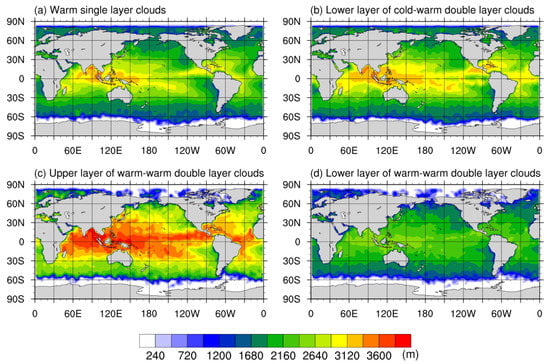
Figure 6.
Global distribution of cloud top height for warm single layer clouds (a), lower layer of cold-warm double layer clouds (b), upper layer of warm-warm double layer clouds (c), and lower layer of warm-warm double layer clouds (d).
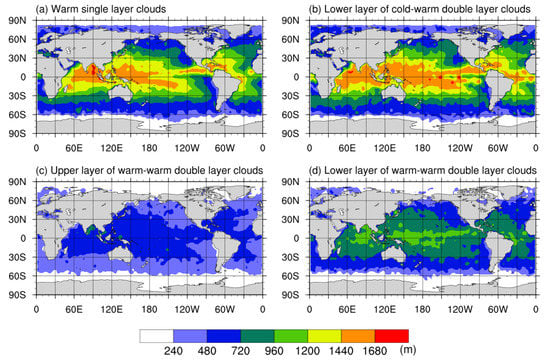
Figure 7.
Global distribution of cloud geometric thickness for warm single layer clouds (a), lower layer of cold-warm double layer clouds (b), upper layer of warm-warm double layer clouds (c), and lower layer of warm-warm double layer clouds (d).
The warm-warm double layer system manifests as a distinctive appearance of warm clouds. The two warm cloud layers are notably different from those in the form of a single layer or embedded in the cold-warm double layer system. Although these appearances of warm clouds account for a small part of oceanic warm clouds, they represent a subset of warm clouds that have very different geometric properties. Beside the individual geometric parameters of each layer, the cloudless spacing between the two cloud layers in such a double system was also examined, which may reflect the potential correlation of these two concurrent cloud layers. The sampling frequencies and separation distance in the two-dimensional parameter space were calculated and the results are given in Figure 8. The thickness of two cloud layers pose a constraint on the thickness of cloudless gap between the two cloud layers since the available space for warm-warm double layer system is strictly limited to the lower troposphere below freezing level as shown in Figure 5a. Taking this into account, the separation distance is found to be weakly dependent on cloud thickness. For any cloud thickness, the number of occurrences notably decreases with increasing separation distance. Most double layer systems have a separation distance within 1 km, even with small cloud thicknesses. As shown in Figure 8d, there are a considerable amount of samples with separation distances exceeding 600 m. Such large spacing situations occur when the thickness of upper and lower cloud layer are both moderate, around 1 km. There is no negative correlation between the separation distance and the thickness of upper layer. In comparison, the thinnest cloud layers are not located far away from each other, leading to a moderate cloudless gap. These geometric features of cloud appearances are thus presumed to be caused by certain thermodynamic conditions, which favor the concurrent evolution of two warm cloud layers in the low troposphere, given the thermodynamic regime for maintaining double layer cloud system in atmospheric boundary layer [25].
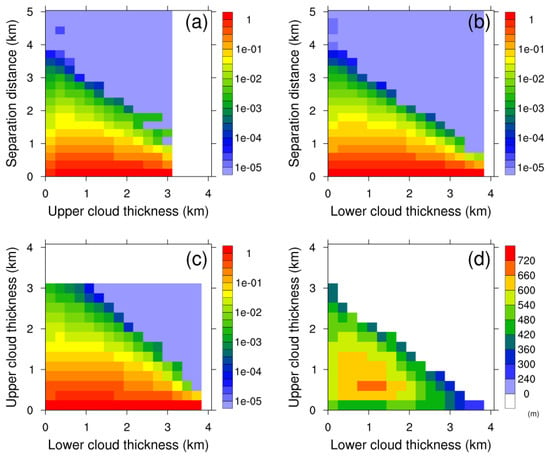
Figure 8.
Sample frequency in the two-dimensional space of upper cloud thickness and separation distance (a), lower cloud thickness and separation distance (b), lower cloud thickness and upper cloud thickness (c), and the variation of separation distance depending on lower and upper cloud thickness (d), for warm-warm double layer clouds.
4. Concluding Remarks and Discussion
The overlapping of multiple cloud layers is rather frequent on the global scale, which has substantial impacts on the estimation of cloud radiative forcing [17]. In addition, these distinctive cloud appearances can be also used as effective indices for evaluating numerical models [21]. The low-level warm clouds act as a major component in generating the multilayered cloud system and are thus very likely to be accompanied by upper clouds, either mixed-phase or ice ones. The warm clouds are generally hidden from the top-down view of satellite since only the topmost cloud layer can be detected in spaceborne passive sensors, leading to incomplete sampling of warm cloud layers by satellite remote sensing. By using CloudSat radar data with fine vertical resolution, this study takes into account all the warm cloud layers, with special attention to those embedded in multilayered systems. The occurrences of warm cloud events overlapping were quantified and the geometric features of the several kinds of warm cloud layers were examined.
It is found that there are three types of cloud systems that involve warm cloud layers, including warm single layer clouds, cold-warm double layer clouds, and warm-warm double layer clouds. The double layer clouds account for 23%, while in the double layer occurrences warm-warm double layer subsets contribute about 13%. Three oceanic regions are found to have very few occurrences of cold-warm double layer clouds, i.e., central Indian Ocean, southeastern Pacific Ocean, and southern Atlantic Ocean, where the occurrence frequencies of low-level warm clouds are notable. However, warm single layer clouds are frequent in these three domains. The warm-warm double layer clouds are widespread throughout the tropical and subtropical oceans, with the highest occurrences found in central Indian Ocean.
Single-layer warm clouds and the lower warm clouds in the cold-warm double layer system have nearly identical geometric parameters. If the upper cold clouds in the double layer system are ignored, there remains no discrepancy of cloud appearance between the two kinds of warm cloud layers. Such a similarity suggests that the warm cloud layer that is embedded in cold-warm double layer system is hardly impacted by the upper cloud layer. Although they constitute a double layer system in the perspective of observation, these two cloud layers tend to be uncorrelated. The warm clouds at lower levels have their own formation and evolution regimes, independent of the mixed-phase or ice clouds aloft.
The upper and lower layer warm clouds in the warm-warm double layer system have features that are distinct from the previous two. Their vertical extents are small. Meanwhile, the cloud top and base height tend to be elevated for the upper cloud layer, while they are depressed for the lower one. The separation distance between the two cloud layers in the warm-warm double layer system is found to be weakly dependent on the cloud layer thickness. For these double layer systems, most cases have a separation distance within 1 km, even though the cloud thickness can be small. The separation distance exceeds 600 m in many cases, which occur for those with moderate thickness of upper and lower cloud layers. As the two warm cloud layers get extremely thin, the cloudless gap between them tends to have a moderate thickness. In contrast to the independence of the two cloud layers in cold-warm double layer system, the two kinds of warm cloud layers in the warm-warm double layer system are likely to be coupled with each other. They are presumed to be driven by a unified thermodynamic regime that stimulates the concurrent evolution of two warm cloud layers within the limited space in the low troposphere. It is noteworthy that the warm-warm double layer system that was examined in this study does not exactly correspond to the double layer warm clouds within the boundary layers, which are associated with deeper and cumulus-coupled boundary layers [25]. Therefore the physical regime for maintaining the double layer structure within boundary layer cannot be directly used to explain the formation of a warm-warm double layer system, mostly of which are above boundary layer. More studies are still needed to reveal the underlying factors that result in these distinct forms of warm clouds.
There is evidence of regional dependence for cloud altitude and thickness, but they are unlike that of the occurrences of each kind of cloud layers. A clear poleward gradient exists for all of them. In the ITCZ and warm pool regions, all of the warm cloud layers tend to reach higher altitudes despite the relative few occurrences therein. For single-layer warm clouds, there are extensive regions with cloud layer thickness above 1440 m. In contrast, there is no region with a thickness exceeding 720 m for the upper layer warm clouds in the warm-warm double layer system.
The present study conducted a preliminary examination on oceanic warm clouds while taking into account those embedded in the multilayered structures. It is believed that such knowledge on cloud overlapping is critical for fully understanding the distribution of warm clouds in three-dimensional space. The results that were derived in this study could help in validating the cloud results of numerical models, which are indeed three-dimensional in nature. They could also be used to improve the estimation of cloud radiative forcing, since it is affected by cloud occurrences and especially their vertical structures. It should be pointed out that solid explanations for the above cloud features could not be presented by only using these satellite data themselves. Specific studies are required to reveal the underlying physical regimes that induce these features of warm clouds, which may utilize various data sources, including those from ground site observations, reanalysis fields, and numerical simulations. In particular, for the warm-warm double layer clouds, besides the geometric features, their microphysical and optical properties need to be further clarified. Moreover the terrestrial warm clouds would also be investigated in future work to help form a complete characterization of global warm clouds.
Author Contributions
Y.D. performed the data analysis and participated in the writing of manuscript. Q.L. designed the study and wrote the manuscript. P.L. helped the data preparation and participated in the discussion on results.
Funding
This work was funded by the National Natural Science Foundation of China (41575019 and 41875030).
Acknowledgments
We would like to thank the NASA CloudSat team for sharing CPR product data in the CloudSat Data Processing Center.
Conflicts of Interest
The authors declare no conflict of interest.
References
- Hartmann, D.L.; Short, D.A. On the use of Earth radiation budget statistics for studies of clouds and climate. J. Atmos. Sci. 1980, 37, 1233–1250. [Google Scholar] [CrossRef]
- Webb, M.J.; Senior, C.A.; Sexton, D.M.H.; Ingram, W.J.; Williams, K.D.; Ringer, M.A.; McAvaney, B.J.; Colman, R.; Soden, B.J.; Gudgel, R.; et al. On the contribution of local feedback mechanisms to the range of climate sensitivity in two GCM ensembles. Clim. Dyn. 2006, 27, 17–38. [Google Scholar] [CrossRef]
- de Szoeke, S.P.; Fairall, C.W.; Pezoa, S. Ship observations of the tropical Pacific Ocean along the coast of South America. J. Clim. 2009, 22, 458–464. [Google Scholar] [CrossRef]
- Slingo, A.; Slingo, J.M. The response of a general circulation model to cloud longwave radiative forcing. I: Introduction and initial experiments. Q. J. R. Meteorol. Soc. 1988, 114, 1027–1062. [Google Scholar] [CrossRef]
- Zhou, L.; Liu, Q.; Liu, D.; Xie, L.; Qi, L.; Liu, X. Validation of MODIS liquid water path for oceanic nonraining warm clouds: Implications on the vertical profile of cloud water content. J. Geophys. Res. Atmos. 2016, 121, 4855–4876. [Google Scholar] [CrossRef]
- Zhou, Y.; Ou, J. The method of cloud vertical structure analysis using rawinsonde observation and its applied research. Meteorol. Mon. 2010, 36, 50–58. [Google Scholar]
- Zhang, J.; Chen, H.; Li, Z.; Fan, X.; Peng, L.; Yu, Y.; Cribb, M. Analysis of cloud layer structure in Shouxian, China using RS92 radiosonde aided by 95 GHz cloud radar. J. Geophys. Res. 2010, 115, D00K30. [Google Scholar] [CrossRef]
- Warren, S.G.; Hahn, C.J.; London, J. Simultaneous occurrence of different cloud types. J. Clim. Appl. Meteorol. 1985, 24, 658–667. [Google Scholar] [CrossRef]
- Wang, J.; Rossow, W.B.; Zhang, Y. Cloud vertical structure and its variations from a 20-Yr global rawinsonde dataset. J. Clim. 2000, 13, 3041–3056. [Google Scholar] [CrossRef]
- Stephens, G.L.; Kummerow, C. The remote sensing of clouds and precipitation from space: A review. J. Atmos. Sci. 2007, 64, 3742–3765. [Google Scholar] [CrossRef]
- Ye, J.; Li, W.; Yan, W. Retrieval of the optical thickness and effective radius of multilayered cloud using MODIS data. Acta Meteorol. Sin. 2009, 67, 613–622. [Google Scholar] [CrossRef]
- Baum, B.; Uttal, T.; Poellot, M.; Ackerman, T.; Alvarez, J.; Intrieri, J.; Starr, D.; Titlow, J.; Tovinkere, V.; Clothiaux, E. Satellite remote sensing of multiple cloud layers. J. Atmos. Sci. 1995, 52, 4210–4230. [Google Scholar] [CrossRef]
- Desmons, M.; Ferlay, N.; Parol, F.; Riédi, J.; Thieuleux, F. A global multilayer cloud identification with POLDER/PARASOL. J. Appl. Meteorol. Climatol. 2017, 56, 1121–1139. [Google Scholar] [CrossRef]
- Chang, F.; Li, Z. A new method for detection of cirrus overlapping water clouds and determination of their optical properties. J. Atmos. Sci. 2005, 62, 3993–4009. [Google Scholar] [CrossRef]
- Chang, F.; Li, Z. A near-global climatology of single-layer and overlapped clouds and their optical properties retrieved from Terra/MODIS data using a new algorithm. J. Clim. 2005, 18, 4752–4771. [Google Scholar] [CrossRef]
- Wind, G.; Platnick, S.; King, M.D.; Hubanks, P.A.; Pavolonis, M.J.; Heidinger, A.K.; Yang, P.; Baum, B.A. Multilayer cloud detection with the MODIS near-infrared water vapor absorption band. J. Appl. Meteorol. Climatol. 2010, 49, 2315–2333. [Google Scholar] [CrossRef]
- Li, J.; Huang, J.; Stamnes, K.; Wang, T.; Lv, Q.; Jin, H. A global survey of cloud overlap based on CALIPSO and CloudSat measurements. Atmos. Chem. Phys. 2015, 15, 519–536. [Google Scholar] [CrossRef]
- Oreopoulos, L.; Cho, N.; Lee, D. New insights about cloud vertical structure from CloudSat and CALIPSO observations. J. Geophys. Res. Atmos. 2017, 122, 9280–9300. [Google Scholar] [CrossRef]
- Wang, T.; Fetzer, E.J.; Wong, S.; Kahn, B.H.; Yue, Q. Validation of MODIS cloud mask and multilayer flag using CloudSat-CALIPSO cloud profiles and a cross-reference of their cloud classifications. J. Geophys. Res. Atmos. 2016, 121, 11620–11635. [Google Scholar] [CrossRef]
- Yuan, T.; Oreopoulos, L. On the global character of overlap between low and high clouds. Geophys. Res. Lett. 2013, 40, 5320–5326. [Google Scholar] [CrossRef]
- Zhang, J.; Li, Z.; Chen, H.; Yoo, H.; Cribb, M. Cloud vertical distribution from radiosonde, remote sensing, and model simulations. Clim. Dyn. 2014, 43, 1129–1140. [Google Scholar] [CrossRef]
- Stephens, G.L.; Vane, D.G.; Boain, R.J.; Mace, G.G.; Sassen, K.; Wang, Z.; Illingworth, A.J.; O’Connor, E.J.; Rossow, W.B.; Durden, S.L.; et al. The CloudSat mission and the A-train: A new dimension of space-based observations of clouds and precipitation. Bull. Am. Meteorol. Soc. 2002, 83, 1771–1790. [Google Scholar] [CrossRef]
- Stephens, G.L.; Vane, D.G.; Tanelli, S.; Im, E.; Durden, S.; Rokey, M.; Reinke, D.; Partain, P.; Mace, G.G.; Austin, R.; et al. CloudSat mission: Performance and early science after the first year of operation. J. Geophys. Res. 2008, 113, D00A18. [Google Scholar] [CrossRef]
- Liu, D.; Liu, Q.; Zhou, L. Underestimation of oceanic warm cloud occurrences by the Cloud Profiling Radar aboard CloudSat. J. Meteorol. Res. 2015, 29, 576–593. [Google Scholar] [CrossRef]
- Wood, R. Stratocumulus clouds. Mon. Weather Rev. 2012, 140, 2373–2423. [Google Scholar] [CrossRef]
- Marchand, R.; Mace, G.G.; Ackerman, T.; Stephens, G. Hydrometeor detection using Cloudsat—An earth-orbiting 94-GHz cloud radar. J. Atmos. Ocean. Technol. 2008, 25, 519–533. [Google Scholar] [CrossRef]
- Liou, K. Influence of cirrus clouds on weather and climate processes: A global perspective. Mon. Weather Rev. 1986, 114, 1167–1199. [Google Scholar] [CrossRef]
- Liu, D.; Liu, Q.; Qi, L.; Fu, Y. Oceanic single-layer warm clouds missed by the Cloud Profiling Radar as inferred from MODIS and CALIOP measurements. J. Geophys. Res. Atmos. 2016, 121, 12947–12965. [Google Scholar] [CrossRef]
- Liu, D.; Liu, Q.; Liu, G.; Wei, J.; Deng, S.; Fu, Y. Multiple factors explaining the deficiency of cloud profiling radar on detecting oceanic warm clouds. J. Geophys. Res. Atmos. 2018, 123, 8135–8158. [Google Scholar] [CrossRef]
© 2019 by the authors. Licensee MDPI, Basel, Switzerland. This article is an open access article distributed under the terms and conditions of the Creative Commons Attribution (CC BY) license (http://creativecommons.org/licenses/by/4.0/).