Article

On the Spectra of Gravity Waves Generated by Two Typical Convective Systems

1
College of Meteorology and Oceanography, National University of Defense Technology, Nanjing 211101, China
2
Meteorology and Space Weather Monitoring and Warning Center, China Xi’an Satellite Control Center, Xi’an 710000, China
*
Authors to whom correspondence should be addressed.
Atmosphere 2019, 10(7), 405; https://doi.org/10.3390/atmos10070405
Submission received: 16 June 2019 / Revised: 11 July 2019 / Accepted: 14 July 2019 / Published: 17 July 2019
(This article belongs to the Section Meteorology)

Abstract

:
Spectral characteristics of lower-stratospheric gravity waves generated in idealized mei-yu front and tropical cyclone (TC) are compared by performing high-resolution simulations. The results suggest that the systems which organize convection in different forms can generate waves with distinctly different presentation. The mei-yu front appears as a linear zonal wave source and gravity waves are dominated by cross-frontal (meridional) propagating components. The northward (southward) components have dominant meridional wavelengths of 125–333 km (>250 km), periods of 100–200 min (83–143 min), and phase speeds of 0–15 m s−1 (15–20 m s−1). The TC appears as a point wave source and gravity waves propagate equally in various horizontal directions. The waves exhibit greater power and broader spectral distributions compared with those in the mei-yu front, with dominant horizontal wavelengths longer than 62.5 km, periods of 33–600 min, and phase speeds slower than ~40 m s−1.

1. Introduction

Gravity-wave activity is a ubiquitous buoyancy oscillation phenomenon in the atmosphere. It has been a fundamental topic within meteorological research due to its profound effect on atmospheric processes at various spatiotemporal scales [1,2,3]. For example, it can generate and modulate turbulence [4], initiate and organize convection [5], and transfer energy and momentum between different heights [6].
Common sources that initiate gravity waves in the atmosphere include, but are not limited to, topography, convection, wind shear, jet-front systems, and wave-wave interactions [7,8]. Of these, moist convection is considered one of the most important sources of non-stationary gravity waves [9,10]. However, convection-induced waves are still not well understood. For example, the generation mechanism of convective gravity waves remains controversial [11,12,13]. In addition, the spectra of convective gravity waves distribute in a complicated way over a broad range, which are still under-explored [14,15].
As vigorous and well-organized convective systems, both the mei-yu front and tropical cyclone (TC) have important influence on the East Asian monsoon region. Clear signals of gravity waves generated by TCs have been identified by numerous observations [16,17,18,19] and simulated successfully using mesoscale models [20,21,22,23,24]. These studies showed that the TC-generated waves have wide spatiotemporal scales, with horizontal wavelengths of 10–2000 km and periods of 10 min–2.5 days. In contrast, there has been little research into gravity waves generated by the mei-yu front [25,26,27]. Appearing as a warm-season quasi-stationary frontal zone extending from Eastern China to Japan, the mei-yu front contains lots of convective cells, which successively form along the front and gradually organize into quasi-two-dimensional (2D) precipitation bandings, and thus tends to cause persistent precipitation [28,29,30]. It differs from the common midlatitude front by a weak temperature gradient but a strong moisture gradient, and the frontal zone is characterized by intense equivalent potential temperature gradient [31,32]. Sun [25] analyzed the mesoscale-β-scale gravity-wave activity during a mei-yu front heavy rain process using surface observation data. She identified the waves with wavelength of 200 km, amplitude of 2 hPa, and periods of 6–8 h. Hu [27] discussed the generation, propagation, and dispersion of gravity waves in the mei-yu front based on a linear model with a simple parameterized cumulus heating expression. Based on an idealized model constructed by Peng et al. [33], Wang et al. [34] recently performed high-resolution simulations to investigate the generation mechanism of gravity waves in the mei-yu front system. A mechanical oscillator mechanism was suggested as playing a dominant role in the generation of lower-stratospheric waves.
Due to relatively coarse spatiotemporal resolution, most general circulation models (GCMs) have still been unable to resolve short-scale and high-frequency gravity waves precisely. Consequently, representing the effects of gravity waves in GCMs requires parameterization [35]. However, because of the complexity of convection-induced gravity waves, the relevant parameterization remains under development [36,37,38,39,40]. It has been a consensus that a comprehensive knowledge of convective waves is the premise of making a breakthrough in parameterization. Under this background, understanding convective gravity waves and their convective sources is not only a theoretical interest in wave dynamics but also essential to the improvement of gravity-wave parameterization in GCMs. This is because previous studies showed that the lack of an accurate understanding of convective sources limits the potential calibration of gravity-wave parameterizations with the growing number of observations, and might be a cause of systematic errors [41].
Although they are both significant sources of gravity waves, the mei-yu front and TC display considerably different structures; the former is a quasi-2D linear system, whereas the latter is a vortex-like system. This significant difference of wave-source structure provides us a good opportunity to explore the relation between wave sources and the generated waves by comparison study. What are the spectral features of gravity waves in these two systems? Do prominent spectral differences exist between them? In this paper, the spectra of gravity waves generated by the mei-yu front and TC are investigated and compared using idealized numerical simulations.

2. Experimental Design

The numerical model used in this study is the Advanced Research version of the Weather Research and Forecasting (ARW-WRF) model [42].
In the simulation of the mei-yu front, the domain size is 1000 km × 2000 km and the boundary condition is periodic in the x direction and open in the y direction. An initial front is first constructed in the yz plane and then expanded to three-dimensional space by assuming zonal homogeneity; thus the front is oriented in the x direction. Environmental moisture and temperature are based on a real sounding during a typical mei-yu period. Further details of the model design can be found in Peng et al. [33]. The Morrison scheme is used for microphysics parameterization [43], and no planetary boundary layer scheme is used.
The TC is simulated in a 2000 km × 2000 km domain with double periodic boundary conditions. An initial axisymmetric vortex in hydrostatic and gradient-wind balance, with maximum tangential surface wind speed of 15 m s−1 at a radius of 135 km, is centered in the model domain. The Jordan [44] mean hurricane season sounding is used for the environmental moisture and temperature profile, and no environmental mean flow exists. The sea surface temperature is fixed at 29 °C. The simulation uses the Yonsei University (YSU) boundary layer scheme [45] with the surface layer scheme of Dudhia et al. [46], and WRF single-moment six-class (WSM6) microphysics [47].
Both simulations are performed on the f plane with 5-km horizontal grid spacing, and the Coriolis parameter f is set to 1.0 × 10⁻⁴ and 5.0 × 10⁻⁵ s−1 for the mei-yu front and TC simulations, respectively. Note that according to the results of sensitivity experiments (not shown), the difference of microphysics parameterization and Coriolis parameter between these two simulations does not affect the results and conclusions in this study. The model has 61 vertical levels, with the top at 30 km and Rayleigh damping applied to the vertical velocity in the upper 5 km of the model domain to prevent artificial reflection of gravity waves from the model top [48]. Nested domains are not adopted to avoid the possibility of spurious reflection and distortion of waves from the lateral boundaries [49]. For simplicity, both topography and radiation are ignored.

3. Results

3.1. Overview of the Simulations

Mass-weighted average vertical kinetic energy, defined as VKE = 1 2 ρ w 2 d x d y d z / ρ d x d y d z , is calculated to describe the evolution of the simulated mei-yu front system (Figure 1a), where ρ and w are density and vertical wind, respectively. The integration of the front is performed for z = 0–15 km over the entire horizontal domain. As seen in previous studies of the idealized mei-yu front [33], no convection occurs during the initial adjustment of the front. During the intensification phase (t = 15–25 h), the moist convection bursts at 15 h and reaches its peak at 16 h, with a maximum vertical kinetic energy of 0.044 m2 s–2. The convection then gradually weakens and maintains a steady intensity in the mature phase (t = 26–36 h), during which the typical mei-yu frontal structure is established (not shown). The 1-h accumulated precipitation at 26 h exhibits a classical meso-α-scale rainband of the mei-yu front, with several embedded rain clusters (Figure 1b).
The time series of 10-m maximum wind speed of the simulated TC is shown in Figure 1c. The wind speed increases notably from ~24 h, implying the intensification of the TC. The maximum intensity occurs at 92 h, with a 10-m maximum wind speed of ~70 m s−1 as the TC reaches maturity.
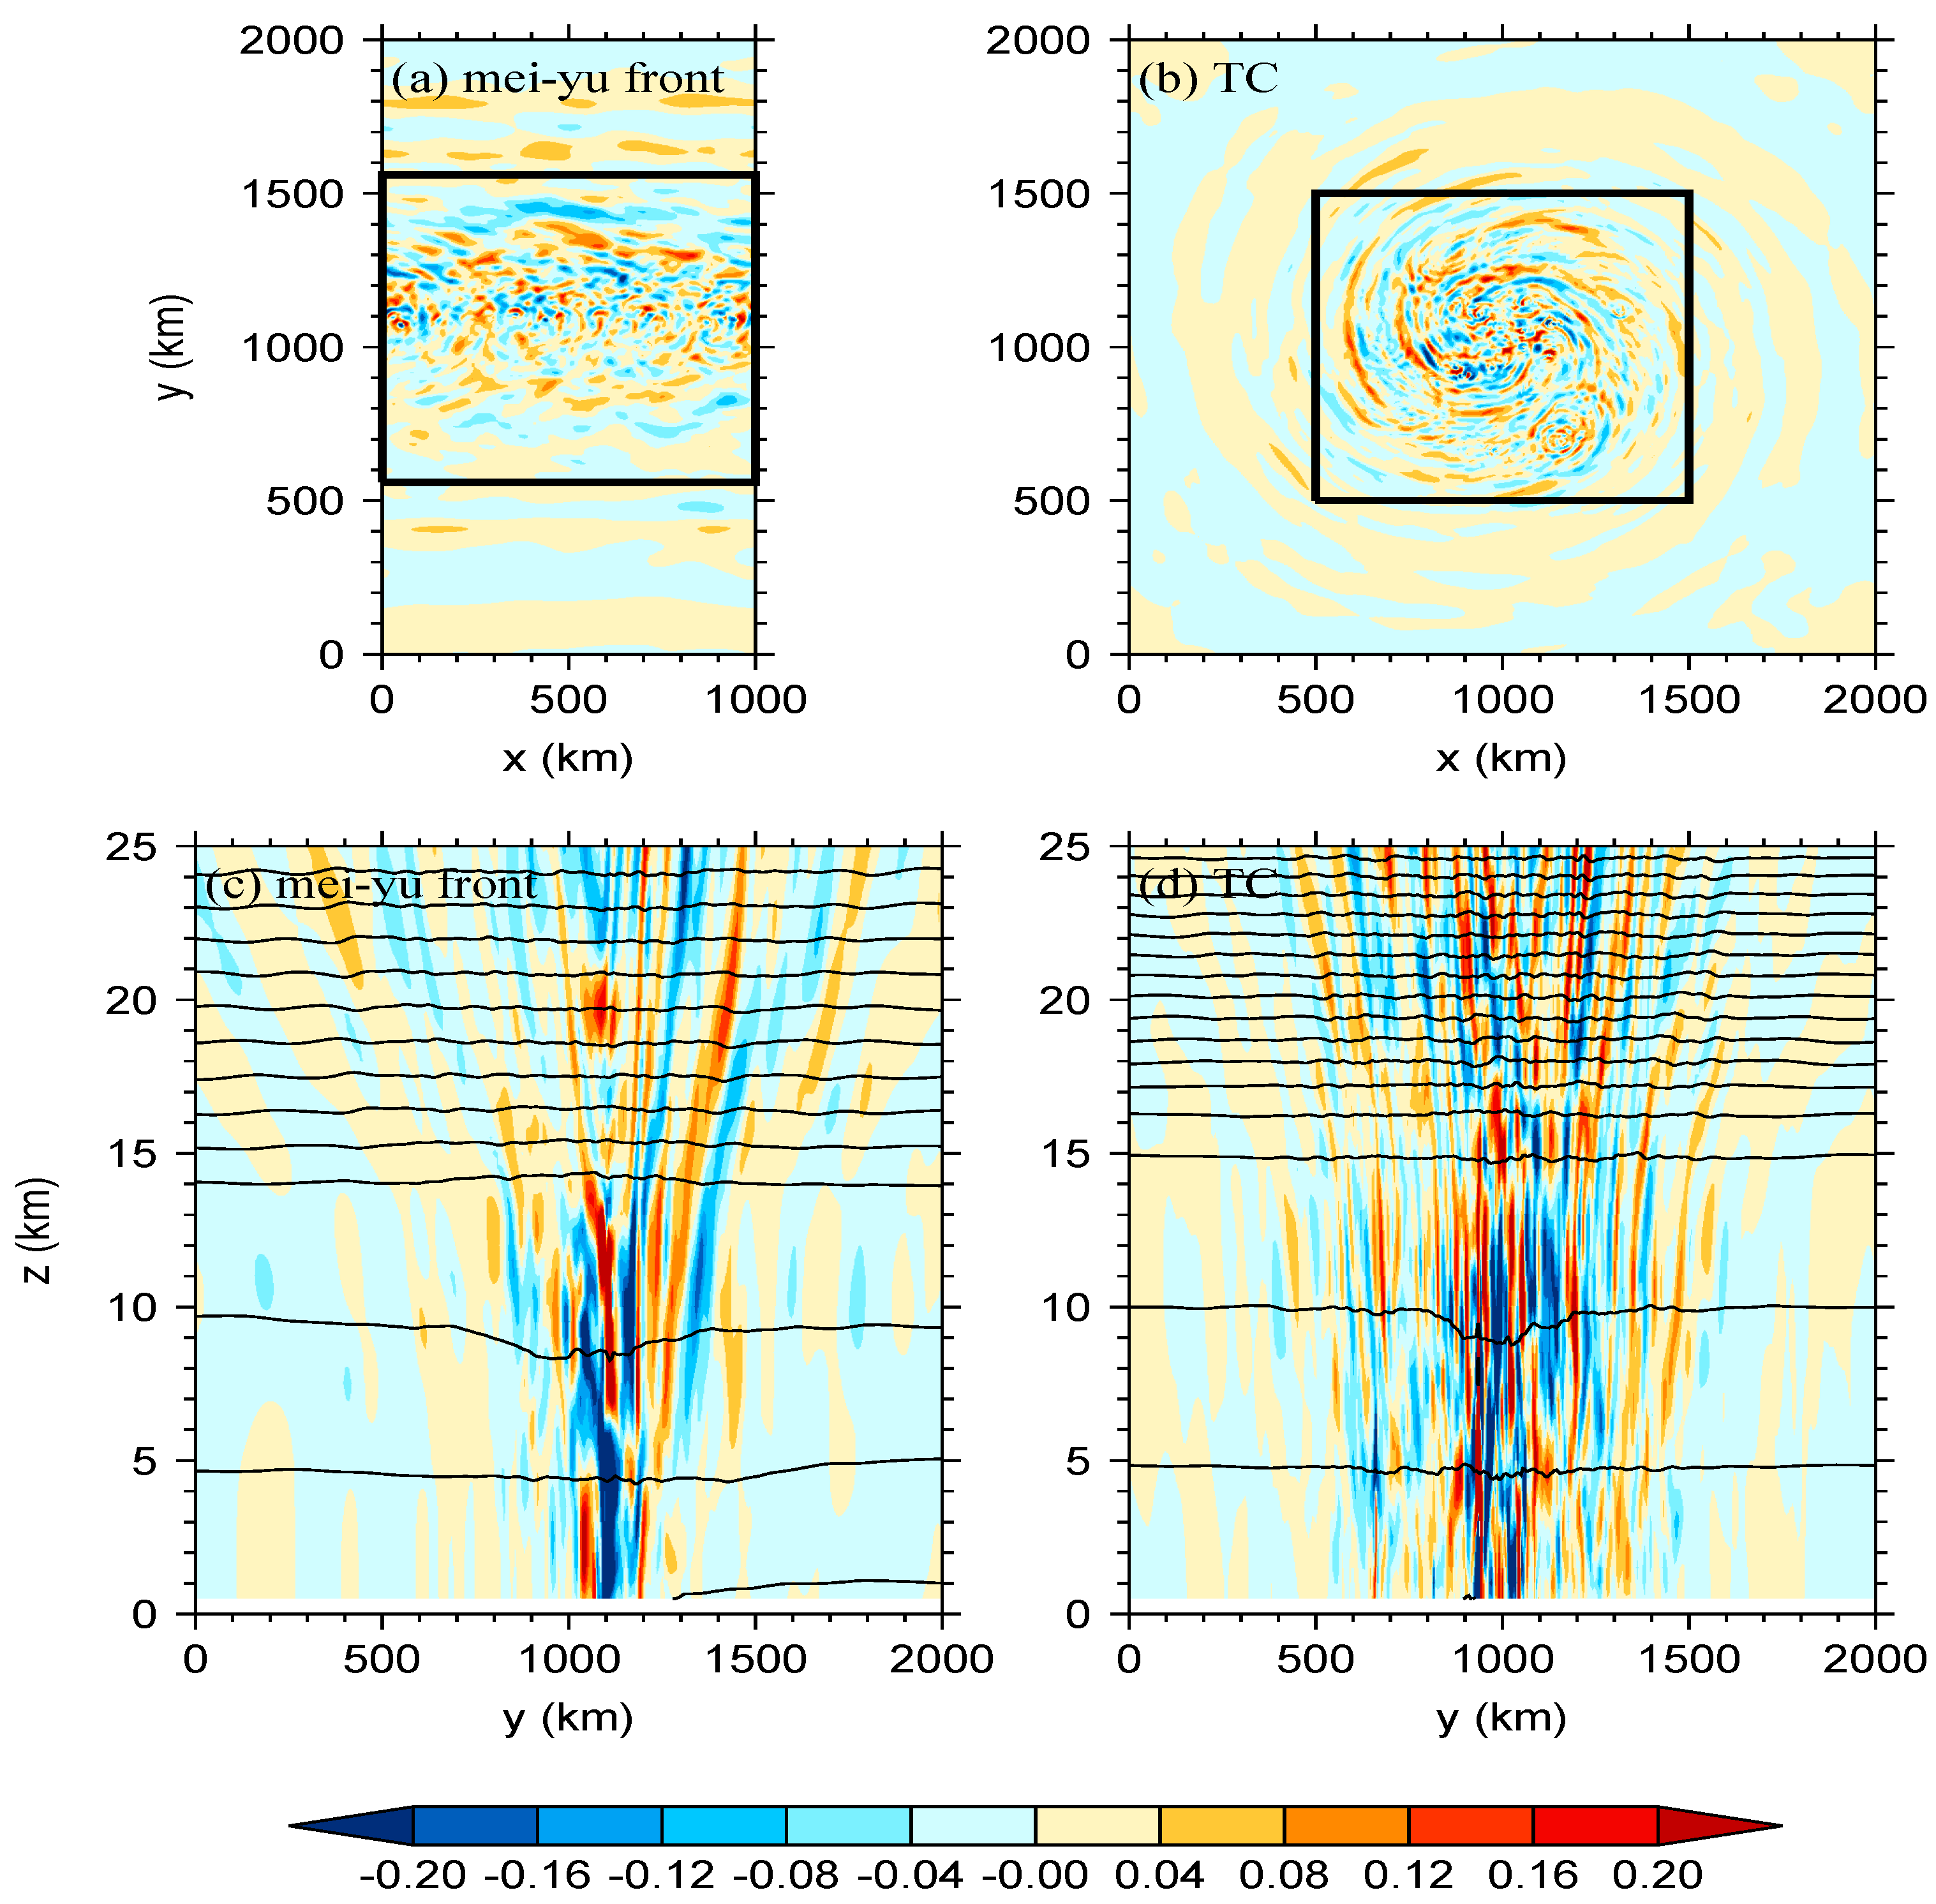
Figure 2 shows the horizontal and vertical cross sections of vertical velocity and potential temperature at selected times for the simulated mei-yu front and TC. For the mei-yu front at 26 h, the strongest convection is located along y = ~1100 km (Figure 1b). Prominent gravity-wave signals appear in the lower stratosphere at 17 km, well above the convection (Figure 2a). For the TC at 104 h, the lower-stratospheric waves exhibit a circular concentric distribution, radiating outwards from the storm center (Figure 2b). In the vertical cross sections, the waves generated in both systems show the typical pattern of convective gravity waves. Upright convection in the troposphere induces waves propagating upward into the lower stratosphere, and propagating outward both upstream and downstream (Figure 2c,d).

3.2. Spectral Analysis of the Lower-Stratospheric Gravity Waves

In this section, the spectral characteristics of the lower-stratospheric gravity waves during the mature phase of the mei-yu front and TC are investigated in detail using data with a time interval of 5 min. The TC has a longer life cycle than the mei-yu front. However, to facilitate the comparison of gravity waves in these two systems, we define the mature phase of the simulated TC, which is comparable in length of time with that of the mei-yu front, as t = 104–114 h according to the minimum 10-h standard deviation of the 10-m maximum wind speed. For exactly the same reason, a 1000 km × 1000 km horizontal domain is used to perform wave analysis for both systems. According to the position of the rainband, the wave analysis domain for the mei-yu front is determined as 0 < x < 1000 km, 560 < y < 1560 km (Figure 2a), such that the quasi-zonal strong updraft approximately coincides with the zonal central axis of the analysis domain. Due to the absence of environmental flow, the TC moves little, with its center almost always located at (x, y) = (1000, 1000) km. The wave analysis domain for the TC is therefore 500 < x < 1500 km, 500 < y < 1500 km (Figure 2b). For convenience, we hereafter denote the wave analysis domain as –500 < x < 500 km, –500 < y < 500 km.
Gravity wave perturbations are calculated as in Kim et al. [20]. The components that satisfy the vertical propagation condition of inertia-gravity waves ( f < ω ^ < N ) are extracted, where ω ^ is the intrinsic frequency and N is the Brunt-Väisälä frequency.
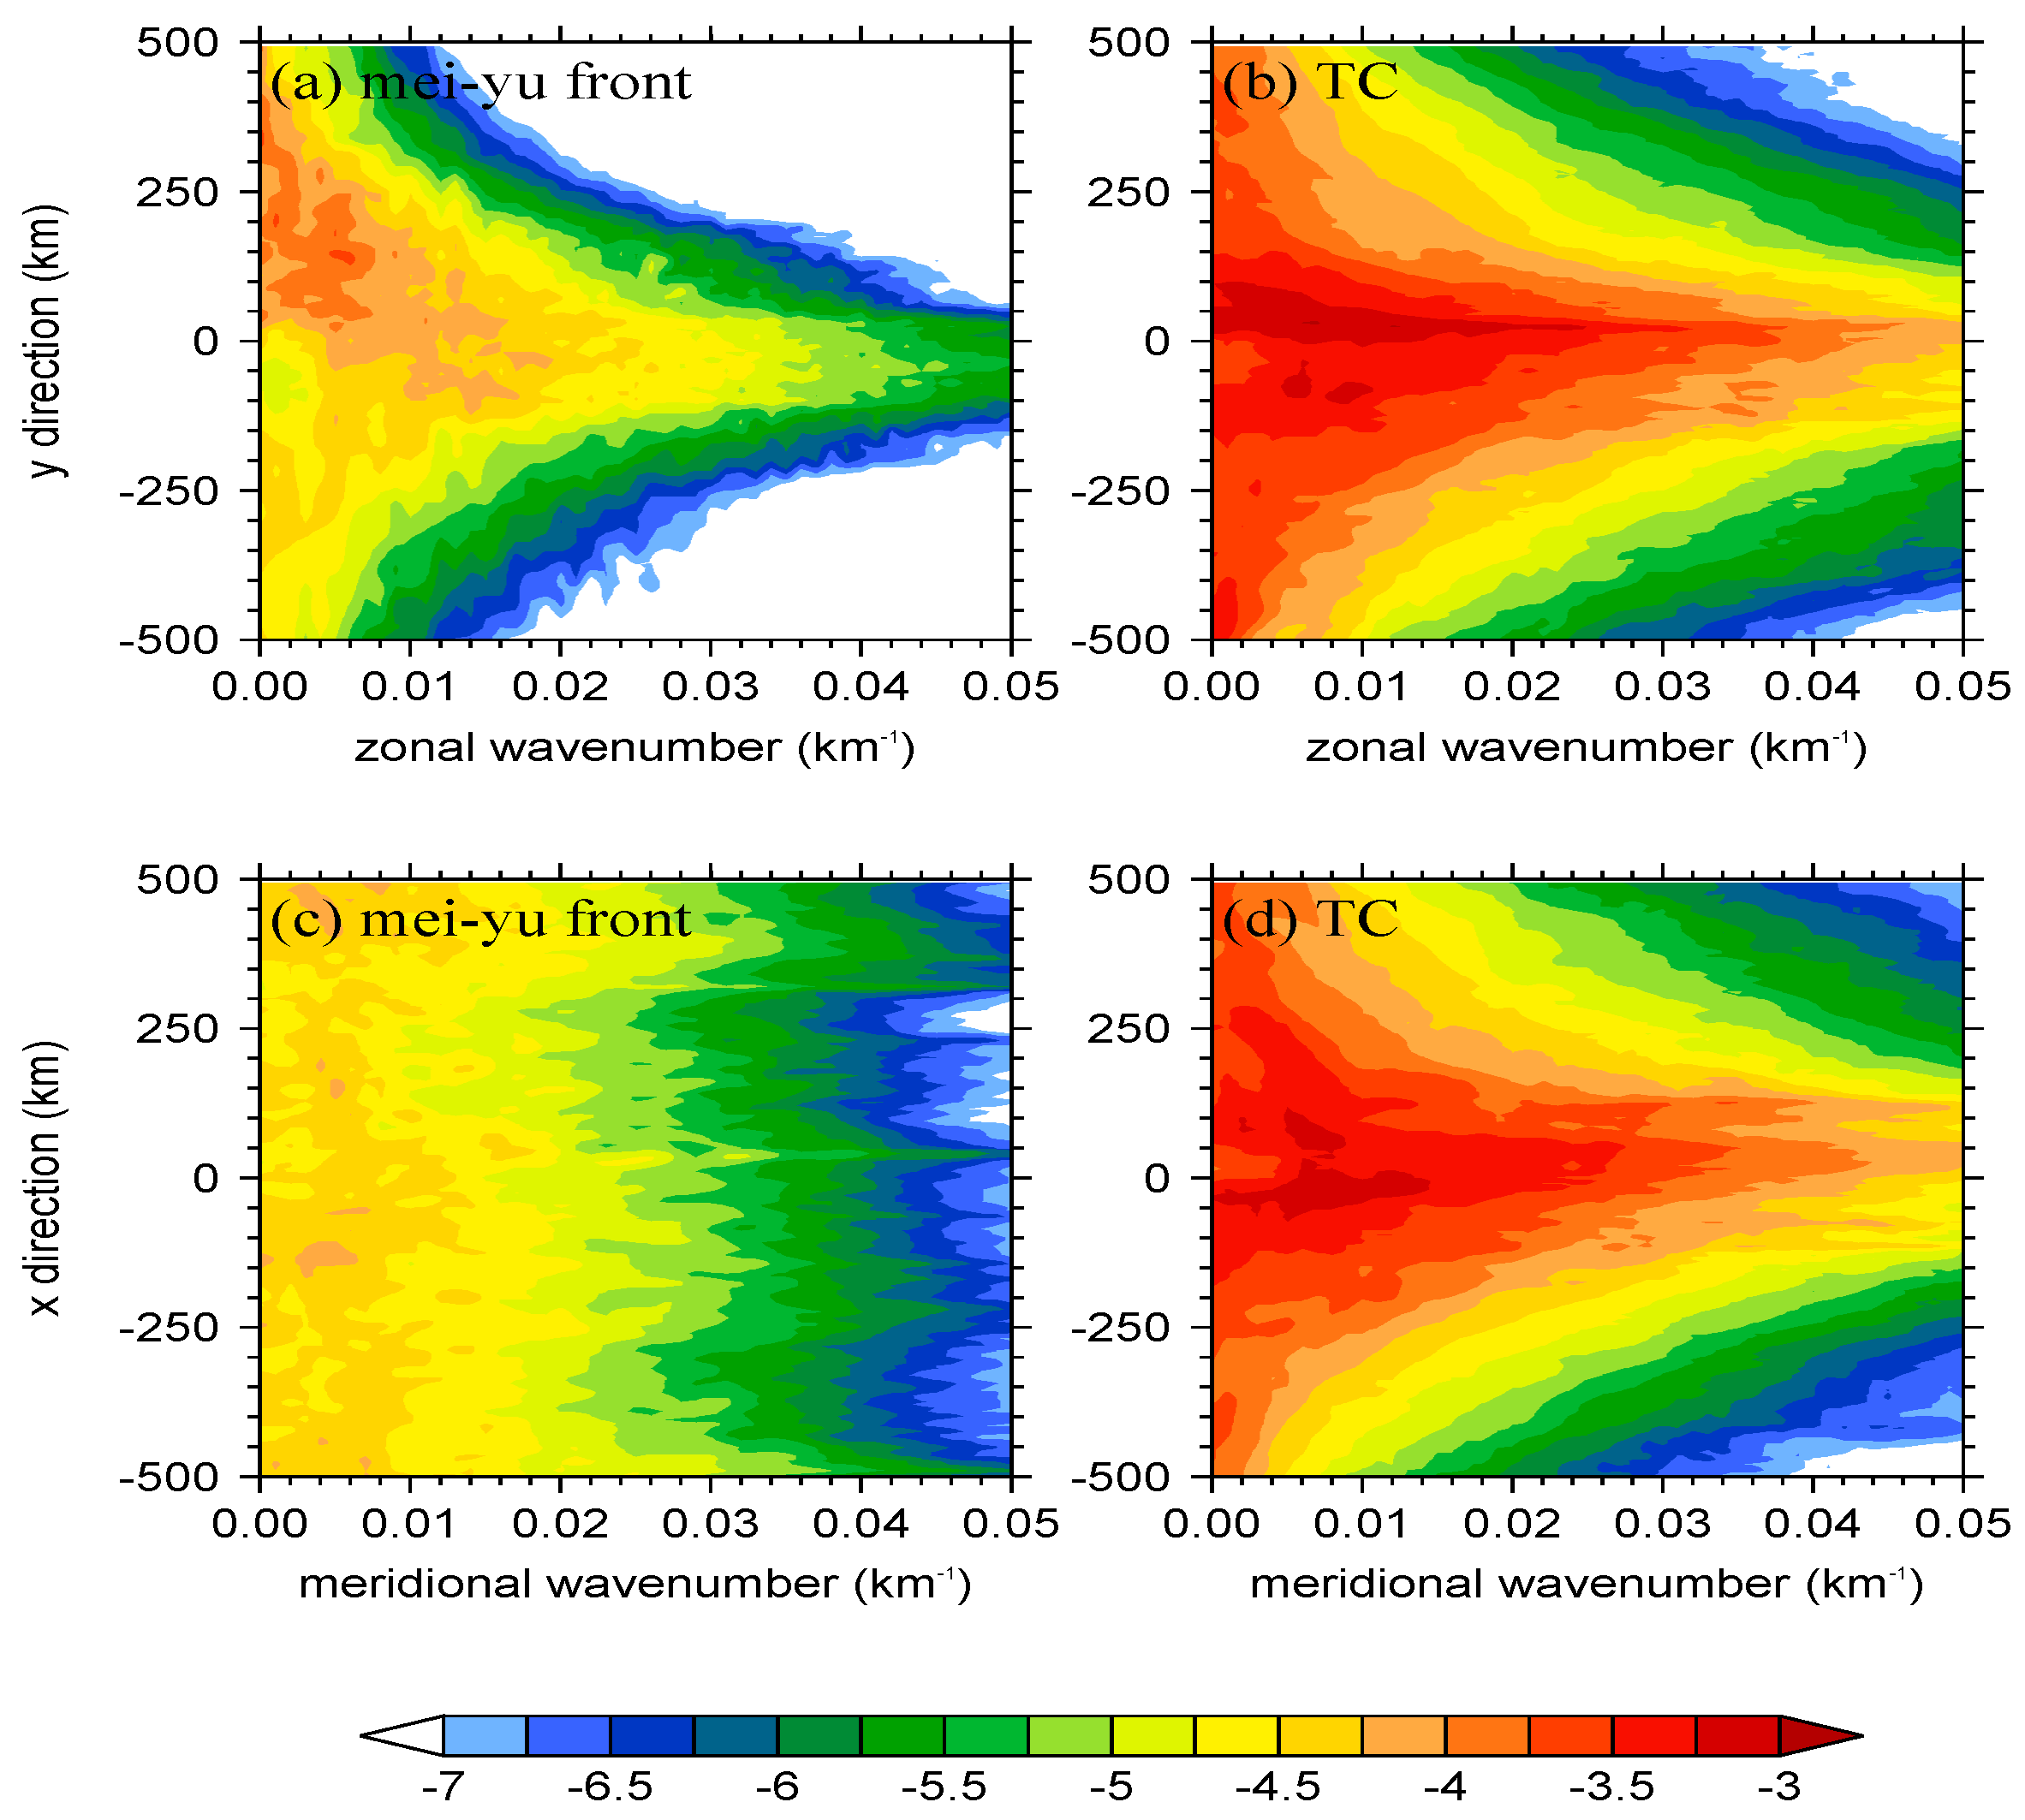
Figure 3 shows the power spectral densities (PSDs) of w GW at 17 km with respect to horizontal wavenumber, where w GW denotes the wave perturbations of w. The PSDs are obtained by performing the one-dimensional fast Fourier transform in the zonal or meridional directions over the wave analysis domains, then averaged over time through the mature phase. For the mei-yu front, the PSDs with respect to zonal wavenumber k exhibit clear meridional dependence (Figure 3a). Along the quasi-zonal strong frontal updraft (i.e., y = 0 km), the dominant zonal wavenumbers are 0.004–0.012 km−1 (i.e., wavelengths are 83–250 km). Away from the updraft, the PSDs generally weaken, especially for larger wavenumbers (smaller wavelengths). In contrast, the distribution of PSDs with respect to meridional wavenumber l is nearly uniform along the x direction (Figure 3c). The dominant meridional wavenumbers of the waves are always smaller than 0.01 km−1 (i.e., wavelengths are larger than 100 km) at different zonal positions. The waves in the TC exhibit much greater power than those in the mei-yu front (Figure 3b,d). The distribution of PSDs with respect to zonal wavenumber is almost symmetrical, about y = 0 km, and the distribution with respect to meridional wavenumber is almost symmetrical about x = 0 km. Away from the TC center, the wave energy at various scales weakens.
By performing the 2D fast Fourier transform at the horizontal surface, we can get the 2D w GW spectra at 17 km with respect to the zonal and meridional wavenumber (Figure 4a,b). The distribution of PSDs in the mei-yu front shows directional selectivity, with notably deficient power found along 0°. By contrast, the distribution of relatively strong power tends to be closer to directions around 90° and 270° (Figure 4a). This suggests that the cross-frontal meridional-propagating waves dominate gravity waves generated in the front. The waves in the TC have richer information in the wavenumber space, and the PSDs exhibit a standard concentric-circle distribution around (k, l) = (0, 0) km−1 (Figure 4b). This means that the strong convection in the TC can initiate gravity waves at various horizontal scales, which propagate equally in various horizontal directions.
As highly organized convective systems, the mei-yu front and TC both consist of numerous convection clusters that continuously radiate gravity waves. They are, therefore, strong gravity wave radiators. However, the convection clusters are distinctly organized; the mei-yu front is a quasi-2D linear system, whereas the TC is a vortex-like system. Consequently, presented in Figure 3 and Figure 4a,b, the difference in system structure gives different characteristics to the sources of gravity waves. The mei-yu front appears as a line (or narrow-band) source, the waves are radiated from the line, such that the propagation of gravity waves show obvious anisotropic, and the dominant waves propagate outwards perpendicular to the line. The front in this study is aligned in the zonal direction, thus the meridional-propagating waves dominate, showing a certain zonal homogeneity. The TC, in contrast, appears as a point (or circle) source, and the waves are radiated outwards from the point in all azimuthal directions, such that their propagation is more isotropic.
The PSDs of w GW with respect to meridional wavenumber and frequency ω are shown in Figure 4c,d. The spectra are calculated over yt surfaces, and then averaged along the zonal direction. Note that the positive frequency implies northward propagation and negative frequency implies southward propagation. For the waves in the mei-yu front (Figure 4c), the northward-propagating components show greater power than the southward-propagating components. The former have dominant meridional wavenumbers of 0.003–0.008 km−1 (i.e., wavelengths of 125–333 km) and frequencies of 0.005–0.01 min−1 (i.e., periods of 100–200 min), whereas the latter have dominant meridional wavenumbers smaller than 0.004 km−1 (i.e., wavelengths larger than 250 km) and frequencies of 0.007–0.012 min−1 (i.e., periods of 83–143 min). The difference between waves propagating northwards and southwards is derived mainly from the background northerly wind in the lower stratosphere, which filters and modifies the wave spectra to some extent [34].
For the waves in the TC (Figure 4d), the PSDs are always symmetrical, about ω = 0 , indicating that the wave components propagating in various directions share similar property. Differing from those in the mei-yu front, the PSDs in the TC do not show local spectral peaks at certain wavenumbers and frequencies, but have continual large values for wavenumbers smaller than 0.016 km−1 (i.e., wavelengths larger than 62.5 km) and frequencies of 0.0017–0.03 min−1 (i.e., periods of 33–600 min).
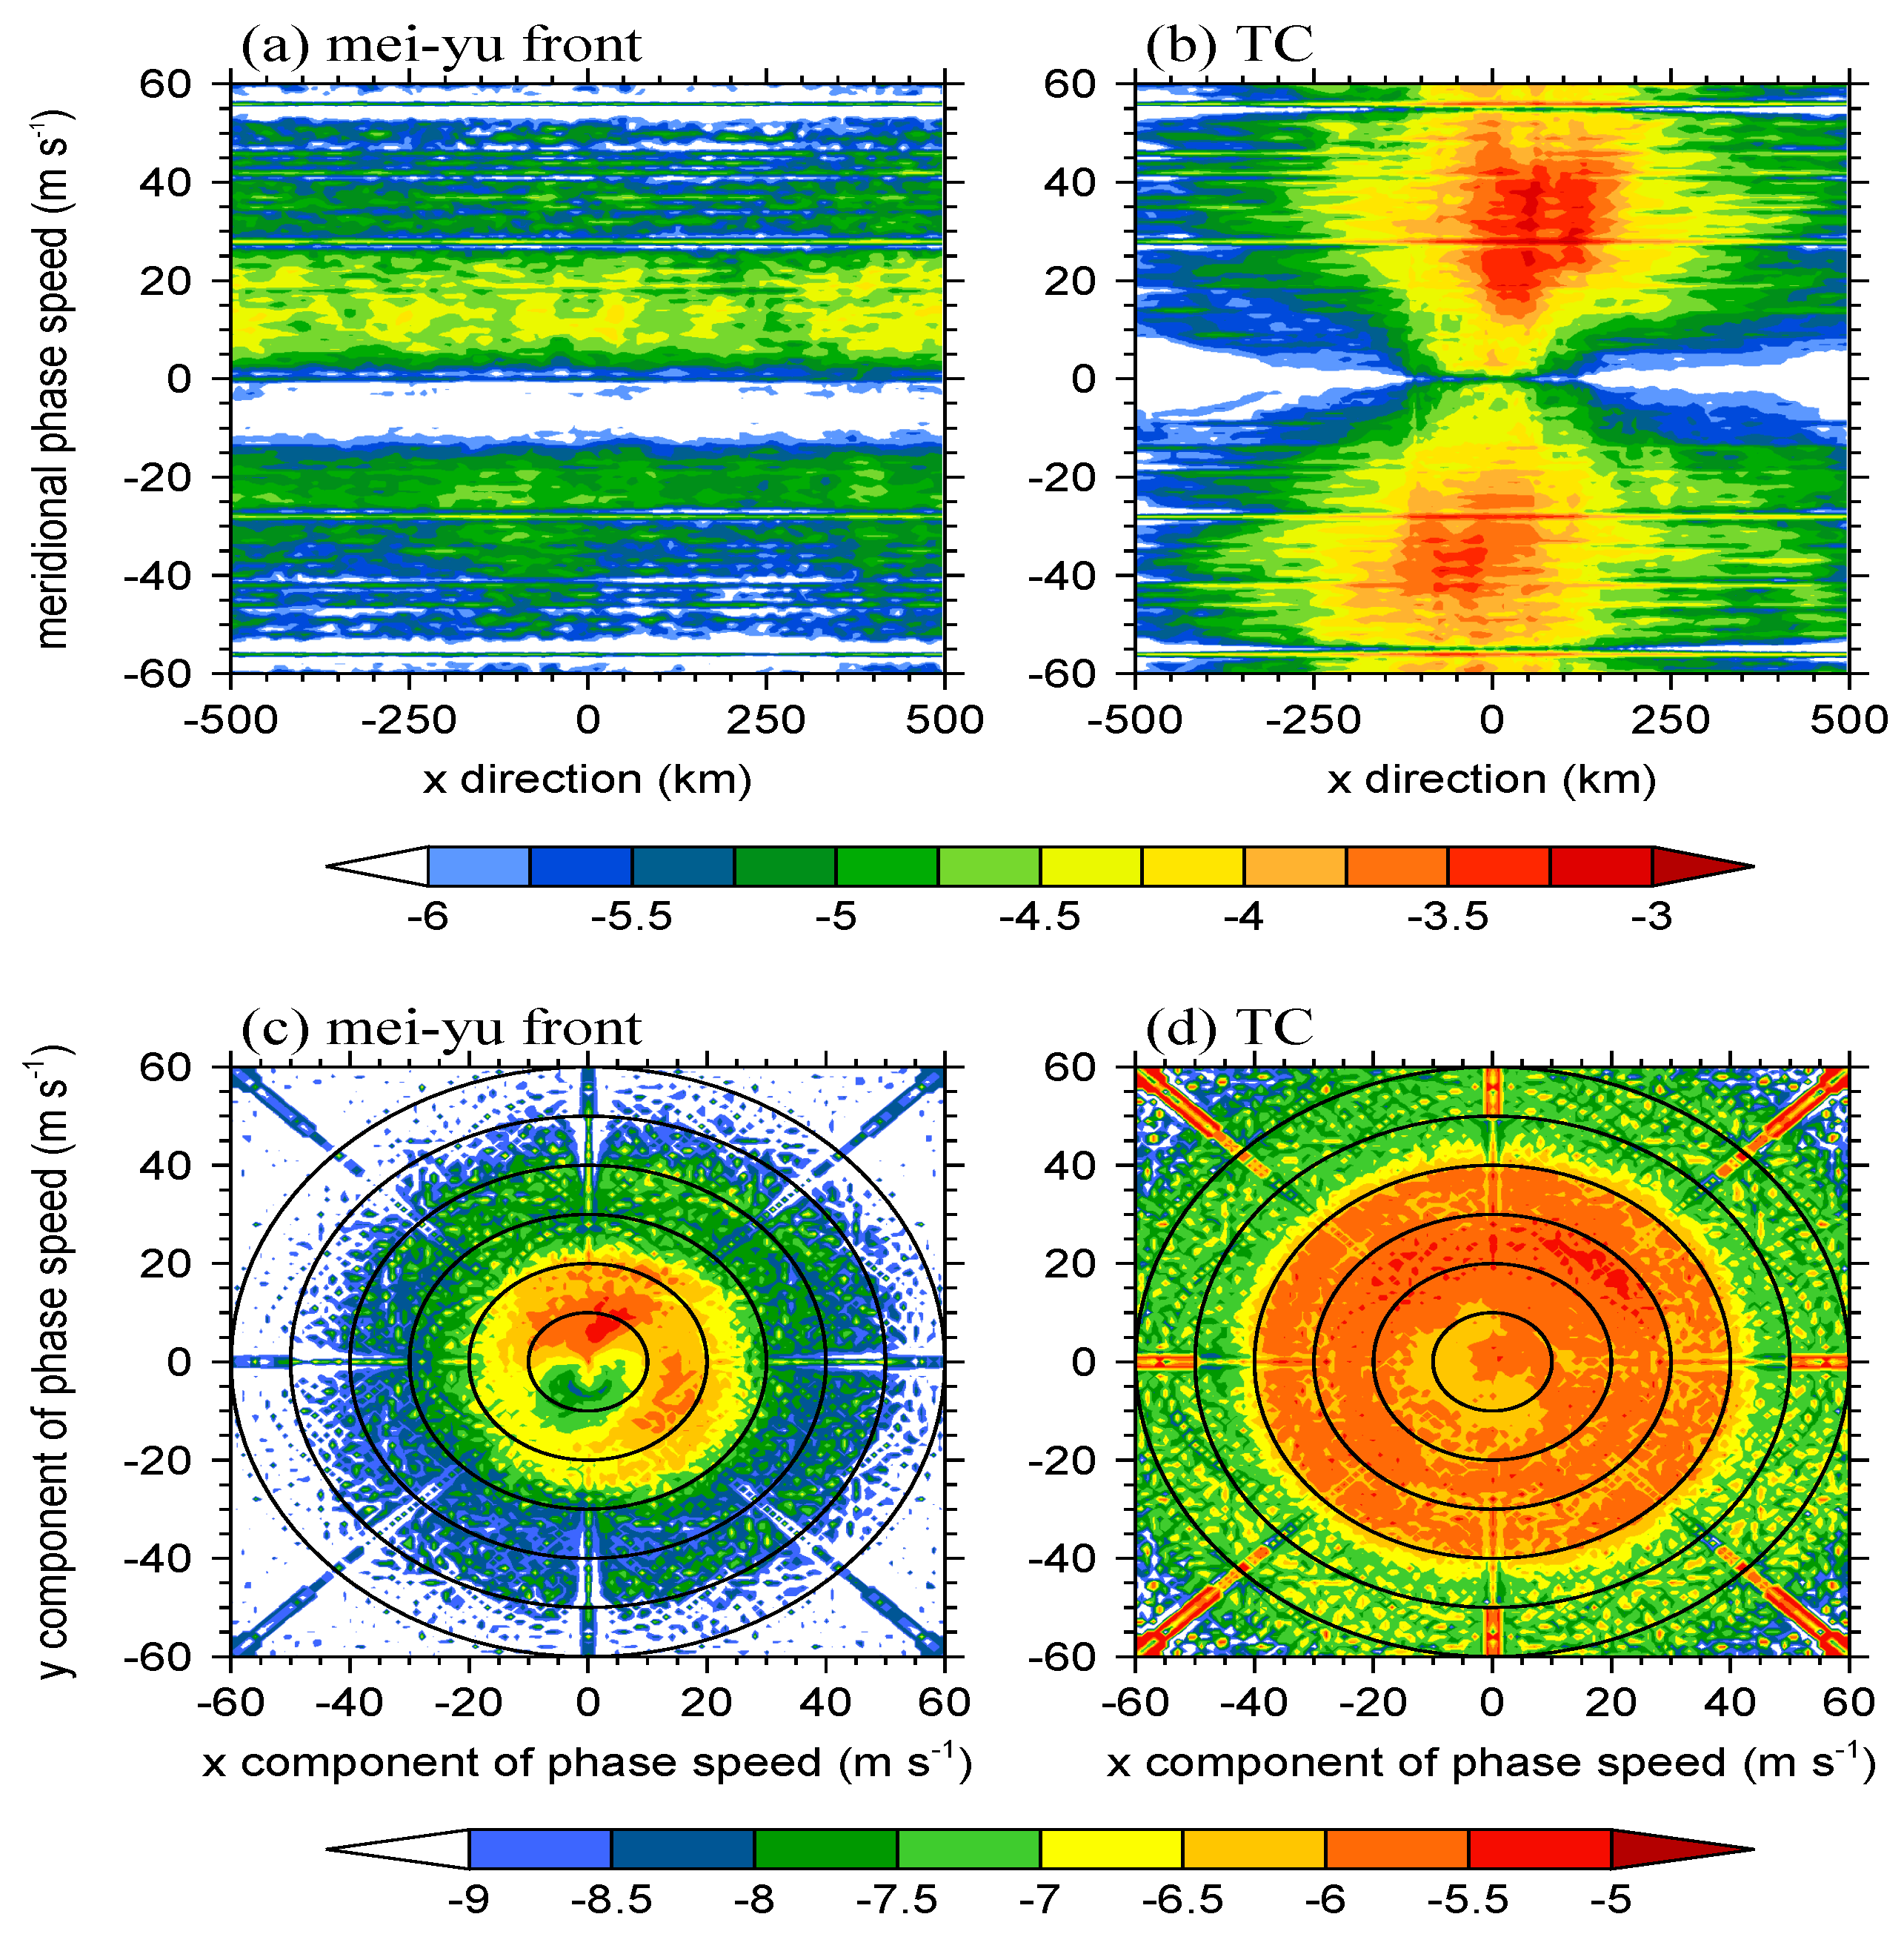
The meridional phase speed (Cpy) spectra of w GW can be further obtained from the corresponding wavenumber–frequency spectra (Figure 5a,b). As expected, the spectra of waves in the mei-yu front exhibit strong zonal homogeneity (Figure 5a). Under the effect of the background northerly wind, the power of the northward-propagating waves is generally stronger than that of the southward-propagating waves. The dominant phase speeds are 5 < Cpy < 25 m s−1 for the former and –30 < Cpy < –15 m s−1 for the latter. The phase speed of the waves is more broadly distributed in the TC than in the mei-yu front, with the dominant phase speeds being 10–55 m s−1 (Figure 5b).
To examine the wave components propagating in all directions, we provide the distribution of w GW spectra at various magnitudes and propagation directions of the horizontal phase speed in Figure 5c,d, which are calculated using the similar procedures as Wei et al. [15] (Equations (A16)–(A18)). In the mei-yu front, the PSDs exist mainly in the region with phase speeds slower than ~30 m s−1 (Figure 5c). On this basis, the waves show greater power in the two northward quadrants than in the two southward quadrants. For the northward-propagating components, the waves at angles of ~45–135°, with phase speeds slower than ~15 m s−1 dominate. For the southward-propagating components, the waves around an angle of 315° with phase speeds of 15–20 m s−1 dominate. Moreover, note that a notable deficiency of power exists between ~225 and ~315° in the two southward quadrants, with phase speeds slower than ~15 m s−1. In the TC, the waves show a quasi-isotropic distribution, with considerable power in almost all horizontal directions for phase speeds slower than ~40 m s−1 (Figure 5d). This means that convection in the TC excites strong gravity-wave signals at a broad range of phase speeds in various directions. A slight deficiency of power for phase speeds slower than ~15 m s−1 implies that the slowly propagating waves are relatively weak.

4. Conclusions

Based on cloud-permitting simulations using the WRF model, this study compares the spectral characteristics of lower-stratospheric gravity waves in an idealized mei-yu front and TC. These two systems organize convection in different forms, which results in distinctly different presentation of the generated waves. The mei-yu front approximates to a line wave source and the generated waves propagate mainly across the front. The spectral properties of cross-frontal propagating waves remain quasi-consistent along the front. The TC resembles a point wave source, which radiates waves outwards from the storm center equally in all azimuthal directions; therefore, the wave spectra always show isotropic. The distinct difference of gravity waves in these two systems implies that the structure feature of the specific convective system should be considered in attempt to parameterize convective gravity waves in GCMs.
Filtering and modification by background northerly wind in the lower stratosphere cause the northward and southward components of gravity waves in the mei-yu front to be asymmetrical. The northward components are generally stronger than the southward components, and they show differences in spectral properties. The former (latter) have dominant meridional wavelengths of 125–333 km (> 250 km) and periods of 100–200 min (83–143 min). The northward-propagating waves are most notable at azimuths of ~45–135°, with dominant phase speeds slower than ~15 m s−1; while the southward-propagating waves are remarkable around the azimuth of 315°, with dominant phase speeds of 15–20 m s−1.
Benefitting from the motionless background atmosphere from the troposphere to the lower stratosphere, the isotropic spectral properties of waves in the TC are well preserved. Compared with waves in the mei-yu front, those in the TC exhibit greater power and broader distributions in the spectral space. They are continually prominent at horizontal wavelengths longer than 62.5 km, periods of 33–600 min, and phase speeds slower than ~40 m s−1.
The mei-yu front and TC are both typical convective systems, but the waves which they generated exhibit considerably different spectral characteristics. The diversity of system structure combined with changeable environmental conditions make convective gravity waves in real atmosphere an intricate phenomenon. Note that we have only reserved the background wind essential for the evolution of front in our mei-yu front simulation, and even ignored it entirely in the TC simulation for simplicity. However, background flows in real atmosphere are not negligible, which will exert a significant influence on gravity waves [14,20]. Varying degrees of convective instability also have the potential of modifying convective gravity waves [15]. Furthermore, recent studies showed that radiative forcing, which is ignored in our TC simulation, can impact storm structure [50]. It is, therefore, reasonable to speculate that radiative forcing can also influence TC-generated waves by modifying system structure. Future work will systematically explore such issues.

Author Contributions

Conceptualization, Y.W., L.Z. and Y.Z.; formal analysis, Y.W.; methodology, Y.W. and J.P.; software, Y.W. and T.W.; validation, J.P. and T.W.; writing—original draft, Y.W.; writing—review and editing, L.Z. and J.P.

Funding

This research was funded by the Beijige Open Research Fund for Nanjing Joint Center of Atmospheric Research, grant number NJCAR2018ZD03; the National Natural Science Foundation for Young Scientists of China, grant number 41705037 and 41805092; the National Natural Science Foundation of China, grant number 41775123 and 41375063.

Conflicts of Interest

The authors declare no conflicts of interest.

References

  1. Xu, X.; Shu, S.; Wang, Y. Another look on the structure of mountain waves: A spectral perspective. Atmos. Res. 2017, 191, 156–163. [Google Scholar] [CrossRef] [Green Version]
  2. Dörnbrack, A.; Gisinger, S.; Kaifler, N.; Portele, T.C.; Bramberger, M.; Rapp, M.; Gerding, M.; Söder, J.; Žagar, N.; Jelić, D. Gravity waves excited during a minor sudden stratospheric warming. Atmos. Chem. Phys. 2018, 18, 12915–12931. [Google Scholar] [CrossRef] [Green Version]
  3. Podglajen, A.; Plougonven, R.; Hertzog, A.; Jensen, E. Impact of gravity waves on the motion and distribution of atmospheric ice particles. Atmos. Chem. Phys. 2018, 18, 10799–10823. [Google Scholar] [CrossRef] [Green Version]
  4. Shapiro, M.A. Turbulent mixing within tropopause folds as a mechanism for the exchange of chemical constituents between the stratosphere and troposphere. J. Atmos. Sci. 1980, 37, 994–1004. [Google Scholar] [CrossRef]
  5. Lane, T.P.; Zhang, F. Coupling between gravity waves and tropical convection at mesoscales. J. Atmos. Sci. 2011, 68, 2582–2598. [Google Scholar] [CrossRef]
  6. Holton, J.R.; Haynes, P.H.; McIntyre, M.E.; Douglass, A.R.; Road, R.B.; Pfister, L. Stratosphere–troposphere exchange. Rev. Geophys. 1995, 33, 403–439. [Google Scholar] [CrossRef]
  7. Fritts, D.C.; Alexander, M.J. Gravity wave dynamics and effects in the middle atmosphere. Rev. Geophys. 2003, 41, 1003. [Google Scholar] [CrossRef]
  8. Kim, Y.-J.; Eckermann, S.D.; Chun, H.-Y. An overview of the past, present and future of gravity-wave drag parametrization for numerical climate and weather prediction models. Atmos. Ocean 2003, 41, 65–98. [Google Scholar]
  9. Alexander, M.J.; Beres, J.H.; Pfister, L. Tropical stratospheric gravity wave activity and relationships to clouds. J. Geophys. Res. 2000, 105, 22299–22309. [Google Scholar] [CrossRef]
  10. Halliday, O.H.; Griffiths, S.D.; Parker, D.J.; Stirling, A.; Vosper, S. Forced gravity waves and the tropospheric response to convection. Q. J. R. Meteorol. Soc. 2018, 144, 917–933. [Google Scholar] [CrossRef] [Green Version]
  11. Baik, J.-J.; Hwang, H.-S.; Chun, H.-Y. Transient, linear dynamics of a stably stratified shear flow with thermal forcing and a critical level. J. Atmos. Sci. 1999, 56, 483–499. [Google Scholar] [CrossRef]
  12. Alexander, M.J.; Vincent, R.A. Gravity waves in the tropical lower stratosphere: A model study of seasonal and interannual variability. J. Geophys. Res. 2000, 105, 17983–17993. [Google Scholar] [CrossRef]
  13. Lane, T.P.; Reeder, M.J.; Clark, T.L. Numerical modeling of gravity wave generation by deep tropical convection. J. Atmos. Sci. 2001, 58, 1249–1274. [Google Scholar] [CrossRef]
  14. Beres, J.H.; Alexander, M.J.; Holton, J.R. Effects of tropospheric wind shear on the spectrum of convectively generated gravity waves. J. Atmos. Sci. 2002, 59, 1805–1824. [Google Scholar] [CrossRef]
  15. Wei, J.; Zhang, F.; Richter, J.H. An analysis of gravity wave spectral characteristics in moist baroclinic jet-front systems. J. Atmos. Sci. 2016, 73, 3133–3155. [Google Scholar] [CrossRef]
  16. Pfister, L.; Chan, K.R.; Bui, T.P.; Bowen, S.; Legg, M.; Gary, B.; Kelly, K.; Proffitt, M.; Starr, W. Gravity waves generated by a tropical cyclone during the STEP tropical field program: A case study. J. Geophys. Res. 1993, 98, 8611–8638. [Google Scholar] [CrossRef]
  17. Niranjan Kumar, K.; Kanaka Rao, C.H.; Sandeep, A.; Rao, T.N. SODAR observations of inertia-gravity waves in the atmospheric boundary layer during the passage of tropical cyclone. Atmos. Sci. Lett. 2014, 15, 120–126. [Google Scholar] [CrossRef]
  18. Yue, J.; Miller, S.D.; Hoffman, L.; Straka, W.C., III. Stratospheric and mesospheric concentric gravity waves over tropical cyclone Mahasen: Joint AIRS and VIIRS satellite observations. J. Atmos. Sol. Terr. Phys. 2014, 119, 83–90. [Google Scholar] [CrossRef]
  19. Nolan, D.S.; Zhang, J.A. Spiral gravity waves radiating from tropical cyclones. Geophys. Res. Lett. 2017, 44, 3924–3931. [Google Scholar] [CrossRef]
  20. Kim, S.-Y.; Chun, H.-Y.; Wu, D.L. A study on stratospheric gravity waves generated by Typhoon Ewiniar: Numerical simulations and observations. J. Geophys. Res. 2009, 114, D22104. [Google Scholar] [CrossRef]
  21. Kuester, M.A.; Alexander, M.J.; Ray, E.A. A model study of gravity waves over Hurricane Humberto (2001). J. Atmos. Sci. 2008, 65, 3231–3246. [Google Scholar] [CrossRef]
  22. Chen, D.; Chen, Z.Y.; Lü, D.R. Simulation of the stratospheric gravity waves generated by the Typhoon Matsa in 2005. Sci. China Earth Sci. 2012, 55, 602–610. [Google Scholar] [CrossRef]
  23. Wu, J.F.; Xue, X.H.; Liu, H.L.; Dou, X.K.; Chen, T.D. Assessment of the simulation of gravity waves generation by a tropical cyclone in the high-resolution WACCM and the WRF. J. Adv. Model Earth Syst. 2018, 10, 2214–2227. [Google Scholar] [CrossRef]
  24. Wang, Y.; Zhang, L.; Zhang, Y.; Guan, J. Effects of tropospheric vertical wind shear on gravity waves generated by tropical cyclones. Geophys. Res. Lett. 2019, 46, 4523–4530. [Google Scholar] [CrossRef]
  25. Sun, S. Activities of inertia-gravitational waves in bai-u front and their interaction with background field. Chin. J. Atmos. Sci. 1990, 14, 163–172. (In Chinese) [Google Scholar]
  26. Xu, X.; Sun, Z. Dynamic study of influence of inertial gravity waves induced by unbalanced flow on meiyu front heavy rain. Acta Meteorol. Sin. 2004, 18, 467–478. [Google Scholar]
  27. Hu, B. Evolution and propagation of MCSs over meiyu fronts and inertia gravitational wave CISK related to “low level moisture frontal zone”. Chin. J. Atmos. Sci. 2005, 29, 845–853. (In Chinese) [Google Scholar]
  28. Xu, X.; Xue, M.; Wang, Y.; Huang, H. Mechanisms of secondary convection within a Mei-Yu frontal mesoscale convective system in eastern China. J. Geophys. Res. Atmos. 2017, 122, 47–64. [Google Scholar] [CrossRef]
  29. Luo, X.; Fei, J.; Huang, X.; Ding, J.; Ma, Z. Relative roles of dry intrusion, latent heat and instabilities in the Mei-yu rainband life cycle: A case study. Atmos. Res. 2018, 214, 10–20. [Google Scholar] [CrossRef]
  30. Zhang, Y.; Zhang, F.; Davis, C.A.; Sun, J. Diurnal evolution and structure of long-lived mesoscale convective vortices along the Mei-Yu front over the East China Plains. J. Atmos. Sci. 2018, 75, 1005–1025. [Google Scholar] [CrossRef]
  31. Ding, Y. Summer monsoon rainfalls in China. J. Meteorol. Soc. Jpn. 1992, 70, 373–396. [Google Scholar] [CrossRef]
  32. Ding, Y.; Chan, J.C.L. The East Asian summer monsoon: An overview. Meteorol. Atmos. Phys. 2005, 89, 117–142. [Google Scholar]
  33. Peng, J.; Zhang, L.; Luo, Y.; Zhang, Y. Mesoscale energy spectra of the mei-yu front system. Part I: Kinetic energy spectra. J. Atmos. Sci. 2014, 71, 37–55. [Google Scholar] [CrossRef]
  34. Wang, Y.; Zhang, L.; Peng, J.; Guan, J. Mesoscale gravity waves in the mei-yu front system. J. Atmos. Sci. 2018, 75, 587–609. [Google Scholar] [CrossRef]
  35. Alexander, M.J.; Geller, M.; McLandress, C.; Polavarapu, S.; Preusse, P.; Sassi, F.; Sato, K.; Eckermann, S.; Ern, M.; Hertzog, A.; et al. Recent developments in gravity-wave effects in climate models and the global distribution of gravity-wave momentum flux from observations and models. Q. J. R. Meteorol. Soc. 2010, 136, 1103–1124. [Google Scholar] [CrossRef]
  36. Chun, H.-Y.; Choi, H.-J.; Song, I.-S. Effects of nonlinearity on convectively forced internal gravity waves: Application to a gravity wave drag parameterization. J. Atmos. Sci. 2008, 65, 557–575. [Google Scholar] [CrossRef]
  37. Choi, H.-J.; Chun, H.-Y. Momentum flux spectrum of convective gravity waves. Part I: An update of a parameterization using mesoscale simulations. J. Atmos. Sci. 2011, 68, 739–759. [Google Scholar] [CrossRef]
  38. Lott, F.; Guez, L. A stochastic parameterization of the gravity waves due to convection and its impact on the equatorial stratosphere. J. Geophys. Res. Atmos. 2013, 118, 8897–8909. [Google Scholar] [CrossRef]
  39. Bushell, A.C.; Butchart, N.; Derbyshire, S.H.; Jackson, D.R.; Shutts, G.J.; Vosper, S.B.; Webster, S. Parameterized gravity wave momentum fluxes from sources related to convection and large-scale precipitation processes in a global atmosphere model. J. Atmos. Sci. 2015, 72, 4349–4371. [Google Scholar] [CrossRef]
  40. Serva, F.; Cagnazzo, C.; Riccio, A.; Manzini, E. Impact of a stochastic nonorographic gravity wave parameterization on the stratospheric dynamics of a general circulation model. J. Adv. Model. Earth Syst. 2018, 10, 2147–2162. [Google Scholar] [CrossRef]
  41. De la Cámara, A.; Lott, F.; Abalos, M. Climatology of the middle atmosphere in LMDz: Impact of source-related parameterizations of gravity wave drag. J. Adv. Model. Earth Syst. 2016, 8, 1507–1525. [Google Scholar] [CrossRef]
  42. Skamarock, W.C.; Klemp, J.B.; Dudhia, J.; Gill, D.O.; Barker, D.M.; Wang, W.; Powers, J.G. A Description of the Advanced Research WRF Version 3. NCAR Tech. Note NCAR/TN-4751STR. 2008, p. 13. Available online: http://citeseerx.ist.psu.edu/viewdoc/summary?doi=10.1.1.484.3656 (accessed on 16 July 2019).
  43. Morrison, H.; Thompson, G.; Tatarskii, V. Impact of cloud microphysics on the development of trailing stratiform precipitation in a simulated squall line: Comparison of one- and two-moment schemes. Mon. Weather Rev. 2009, 137, 991–1007. [Google Scholar] [CrossRef]
  44. Jordan, C.L. Mean soundings for the West Indies area. J. Meteorol. 1958, 15, 91–97. [Google Scholar] [CrossRef]
  45. Hong, S.-Y.; Noh, Y.; Dudhia, J. A new vertical diffusion package with an explicit treatment of entrainment processes. Mon. Weather Rev. 2006, 134, 2318–2341. [Google Scholar] [CrossRef]
  46. Jimy Dudhia, N.C.A.R. Prediction of Atlantic tropical cyclones with the Advanced Hurricane WRF (AHW) model. In Proceedings of the 28th Conference on Hurricanes and Tropical Meteorology, Orlando, FL, USA, 28 April–2 May 2008. [Google Scholar]
  47. Hong, S.-Y.; Lim, J.-O.J. The WRF single-moment 6-class microphysics scheme (WSM6). J. Korean Meteorol. Soc. 2006, 42, 129–151. [Google Scholar]
  48. Klemp, J.B.; Dudhia, J.; Hassiotis, A.D. An upper gravity-wave absorbing layer for NWP applications. Mon. Weather Rev. 2008, 136, 3987–4004. [Google Scholar] [CrossRef]
  49. Park, S.-H.; Klemp, J.B.; Skamarock, W.C. A comparison of mesh refinement in the global MPAS-A and WRF models using an idealized normal-mode baroclinic wave simulation. Mon. Weather Rev. 2014, 142, 3614–3634. [Google Scholar] [CrossRef]
  50. Bu, Y.; Fovell, R.; Corbosiero, K.L. Influence of cloud–radiative forcing on tropical cyclone structure. J. Atmos. Sci. 2014, 71, 1644–1662. [Google Scholar] [CrossRef]
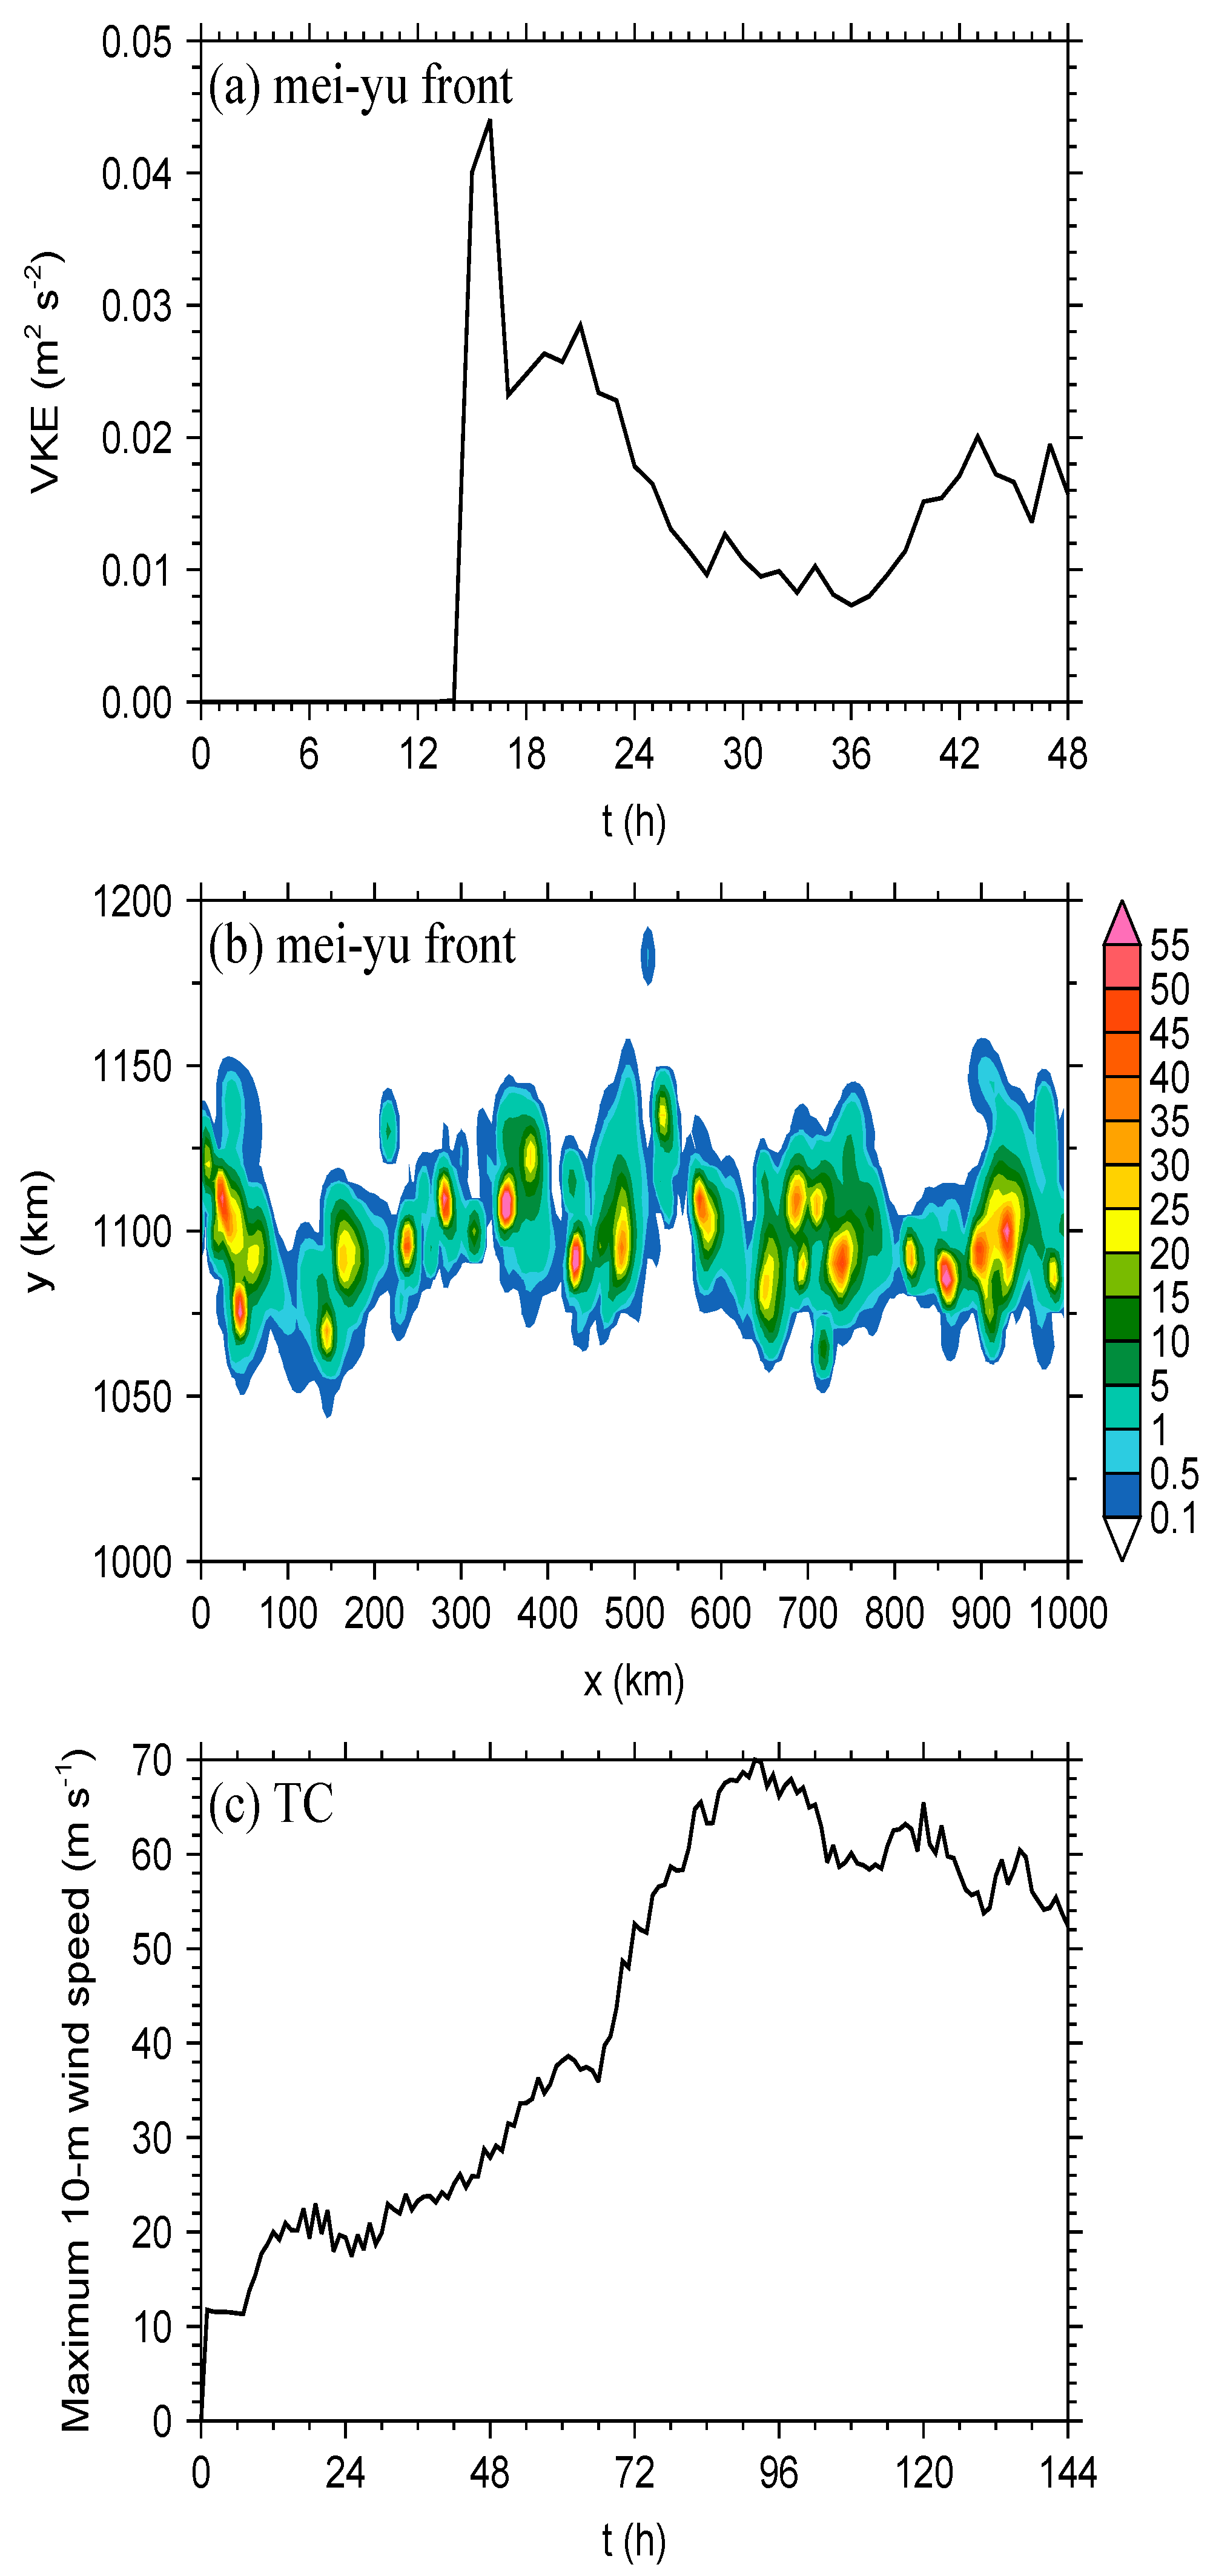
Figure 1. Simulated (a) times series of mass-weighted average vertical kinetic energy and (b) 1-h accumulated precipitation at t = 26 h (shaded; mm) for the mei-yu front. (c) Simulated time series of maximum 10-m wind speed for the tropical cyclone (TC).
Atmosphere 10 00405 g001
Figure 2. Simulated (a,b) horizontal cross sections of vertical velocity (shaded; m s−1) at z = 17 km, (c,d) vertical cross sections of vertical velocity (shaded; m s−1) and potential temperature (contours every 20 K) along (c) x = 500 km and (d) x = 1000 km. The left panels are for the mei-yu front at t = 26 h and the right panels are for the TC at t = 104 h. Boxes in the top panels indicate the wave analysis domains.
Atmosphere 10 00405 g002
Figure 3. Base-10 logarithm of PSDs of w GW (shaded; m2 s–2) as a function of (a,b) zonal wavenumber and y direction, and (c,d) meridional wavenumber and x direction at z = 17 km, for (a,c) the mei-yu front and (b,d) the TC.
Atmosphere 10 00405 g003
Figure 4. Base-10 logarithm of PSDs of w GW (shaded; m2 s–2) as a function of (a,b) zonal and meridional wavenumber, and (c,d) meridional wavenumber and frequency at z = 17 km, for (a,c) the mei-yu front and (b,d) the TC.
Atmosphere 10 00405 g004
Figure 5. Base-10 logarithm of PSDs of w GW (shaded; m2 s–2) as a function of (a,b) x direction and meridional phase speed, and (c,d) zonal and meridional component of horizontal phase speed at z = 17 km for (a,c) the mei-yu front and (b,d) the TC. The black rings in the bottom panels show the magnitude of horizontal phase speed at each 10 m s−1.
Atmosphere 10 00405 g005