Abstract
The linkage between atmospheric blocking (blocking frequency, BF) and total monthly July precipitation in the Selenga River Basin, the main tributary of Lake Baikal, for the period 1979–2016 was investigated. Based on empirical orthogonal functions (EOF) analysis, two dominant modes of precipitation over the Selenga River Basin were extracted. The first EOF mode (EOF 1) is related to precipitation fluctuations mainly in the Mongolian part of Selenga; the second EOF mode (EOF 2)—in the Russian part of Selenga. Based on two different modes obtained, the total amount of precipitation individually for the Russian and Mongolian part of Selenga was calculated. Correlation analysis has demonstrated that precipitation over the Mongolian part of the Selenga Basin is positively correlated to blocking over Eastern Siberia/Mongolia (80–120° E, ESM-BF). Precipitation over the Russian part of the Selenga Basin is positively correlated to blocking over the Urals-Western Siberia (50–80° E, UWS-BF) and European blocking (0–50° E, E-BF). However, the linkage is not stable, and after the mid-1990s, the obtained positive correlation became insignificant. The analysis has shown that the dominance of E or ESM-blocking in July was the primary driver of the existence of two precipitation modes over the Selenga River Basin. During 1996–2016, the negative trend of time coefficients of EOF 1 and 2 for precipitation in Selenga had been observed, which was characterized by displacement of positive precipitation anomalies outside the basin. At the same time, there was a weakening of the linkage between precipitation in the Selenga Basin and blocking frequency. We have revealed two wave-like modes over Northern Eurasia and the subtropical part of Eurasia corresponding to E, ESM-blocks in 1979–1995 and 1996–2016. The change of the Northern and subtropical wave modes is one of the causes for the weakening of the linkage between atmospheric blocking and precipitation in the Selenga Basin and as a consequence decreased precipitation in the Russian and Mongolian part of Selenga during 1979–2016.
1. Introduction
Lake Baikal is a unique natural object on the UNESCO World Heritage list. The lake is the basis of hydropower engineering in Eastern Siberia [1,2]. Since 1996, a low-water period has been observed in the basin [1,3,4,5]. It is the longest one throughout the history of instrumental records. In recent years the low-water has aggravated [1]. The long-term low-water period has already generated environmental and water-resource management problems [1,5] within the lake basin. For example, these problems include coastline destruction, difficulties controlling water discharge at hydro-electric power plants, and the need of reconsidering the existing regulation rules for the Angara reservoir cascade in Russia, which has been monitoring the water outflow from Lake Baikal since 1963. Searching for the causes of this low-water period and analysis of scenarios for further variations in the inflow is essential.
The decreased inflow into Lake Baikal is mainly related to the reduced discharge in the Selenga River (Figure 1) observed since 1996 [3,4,5,6,7,8]. The Selenga River is the lake’s most important tributary. The Selenga Basin is located in Mongolia and Russia, and it comprises 83.4% of Lake Baikal’s catchment area [9].
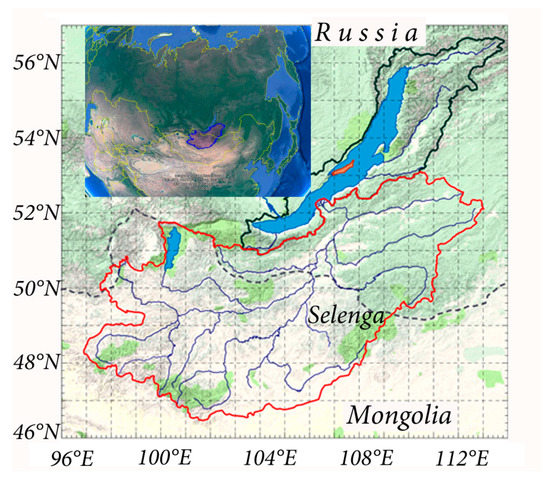
Figure 1.
Lake Baikal Basin (solid red and solid black lines). Selenga River Basin (solid red line). State boundary between Russia and Mongolia (dashed gray line).
The Selenga River contributes about 50% of the influx into Lake Baikal [4]. Atmospheric precipitation is the primary source of the river supply [4,8]. Most of the annual precipitation in the Selenga River Basin (of about 450 mm per year) falls as rain [8] from June–August (about 70% of the annual). Precipitation in each of these three months can be up to 90–100 mm [10]. The main discharge is also formed from June through August [4]. It features both dangerous floods and low-water periods [1,2]. The causes of the decrease in Selenga discharge should be searched for in the variability of summer atmospheric precipitation.
Primary drivers of precipitation fluctuations in the Selenga Basin are still not clear [4]. The uncertainty is caused by the location of the river basin at the border of mid-latitudes and subtropics. It was shown that the cyclones of mid-latitudes [10], East Asian monsoon front [4], and also stationary Rossby waves [11,12] significantly affect the formation of precipitations over the southern part of Eastern Siberia and Mongolia in summertime. Thus, precipitation fluctuations over the basin are, first of all, driven by the atmospheric circulation dynamics, and the role of thermodynamic factors (local convective precipitation) is around 10–12% [13].
Based on the empirical orthogonal function analysis, it was shown that atmospheric blocking (blocks) is the most significant phenomenon of circulation in mid- and subtropical latitudes in summertime over Eurasia [14]. A definition of blocking was formulated in 1950 [15]. One of the main conditions of blocking, according to Rex, 1950 [15], is the splitting of the westerly flow into two branches enveloping the blocked region. Currently, the presence of an equivalent-barotropic anticyclone is considered to be an essential condition of blocking [16]. Blocks explain long-term, large-scale anomalies in meteorological parameters at mid- and subtropical latitudes [17,18,19]. Climatological distribution of blocking frequency over Eurasia was demonstrated in [14,15,16,20,21,22]. The links between atmospheric blocking and precipitation are described in several works [23,24,25,26,27,28]. The results of numerous papers have revealed the blocks to be the cause of both low and high precipitation. Atmospheric blocking over different parts of Eurasia during summertime in 1979–2015 was accompanied by precipitation in the adjacent parts of the arid belt, including Kazakhstan, Mongolia, Northern China, and Transbaikalia [28]. Since the studied area includes the Selenga Basin, blocks can affect the precipitation in the Selenga Basin. However, the links between precipitation in the Selenga Basin and the blocks were not evaluated in detail.
A number of studies have shown that propagation of Rossby waves and their breaking contribute to the formation and maintenance of blocking [29,30]. Shubert et al. 2014, Li and Ruan 2019 [31,32] showed the change of the Rossby wave train over Eurasia, which was characterized by a sharp shift around 1995. Changes of the Rossby waves over Eurasia can cause changes in blocking properties and as a consequence, alter the linkage of blocking and precipitation. However, it was emphasized that the relationship between Rossby waves and the development of blocking events is still unclear [31]. Despite the complexity of this issue, the change in properties of the Rossby wave propagation over Eurasia is a good reason to pay attention to the difference of the linkage between blocking and precipitation for any region before and after the mid-90s.
The goal of our work is to study the linkage of atmospheric blocking and precipitation over the Selenga Basin for two periods: 1979–1995 and 1996–2016. We identified these two periods based on the changes in the Rossby wave train over Eurasia [31,32]. Additionally, we studied the relationship between blocks, geopotential height, and meridional wind (V) at 850 hPa and 250 hPa during these periods over Eurasia. We described the differences and discussed the role of large-scale circulation in precipitation formation over the Selenga Basin over the last several decades. We studied features of the linkage between blocks and precipitation for July.
Investigation of these links and their changes for July is driven by two basic reasons. First of all, although the decreased precipitation and air humidity, increased temperature and changes in other significant indicators occurred in all summer months, the changes within the Selenga River Basin were most pronounced and dramatic in July [4,10]. Secondly, in July, the frequencies of the atmospheric blocking in Siberia and the quasi-stationary waves over Mongolia are the highest [11,33]. We should also emphasize that the changes in the wave characteristics of the mid-latitude troposphere are more pronounced in the central months of the seasons [34].
2. Data, Method and Description of the Selenga River Basin
2.1. Blocking Index Algorithm
There are several ways to define blocking [21]. We used the blocking index algorithm as in Barriopedro et al. 2006 [21]:
where Z is the 500 hPa geopotential height, φn = 80° N ± ∆, φ0 = 60° N ± ∆, φs = 40° N ± ∆, ∆ = −5°, −2.5°, 0°, 2.5°, or 5°.
The 500 hPa geopotential height gradients (GHG) north and south (GHGN and GHGS, respectively) were calculated. This algorithm is based on the GHGS criterion proposed Lejenäs and Økland, 1983 [35]. The criterion was supplemented by Tibaldi and Molteni, 1990, Barriopedro et al., 2006 [21,22]. Tibaldi and Molteni suggested the GHGN criterion to eliminate cutoff lows from the “blocking catalog,” whereas the Barriopedro et al. used the five values of Δ as given above. The situation when GHGS > 0, GHGN < 10 m/deg lat. is referred to as a blocking. A longitude is considered blocked when both GHGN and GHGS satisfy these conditions for at least one of the five ∆ values.
The blocking frequency (BF) was calculated as follows. Eurasia was divided into four longitudinal intervals, the same way as in Park and Ahn 2014, Antokhina et al. 2016 [14,28]: (0°–50° E (Europe, E), 50°–80° E (the Urals-Western Siberia, UWS), 80°–120° E (Eastern Siberia-Mongolia, ESM), 120°–160° E (Russian Far East-Okhotsk Sea, RFEOS). According to Park and Ahn, in the 80°–120° E area, there is the climatic minimum of blocking frequency in summertime [14]. We calculated blocking frequency in this longitudinal interval, too, and included it in our study, since the Selenga Basin is located here. Accordingly, despite its low frequency, ESM-blocking may play an important role in forming precipitation and discharge in the river basin. Then, for each of four intervals at each longitude within it, we calculated the GHGS and GHGN indices (Equations (1) and (2)) and checked whether the blocking conditions were met for each day in each July from 1979–2016. Finally, in each longitudinal interval, we summed up the number of points (longitude × time), where the blocking conditions were fulfilled, and obtained blocking frequency for each July of each year. We denoted the obtained BFs for each region as follows: E-BF, UWS-BF, ESM-BF, and RFEOS-BF.
2.2. Data
We used total monthly July precipitation for 1979–2016. The data were obtained from the Global Precipitation Climatology Centre (Deutscher Wetterdienst) (GPCC), Version 2018 with 0.25° spatial resolution [36,37]. The monthly GPCC data Version 2018 is land-surface precipitation from rain-gauges built on GTS-based and Historical Data. Atmospheric data for geopotential height at 500 hPa (Z500) and meridional wind at 850, 250 hPa (V850, V250) for July were obtained from the ECMWF ERA-Interim reanalysis [38]. We used the four times daily (0000, 0600, 1200, and 1800 UTC) data with 1.5° spatial resolution for 1979–2016. Daily and monthly averages were calculated based on the four times daily data.
2.3. Method
Empirical orthogonal functions (EOF) and the Pearson correlation analysis (PCC) were used for data interpretation. The EOF is a statistical method that can extract dominant modes of change from a time-dependent two-dimensional dataset [39]. EOF analysis is often used to study possible spatial patterns of climate variability and how they change with time. The EOF spatial patterns are eigenvectors, which are orthogonal so that the leading EOF describe the spatially coherent pattern that maximizes its variance. The total July precipitation over the Selenga Basin (96–114° Е, 46–53° N) for N = 38 years (1979–2016) was analyzed in terms of empirical orthogonal functions (EOF) and their variances.
The PCC was used to measure the degree of a linear relationship between two variables. The correlation was noted when statistical significance is equal to or exceeded the 90, 95% confidence levels (t-test). The PCC was used in [14,24] for analysis of the linkage between blocks and summer precipitation. First of all, we analyzed the correlation between E-BF, UWS-BF, ESM-BF, RFEOS-BF, and total precipitation in the Selenga Basin (95% confidence level was used). Secondly, we studied the correlation maps of blocking frequency for four regions and Z500, V850, V250 (90% confidence level was used). The analysis was performed under the assumption that the obtained correlation maps characterize the climatological structure for atmospheric blocking, and location of the large-scale troughs/cyclonic area (negative correlations of BF and Z500) and anticyclones/ridges (positive correlations of BF and Z500) over Eurasia correspond for different types of blocks. For V250, 850 the positive correlations with BF show strengthening of the southern component of meridional wind, i.e., the enhancement of advection from the south. Negative correlations show strengthening of the northern component of meridional wind, i.e., the enhancement of advection from the north. Furthermore, deviations from the zonal flow are often diagnosed using the meridional wind. This variable is particularly well suited for identification of Rossby waves, because at the spatial scales of interest, its zonal Fourier spectrum has a strong contribution [40]. We investigated the correlation for two periods 1979–1995 (17 points) and 1996–2016 (21 points).
2.4. The Selenga Basin Description
Figure 1 shows the Selenga River Basin. The boundary between Russia and Mongolia divides the basin into two parts. The Mongolian part is 66% of the river basin total area, and 40% of total Selenga Basin precipitation falls over the smaller Russian part. Nevertheless, the discharge formed in the Russian part is three-fold as large as the discharge measured in the Mongolian part [41]. A detailed description of the Selenga Basin can be found in [8].
3. Result
3.1. The Linkage between Blocking and Precipitation
Application of EOF analysis allowed us to extract two dominant modes (EOF 1, 2) of precipitation over the Selenga Basin. The EOF 1 and EOF 2 explain respectively 28% and 18% of the total interannual variance (EOF 1, 2–45%) and differ markedly from the third EOF (7%). Spatial patterns associated with two precipitation modes over the Selenga Basin are shown in Figure 2 as a correlation map of time coefficients of the EOF 1, 2 and precipitation over Mongolia and Eastern Siberia. EOF 1, 2 exhibit meridional oriented dipole patterns extending over Mongolia and Eastern Siberia.
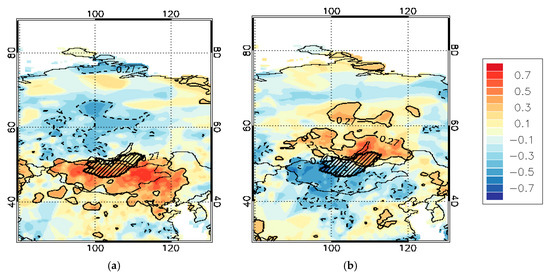
Figure 2.
Correlation coefficients between time coefficients of the EOF 1 (a), 2 (b) of precipitation over the Selenga Basin and normalized precipitation over Eastern Siberia and Mongolia for 1979–2016. The solid black line and dashed line areas indicate the 90% confidence level the positive and negative coefficients of correlation, respectively. The hatched area shows the Selenga Basin.
Horizontal pattern of the first EOF indicates that July precipitation in the Selenga Basin (especially in the Mongolian part) fluctuates in opposite direction to the precipitation in Eastern Siberia (with the center located around 100° E). Horizontal pattern of the second EOF indicates that July precipitation in the Russian part of the Selenga Basin fluctuates in opposite direction to precipitation in Western Mongolia (with the center located outside of Selenga Basin). Based on two different modes obtained, we calculated the total precipitation individually for the Russian part (TRPS), and Mongolian part (TMPS). It was revealed that TMPS is 60% of total precipitation for 1979–2016, and TRPS −40%, this result is in good agreement with the one obtained for annual precipitation in the Selenga River Basin [41]. The coefficient of correlation of precipitation in the Russian and Mongolian part is only 0.2.
Figure 3 shows time coefficients of the EOF 1, 2 (PC 1, 2) and the TRPS and TMPS. The coefficients of correlation for both pairs of variables are 0.8. The PC1 and TMPS exhibit a significant negative trend during 1982–2016. PC 2 and TRPS exhibit a significant trend during 1979–2016. The most dramatic change was observed after 1999 for PC 1 (precipitation in the Mongolian part of the Selenga Basin) and after 2001 for PC 2 (precipitation in the Russian part of the Selenga Basin). It means there was a decrease in precipitation over Eastern Mongolia and Transbaikalia, and they increased over the area between Western and Eastern Siberia (around 100° E). This result is in good agreement with the precipitation difference maps obtained in [4,31] for the periods before the mid-1990s and after.
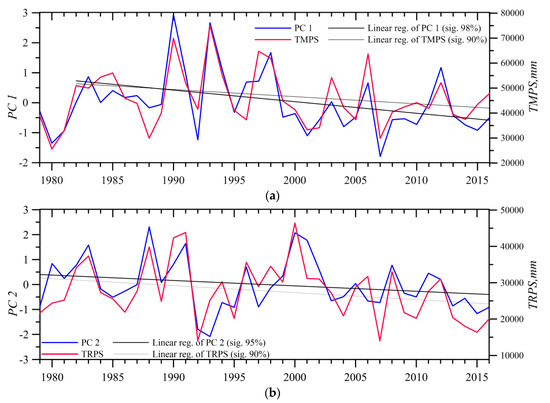
Figure 3.
Time coefficient of the first EOF (PC 1) and total precipitation in the Mongolian part of the Selenga River Basin (TMPS) (a), time coefficient of the second EOF (PC 2) and total precipitation in the Russian part of the Selenga River Basin (TRPS) (b). Thin and thick black lines show the linear trends (sig.: confidence levels at which the linear trend is significant, p-test).
We calculated the coefficient of correlation between blocking frequency for four regions and TMPS, TRPS. For the period 1979–2016, no significant correlation coefficients were found. However, a joint analysis of blocking frequency and precipitation in two parts of the Selenga River Basin allowed getting detailed information on features of the linkage between blocking and precipitation.
The Eastern Siberia/Mongolia blocking frequency and precipitation over the Mongolian part of Selenga (Figure 4) demonstrated the highest similarity of their variations.
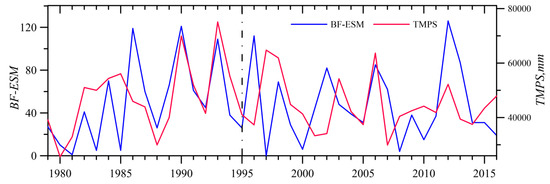
Figure 4.
Interannual changes in the ESM-blocking frequency (ESM-BF) and TMPS.
Increased precipitation is observed in response to the increase in blocking frequency. However, it can be seen that the link between blocking frequency and precipitation (Figure 4) has weakened after 1995. In Figure 5 we demonstrate the scatterplots of the blocking frequency and precipitation before (a) and after (b) 1995. The plot (Figure 5) shows a close relationship between variables for the first period (Figure 5a), and the absence of the linear relationship for the second period (Figure 5b). During 1996–2016, the responses of precipitation to blocking frequency change were observed only in 1998 and 2006.
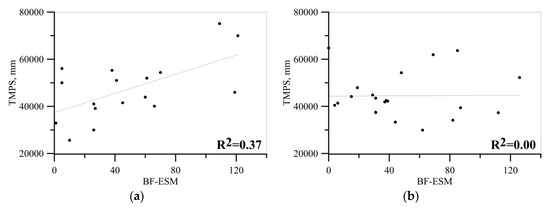
Figure 5.
Scatterplots of the ESM-BF and TMPS for 1979–1995 (a), and 1996–2010 (b). The black line denotes linear regression between the two quantities found by the least-squares fit, and R2 is shown at the bottom right.
European, Urals/Western Siberia blocking frequencies and precipitation in the Russian part (Figure 6) demonstrate similarities of interannual variations for the period before 1996. Increased precipitation is observed in response to the increase in the blocking frequency. However, it can be seen that the link between the blocking frequency and the precipitation in the Russian part (Figure 6) has weakened after 1995 and, in response to the maximum increase in the European blocking frequency, decreased precipitation was observed (2003, 2010, 2011, and 2014) (Figure 6a). Figure 7a–d demonstrate scatterplots of E-, UWS-blocking frequencies and the Russian precipitation part before (a) and after (b) 1995. We can see a close linear relationship among variables for the first period (Figure 7a,c), and the absence of such a linear relationship for the second period (Figure 7b,d).
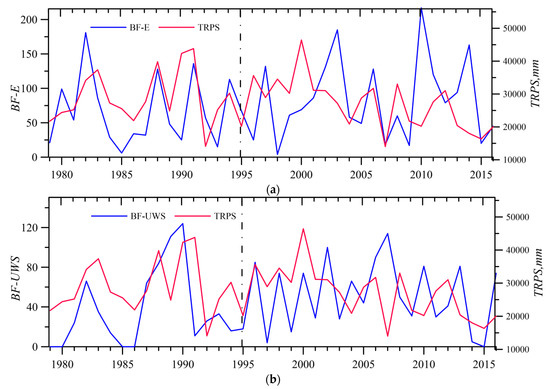
Figure 6.
Interannual changes in E-blocking frequency (E-BF) and TRPS (a), and UWS-blocking frequency (UWS-BF) and TRPS (b).
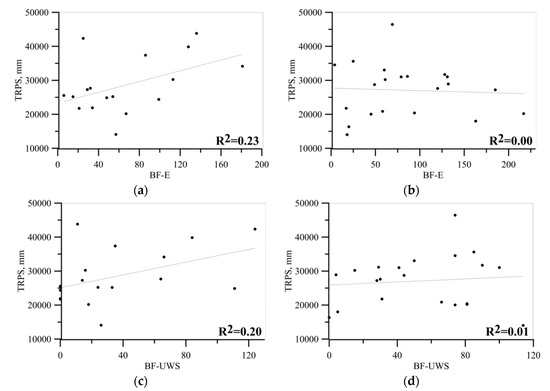
Figure 7.
Scatterplots of the E-, UWS -BF, and TRPS for 1979–1995 (a,c), 1996–2016 (b,d). The solid line denotes the linear regression between two quantities found by the least-squares fit, and R2 is shown at the bottom right.
Table 1 demonstrates the coefficients of correlation of blocking frequency and precipitation in the Selenga Basin for the period 1979–1995.

Table 1.
The coefficients of correlation of blocking frequency and precipitation in the Selenga Basin for the period 1979–1995; bold font indicates the significant coefficient at 95% confidence level.
We have demonstrated that precipitation in the Selenga Basin is linked to ESM-blocking (precipitation over the Mongolian part of the Selenga Basin), UWS-blocking, and E-blocking (precipitation over the Russian part of the Selenga Basin). The most significant correlation coefficients refer to precipitation and the European and Eastern Siberia/Mongolia blocks. However, the linkage is not stable, and after the mid-1990s, the obtained positive correlation became insignificant.
To demonstrate what did the spatial patterns of precipitation corresponding to E-, UWS-, and ESM-BF look like for two periods 1979–1995 and 1996–2016, we showed the distribution of the coefficient of correlations between E-, UWS-, ESM-BF, and precipitation over Eurasia (Figure 8 and Figure 9). We show a large area to reveal what were the large-scale changes in relationships between the blocks and precipitation, and how this can be related to the precipitation in two areas of the Selenga Basin.
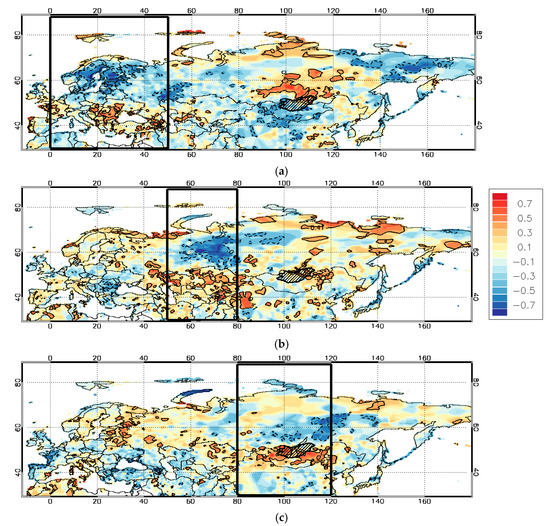
Figure 8.
Correlation coefficients of E (a), UWS (b), ESM-BF (c) and normalized precipitation for 1979–1995. The solid black line and dashed line areas indicate the 90% confidence level the positive and negative coefficients of correlation, respectively. The hatched area shows the Selenga Basin.
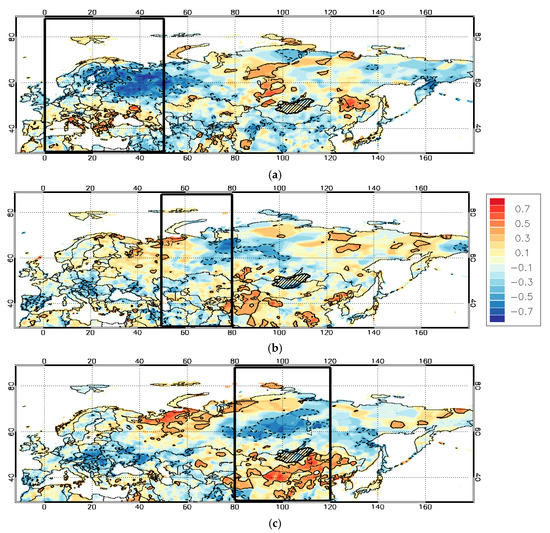
Figure 9.
Correlation coefficients of E (a), UWS (b), ESM-BF (c) and normalized precipitation for 1996–2016. The description is the same as Figure 8.
Figure 8 and Figure 9a,c show two opposite large-scale quadrupole structures over Eurasia. The quadrupole is located over Europe–Eastern Siberia/Mongolia. The quadrupole pattern can be explained by the position of the large-scale low and high-pressure areas that corresponding blocks over Europe and Eastern Siberia. A comparison of the quadrupoles for the first and second periods has revealed the change in amplitudes and areas of correlation structures located over the blocked regions (Figure 8 and Figure 9a—for Europe, Figure 8c and Figure 9c—for Eastern Siberia). Amplitudes and areas of the European part of the quadrupole (Figure 8a and Figure 9a) and East Siberian part (Figure 8 and Figure 9c) are higher in the second period that in the first one. Figure 8b and Figure 9b show a large-scale dipole structure over UWS and, on the contrary, the amplitudes and areas of correlation structures over Western Siberia are lower in the second period than in the first one. Analysis of the correlations between blocking frequency and precipitation over the Selenga Basin showed that, in the first period (1979–1995), areas of significant positive correlations were located over the Russian part of the basin during blocks over Europe and the Urals—Western Siberia (Figure 8a,b) and over the Mongolian part—during blocks over Eastern Siberia—Mongolia (Figure 8c). For the second period, there was no significant correlation over the river basin. The absence of positive correlations between precipitation and blocking for the 1996–2016 period can be an important point to explain the observed low-water period in the Selenga River Basin.
Resulting from the analysis, we have concluded that before the mid-1990s alternation of the months with the dominance of E- and ESM-blocking contributes to the positive anomaly of precipitation over the Mongolian and Russian parts of the Selenga River Basin. Figure 10 shows fluctuations of E, ESM-BF. Before 1999, a significant negative correlation between E and ESM-BF was observed (0.6). After the mid-1990s, a negative trend of PC 1 and 2 of precipitation in the Selenga Basin was observed, which is characterized by displacement of positive precipitation anomalies outside the basin. At the same time, the linkage between the precipitation in the Selenga Basin and the blocking frequency weakened. Moreover, there was observed a change in the Eurasian precipitation patterns that accompanied E and ESM blocks and a change in the linkage between E and ESM-blocks.
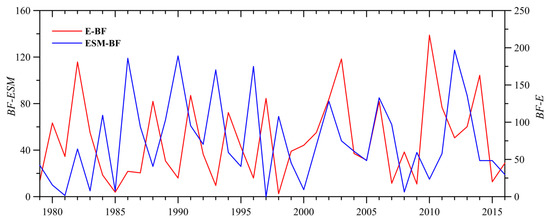
Figure 10.
Interannual changes in E-BF and ESM-BF.
To detect differences in atmospheric circulation during blocks for the two periods, we investigated the July’s maps of geopotential height and meridional wind corresponding to E, ESM-blocks, and precipitation in the Russian and Mongolian part of Selenga.
3.2. The Linkage between Blocking, Precipitation, and Atmospheric Circulation over Eurasia
3.2.1. The Change of European Blocking and Precipitation in the Russian Part of the Selenga River Basin
Figure 11 demonstrates the coefficients of correlation of precipitation in the Russian part of Selenga (TRPS) and Z500, Figure 12 shows the coefficients of correlation of the European blocking frequency and Z500 for two periods. Figure 11a and Figure 12a are similar to each other, unlike Figure 11b and Figure 12b. For the first period, the geopotential height at 500 hPa accompanying low and high E-blocking frequency and TRPS are similar. In the first period, during blocking over Europe the following are observed over the Selenga Basin: air advection from the north (Figure 12b), a trough (Figure 11a and Figure 12a), and precipitation within the trough area (Figure 8a). In the second period, E- blocking is accompanied by air advection from the south over the Selenga Basin (Figure 12d), and the trough is west of the basin for E-blocking (Figure 12c). A comparison of Figure 12, Figure 8, and Figure 9 shows that precipitation (positive correlation structures) is in the regions over which the trough frontal parts are mostly located.
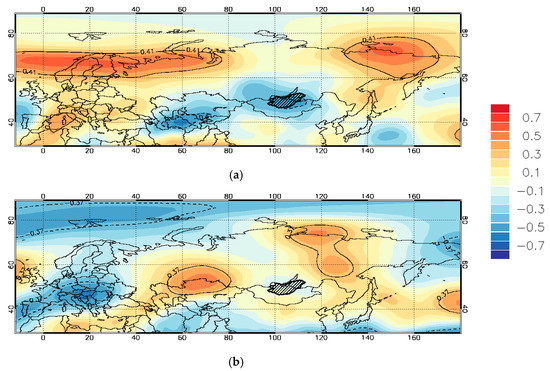
Figure 11.
Correlation coefficients between TRPS and geopotential height at 500 hPa (Z500) for 1979–1995 (a) and 1996–2016 (b). The description is the same as in Figure 8.
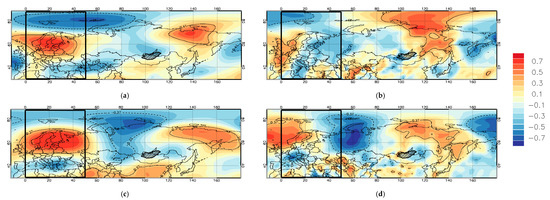
Figure 12.
Correlation coefficients of E -BF, and Z500 (a,c) and E -BF, and v-component of wind at 850 hPa (V850) (b,d) for 1979–1995 (a,b) and 1996–2016 (c,d). The description is the same as in Figure 8.
Shubert et al. 2014 [31] presented correlation maps for meridional wind at 250 hPa with the first and second rotational principal components (RPCs) of combined 2-m temperature and precipitation in the summertime. The authors interpreted the obtained correlation distributions as the stationary Rossby wave structures over Northern Eurasia. The correlation structure for meridional wind and RPC 1 obtained by Shubert et al. is highly similar to our correlation pattern for meridional wind and European blocks in 1996–2016 (Figure 12d). We suppose that blocking over Europe can be associated with the large-scale Rossby wave structures predominating over Northern Eurasia. According to results by Shubert et al., the RPC1 increased after 1995, and in the authors’ view, this increase is responsible for heat waves and, hence, droughts over Eurasia, including Mongolia.
In Figure 13, we show correlations between V250 with E-BF for two periods. For both periods, E-blocks were accompanied by a wave-like mode over Northern Eurasia, but for the second period (Figure 13b) the wave structure is more pronounced, especially it is true for the part of negative correlation (cold advection, the trough adjacent to E-blocks). Amplification of the trough adjacent to E-blocks led to the strengthening of warm air mass advection in the area located west of Lake Baikal and the change of the track of cyclones. In our opinion, the changes of the wave-like pattern that accompanied the E-blocks is responsible for the changes in the linkage between blocking and precipitation that can fall in the E-blocking downstream. The answer to this question is closely related to the issue of Rossby wave amplification and changes of the atmospheric blocking downstream. Even though the issue requires additional investigation (how have the amplitude and phase speed of Rossby waves changed) based on our results and those previously obtained in [31] we can conclude that European blocks accompanied by the wave-like structure over Northern Eurasia in 1996–2016 (Figure 13b) contributed to decreased precipitation over the Selenga Basin.
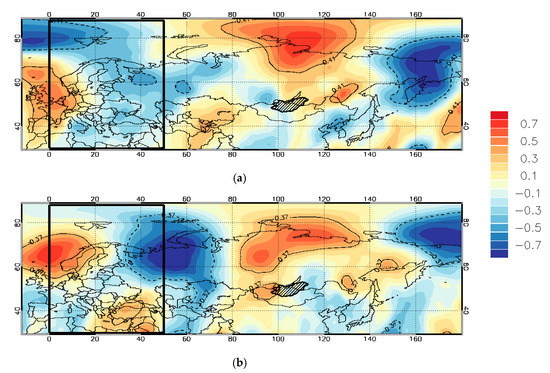
Figure 13.
Correlation coefficients of E-BF and v-component of wind at 250 hPa (V250) for 1979–1995 (a) and 1996–2016 (b). The description is the same as in Figure 8.
3.2.2. The Change of Eastern Siberia/Mongolia Blocking and TMPS
Figure 14 shows the coefficients of correlation of Eastern Siberia/Mongolia blocking frequency and Z500 for two periods. In both periods, typical structures of dipole blocking over Eastern Siberia and Mongolia correspond to ESM-blocks. Analysis of some ESM blocking events has shown that the cyclonic parts of ESM- blocks are characterized by advection of air masses from the East Asian monsoon region (EASM) [42]. Analysis that has been provided by Chen et al. 2017 [43] indicated that there is a close relationship between the midlatitude summer cyclone activity over East Asia and the decadal variation of EASM; when the midlatitude summer cyclone activity over East Asia is strong (weak), EASM tends to be intensified (weakened). So the ESM-blocks with pronounced cyclonic part may be the EASM driver.
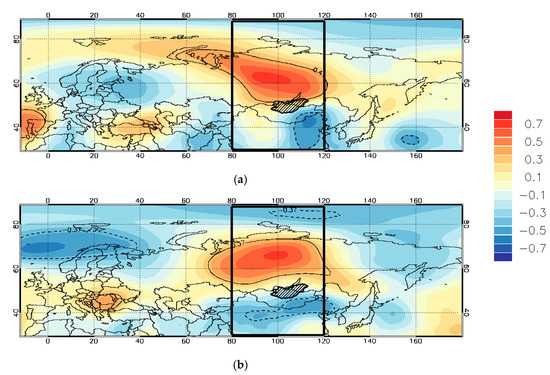
Figure 14.
Correlation coefficients of ESM-BF and Z500 for 1979–1995 (a) and 1995–1996 (b). The description is the same as in Figure 8.
Figure 15 demonstrates the coefficients of correlation between precipitation in the Mongolian part of Selenga and geopotential height at 500 hPa (Z500). Correlations of precipitation, ESM-BF, and Z500 for the first period (Figure 14a and Figure 15a) are similar, unlike Figure 14b and Figure 15b. Despite the dipole blocking structure is evident in correlation ESM-BF and Z500 maps for both periods; the precipitation is linked to the dipole blocking structure only for the first period (1979–1995). For the second period (1996–2016) precipitation is linked to the wave-like structure over the subtropical area over Eurasia. It can be seen that there were northward shift in the location of the negative correlation for precipitation (Figure 8 and Figure 9c) and positive correlation for Z500 (Figure 14a,b) over Eurasia.
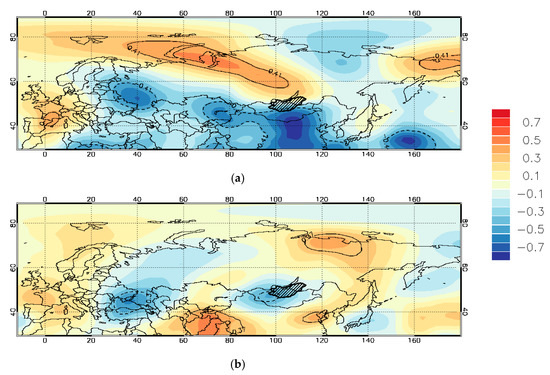
Figure 15.
Correlation coefficients of TMPS and Z500 for 1979–1995 (a) and 1996–2016 (b). The description is the same as in Figure 8.
In contrast to Z500 maps for European blocks for two periods (Figure 11) where significant differences of Z500 in the Selenga Basin were revealed for the Z500 maps for ESM-BF (Figure 14), we have not found evident changes of the blocking structure (especially in the cyclone part) for the Selenga Basin. The less pronounced cyclonic part of ESM-blocking is observed in the second period in contrast to the first one.
Nevertheless, the analysis of the differences of the low-level advection accompanied Eastern Siberia/Mongolia blocks, which can be associated in part with East Asia monsoon (correlation with V850 hPa) has not shed light on the reason why the linkage between ESM-BF and precipitation has weakened (Figure S1 is shown in supplementary materials). The most important outcome was obtained due to analysis of the differences between V250 for two periods. Figure 16 shows correlation maps for ESM-BF and V250. For the first period, the correlation maps of the ESM-blocking frequency and V250 demonstrate a wave-like pattern over the subtropical region of Eurasia (SE). The obtained wave pattern over SE is similar to the Rossby wave along subtropical jet stream revealed Iwasaki and Nii, 2006, Sato and Takahashi, 2006, [11,44]. We suppose that during 1979–1995, the wave pattern over SE with cyclonic part over Mongolia contributes to formation and amplification of Eastern Siberia/Mongolia blocks. For the second period, the correlation map demonstrates no linkage of ESM-blocks and wave-like pattern. The change of correlation of V250 and ESM-blocks may be due to the weakening of the SE wave contribution to ESM-blocking formation. The change in the formation of ESM-blocks has led to the change in the linkage between ESM-blocks and precipitation in the Mongolian part. Changes in the SE wave mode, as well as its relationship with the change of Northern Eurasia wave mode, require further research.
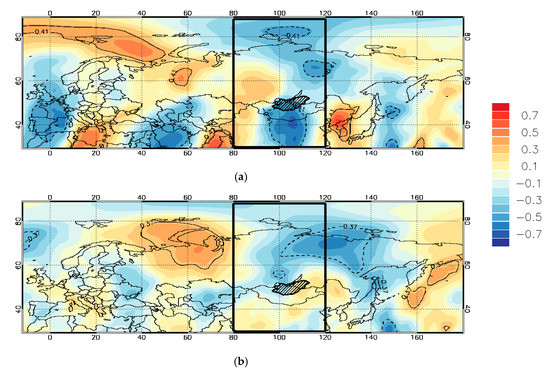
Figure 16.
Correlation coefficients of ESM-blocks and V250 for 1979–1995 (a) and 1996–2016 (b). The description is the same as in Figure 8.
4. Summary
The long-term low-water has been observed since 1996 in basins of Lake Baikal and Selenga River, the main tributary of the lake, mainly fed by summer atmospheric precipitation. We are searching for the causes of decreasing precipitation over the river basin in changing features of the large-scale atmospheric circulation over Eurasia in mid-summer. We have studied the linkage of atmospheric blocking and precipitation over the Selenga Basin in July for two periods: 1979–1995 and 1996–2016. Additionally, we have analyzed relationships between blocks, geopotential height at 500 hPa (Z500), and meridional wind at 850 hPa and 250 hPa (V850, V250) over Eurasia during these periods.
We used the Global Precipitation Climatology Centre (GPCC), Version 2018 [36,37] with 0.25° spatial resolution. Atmospheric data for geopotential height (Z500) and meridional wind at 850 and 250 hPa for July were obtained from the ECMWF ERA-Interim reanalysis [38]. We applied the blocking index algorithm based on the geopotential south, and north gradient as in [21]. The blocking frequency (BF) was calculated as follows: Eurasia was divided into four longitudinal intervals, in the same way as in [14,28] (0°–50° E (Europe, E), 50°–80° E (the Urals—Western Siberia, UWS), 80°–120° E (Eastern Siberia—Mongolia, ESM), 120°–160° E (Russian Far East—Okhotsk Sea, RFEOS). In each longitudinal interval, we summed up the number of points (longitude × time), where the blocking conditions were fulfilled, and obtained blocking frequency for each July of each year. All the obtained BFs we denoted the obtained as E-BF, UWS-BF, ESM-BF, and RFEOS-BF. Empirical orthogonal functions (EOF) and the Pearson correlation analysis (PCC) were used for data interpretation.
The EOF analysis allowed us to extract two dominant modes of precipitation over the Selenga Basin. The EOF 1 and EOF 2 patterns explain, respectively, 28% and 18% of the total interannual variance. EOF 1 is associated with fluctuations of precipitation mainly in the Mongolian part of Selenga; EOF 2—in the Russian part of Selenga. Thus, we calculated the total precipitation individually for the Russian part (TRPS) and Mongolian part (TMPS). It was revealed that TMPS is 60% of total Selenga’s precipitation for 1979–2016 and TRPS −40%. In term of Selenga discharge formation, both of obtained modes are important. Coefficients of correlation of PC 1, 2 associated with two precipitation modes and TMPS, TRPS are 0.8 for both pairs of variables (PC 1—TMPS, PC 2—TRPS). We revealed that there was a decrease in precipitation over Eastern Mongolia and Transbaikalia and an increase over the area between Western and Eastern Siberia (around 100° E).
Correlation analysis has demonstrated that precipitation in the Selenga Basin is positively correlated with the ESM-blocking frequency (precipitation over the Mongolian part of the Selenga Basin), UWS-, and E-blocking frequency (precipitation over the Russian part of the Selenga Basin). However, the linkage is not stable, and after the mid-1990s, the obtained positive correlation became insignificant. We compared of the Eurasia precipitation spatial patterns correspond to E-, UWS-, ESM-BF, and PC 1, 2 for two periods, 1979–1995 and 1996–2016. As a result of the analysis, we have concluded that alternation of the months with the dominance of E or ESM-blocking contributes to two both leading precipitation modes over the Selenga River Basin. In 1996–2016, a trend of change of time coefficients of the EOF 1, 2 for precipitation in Selenga was observed, which is characterized by displacement of positive precipitation anomalies outside the basin. At the same time, there was a weakening of the linkage between precipitation in the Selenga Basin and blocking frequency.
To detect features of circulation during blocking formation for two periods, we investigated Z500, V850, and V250 corresponding to E, ESM-blocks, and precipitation in the different parts of the Selenga River Basin in two periods. It turned out that the patterns of Z500 for European blocks and TRPS (Eastern Siberia/Mongolia blocks and TMPS) are similar for the first period in contrast to the second period. We have revealed that two wave-like modes over Northern Eurasia and subtropical part of Eurasia (SE) correspond to E, ESM-blocks, and precipitation in the Selenga River Basin.
The Northern Eurasia wave mode corresponds to E-blocks for both periods. For the first period, the Northern Eurasia mode promoted to the precipitation in the Russian part of the Selenga Basin formation. For the second period, the Northern Eurasia mode became especially pronounced over Northern Europe (advection from the south) and the Urals (advection from the north). Amplification of the trough adjacent to European blocks has led to changes in the track of cyclones. Thus, after 1996, E-blocks contribute to the precipitation to the west of Lake Baikal. In our opinion, the change of the Northern Eurasia mode corresponding to E-blocks is the reason for the decrease in precipitation in the Russian part of the Selenga River Basin during 1979–2016.
The SE wave mode accompanied ESM-blocks for the first period. For the second period, there was no evident wave-like structure over Eurasia corresponding to Eastern Siberia/Mongolia blocks. We suppose that during 1979–1995, the wave pattern over subtropical part of Eurasia with cyclonic part over Mongolia contributed to the formation and amplification of ESM-blocks. The change of correlation pattern of V250 and ESM-blocks is related to the weakening of the SE wave mode contribution. Conditions of ESM-blocks formation have led to changes in the linkage between Eastern Siberia/Mongolia blocking and precipitation. Changes in the SE wave mode, as well as its relationship with the change in Northern Eurasia wave modes, require further research.
Supplementary Materials
The following are available online at https://www.mdpi.com/2073-4433/10/6/343/s1, Figure S1. Correlation coefficients of ESM-blocks and V850 for 1979–1995 (a) and 1996–2016 (b). Description is the same as in Figure 8.
Author Contributions
O.Y.A. and V.I.M. conceived the formulation of the problem; Y.V.M. performed the software design and development for the processing of experimental spatiotemporal data arrays and visualization of results; O.Y.A. analyzed the data; P.N.A. performed the computer programming for the identification of the blocking; O.Y.A. wrote the paper.
Funding
The study was supported by the Russian Science Foundation Project No. 17-77-10035.
Acknowledgments
We express our gratitude to E. N. Osipchuk (Ph.D., Melentiev Energy Systems Institute, Siberian Branch, Russian Academy of Sciences) who prepared data on catchment areas of Lake Baikal and River Selenga. We are grateful to Alexey V. Eliseev (Ph.D., A. M. Obukhov Institute of Atmospheric Physics Russian Academy of Sciences) for the meaningful discussion of the paper. We thank the Global Precipitation Climatology Centre (Public Datasets: ftp://ftp-anon.dwd.de/), especially Andreas Becker (Head Precipitation Monitoring Unit (KU42) and Global Precipitation Climatology Centre (GPCC)) and European Centre for Medium-Range Weather Forecasts (Public Datasets: https://apps.ecmwf.int/datasets/).
Conflicts of Interest
The authors declare no conflict of interest.
References
- Bychkov, I.V.; Nikitin, V.M. Water-level regulation of Lake Baikal: Problems and possible solutions. Geogr. Nat. Resour. 2015, 36, 215–224. [Google Scholar] [CrossRef]
- Bolgov, M.V.; Buber, A.L.; Korobkina, E.A.; Lyubushin, A.A.; Filippova, I.A. Lake Baikal: Extreme level as a rare hydrological event. Water Resour. 2017, 44, 522–536. [Google Scholar] [CrossRef]
- Ko, S.; Lee, K.W. Risks and Opportunities of the Energy Sector in East Siberia and the Russian Far East: For Better Risk Management and Sustainable Energy Development; LIT: Collegeville, MN, USA, 2012. [Google Scholar]
- Berezhnykh, T.V.; Marchenko, O.Y.; Abasov, N.V.; Mordvinov, V.I. Changes in the summertime atmospheric circulation over East Asia and formation of long-lasting low-water periods within the Selenga river basin. Geogr. Nat. Resour. 2012, 33, 223–229. [Google Scholar] [CrossRef]
- Kasimov, N.; Karthe, D.; Chalov, S. Environmental change in the Selenga River—Lake Baikal Basin. Reg. Environ. Chang. 2017, 17, 1945–1949. [Google Scholar] [CrossRef]
- Chalov, S.R.; Jarsjö, J.; Kasimov, N.S.; Romanchenko, A.O.; Pietroń, J.; Thorslund, J.; Promakhova, E.V. Spatio-temporal variation of sediment transport in the Selenga River Basin, Mongolia, and Russia. Environ. Earth Sci. 2014, 73, 663–680. [Google Scholar] [CrossRef]
- Moreido, V.M.; Kalugin, A.S. Assessing possible changes in Selenga R. water regime in the XXI century based on a runoff formation model. Water Resour. 2017, 44, 390–398. [Google Scholar] [CrossRef]
- Frolova, N.L.; Belyakova, P.A.; Grigoriev, V.Y.; Sazonov, A.A.; Zotov, L.V.; Jarsjö, J. Runoff fluctuations in the Selenga River Basin. Reg. Environ. Chang. 2017, 17, 1965–1976. [Google Scholar] [CrossRef]
- Vaskovskii, M.G. (Ed.) Surface Water Resources of the USSR the Lake Baikal Watershed Basin; Gidrometeoizdat: Leningrad, Russia, 1973. (In Russian) [Google Scholar]
- Marchenko, O.Yu.; Mordvinov, V.I.; Antokhin, P.N. Conditions of formation and long-term variability of summer precipitation in the Selenga Basin. Atmos. Ocean. Opt. 2012, 25, 1084–1090, (In Russia, English abstract). [Google Scholar]
- Iwasaki, H.; Nii, T. The Break in the Mongolian Rainy Season and Its Relation to the Stationary Rossby Wave along the Asian Jet. J. Clim. 2006, 19, 3394–3405. [Google Scholar] [CrossRef]
- Iwao, K.; Takahashi, M. A Precipitation Seesaw Mode between Northeast Asia and Siberia in Summer Caused by Rossby Waves over the Eurasian Continent. J. Clim. 2008, 21, 2401–2419. [Google Scholar] [CrossRef]
- Kornienko, V.I. Features of the hydrological cycle of Transbaikalia and mountainous territories adjacent to the north and north-east. Trudy GGO 1968, 227, 129–142. (In Russian) [Google Scholar]
- Park, Y.-J.; Ahn, J.-B. Characteristics of atmospheric circulation over East Asia associated with summer blocking. J. Geophys. Res. Atmos. 2014, 119, 726–738. [Google Scholar] [CrossRef]
- Rex, D.F. Blocking Action in the Middle Troposphere and its Effect upon Regional Climate. Tellus 1950, 2, 196–211. [Google Scholar]
- Pelly, J.L.; Hoskins, B.J. A New Perspective on Blocking. J. Atmos. Sci. 2003, 60, 743–755. [Google Scholar] [CrossRef]
- Palmén, E.; Newton, C.W. Atmospheric Circulation Systems: Their Structure and Physical Interpretation; Academic Press: Cambridge, MA, USA, 1969. [Google Scholar]
- Nakamura, N.; Huang, C.S.Y. Atmospheric blocking as a traffic jam in the jet stream. Science 2018, 361, 42–47. [Google Scholar] [CrossRef]
- Mokhov, I.I.; Timazhev, A.V.; Lupo, A.R. Changes in atmospheric blocking characteristics within Euro-Atlantic region and Northern Hemisphere as a whole in the 21st century from model simulations using RCP anthropogenic scenarios. Glob. Planet. Chang. 2014, 122, 265–270. [Google Scholar] [CrossRef]
- Tyrlis, E.; Hoskins, B.J. Aspects of a Northern Hemisphere Atmospheric Blocking Climatology. J. Atmos. Sci. 2008, 65, 1638–1652. [Google Scholar] [CrossRef]
- Barriopedro, D.; García-Herrera, R.; Lupo, A.R.; Hernández, E. A Climatology of Northern Hemisphere Blocking. J. Clim. 2006, 19, 1042–1063. [Google Scholar] [CrossRef]
- Tibaldi, S.; Molteni, F. On the operational predictability of blocking. Tellus A 1990, 42, 343–365. [Google Scholar] [CrossRef]
- Lenggenhager, S.; Croci-Maspoli, M.; Brönnimann, S.; Martius, O. On the dynamical coupling between atmospheric blocks and heavy precipitation events: A discussion of the southern Alpine flood in October 2000. Q. J. R. Meteorol. Soc. 2019, 145, 530–545. [Google Scholar] [CrossRef]
- Rimbu, N.; Stefan, S.; Busuioc, A.; Georgescu, F. Links between blocking circulation and precipitation extremes over Romania in summer. Int. J. Climatol. 2015, 36, 369–376. [Google Scholar] [CrossRef]
- Yamada, T.J.; Takeuchi, D.; Farukh, M.A.; Kitano, Y. Climatological Characteristics of Heavy Rainfall in Northern Pakistan and Atmospheric Blocking over Western Russia. J. Clim. 2016, 29, 7743–7754. [Google Scholar] [CrossRef]
- Li, S.; Ji, L.; Lin, W.; Ni, Y. The maintenance of the blocking over the Ural Mountains during the second Meiyu period in the summer of 1998. Adv. Atmos. Sci. 2001, 18, 87–105. [Google Scholar]
- Chen, G.T.-J.; Wang, C.-C.; Wang, A.-H. A Case Study of Subtropical Frontogenesis during a Blocking Event. Mon. Weather Rev. 2007, 135, 2588–2609. [Google Scholar] [CrossRef][Green Version]
- Antokhina, O.Y.; Antokhin, P.N.; Martynova, Y.V.; Mordvinov, V.I. The impact of atmospheric blocking on spatial distributions of summertime precipitation over Eurasia. IOP Conf. Ser. Earth Environ. Sci. 2016, 48, 012035. [Google Scholar] [CrossRef]
- Nakamura, H.; Nakamura, M.; Anderson, J.L. The Role of High- and Low-Frequency Dynamics in Blocking Formation. Mon. Weather Rev. 1997, 125, 2074–2093. [Google Scholar] [CrossRef]
- Masato, G.; Hoskins, B.J.; Woollings, T.J. Wave-breaking characteristics of midlatitude blocking. Q. J. R. Meteorol. Soc. 2011, 138, 1285–1296. [Google Scholar] [CrossRef]
- Schubert, S.D.; Wang, H.; Koster, R.D.; Suarez, M.J.; Groisman, P.Y. Northern Eurasian Heat Waves and Droughts. J. Clim. 2014, 27, 3169–3207. [Google Scholar] [CrossRef]
- Li, J.; Ruan, C. Corrigendum: The North Atlantic-Eurasian teleconnection in summer and its effects on Eurasian climates (2018 Environ. Res. Lett. 13 024007). Environ. Res. Lett. 2018, 13, 129501. [Google Scholar] [CrossRef]
- Antokhina, O.Y.; Antokhin, P.N.; Devyatova, E.V.; Martynova, Y.V. Atmospheric Blockings in Western Siberia. Part 2. Long-term Variations in Blocking Frequency and Their Relation with Climatic Variability over Asia. Russ. Meteorol. Hydrol. 2018, 43, 143–151. [Google Scholar] [CrossRef]
- Coumou, D.; Capua, G.D.; Vavrus, S.; Wang, L.; Wang, S. The influence of Arctic amplification on mid-latitude summer circulation. Nat. Commun. 2018, 9. [Google Scholar] [CrossRef] [PubMed]
- Lejenäs, H.; Økland, H. Characteristics of northern hemisphere blocking as determined from a long time series of observational data. Tellus A 1983, 35A, 350–362. [Google Scholar] [CrossRef]
- Schneider, U.; Becker, A.; Finger, P.; Meyer-Christoffer, A.; Ziese, M.; Rudolf, B. GPCC’s new land surface precipitation climatology based on quality-controlled in situ data and its role in quantifying the global water cycle. Theor. Appl. Climatol. 2013, 115, 15–40. [Google Scholar] [CrossRef]
- Schneider, U.; Becker, A.; Finger, P.; Meyer-Christoffer, A.; Ziese, M. GPCC Full Data Monthly Product Version 2018 at 0.25°: Monthly Land-Surface Precipitation from Rain-Gauges Built on GTS-Based and Historical Data; WMO: Geneva, Switzerland, 2018. [Google Scholar]
- Dee, D.P.; Uppala, S.M.; Simmons, A.J.; Berrisford, P.; Poli, P.; Kobayashi, S.; Andrae, U.; Balmaseda, M.A.; Balsamo, G.; Bauer, P.; et al. The ERA-Interim reanalysis: Configuration and performance of the data assimilation system. Q. J. R. Meteorol. Soc. 2011, 137, 553–597. [Google Scholar] [CrossRef]
- North, G.R.; Bell, T.L.; Cahalan, R.F.; Moeng, F.J. Sampling Errors in the Estimation of Empirical Orthogonal Functions. Mon. Weather Rev. 1982, 110, 699–706. [Google Scholar] [CrossRef]
- Wirth, V.; Riemer, M.; Chang, E.K.M.; Martius, O. Rossby Wave Packets on the Midlatitude Waveguide—A Review. Mon. Weather Rev. 2018, 146, 1965–2001. [Google Scholar] [CrossRef]
- Sinyukovich, V. The water balance of the Selenga river basin. Geogr. Nat. Resour. 2008, 29, 54–56. [Google Scholar] [CrossRef]
- Antokhina, O.Y.; Antokhin, P.N.; Devyatova, E.V.; Mordvinov, V.I. Dynamic Processes in the Atmosphere Determining Summertime Precipitation Anomalies in The Eastern Siberia And Mongolia Fundame. Appl. Climatol. 2018, 5, 10–27, (In Russian with English summary). [Google Scholar]
- Chen, H.; Teng, F.; Zhang, W.; Liao, H. Impacts of Anomalous Midlatitude Cyclone Activity over East Asia during Summer on the Decadal Mode of East Asian Summer Monsoon and Its Possible Mechanism. J. Clim. 2017, 30, 739–753. [Google Scholar] [CrossRef]
- Sato, N.; Takahashi, M. Dynamical Processes Related to the Appearance of Quasi-Stationary Waves on the Subtropical Jet in the Midsummer Northern Hemisphere. J. Clim. 2006, 19, 1531–1544. [Google Scholar] [CrossRef]
© 2019 by the authors. Licensee MDPI, Basel, Switzerland. This article is an open access article distributed under the terms and conditions of the Creative Commons Attribution (CC BY) license (http://creativecommons.org/licenses/by/4.0/).