Abstract
Based on the 19 year observation from 1998 to 2016 at the Tsuan Wan and Central/Western District monitoring stations in Hong Kong, the aim of this paper was to assess the wet deposition pathway of Benzo(a)pyrene (BaP) on a large time-scale. In order to achieve this goal, multi-fractal detrended cross-correlation analysis (MF-DCCA) was used to characterize the long-term cross-correlations behaviors and multi-fractal temporal scaling properties between BaP (or PM2.5) and precipitation. The results showed that the relationships between BaP and precipitation (or PM2.5) displayed long-term cross-correlation at the time-scale ranging from one month to one year; no cross-correlation between each other was observed in longer temporal scaling regimes (greater than one year). These results correspond to the atmospheric circulation of the Asian monsoon system and are explained in detail. Similar dynamic processes of the wet deposition of BaP and PM2.5 suggested that the main removal process of atmospheric BaP was rainfall deposits of PM2.5-bound BaP. Furthermore, cross-correlations between BaP (or PM2.5) and precipitation at the long time-scale have a multi-fractal nature and long-term persistent power-law decaying behavior. The temporal evolutions of the multi-fractality were investigated by the approach of a sliding window. Based on the evolution curves of multi-fractal parameters, the wet deposition pathway of PM2.5-bound BaP is discussed. Finally, the contribution degree of wet deposition to PM2.5-bound BaP was derived from the coefficient of determination. It was demonstrated that about 45% and 60% of atmospheric BaP removal can be attributed to the wet deposition pathway of PM2.5-bound BaP for the Tsuan Wan and Central/Western District areas, respectively. The findings in this paper are of great significance for further study on the removal mechanism of atmospheric BaP in the future. The MF-DCCA method provides a novel approach to assessing the geochemical cycle dynamics of BaP.
1. Introduction
Polycyclic aromatic hydrocarbons (PAHs) are considered as a class of significant environmental pollutants, which have attracted much attention owing to their toxicological effects on human health [1,2,3,4]. Benzo(a)pyrene (BaP) is one of the most important PAHs due to the fact that it has the greatest contribution to the total carcinogenic activity of PAHs [5,6,7,8,9]. The removal process of atmospheric BaP is an important research topic in environmental science.
In the atmosphere, the chemical and physical properties of BaP, namely, its low solubility in water and low vapor pressure, make it almost always found in the particle phase associated with particulate matter [10,11,12,13,14,15]. It is widely accepted that particulate matter tends to be deposited, especially, from the atmosphere due to the clearance of precipitation [16]. Thus, in the natural environment, the atmosphere is not a repository for BaP but rather a pathway for its transportation and transformation. A part of BaP in the atmosphere may enter into aquatic and terrestrial ecosystems under the influence of precipitation. Thus, it can be seen that wet deposition is an important removal mechanism of atmospheric BaP [17,18,19,20]. However, the detailed relational mechanism remains uncertain owing to the complexity of affecting factors. For example, ambient temperature can affect significantly the gas–particle partitioning of BaP [12,13,21,22]. In summer, the increase in ambient temperature can result in the evaporation of the particle phase BaP to gas phase [23], so abundant rainfall does not significantly decrease BaP concentrations in the atmosphere [24]. On the other hand, BaP may be degraded by high temperatures and solar irradiation in summer [25,26]. In winter, when ambient temperature decrease, the more gas phase BaP can be absorbed into atmospheric PM2.5 [27]. So, it seems that the PM2.5-bound BaP tends to be deposited by rainfall and BaP concentrations decrease in the atmosphere during the cold season [28,29,30,31,32]. However, the increasing discharge of anthropogenic sources, such as fuels consumption and domestic heating, can contribute to an increase in BaP concentrations during cold periods [33,34]. Thus, there are not many clear trends between BaP and affecting factors owing to the lack of longer-term time-series data and the complexity of interactions. Because BaP and PM2.5 originate mainly from different anthropogenic emissions, some authors reported that there was no significant correlation between BaP and PM2.5 [35,36]. However, these results are always inconsistent. Significant correlations were seen for particulate-bound BaP and PM2.5 in Svalbard [37]. These ambiguous results may be dependent on the sampling periods. For BaP, some comparatively fast processes (e.g., photochemical reactions, absorption of PM2.5, clearance of precipitation) relaxes on timescales of seconds up to hours, while other comparatively slow processes (e.g., transportation of BaP, gas–particle partitioning, anthropogenic emissions) relaxes on timescales of days up to years. Thus, although it is accepted that precipitation tends to deposit, especially, the particulate matter from the atmosphere [16], the long-term relationship between BaP and precipitation at different time-scales still remains unclear. It is evident that the understanding of of these uncertainties can help to improve the knowledge about removal mechanism of BaP.
Some traditional cross-correlation analysis methods, such as the Pearson correlation coefficient, are often applied to investigate the interrelationship between air pollutants and meteorological factors [38]. However, a lot of studies have confirmed the long-term persistent behavior of air pollutant concentrations on different time-scales, which indicates the presence of a strong correlation between the present concentration and past concentration [39,40,41]. One direct result of this property is that temporal variations of air pollutants on different time-scales are characterized by the high degree of non-stationarity. When the time-series is non-stationary, outliers are ever-present [42,43]. Thus, the strong cross-correlations may be result from an accidentally strong and identical trend rather than the real cross-correlation natures in each non-stationary time-series. Because the stationarity of the data is the underlying assumption in traditional cross-correlation analysis, it may lead to misleading or non-robust results when time series are nonstationary. In 2008, Podobnik et al. [44] provided a new method, namely, detrended cross-correlation analysis (DCCA), to investigate the power-law cross-correlations between two non-stationary time-series. Later, Zhou (2008) [45] extended the DCCA method to multi-fractal detrended cross-correlation analysis (MF-DCCA), combining the multi-fractal analysis with cross-correlation analysis between two non-stationary time-series. The MF-DCCA method can unveil the multi-fractal features of cross-correlations at different temporal scaling [46,47]. Therefore, the introduction of the MF-DCCA method to study the long-term cross-correlation between precipitation, PM2.5, and BaP series on different time-scales, will be conducive to better understanding the wet deposition mechanism of BaP.
Hong Kong is located in the southeast of China, adjacent to the Pearl River Delta (PRD). As a receptor of the huge anthropogenic emissions from PRD, Hong Kong suffers from air pollution due to the local emissions and long-range transport. At the same time, as a coastal megacity, precipitation in Hong Kong is abundant under the strong influence of the Asian monsoon climate. In this paper, firstly, we apply the DCCA method to explore the cross-correlations between precipitation, PM2.5, and BaP based on the 19 years of monitoring data. Next, the multi-fractal natures of power-law cross-correlations are investigated using the MF-DCCA method and sliding window technology. Finally, the wet deposition mechanism of BaP in the atmosphere is assessed quantitatively based on multi-fractal results.
2. Materials and Methods
2.1. Materials
In 1997, the last municipal solid waste incineration plant in Hong Kong, which was considered to be a significant BaP pollution source, was closed. In July 1997, the Hong Kong Environmental Protection Department (HKEPD) set-up a regular BaP-monitoring program to evaluate the reduction in BaP emissions. Ambient BaP was monitored at two urban sites, namely, Tsuen Wan and Central/Western. The Central/Western District monitoring station represents mixed urban residential and commercial areas, while the Tsuen Wan monitoring station is a mixed urban residential, commercial, and industrial area. The sampling and analytical techniques followed the TO-13A method recommended by the US Environmental Protection Agency. The sampling frequency was once a month and the sampling period was 24 h. In this study, the monitoring data on daily average ambient BaP and PM2.5 from January 1998 to December 2016 were provided by HKEPD. Meanwhile, the data on daily precipitation at the corresponding time were collected from the Hong Kong Observatory. The research data for the two monitoring stations are shown in Figure 1.
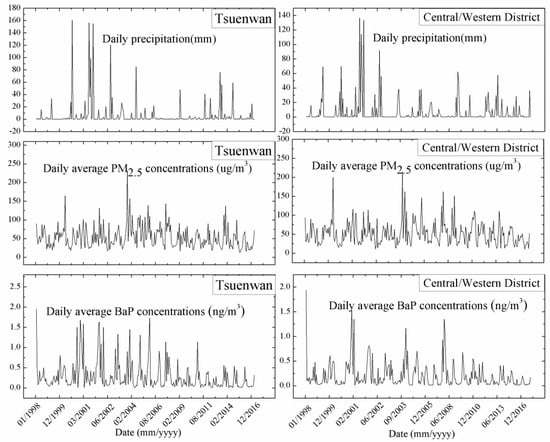
Figure 1.
The regular monitoring data from January 1998 to December 2016.
2.2. Methods
The multi-fractal analysis and detrended cross-correlation analysis of BaP and rainfall or aerosol non-stationary time-series are revealed based on a method that was introduced by Zhou (2008) [45]. The main steps of the MF-DCCA method are as follows.
Take two non-stationary time-series x(t) and y(t), into consideration, where N is the length of the series. Firstly, calculate the two profiles:
where and are the mean values of the two time-series.
Then, divide the two profiles and into Ns non-overlapping segments with an equal length s, . Furthermore, calculate the local trend for each segment v by the least squares fit of the data, and determine the covariance of the residuals in each segment v:
where , and represent the fitting polynomials in segment v, respectively. The next step is to obtain the qth-order fluctuation function:
Finally, analyze the scaling behavior of the fluctuation function by observing log–log plots of versus s for each value of q.
is the scaling exponent indicating the characteristics of the cross-correlation between the two time-series x(t) and y(t). If is independent of q, the cross-correlation between the two time-series is mono-fractal. If decreases with the increase of q, the cross-correlation between the two time-series is multi-fractal. Notably, for q = 2, represents the cross-correlation exponent in the DCCA method. denotes the absence of cross-correlations. If , it indicates that persistent long-range cross-correlations exists between the two-time series; While indicates the anti-persistent cross-correlations between the two time-series.
Furthermore, to measure the multi-fractality degree of cross-correlation, an index is defined:
3. Results and Discussion
Generally speaking, rainfall contributes significantly to the wet deposition of PM2.5. Therefore, the cross-correlations between precipitation and the fluctuation of PM2.5 concentration can reflect the information of PM2.5 wet deposition. Similarly, the cross-correlations between precipitation and the fluctuation of BaP concentration can reflect the information of BaP wet deposition. In addition, the cross-correlations between BaP and PM2.5 concentrations can reflect the adsorption of BaP on PM2.5. Firstly, the cross-correlations were tested by DCCA exponent h, and the results are shown in Figure 2. It was obvious that there were two distinct segments for all the curves of versus s, which indicated the different cross-correlation behaviors at different time-scales. Moreover, the critical time-scale corresponding to the crossover point was about one year. For shorter time-scales (t < 1 year), all the plots could be fitted to straight lines, and the slopes were the scaling exponent h1. As shown in Figure 2, for the two sites, the scaling exponent h1 of PM2.5–precipitation, BaP–precipitation and PM2.5–BaP were all far more than 0.5. It suggests that there existed high long-term cross-correlations between them. However, over longer time periods, the slopes (the scaling exponent h2) of the curves were all close to 0.5, which indicated that any two of the BaP, PM2.5, and precipitation were not cross-correlated with each other. This result was related to synoptic meteorology in Hong Kong. Due to the influence of the Asiatic monsoon, the seasonal difference of precipitation in Hong Kong is quite obvious on one-year time-scales. In order to confirm that the scaling exponents can indeed reveal some information on the cross-correlations between any two series, the same analysis was performed on shuffled versions of the original series. For the shuffled series, the temporal correlations in the data were destroyed while the distribution was preserved in the shuffling process. In theory, there will be no long-term cross-correlation between the two series over the whole time-scaling. As shown in Figure 2, it was found that the scaling exponents h for all the shuffled series were close to 0.5, which indicated the obvious non-correlation.
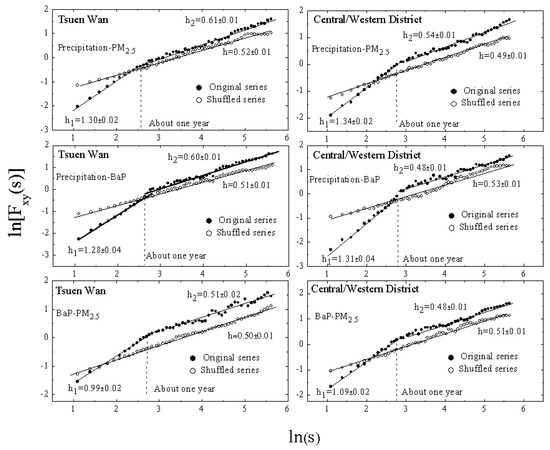
Figure 2.
Detrended cross-correlation analysisplot for Tsuen Wan and the Central/Western District.
From the DCCA analysis, it is worth noting that the scaling exponent h1 of PM2.5–precipitation and BaP–precipitation were very close, and both of them were higher than 1. This indicates that the wet deposition of BaP and PM2.5 had similar dynamic processes. It is well known that particulate matter is easily deposited by precipitation, which results in the strong cross-correlation between PM2.5 and precipitation. However, as a water-insoluble gas, the strong cross-correlation between atmospheric BaP and precipitation should be attributed to the fact that the atmospheric BaP were deposited by adsorbing onto the particulate matter.
The DCCA method can only test the existence of cross-correlations. However, at different time scales, the fractal characteristics of cross-correlation is different. A series of mono-fractal subsets over different time-scales form a multi-fractal spectrum. It can present the temporal distribution and heterogeneity of the cross-correlations over the whole time-scales. Therefore, in order to further describe the scaling characteristics of BaP–precipitation and PM2.5–precipitation in more detail, it is of critical importance to investigate the multi-fractal features of the long-term cross-correlations base with the MF-DCCA method. The MF-DCCA results are shown in Figure 3.
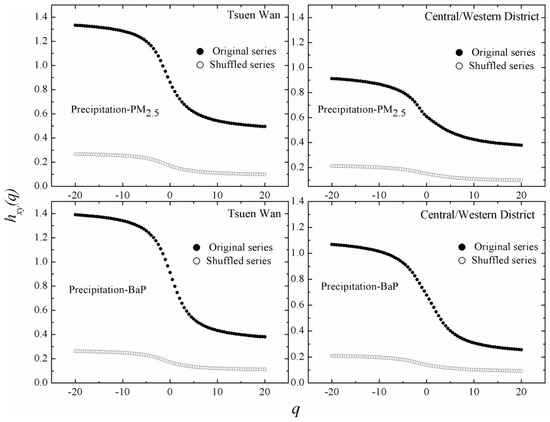
Figure 3.
MF-DCCA plot of precipitation–PM2.5 and precipitation–BaP for the two monitoring sites.
It is worth noting that is not a constant with the increase of q, and it decreased with q varying from −20 to 20 for the original series. This indicates that the long-term cross-correlations of BaP–precipitation and PM2.5–precipitation were multi-fractal. That is to say, the power-law cross-correlations were different for different order q. In comparison, hardly changed with q for the shuffled series, as shown in Figure 3, which showed mono-fractal scaling. The multi-fractal strength can be expressed by index ,. For the Tsuen Wan site, the values of BaP–precipitation and PM2.5–precipitation are 1.01 and 0.84, respectively, while for the Central/Western District site, the values of BaP–precipitation and PM2.5–precipitation were 0.8 and 0.53, respectively. It can be seen that values of BaP–precipitation were higher than that of PM2.5–precipitation for both sites. This suggests that the heterogeneity of the wet deposition of atmospheric BaP was higher than that of PM2.5 over the whole time-scale. This was because not all of the BaP that adsorbed onto PM2.5 was deposited by precipitation. Some of it was degraded by photochemistry reaction on the surface of particles, and parts of it was removed by dry deposition. Therefore, only one multi-fractal parameter derived from the whole time-scale was unable to reflect the relationship between wet deposition mechanisms of BaP and PM2.5. Therefore, in order to understand the wet deposition mechanism of BaP more accurately over a long time-scale, it is essential to reveal the temporal evolution of multi-fractal parameters based on the sliding window method. The sliding window method was as follows: Firstly, we set an original window with 120 monitoring data for each series, and the multi-fractal parameter (Δh) of BaP–precipitation and PM2.5–precipitation for this original window was calculated. Secondly, we slid the window by one monitoring data toward the right along the time sequence and again calculated the Δh. Then, we repeated this procedure for the remaining data, and two sets of Δh were obtained. The temporal evolution of Δh for cross-correlations of BaP–precipitation and PM2.5–precipitation are shown in Figure 4.
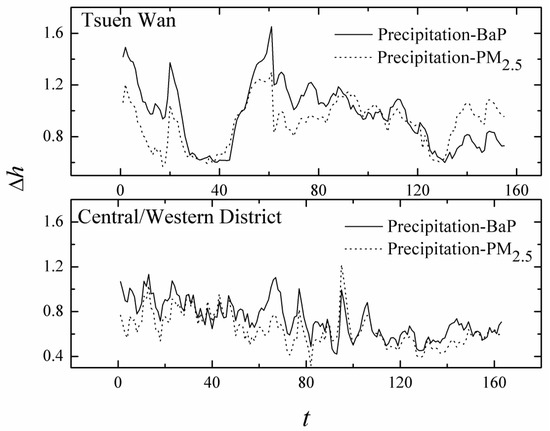
Figure 4.
The temporal distribution of Δh between BaP–precipitation and PM2.5–precipitation for the two sites, based on the sliding window technique.
As shown in Figure 4, a remarkable similarity in the temporal evolution of Δh between BaP–precipitation and PM2.5–precipitation was observed over the large time-scale (19 years). This suggests that that the main removal process of atmospheric BaP is that rainfall deposits the PM2.5-bound BaP. To be specific, the two lines do not synchronize completely, which indicates that not all of the PM2.5-bound BaP in the atmosphere is removed by precipitation. In fact, some processes, such as photodegradation and dry deposition, are also important removal pathways of atmospheric BaP. Furthermore, in order to quantify the contribution of wet deposition to the removal of PM2.5-bound BaP, the coefficient of determination (R2) was introduced; it is the square of the correlation coefficient between the study variable and the explanatory variable. In this study, we set Δh of PM2.5–precipitation as the explanatory variable and Δh of BaP–precipitation as the study variable. The calculated results are shown in Figure 5.
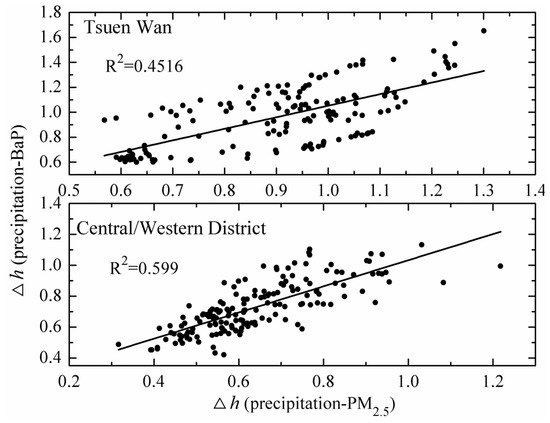
Figure 5.
The correlation coefficient between Δh (PM2.5–precipitation) and Δh (BaP–precipitation).
As shown in Figure 5, R2 values were 0.4516 and 0.599 for the Tsuan Wan and Central/Western District monitoring stations, respectively. This implies that about 45% and 60% of atmospheric BaP removal can be attributed to the wet deposition pathway of PM2.5-bound BaP for the Tsuan Wan and Central/Western District areas, respectively. It was noticed that the R2 value for the Central/Western District site was higher than that for the Tsuan Wan site, indicating that the effect of wet deposition on PM2.5-bound BaP was more obvious for the Central/Western District area. This may be due to the differences in aerosol surface properties, regional transport, and meteorological factors between the two areas.
4. Conclusions
In the last decade, few systematic investigations focused on the long-term trends of the removal mechanism of atmospheric BaP over large time-scales. In this paper, according to the partition of atmospheric BaP in the particle- and gas-phases, we studied the contribution of wet deposition to BaP removal using the MF-DCCA method. Firstly, we applied the DCCA exponent h to test the cross-correlations in BaP–precipitation, PM2.5–precipitation, and BaP–PM2.5 systems, which can characterize the wet deposition of BaP (PM2.5) and the partition of BaP in PM2.5, respectively. It indicates that there existed high long-term cross-correlations in the three systems. Over one year, little cross-correlation existed between any two of them. Next, the MF-DCCA method was used to describe the scaling characteristics of cross-correlations to obtain more details. It was found that the multi-fractal degree of cross-correlations in BaP–precipitation was higher than that of PM2.5–precipitation for both sites, which indicated that the heterogeneity of the wet deposition of atmospheric BaP was higher than that of PM2.5 over the whole time-scale. Furthermore, to reveal the effect of PM2.5 on wet deposition of BaP, we compared the temporal evolutions of multi-fractal parameters between BaP–precipitation and PM2.5–precipitation using the sliding window method. It was found that the temporal distribution and variation trend of the two sets of multi-fractal parameters were very similar over large time-scales (19 years) for both sites. This indicates that the wet deposition of BaP was accomplished by adsorbing onto PM2.5. However, the results showed that wet deposition was not the only way to remove PM2.5-bound BaP. Finally, determination (R2) was further used to quantify the contribution of wet deposition to BaP removal. The R2 values were 0.4516 and 0.599 for the Tsuan Wan and Central/Western District monitoring stations, respectively. That is, about 45% and 60% of the PM2.5-bound BaP were removed by wet deposition for the Tsuan Wan and Central/Western District areas, respectively. The findings of this study can help to better understand the removal mechanism of BaP wet deposition in the atmosphere. The MFDCCA method provides a novel approach to assessing the geochemical cycle dynamics of BaP.
Author Contributions
Data processing, C.L., J.L. and H.H.; Formal analysis, C.L., K.S., J.L. and H.H.; Methodology, K.S.; Writing—original draft, C.L.; Writing—review and editing, K.S.
Funding
This research was funded by the National Natural Science Foundation of China, grant number 41603128; Scientific Research Fund of Hunan Province Education Department, grant number 16A172; Hunan Provincial Natural Science Foundation of China, grant number 2017JJ2219.
Conflicts of Interest
The authors declare no conflict of interest.
References
- Abedi-Ardekani, B.; Kamangar, F.; Hewitt, S.M.; Hainaut, P.; Sotoudeh, M.; Abnet, C.C.; Taylor, P.R.; Boffetta, P.; Malekzadeh, R.; Dawsey, S.M. Polycyclic aromatic hydrocarbon exposure in oesophageal tissue and risk of oesophageal squamous cell carcinoma in north-eastern Iran. Gut 2010, 59, 1178–1183. [Google Scholar] [CrossRef] [PubMed]
- Wang, J.; Chen, S.J.; Tian, M.; Zheng, X.B.; Gonzales, L.; Ohura, T.; Mai, B.X.; Simonich, S.L.M. Inhalation cancer risk associated with exposure to complex polycyclic aromatic hydrocarbon mixtures in an electronic waste and urban area in south China. Environ. Sci. Technol. 2012, 46, 9745–9752. [Google Scholar] [CrossRef] [PubMed]
- Motorykin, O.; Matzke, M.M.; Waters, K.M.; Massey Simonich, S.L. Association of carcinogenic polycyclic aromatic hydrocarbon emissions and smoking with lung cancer mortality rates on a global scale. Environ. Sci. Technol. 2013, 47, 3410–3416. [Google Scholar] [CrossRef] [PubMed]
- Dat, N.D.; Chang, M.B. Review on characteristics of PAHs in atmosphere, anthropogenic sources and control technologies. Sci. Total Environ. 2017, 609, 682–693. [Google Scholar] [CrossRef] [PubMed]
- Jung, K.H.; Yan, B.; Chillrud, S.N.; Perera, F.P.; Whyatt, R.; Camann, D.; Kinney, P.L.; Miller, R.L. Assessment of benzo(a) pyrene-equivalent carcinogenicity andmutagenicity of residential indoor versus outdoor polycyclic aromatic hydrocarbons exposing young children in New York City. Int. J. Environ. Res. Public Health 2010, 7, 1889–1900. [Google Scholar] [CrossRef]
- Ramirez, N.; Cuadras, A.; Rovira, E.; Marce, R.M.; Borrull, F. Risk assessment related to atmospheric polycyclic aromatic hydrocarbons in gas and particle phases near industrial sites. Environ. Health Perspect. 2011, 119, 1110–1116. [Google Scholar] [CrossRef]
- Masala, S.; Bergvall, C.; Westerholm, R. Determination of benzo[a]pyrene and dibenzopyrenes in a Chinese coal fly ash certified reference material. Sci. Total Environ. 2012, 432, 97–102. [Google Scholar] [CrossRef]
- Gibson, N.; Stewart, R.; Rankin, E. Air quality assessment of benzo(a)pyrene from asphalt plant operation. J. Environ. Monit. 2012, 14, 233–240. [Google Scholar] [CrossRef]
- Bieser, J.; Aulinger, A.; Matthias, V.; Quante, M. Impact of emission reductions between 1980 and 2020 on atmospheric benzo a pyrene concentrations over Europe. Water Air Soil Pollut. 2012, 223, 1393–1414. [Google Scholar] [CrossRef]
- Riddle, S.G.; Jakober, C.A.; Robert, M.A.; Cahill, T.M.; Charles, M.J.; Kleeman, M.J. Large PAHs detected in fine particulate matter emitted from light-duty gasoline vehicles. Atmos. Environ. 2007, 41, 8658–8668. [Google Scholar] [CrossRef]
- Sanderson, E.G.; Raqbi, A.; Vyskocil, A.; Farant, J.P. Comparison of particulate polycyclic aromatic hydrocarbon profiles in different regions of Canada. Atmos. Environ. 2004, 38, 3417–3429. [Google Scholar] [CrossRef]
- Sitaras, L.E.; Bakeas, E.B.; Siskos, P.A. Gas/particle partitioning of seven volatile polycyclic aromatic hydrocarbons in a heavy traffic urban area. Sci. Total Environ. 2004, 327, 249–264. [Google Scholar] [CrossRef]
- Tsapakis, M.; Stephanou, E.G. Occurrence of gaseous and particulate polycyclic aromatic hydrocarbons in the urban atmosphere: Study of sources and ambient temperature effect on the gas/particle concentration and distribution. Environ. Pollut. 2005, 133, 147–156. [Google Scholar] [CrossRef] [PubMed]
- Varea, M.; Galindo, N.; Gil-Molto, J.; Pastor, C.; Crespo, J. Particle-bound polycyclic aromatic hydrocarbons in an urban, industrial and rural area in the western Mediterranean. Environ. Monit. 2011, 13, 2471–2476. [Google Scholar] [CrossRef] [PubMed]
- Li, Z.; Porter, E.N.; Sjodin, A.; Needham, L.L.; Lee, S.; Russell, A.G.; Mulholland, J.A. Characterization of PM2.5-bounded polycyclic aromatic hydrocarbons in Atlanta seasonal variations at urban, suburban and rural ambient air monitoring sites. Atmos. Environ. 2009, 43, 4187–4193. [Google Scholar] [CrossRef]
- Amodio, M.; Catino, S.; Dambruoso, P.R.; de Gennaro, G.; Di Gilio, A.; Giungato, P.; Laiola, E.; Marzocca, A.; Mazzone, A.; Sardaro, A.; et al. Atmospheric Deposition: Sampling Procedures, Analytical Methods, and Main Recent Findings from the Scientific Literature. Adv. Meteorol. 2014, 2014, 161730. [Google Scholar] [CrossRef]
- Wang, Q.; Liu, M.; Li, Y.; Liu, Y.K.; Li, S.W.; Ge, R.R. Dry and wet deposition of polycyclic aromatic hydrocarbons and comparison with typical media in urban system of Shanghai, China. Atmos. Environ. 2016, 144, 175–181. [Google Scholar] [CrossRef]
- Brij, M.S.; Lisa, M.; Girija, K.B.; Petra, P.; Ondrej, S.; Jana, K.; Luca, N. Spatial gradients of polycyclic aromatic hydrocarbons (PAHs) in air, atmospheric deposition, and surface water of the Ganges River basin. Sci. Total Environ. 2018, 627, 1495–1504. [Google Scholar]
- Tian, M.; Yang, F.M.; Chen, S.J.; Wang, H.B.; Chen, Y.; Zhang, L.Y.; Zhang, L.M.; Xiang, L.; Qiao, B.Q. Atmospheric deposition of polycyclic aromatic compounds and associated sources in an urban and a rural area of Chongqing, China. Chemosphere 2017, 187, 78–87. [Google Scholar] [CrossRef]
- Jiang, Y.Q.; Lin, T.; Wu, Z.L.; Li, Y.Y.; Li, Z.X.; Guo, Z.G.; Yao, X.H. Seasonal atmospheric deposition and air–sea gas exchange of polycyclic aromatic hydrocarbons over the Yangtze River Estuary, East China Sea:Implications for source–sink processes. Atmos. Environ. 2018, 178, 31–40. [Google Scholar] [CrossRef]
- Tham, Y.W.F.; Ozaki, N.; Sakugawa, H. Polycyclic aromatic hydrocarbons (PAHs) in the aerosol of Higashi Hiroshima, Japan: Pollution scenario and source identification. Water Air Soil Pollut. 2007, 182, 235–243. [Google Scholar]
- Tham, Y.W.F.; Takeda, K.; Sakugawa, H. Polycyclic aromatic hydrocarbons (PAHs) associated with atmospheric particles in Higashi Hiroshima, Japan: Influence of meteorological conditions and seasonal variations. Atmos. Res. 2008, 88, 224–233. [Google Scholar] [CrossRef]
- Vorne, G.; Cristina, C.; Stefano, C.; Senem, O.; Silvia, G.; Alessandro, M.; Guido, L. Benzo(a)pyrene air concentrations and emission inventory in Lombardy region, Italy. Atmos. Pollut. Res. 2013, 4, 257–266. [Google Scholar]
- Birgül, A.; Tasdemir, Y.; Cindoruk, S.S. Atmospheric wet and dry deposition of polycyclic aromatic hydrocarbons (PAHs) determined using a modified sampler. Atmos. Res. 2011, 101, 341–353. [Google Scholar] [CrossRef]
- Panther, B.C.; Hooper, M.A.; Tapper, N.J. A comparison of air particulate matter and associated polycyclic aromatic hydrocarbons in some tropical and temperate urban environments. Atmos. Environ. 1999, 33, 4087–4099. [Google Scholar] [CrossRef]
- Beyer, A.; Wania, F.; Gouin, T.; Mackay, D.; Matthies, M. Temperature dependence of the characteristic travel distance. Environ. Sci. Technol. 2003, 37, 766–771. [Google Scholar] [CrossRef] [PubMed]
- Siudek, P. Total carbon and benzo(a)pyrene in particulate matter over a Polish urban site—A combined effect of major anthropogenic sources and air mass transport. Atmos. Pollut. Res. 2018, 9, 764–773. [Google Scholar] [CrossRef]
- Bidleman, T.F. Atmospheric processes: Wet and dry deposition of organic compounds are controlled by their vapor-particle partitioning. Environ. Sci. Technol. 1988, 22, 361–367. [Google Scholar] [CrossRef]
- Lim, L.; Wurl, O.; Karuppiah, S.; Obbard, J.P. Atmospheric wet deposition of PAHs to the sea-surface microlayer. Mar. Pollut. Bull. 2007, 54, 1212–1219. [Google Scholar] [CrossRef]
- Pekey, B.; Karakas, D.; Ayberk, S. Atmospheric deposition of polycyclic aromatic hydrocarbonsto Izmit Bay, Turkey. Chemosphere 2007, 67, 537–547. [Google Scholar] [CrossRef]
- Lenka, S.; Linda, L.; Jana, K.; Gerhard, L. Wet deposition and scavenging efficiency of gaseous and particulate phase polycyclic aromatic compounds at a central European suburban site. Atmos. Environ. 2011, 45, 4305–4312. [Google Scholar]
- Guo, L.C.; Bao, L.J.; She, J.W.; Zeng, E.Y. Significance of wet deposition to removal of atmospheric particulate matter and polycyclic aromatic hydrocarbons: A case study in Guangzhou, China. Atmos. Environ. 2014, 83, 136–144. [Google Scholar] [CrossRef]
- Mastral, A.M.; López, J.M.; Callen, M.S.; Garc?a, T.; Murillo, R.; Navarro, M.V. Spatial and temporal PAH concentrations in Zaragoza, Spain. Sci. Total Environ. 2003, 307, 111–124. [Google Scholar] [CrossRef]
- Ravindra, K.; Bencs, L.; Wauters, E.; de Hoog, J.; Deutsch, F.; Roekens, E.; Bleux, N.; Berghmans, P.; Van Grieken, R. Seasonal and site-specific variation in vapour and aerosol phase PAHs over Flanders (Belgium) and their relation with anthropogenic activities. Atmos. Environ. 2006, 40, 771–785. [Google Scholar] [CrossRef]
- Anastasopoulos, A.T.; Wheeler, A.J.; Karman, D.; Kulka, R.H. Intraurban concentrations, spatial variability and correlation of ambient polycyclic aromatic hydrocarbons (PAH) and PM2.5. Atmos. Environ. 2012, 59, 272–283. [Google Scholar] [CrossRef]
- Ohura, T.; Amagai, T.; Sugiyama, T.; Fusava, M.; Matsushita, H. Characteristics of particle matter and associated polycyclic aromatic hydrocarbons in indoor and outdoor air in two cities in Shizuoka, Japan. Atmos. Environ. 2004, 38, 2045–2054. [Google Scholar] [CrossRef]
- Keyte, I.J.; Harrison, R.M.; Lammel, G. Chemical reactivity and long-range transport potential of polycyclic aromatic hydrocarbons-a review. Chem. Soc. Rev. 2013, 42, 9333–9391. [Google Scholar] [CrossRef]
- Garrido, A.; Jiménez-Guerrero, P.; Ratola, N. Levels, trends and health concerns of atmospheric PAHs in Europe. Atmos. Environ. 2014, 99, 474–484. [Google Scholar] [CrossRef]
- Broday, D.M. Studying the Time Scale Dependence of Environmental Variables Predictability Using Fractal Analysis. Environ. Sci. Technol. 2010, 44, 4629–4634. [Google Scholar] [CrossRef]
- Shi, K.; Liu, C.Q.; Ai, N.S.; Zhang, X.H. Using three methods to investigate time-scaling properties in air pollution indexes time series. Nonlinear Anal. Real World Appl. 2008, 9, 693–707. [Google Scholar]
- Shi, K.; Liu, C.Q.; Huang, Y. Multi-fractal Processes and Self-Organized Criticality of PM2.5 during a Typical Haze Period in Chengdu, China. Aerosol Air Qual. Res. 2015, 15, 926–934. [Google Scholar] [CrossRef]
- Peng, C.K.; Havlin, S.; Stanley, H.E.; Goldberger, A.L. Quantification of scaling exponents and crossover phenomena in nonstationary heartbeat time series. Chaos 1995, 5, 82–87. [Google Scholar] [CrossRef] [PubMed]
- Barnes, J.A.; Allan, D.W. A statistical model of flicker noise. Proc. IEEE 1996, 54, 176–178. [Google Scholar] [CrossRef]
- Podobnik, B.; Stanley, H.E. Detrended cross-correlation analysis: A new method for analyzing two nonstationary time series. Phys. Rev. Lett. 2008, 100, 084102. [Google Scholar] [CrossRef] [PubMed]
- Zhou, W.X. Multi-fractal detrended cross-correlation analysis for two nonstationary signals. Phys. Rev. E 2008, 77, 066211. [Google Scholar] [CrossRef] [PubMed]
- Xu, W.J.; Liu, C.Q.; Shi, K.; Liu, Y.G. Multi-fractal detrended cross-correlation analysis on NO, NO2 and O3 concentrations at traffic sites. Phys. A 2018, 502, 605–612. [Google Scholar] [CrossRef]
- Shi, K. Detrended cross-correlation analysis of temperature, rainfall, PM10 and ambient dioxins in Hong Kong. Atmos. Environ. 2014, 97, 130–135. [Google Scholar] [CrossRef]
© 2019 by the authors. Licensee MDPI, Basel, Switzerland. This article is an open access article distributed under the terms and conditions of the Creative Commons Attribution (CC BY) license (http://creativecommons.org/licenses/by/4.0/).