Article

Generation and Analysis of Gridded Visibility Data in the Arctic

1
College of Meteorology and Oceanography, National University of Defense Technology, Nanjing 210000, China
2
Transportation Branch, Shanghai Beian Industrial Co., Ltd., Shanghai 200000, China
*
Author to whom correspondence should be addressed.
Atmosphere 2019, 10(6), 314; https://doi.org/10.3390/atmos10060314
Submission received: 29 April 2019 / Revised: 17 May 2019 / Accepted: 27 May 2019 / Published: 6 June 2019
(This article belongs to the Section Meteorology)

Abstract

:
With the accelerated warming of the arctic and the gradual opening of the Arctic passages, more and more attention has been paid to assessing the risk of the navigation environment in the Arctic. Due to the scarcity of visibility data in the Arctic, this study proposes a model for referring visibility based on a back propagation (BP) neural network. The reliability of the model is validated and the gridded atmospheric visibility data in the Arctic from 2009 to 2018 was obtained. At the same time, this study analyzed the spatial and temporal features of visibility in the Arctic. The results show that the mean relative error is less than 20% under the different sample forms and it is more accurate to infer the visibility in a specific month using the multiple-year data of that month as training samples. Furthermore, the amount of sample data has a positive effect on the accuracy of inferred visibility, but the effect decreases with data quantity increasing. Visibility changes quickly in the south of 80° N in August, but slowly in the north in that time. At the same time, visibility in July and August is lower than that in other months but higher in March and May.

1. Introduction

With the gradual increase in global temperatures, the melting rate of sea ice in the Arctic is accelerating, and the Arctic passages (APs) are close to being fully opened. According to the Intergovernmental Panel on Climate Change’s (IPCC) Fifth Assessment Report (AR5), it is highly likely that the Arctic sea ice will melt completely in late summer during the second half of the 21st century and these conclusions were confirmed by further analyses of the CMIP3 (Climate Model Intercomparison Project) archives. The APs refer to the three passages that cross the Arctic: the Northeast Passage, Northwest Passage and North Pole Passage. Compared with the traditional passages crossing the Strait of Malacca, Suez Canal and Panama Canal, the APs not only lower military risks but also are associated significant economic benefits.
However, although merchant ships can cross the APs in August and September each year, the Arctic’s natural environment is complex and harsh. Therefore, it is very important to objectively assess the environmental risks of crossing the Arctic. The main factors influencing the navigation risk of crossing APs are sea ice and visibility [1,2,3]. Sea ice data are abundant, enabling the needs of assessment to be met, but atmospheric visibility data are extremely scarce [4] because of less observations and complicated microphysical parameterization schemes of visibility [5,6,7]. At present, the visibility data used in the study of navigation risk in the Arctic are mainly obtained from the International Comprehensive Ocean-Atmosphere Data Set (ICOADS) released by the National Climate Information Centre of the United States (NCDC), measured data from meteorological stations released by the National Oceanic and Atmospheric Administration (NOAA), measured data observed by scientific research ships and satellite and gridded data from numerical weather prediction (NWP). The data from ICOADS, meteorological stations and scientific research ships are measured scatter data, which have the characteristics of strong reliability but irregular data location distribution. Data from satellites are always affected by clouds, so it is very unstable [8]. Because the uncertainty of visibility parameterization always exists in NWP, the visibility data from NWP still need be improved [5,6,9]. So, obtaining a large number of high-quality visibility gridded data and understanding the temporal and spatial variations of visibility in the Arctic is of great significance for ensuring the safety of crossing the APs.
To improve the result from NWP, many scholars have studied the parameterization scheme of visibility. A new microphysical parameterization for fog (NMPF) method using RH (relative humidity), LWC (liquid water content) and Nd (droplet number concentration) parameters was developed by Gultepe et al. [5] to calculate visibility due to fog when RH~100%, and the NMPF has been used extensively in NWP simulations. This new method significantly improves the prediction of visibility from the operational forecast models. Uncertainty in the new visibility parameterization based on both LWC and Nd is found to be less than 29%, which is a function of environmental conditions. Gultepe et al. [1,9] developed microphysical parameterization that is based on the theory of extinction of visible light in a volume of fog droplets, where the extinction coefficient was converted into the visibility using the Koschmieder [10]. Assuming that Nd is inversely related to particle size, Gultepe and Milbrand [11] improved the calculation of visibility with Nd and LWC. Their study indicated that if a numerical forecast model can resolve the microphysical processes at small time and space scales, visibility for marine fog can be predicted diagnostically. The works from Beheng et al. [12,13,14,15] suggest that Nd–Na (aerosol number concentration) parameterizations or predicting Nd as a function of other meteorological parameters is the most important step in predicting fog events and visibility. However, the variability in Nd for a given Na is very large, and this shows how difficult it is to predict Nd values [16]. Overall, the above work improved NWP predictions of visibility significantly but further studies are still needed.
In addition to NWP, many other methods are also used to calculate visibility. Kessner et al. [4] retrieved atmospheric visibility based on satellite remote sensing aerosol optical thickness data and achieved good results. However, due to the many defects of aerosol data obtained from satellite remote sensing because of thick clouds, the method cannot guarantee the calculation of visibility data around the world. At the same time, visibility was calculated with the Koschmieder formula, which is an empirical formula that uses the attenuation coefficient [10]. Fei et al. [17] retrieved visibility based on principal component regression (PCR) and NOAA/AVHRR remote sensing data. The correlation coefficient between the retrieved visibility and observed visibility was 0.82, but the method could not accurately calculate high or low visibility, as the average relative error was 21.4% and the precision was not high. Hadjimitsis et al. [18] retrieved atmospheric visibility based on satellite image data and the darkest pixel atmospheric correction algorithm, but the algorithm was based on six assumptions, which is different from the reality, and the quality of satellite remote sensing images cannot be guaranteed when the cloud layer is thick. Qiang et al. [19] studied the calculation and prediction technology of visibility during blowing snow events over the Arctic sea ice based on the regression method and established the regression equation between visibility and wind speed under different meteorological conditions. The average relative error was between 15% and 32%, which is not high. Eldridge [20] studied the relationship between visibility and LWC in foggy weather, but it is difficult to obtain LWC data. Based on MODIS data, Jiwei et al. [21] studied technology for recognizing sea fog and retrieving its characteristic parameters. However, the numerical calculation of visibility was based on the Koschmieder empirical formula and the quality of satellite remote sensing data was unstable.
Overall, although many methods for calculating atmospheric visibility have been proposed, the following problems still persist. Firstly, the quality and quantity of data needed for calculating visibility, such as aerosol from satellite, LWC and satellite remote sensing images, cannot be guaranteed. Secondly, the uncertainty in the visibility parameterization always exists, which causes the uncertainty of the calculated visibility. At the same time, the linear regression method is not suitable for the numerical calculation of visibility as it cannot describe the nonlinear relationship between visibility and its influence factors, nor calculate sudden changes in visibility [5,22]. To solve these problems, this study aimed to find a nonlinear fitting method to fit the numerical relationship between visibility and its influencing factors. To achieve this, it required the needed data to be easily obtainable. Considering the strong nonlinear fitting ability of neural network technology and the important influence of meteorological elements on visibility, this study attempted to use a neural network to fit the relationship between visibility and other meteorological elements. Considering that the visibility in the Arctic may change with monthly features, this study stored the training data in monthly units and trained the neural network with different training data to infer the visibility on training data in the same time frame to find the training data that most effectively reduced the relative error. At the same time, this study considered that the amount of sample data has a significant effect on the final referred results. Finally, based on the referred visibility data, the temporal and spatial distribution features of visibility in the Arctic were analyzed to validate the accuracy of the inferred visibility and determine optimal navigation times in the region.
Overall, the objective of this paper is; (1) to generate reliable historical continuous gridded data of visibility in the Arctic, which is so scarce [4], but important [1,2], and; (2) to analyze the temporal and spatial distribution features of visibility in the Arctic, which is significant for navigation in the Arctic. The paper is organized as follows. Section 2 provides the introduction of artificial neural network technology and technical process, Section 3 is for the data using in this study, Section 4 analyses the error of referred visibility to find the optimum training sample form that most effectively reduced the relative error and tests the accuracy of the model using data from the Chinese Ninth Arctic Science Examination. The analysis of the temporal and spatial distribution features of visibility in the Arctic is presented in Section 5. Concluding remarks and conclusions are given in Section 6.

2. Introduction of the Technology and Method

2.1. Artificial Neural Network Technology

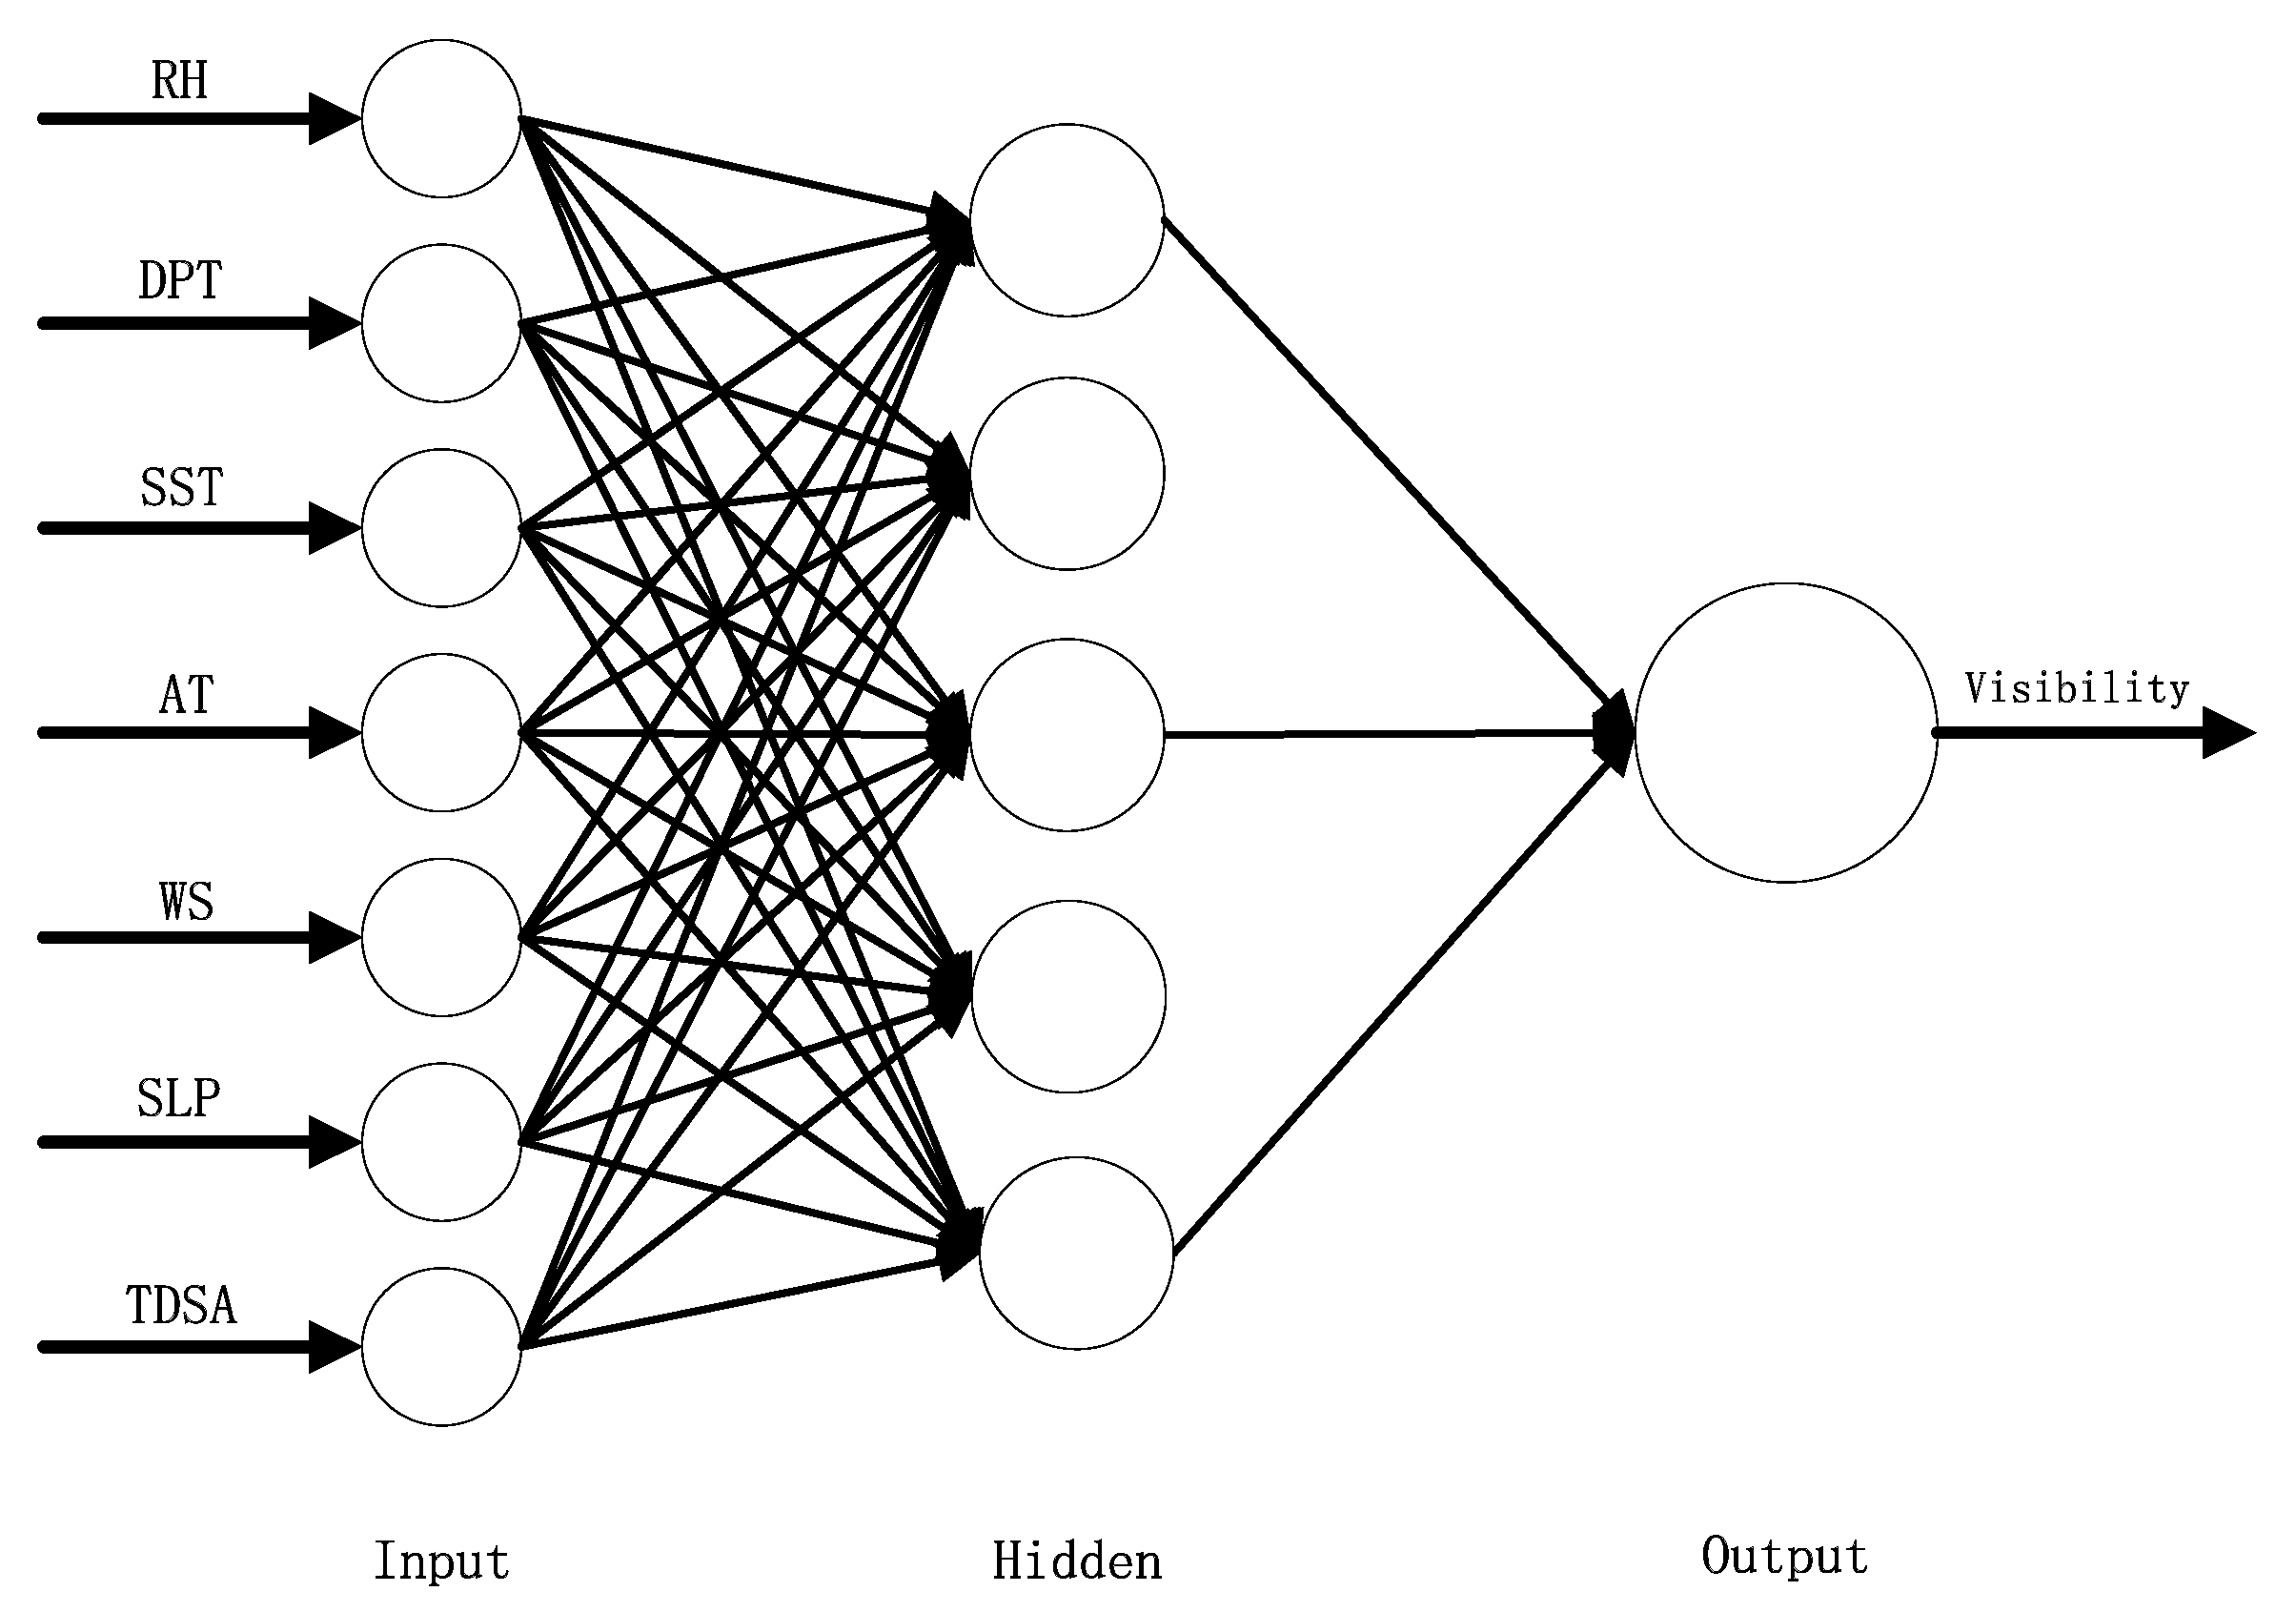
Artificial neural networks have been studied since the 1940s and have been widely applied in the military, medical science and broader economy, etc. Nowadays, it is one of the hottest technologies around the world. There are many artificial neural network models proposed, such as a classical multi-layer forward communication network (BP), radial base function network (RBF), Hopfield network and adaptive resonance theory network. This study employs a BP network to infer visibility, which was first proposed by Rumelhart and McClelland in 1986 [23]. The BP network is one of the classical artificial neural networks and can simulate any nonlinear input-output relationship. The parameters of the BP network are trained based on a BP algorithm. There are three layers in a BP network: the input layer, hidden layer and output layer. The neurons are connected with others in the adjacent layers, but the neurons in the same layer are not connected with each other. The input and output layers are comprised of a single layer, but the hidden layer could have a different number of layers, and the number of neurons in each layer is also different depending upon the layer properties. We plot the topological structure of the BP network, which includes only one layer of the hidden layer (Figure 1).
From the structure chart, it is evident that the signal is transmitted from the input layer to the output layer. The output value of each node in the hidden layer depends on the input value, the weight of each node in the input layer influencing the node value in the hidden layer and the threshold value and activation function of each node in the hidden layer
X j = f ( i = 1 n ( ω i j X i ) Θ j )
where X j is the output value of the jth neuron in the hidden layer when the input value was input, ω i j is the weight where the ith value in the input layer influences the jth value in the hidden layer, X i is the ith value in the input vector, Θ j is the threshold of the jth neuron in the hidden layer and f is the activation function of the jth neuron in the hidden layer. The signal transmission rule between the input layer and hidden layer is the same as the transmission rule between the hidden layer and output layer. When there is an error between the actual output value and ideal output value, the error would be transmitted from the output layer to the hidden layer and input layer to amend the weight and threshold of each neuron. The training process is complete only when the error is less than the convergence threshold. Artificial neural network technology is highly suitable for simulating the nonlinear relationship between atmospheric visibility and atmospheric factors.
This study constructs the BP (Back Propagation) neural network with three layers based on the MATLAB toolbox. The number of hidden layers is considered to be five, the maximum number of iterations is 100, the study rate is 0.1, and the convergence threshold is taken as 0.00001.

2.2. Technical Process of This Study

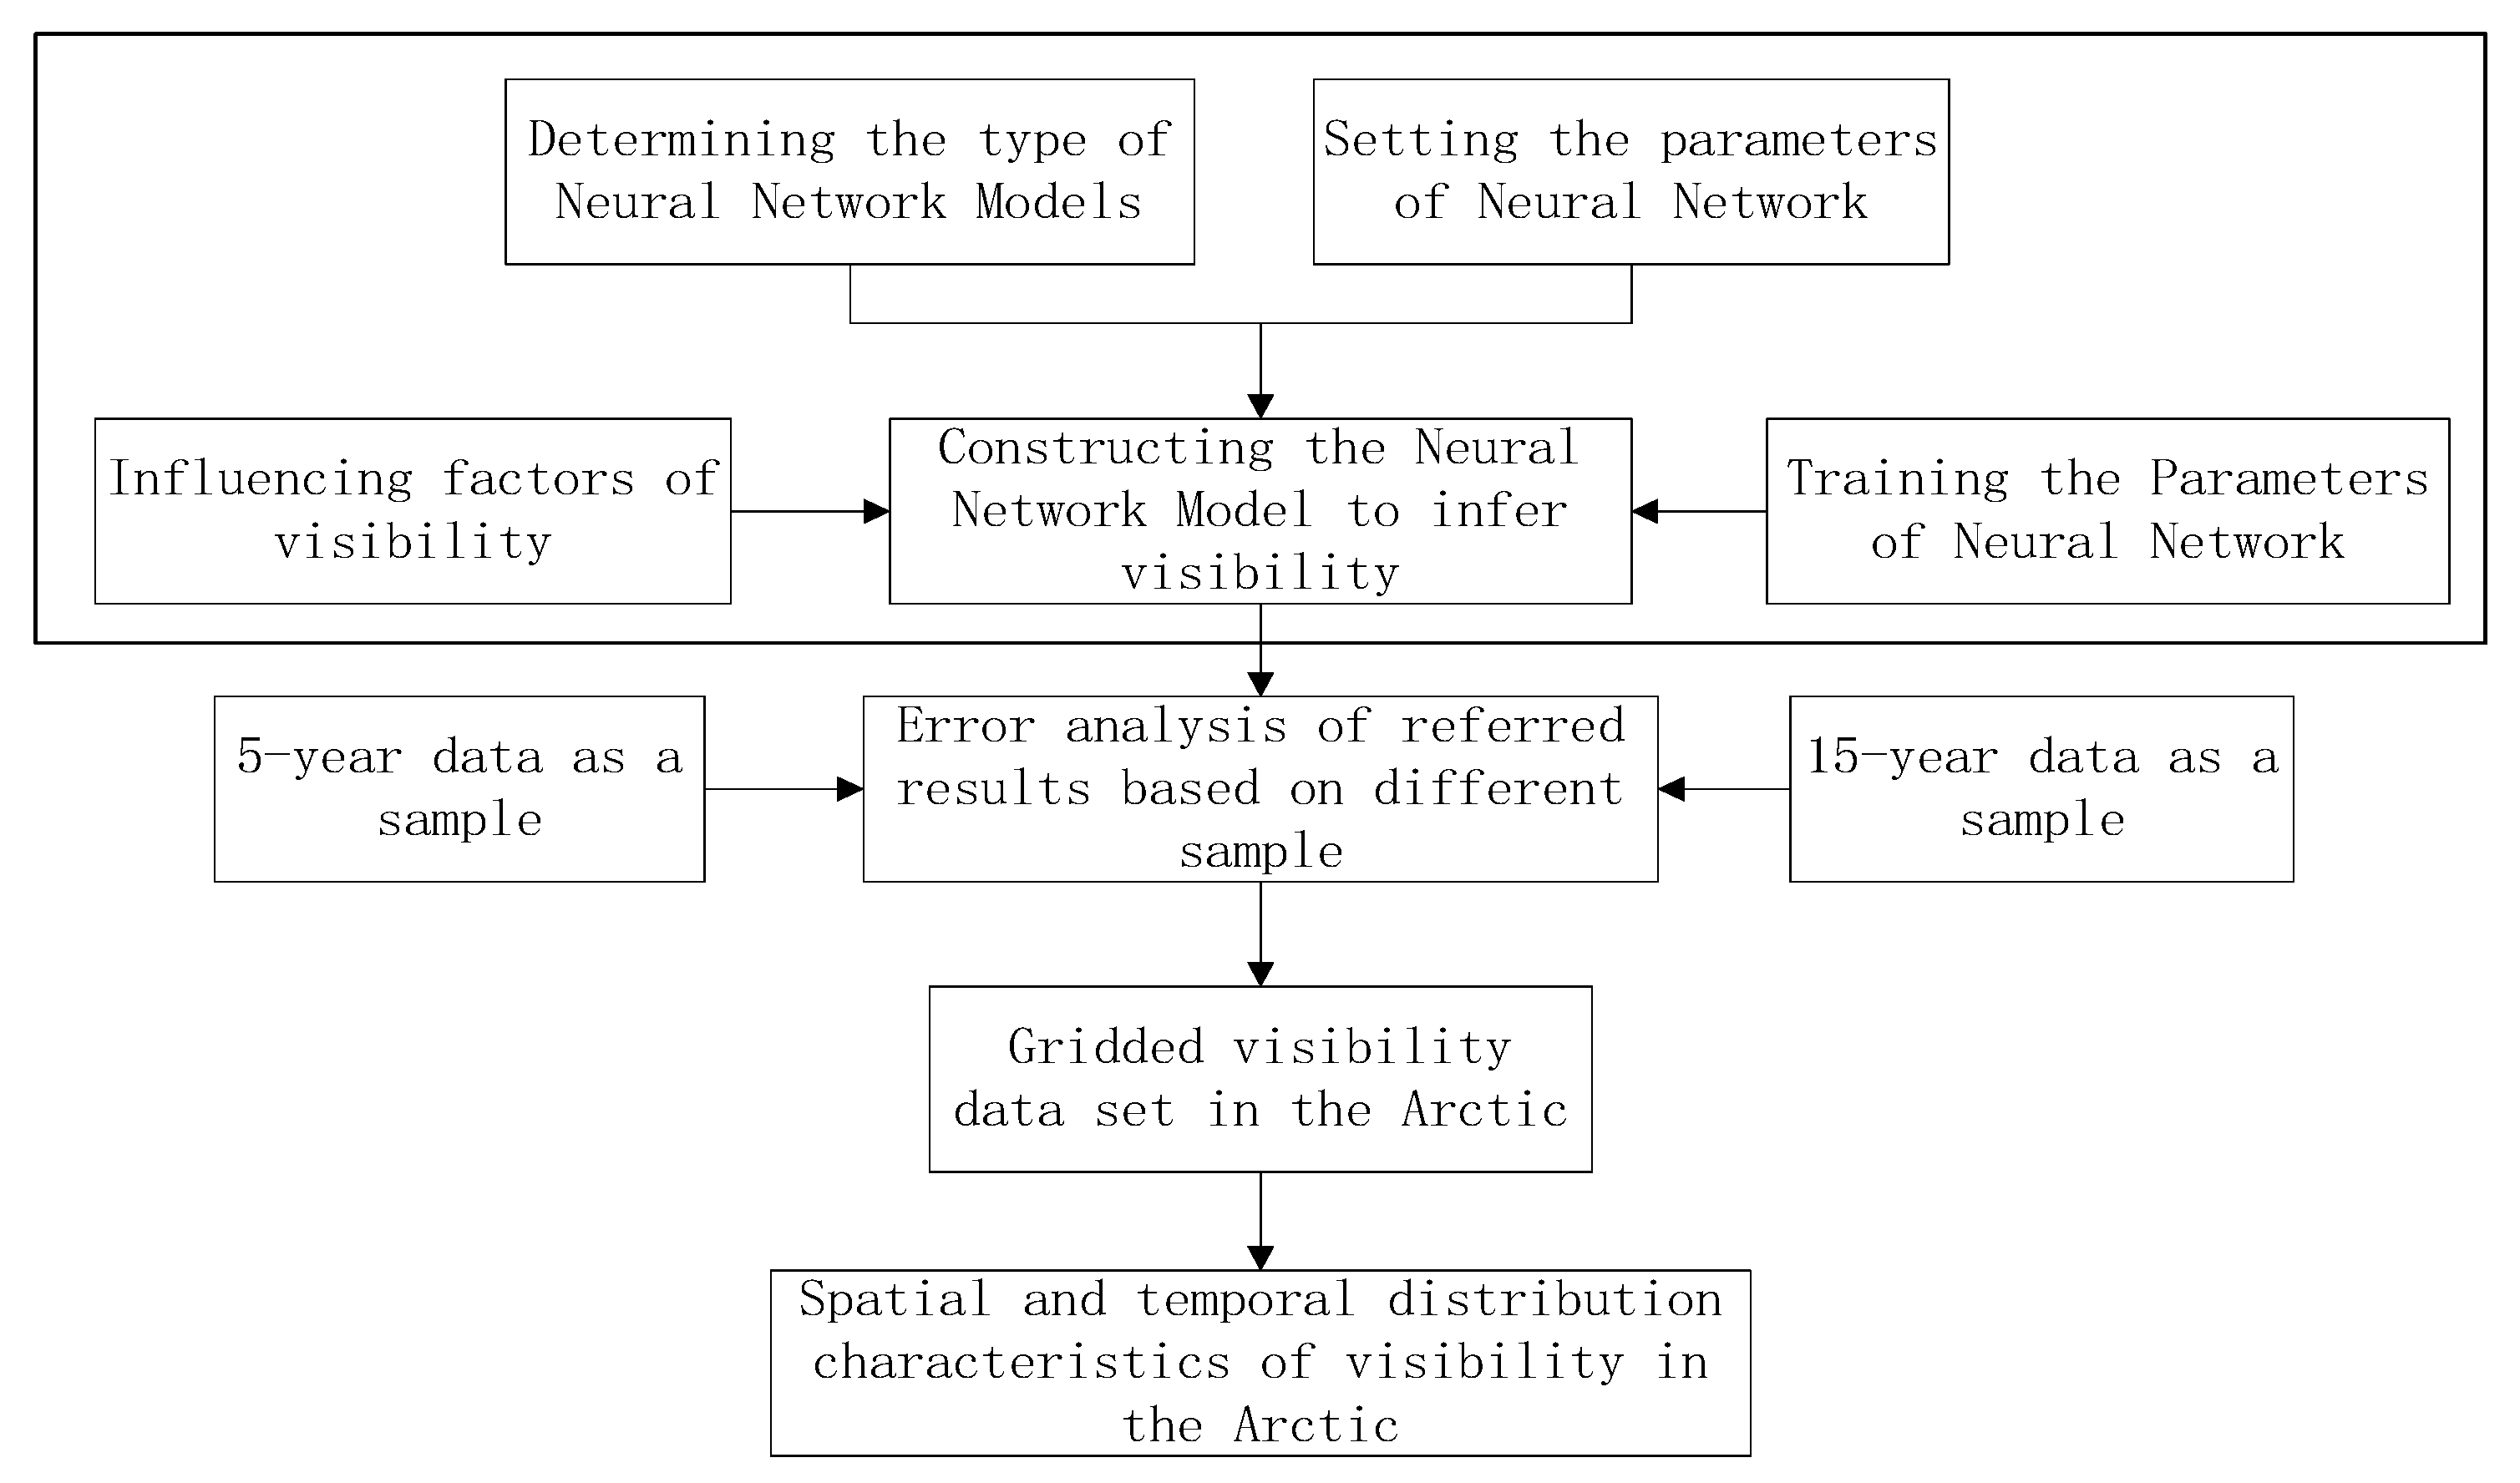
Firstly, the factors affecting atmospheric visibility were screened according to previous research [6]. Secondly, the inference model of the neural network was established based on the determined influencing factors. To verify that the visibility in the Arctic changes with monthly features and to find the best sample form for fitting atmospheric visibility with the neural network. The training data were stored in monthly units. At the same time, this study inferred the visibility for a specific month in 2016 using multi-year data of that month as training samples. To verify the influence of data volume on reasoning accuracy, this study inferred the visibility of each month in 2016 under the condition of 5, 15, 25 and 35-year sample data and compared the relative errors under the different training samples. Finally, based on the established neural network model and the gridded meteorological element data products released by the European Centre for Medium-Range Weather Forecasts (ECMWF), this study generated gridded visibility data and used it to analyze the spatial and temporal features of visibility in the Arctic (Figure 2).

3. Data Preparation

3.1. Influencing Factors on Visibility

Many studies have revealed the factors that influence atmospheric visibility. Gultepe et al. [2] stated that visibility is the most important parameter for aviation applications and RH is very sensitive for visibility calculations, and needs better than 10% accuracy. At the same time, their study suggested that visibility and microphysical parameters are nonlinearly related to each other and RH and Nd, LWC are most important parameters for fog visibility calculation [5,22]. Xue et al. [24] studied the effects of air pollution and meteorological elements on visibility in Shanghai, China; their results showed that air temperature and wind speed are positively correlated with visibility, while relative humidity is negatively correlated with visibility. Hong [25] studied the relationship between visibility and its influencing factors based on binary correlation and partial correlation methods. The results show that relative humidity and rainfall are negatively correlated with visibility, while temperature and wind speed are positively correlated. As a result, there is a conversion relationship between dew point temperature and relative humidity [26]. This study takes dew point temperature into consideration when inferring visibility. Zhao et al. [27] studied the relationship between pressure and rainfall in East Asia. Kutiel et al. [28] studied the sea level pressure associated with rainfall conditions in Turkey and found that the pressure field is closely related to rainfall. Since sea fog is the most important weather phenomenon affecting atmospheric visibility over the ocean, the influencing factors of sea fog also have an important impact on visibility. Qu et al. [29] performed a statistical analysis of sea fog in Bohai Bay and discussed its formation mechanism. The results showed that under different sea temperature differences, the optimal wind speed for fogging in Bohai Bay was 1.6 m/s–5.4 m/s, and 88% of the fogging samples met the fogging conditions when the sea temperature was higher than the air temperature.
In summary, air temperature (AT), wind speed (WS) and relative humidity (RH) directly affect visibility, while dew point temperature (DPT), sea level pressure (SLP) and the temperature difference between the sea and air (TDSA) indirectly affect atmospheric visibility. In this study, RH, DPT, SST, AT, WS, SLP and TDSA were determined and used as the neural network’s input factors to infer atmospheric visibility. The neural network model for inferring visibility is given in Figure 3.

3.2. Introduction of the Data Used

The data used to train the model and test its accuracy were obtained from the International ICOADS. ICOADS is the largest collection of ocean surface data sets, with original observations from 1784 to the present and data from the ships, buoys and coastal sites of different countries. Because the data set contains observation data from all over the world, its sampling density varies with observation date and location. Since the data set records visibility with the form of visibility level, the final referred visibility in this study is also the visibility level. The rule classifying visibility level in ICOADS is given in Table 1.
Since ICOADS are processed from the original observation data and not every set of recorded data is valid and complete, it is necessary to eliminate incomplete records before using it. The total valid data in each month from 1981 to 2016 are given in Table 2. Since that data from 1981 to 2015 is used to train the model and data in 2016 is used to test the accuracy of the inferred visibility based on the trained model, Table 2 presents the amount of data for these two periods separately.
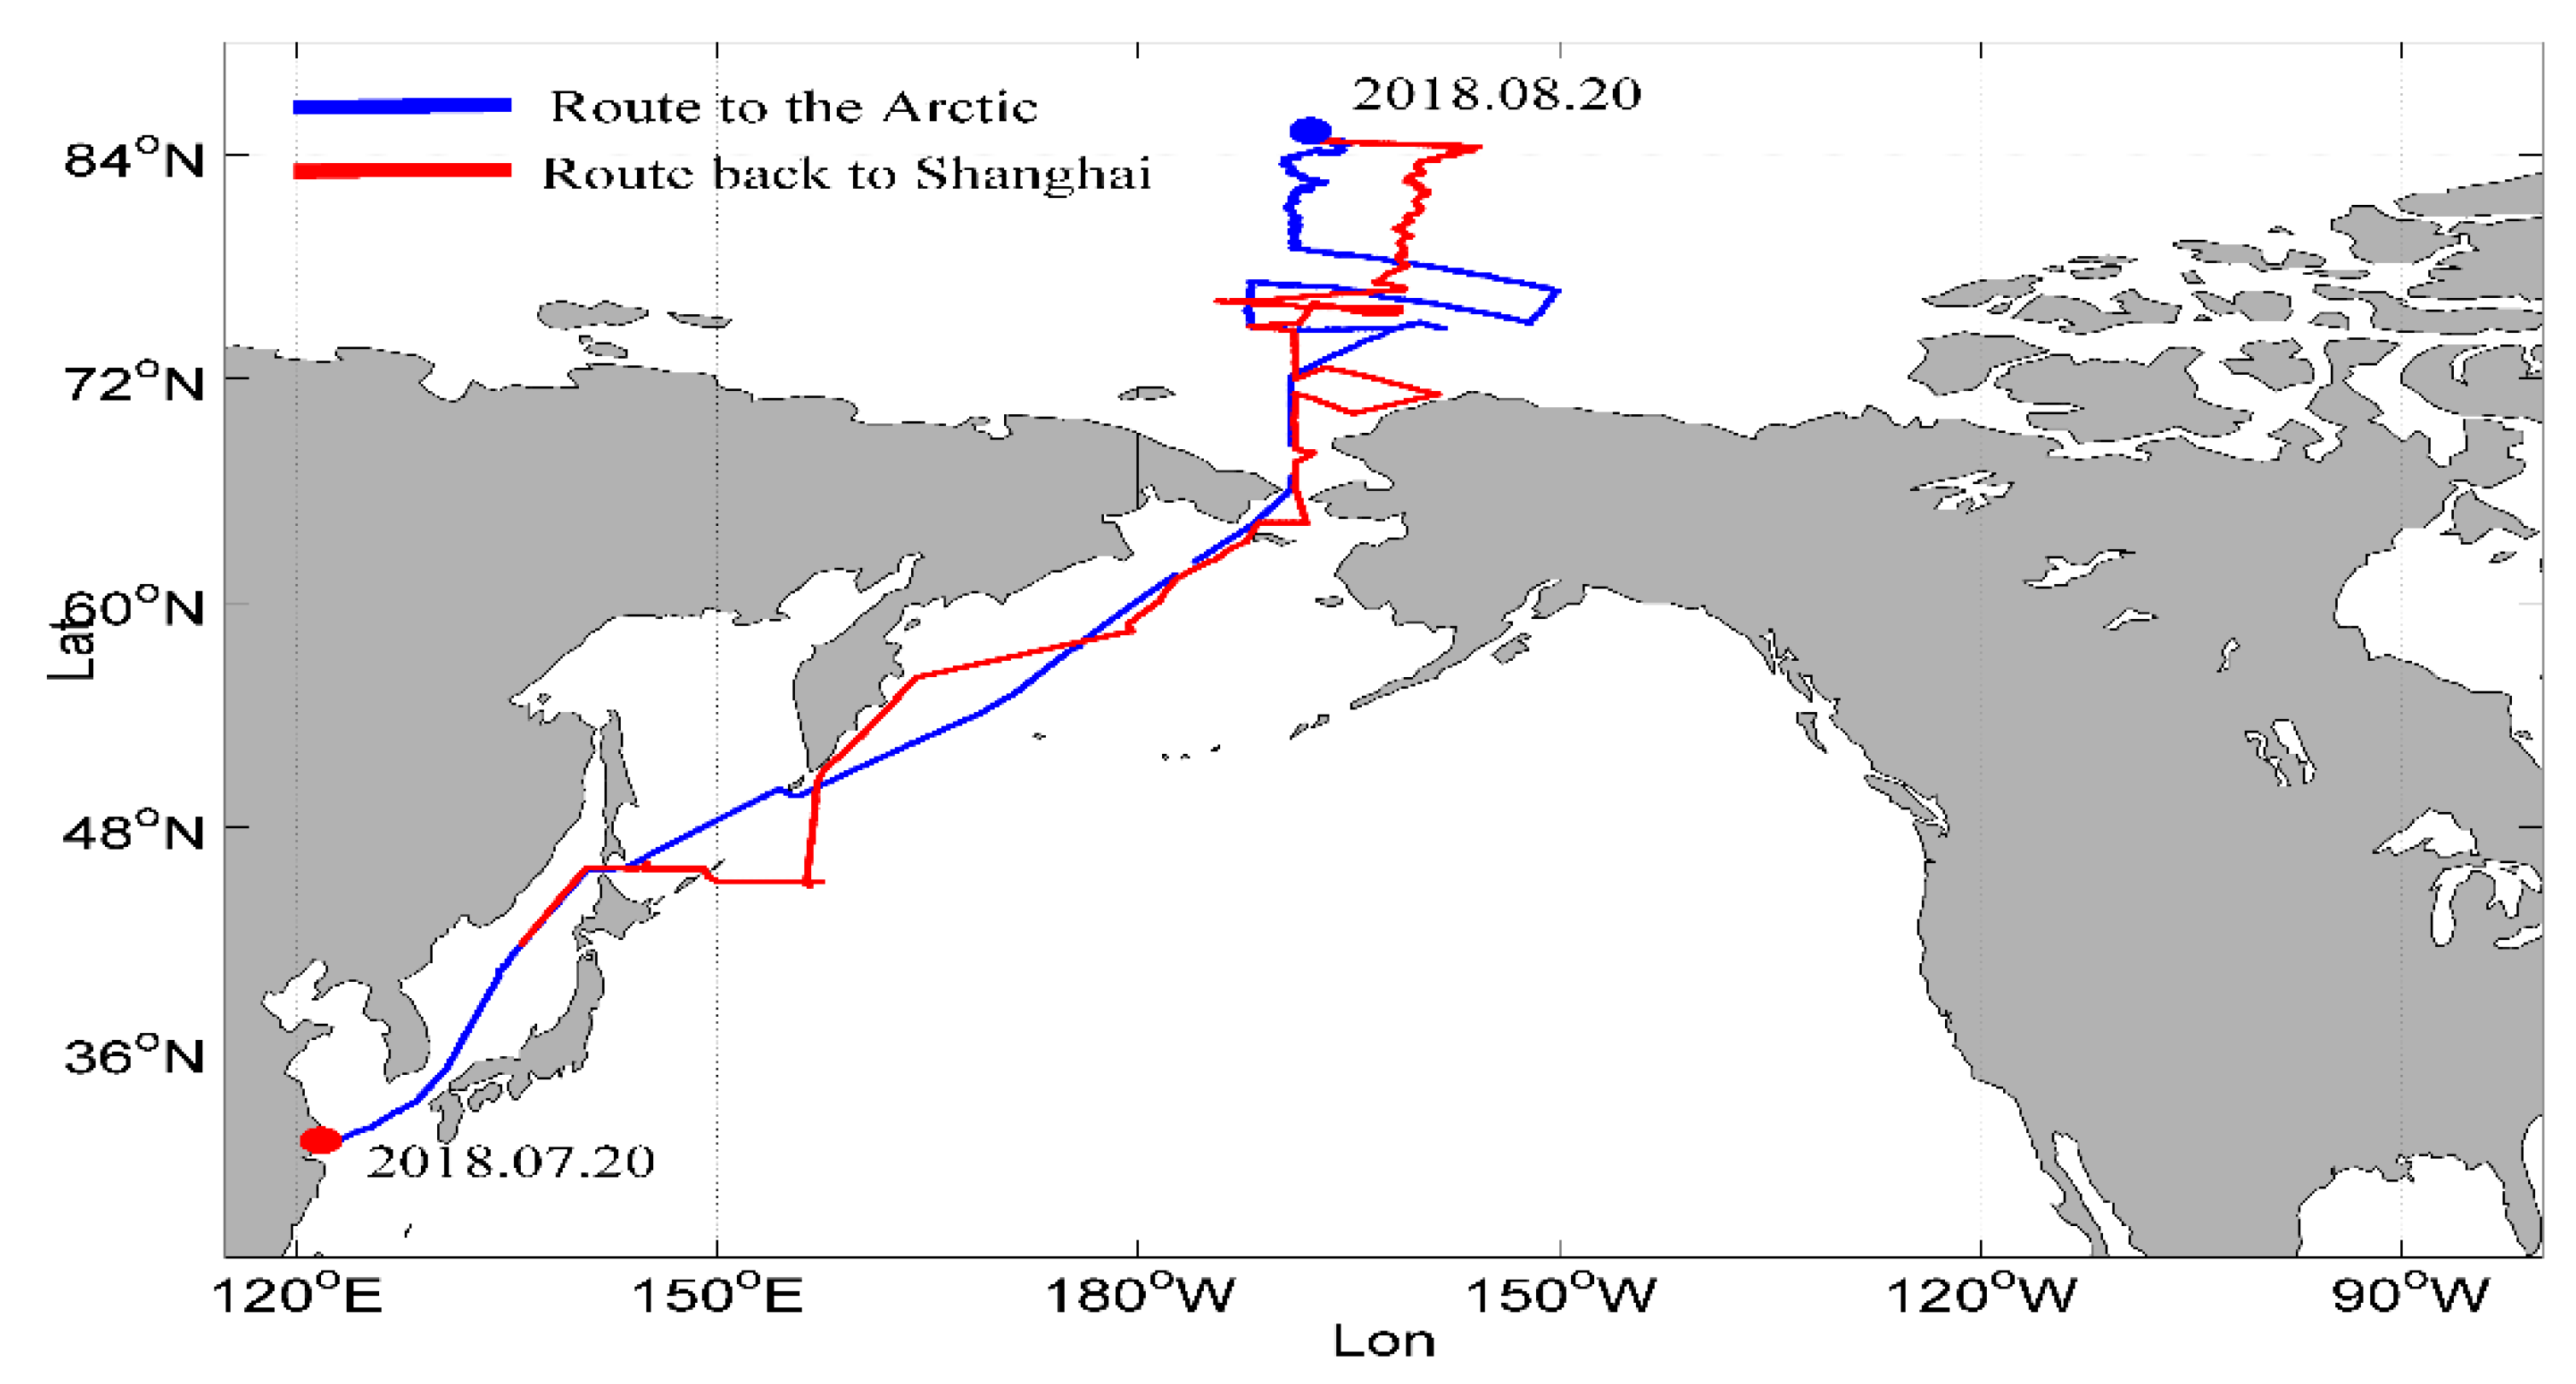
Data used to further test the accuracy of the model is from the Chinese Ninth Arctic Science Examination (CNASE), which began on July 20 and ended on September 26, in 2018. The scientific expedition covered more than 12.5 million nautical miles, including 3815 nautical miles in the ice area. The northernmost location of the expedition is 84.8° N. The navigation trajectory of CNASE is shown in Figure 4. The data recorded in this expedition include meteorological and marine data. The meteorological data include air temperature, relative humidity, dew point temperature, sea-level pressure, wind speed, horizontal visibility, vertical visibility, cloud number and cloud height, etc., which are recorded once a minute. The marine data include water temperature, salinity, fluorescence, colored dissolved organic matter, etc., which are recorded once every 30 seconds.
The data used to infer gridded visibility in the Arctic were obtained from ERA-Interim, which is the gridded data product distributed by the ECMWF. ERA-Interim is a third generation product and its quality is significantly higher than the second generation product, ERA-40. Its data begins in 1979 and is constantly updated. The data set has a variety of temporal and spatial resolution products, of which the minimum temporal resolution is three hours and the maximum time resolution is one month; the minimum spatial resolution is 0.125° × 0.125° and the maximum spatial resolution is 3° × 3°.

4. Analyzing the Error of Referred Visibility

To test whether visibility in the Arctic changes with monthly features or not and find the sample that ensures the most accurate referred results, this study infers visibility in the Arctic in 2016 by using 5-year and 15-year monthly data as training samples, respectively. Because neural networks are not stable when referring visibility, the average of 30 experiments was taken as the last result of each inference.

4.1. Reasoning Test and Error Analysis under Different Sample Conditions

Through training the constructed neural network with the data of each month of a 5-year period, from 2011–2015 and a 15-year period, from 2011–2015, in the Arctic respectively and referring the visibility in each month for 2016, we can get the visibility and relative error referred under different sample conditions. The relative error can be defined as
δ = | V c V r | V r ,
where δ is the relative error, V c is the referred visibility and V r is the measured visibility.
The relative error of the referred results is shown in Table 3 and Table 4, in which the ‘training sample’ column refers to the month of the sample data that was used to train the neural network. The ‘test’ column refers to the month of the result generated by the trained neural network. The ‘average’ column refers to the mean error of visibility in each month inferred from the different sample data.
We can see from Table 3 and Table 4 that whether the sample data set is a 5-year period or a 15-year period, more than 3/4 of the data show a relative error less than 15% or a similar value. This indicates that the accuracy of the referred visibility is very high and that the BP neural network can better fit the relationship between visibility and its influencing factors. Since the gridded visibility data used in the study is mostly from numerical weather forecast (NWP), and the uncertainty in visibility calculations in NWP can reach 29% to 30% because of the uncertainty in visibility parameterization [5,9], the visibility data generated in this paper is relatively more accurate.
We also noticed that relative errors in months 6–9 are quite high when training the model using data of months 2 and 3. Also, relative errors in months 7–9 are always high regardless of which month’s data is used as training data (Table 3, Table 4). Two reasons lead to the result. One reason is the visibility data in months 2–3 are relatively single, which cause the inadequate training of the parameters of the neural network. Another reason is the changes of visibility in months 6–9 in the Arctic are more complex compared with that in other months, especially in July and August. Both of the two reasons lead to the trained parameters of the Neural Network could not infer visibility accurately.
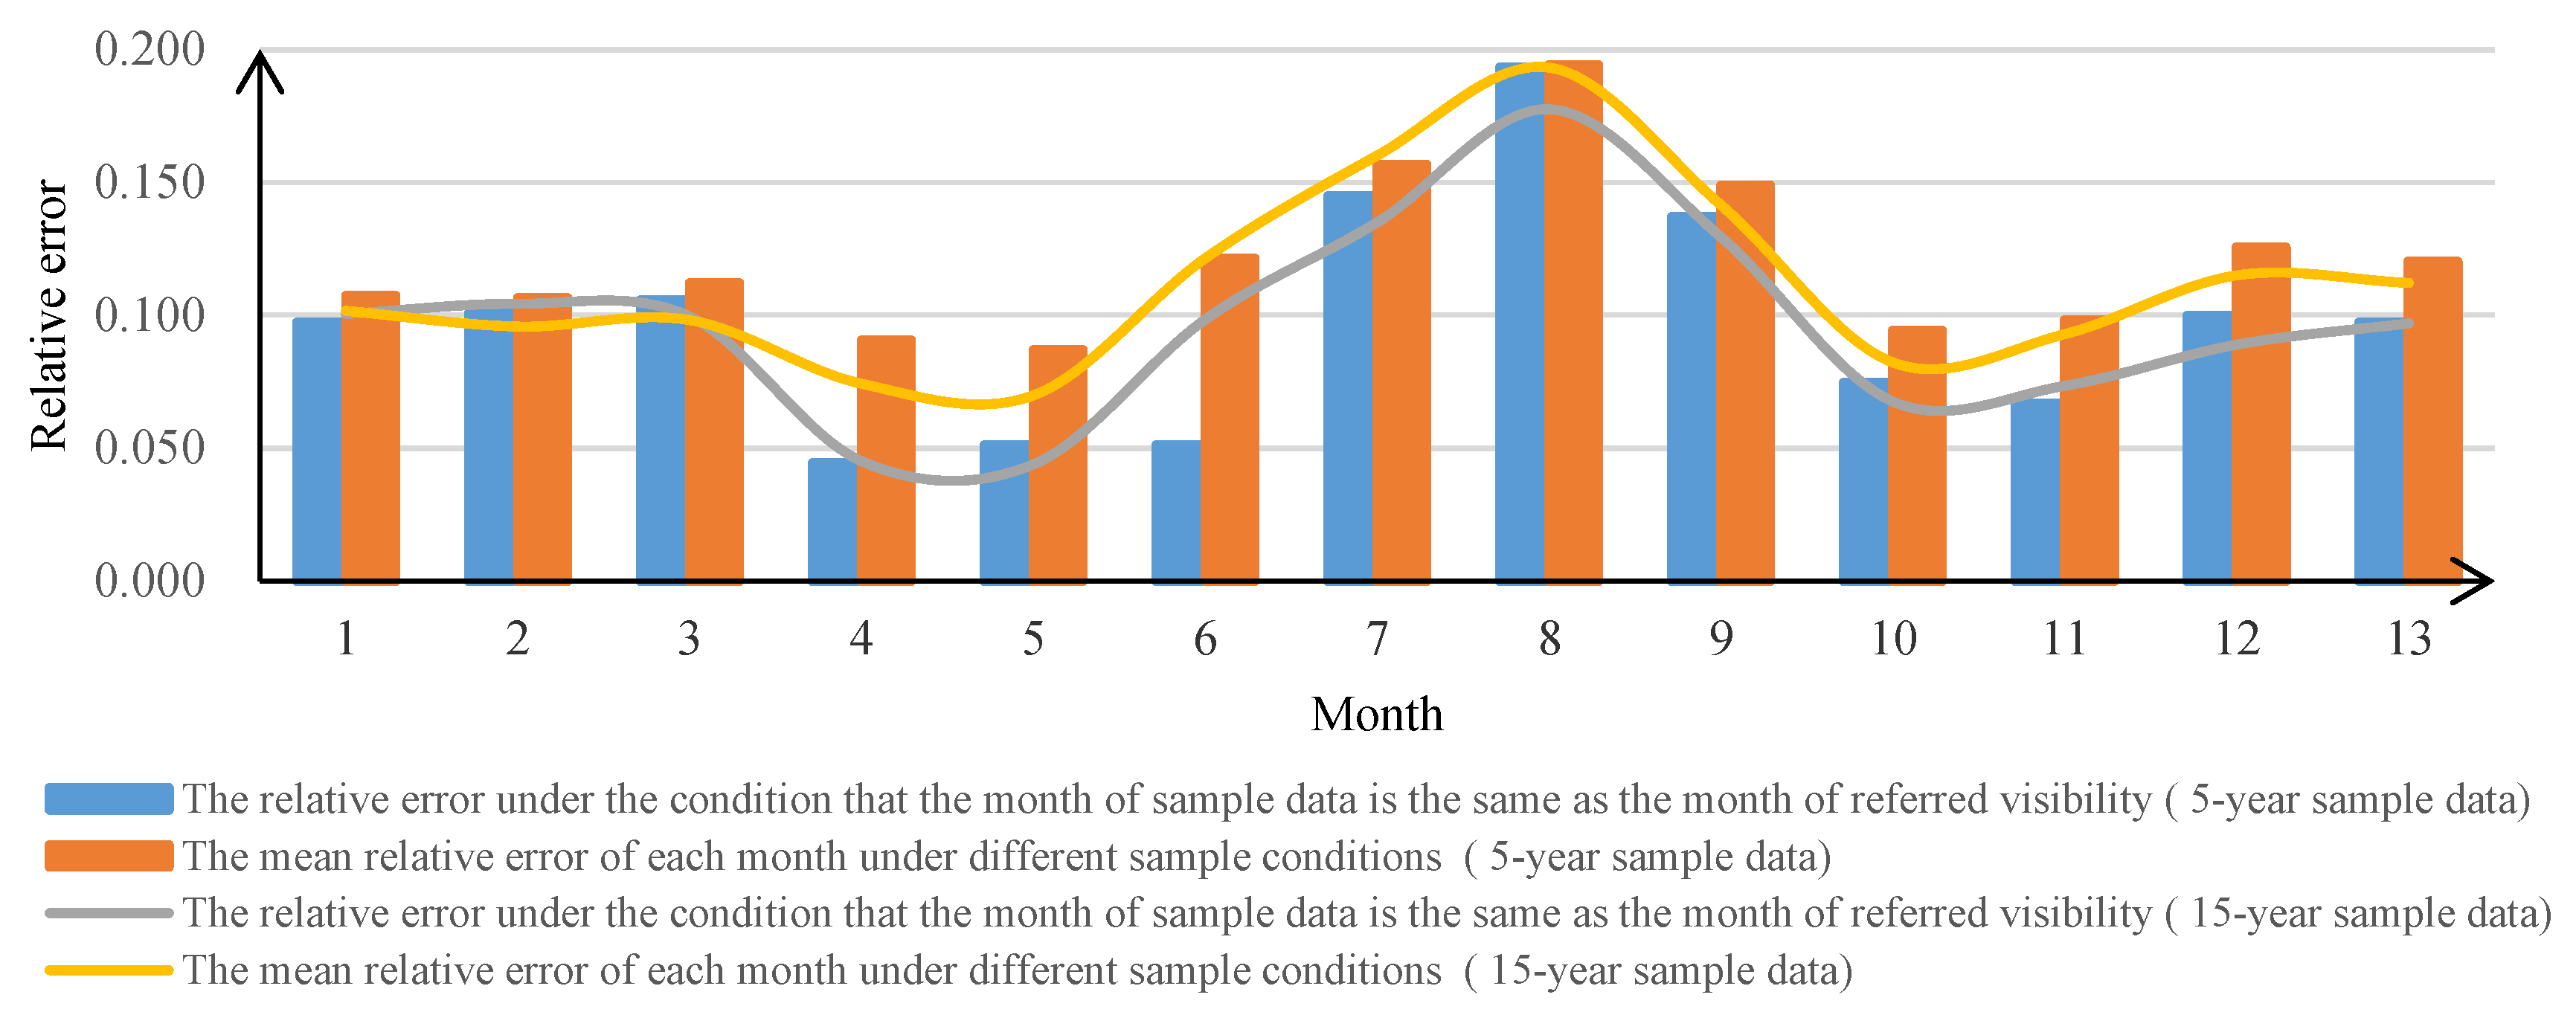
Figure 5 shows the distribution of the relative error of referred visibility in the month where the sample is located and the average relative error under different sample conditions. Month 13 shows the average relative error over 12 months for the two sample forms. The result shows that whether the sample data set is a 5-year period or a 15-year period, the mean relative error of each month under different sample conditions and the relative error under the condition where the month of sample data is the same as the month of referred visibility are always below 20%. At the same time, the relative errors under the condition that the month of sample data is the same as the month of referred visibility are always less than the mean relative error of each month under different sample conditions when the sample data set is a 5-year period. When the sample data set is a 15-year period, the relative errors under the condition that the month of sample data is the same as the month of referred visibility, are still less than the mean relative error of each month under different sample conditions, except for month 2 and month 3. At the same time, whether the sample data are 5-year data or 15-year data, the average of the relative error of the 12 months under the condition where the month of sample data is the same as the month of the referred visibility, is less than that under different sample conditions. Thus, we can conclude that the visibility in the Arctic changes with a monthly feature and that using the multi-year data of one month as a training sample to infer the visibility of the month in which the training sample is located has a higher accuracy.

4.2. Effect of Sample Data Quantity on the Accuracy of Referred Visibility

By calculating the average relative error of the 12 months under the above two sample data conditions, with sample data of 5-year data (2011–2015), 15-year data (2001–2015), 25-year data (1991–2015) and 35-year data (1981–2015) respectively, as shown in Figure 6, we can obtain the multi-year data of one month as a training sample to infer the visibility of the month in which the training sample has higher accuracy than under the other sample size conditions. At the same time, with an increase in training samples, the accuracy of the inferred visibility based on the neural network also increases. However, when the span of the sample time reaches 25 years, the average relative error does not decrease with an increase in training samples.
From the analysis, we can conclude that the neural network can well fit the nonlinear relationship between visibility and its influencing factors, and the average relative error in 12 months under different sample forms ranges from 9% to 12%. At the same time, visibility in the Arctic changes with monthly features and using the multi-year data of one month as a training sample to infer the visibility of the month in which the training sample is located has higher accuracy. When the amount of sample data is small, it is positively correlated with the accuracy of referred results. However, as the sample data increases, its contribution to the accuracy of the referred results decreases.

4.3. Test of the Model Using Data from CNASE

Data used to train the model is from ICOADS, from 2001 to 2015 in the Arctic and data used to test the accuracy of the trained model is one hour average data from CNASE. Since the sample data sets are different when inferring visibility in different months, this paper calculated the relative error in August and September, respectively. The inferred result is shown in Figure 7. The average relative error of all observations in August and September is 18% and 12%, respectively, which indicated that BP Neural Network could well fit the relationship between visibility and its influence factors. However, there are few inferred visibility with large relative error. Two reasons may cause the result, one reason is the inadequate training of neural networks; another reason is the deficiency of the constructed model, such as the selected factors influencing visibility are not incomplete.

5. Analysis of the Visibility Characteristics in the Arctic

Visibility, as one significant factor influencing the navigation risk in the Arctic, is receiving more attention and its temporal and spatial distribution is of great significance for ensuring the safety of ships crossing the Arctic. Considering that the neural network can well fit the nonlinear relationship between visibility and its influencing factors, this study generated the gridded visibility in 2009–2018 in the Arctic based on the reanalysis gridded data from the ERA-Interim and the constructed neural network model trained with 25 years of sample data from ICOADS.

5.1. Temporal Changes of Visibility in the Arctic

Generating the gridded visibility on each day in August and September 2018, yielded a temporal resolution of 6 hours and a spatial resolution of 1° × 1°. By calculating the average of the difference between two adjacent groups of data, we can obtain the average of a 6-hour change in visibility in August and September 2018, in the Arctic (Figure 8). It is evident that, in August, visibility changes slowly in the north of 80° N but quickly in the south and coastal areas, especially in the Kara Sea, Barents Sea and Norwegian Sea, which is consistent with the sailing experience in the Arctic Science Examination [30]. However, visibility changes slowly around the Arctic in September. Thus, people should always prepare for poor visibility when crossing the Arctic in August.
To find the monthly features of visibility in the Arctic, this study calculated the monthly mean visibility of 10 years, 2009–2018, in the gridded locations of the Arctic (Figure 9). We can find that the visibility in the Arctic in July and August is lower than other months around the year, which is due to that advection of warm and humid air from the south to the cold underlying surface in the Arctic region resulting in advection fog [31]. At the same time, the visibility in March and May is higher than in other months. Considering that the sea ice cover in the Arctic is the smallest in August and September and the visibility in August is lower than in other months, September is the best time for ships to navigate the Arctic, which is consistent with the reality.

5.2. Spatial Changes of Visibility in the Arctic

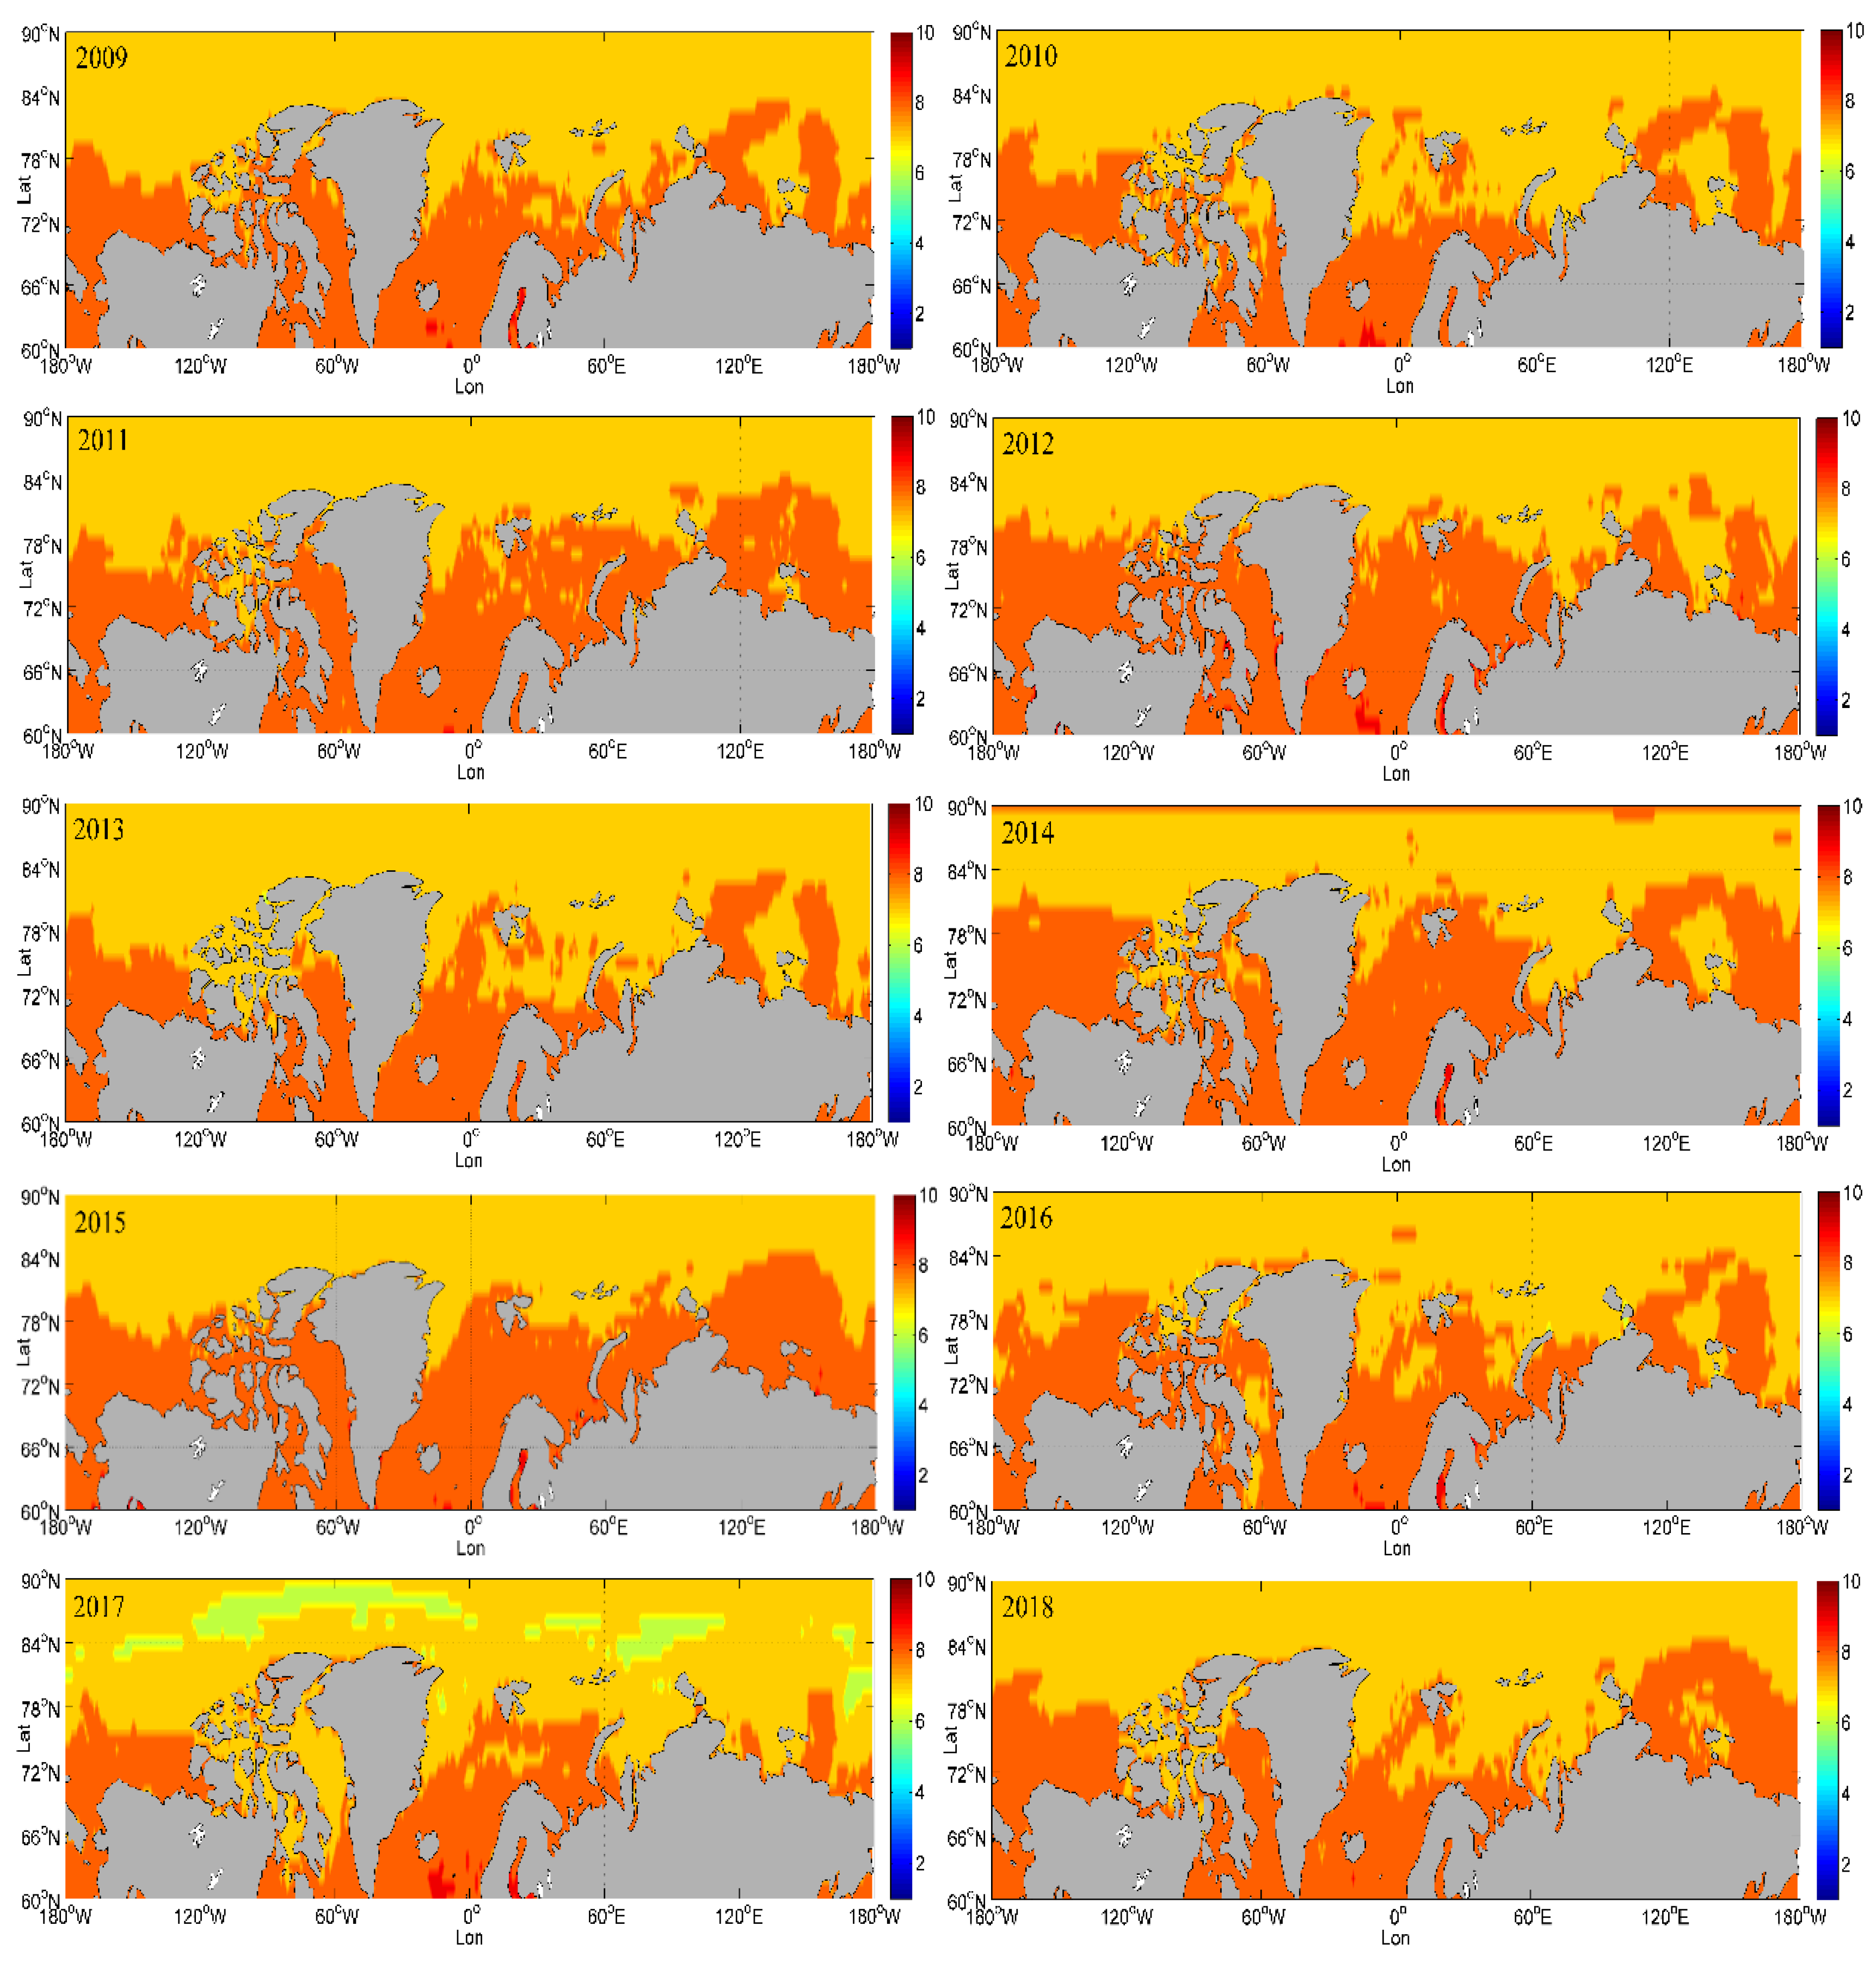
To find the features of the spatial distribution of visibility in the Arctic, this study calculated the yearly mean visibility, from 2009–2018, in the gridded locations of the Arctic (Figure 10). The result showed that the visibility in the south of the 80° N is higher than that in the north, and the distribution has been relatively stable over the past 10 years. The reason for this phenomenon is that advection fog is easier to form in open sea area, especially in summer [32]. Overall, visibility in the Arctic ranges from level 6 to level 8, indicating that visibility is generally good.
Visibility maps produced for single measurements without averaging, is also interesting because we can see the spatial variability of visibility at a certain moment. This paper analyzed the spatial variability of visibility at 00:00 on August 1, 2018 and 00:00 on September 1, 2018 (Figure 11). We can get that visibility could vary widely across the Arctic at the same time point. Visibility distribution at 00:00 on August 1, 2018 in the Arctic is more complex than that at 00:00 on September 1, 2018. At the same time, nearshore visibility is generally better than offshore visibility, and visibility in the Barents Sea and Greenland Sea is relatively lower compared with that in other sea areas.

6. Discussion and Conclusions

Visibility, as one of the most important factors influencing the risk of crossing the Arctic, is receiving an increasing amount of attention [2]. To address the scarcity of visibility data in the Arctic, this paper proposed a model for referring visibility in the Arctic based on a neural network and analyzed its spatial and temporal features. Based on the results, the following conclusions can be drawn:
(1) The neural network can well fit the nonlinear relationship between visibility and its influencing factors. The mean relative error of referred visibility based on the neural network is below 20% and the average of relative error in 12 months under different sample forms ranges from 9% to 12%.
(2) Visibility in the Arctic changes with monthly features and uses the multi-year data of one month as a training sample to infer the visibility of the month in which the training sample located has a higher accuracy. As the number of training samples used increases, the accuracy of the inferred visibility based on the neural network increases. However, when the span of the sample time reaches 25 years, the average relative error does not decrease with an increase in training samples.
(3) In August, visibility changes slowly in the north of 80° N but quickly in the south, especially in the Kara Sea, Barents Sea and Norwegian Sea. However, visibility changes slowly around the Arctic in September. Thus, people should always prepare for poor visibility when crossing the Arctic in August.
(4) Visibility in the Arctic changes based on monthly features. Visibility in the Arctic in July and August is lower than in other months of the year and the visibility in March and May is higher than in other months.
(5) The visibility in the south of 80° N is higher than in the north and the distribution has been relatively stable over the past 10 years. Overall, the yearly average of visibility in the Arctic mostly ranges from level 6 to level 8, indicating that the visibility is generally good.
Although this paper proposed one way to generate historical continuous gridded data of visibility in the Arctic, which has higher accuracy than that based on NWP and PCR [5,9,17], some issues still exist in the study. The visibility data inferred in this paper is the the visibility level, which limits the application of the data. Also, the temporal and spatial distribution features of visibility in the Arctic analyzed in the paper are not detailed enough due to the inferred visibility data displayed with levels.
Overall, the inferred visibility data and the temporal and spatial distribution features of visibility in the Arctic analyzed in the paper are significant for navigation in the Arctic. The next step is to focus on visibility prediction, which still has many issues although many scholars have done many studies on it.

Reference

Author Contributions

Y.S. is the first author of this paper and the experiments and writing are mainly done by him. R.Z. is the corresponding author of the paper and he provided the ideas for writing the paper. M.L. and Y.W. help revise the paper. Q.L. and L.L. help collect data.

Funding

This research received no external funding and the APC was funded by National Natural Science Foundation of China (serial number item: 4197060570).

Acknowledgments

Firstly very thanks Yanguang Xue for providing data from CNASE. Data used to train the model were distributed by the NCDC. Reanalysed gridded data that were used to infer the gridded visibility were obtained from the ECMWF.

Conflicts of Interest

The authors declare no conflicts of interest.

References

  1. Gultepe, I.; Isaac, G.A.; Rasmussen, R.M.; Ungar, K. A Freezing Fog/Drizzle Event during the FRAM-S Project; SAE Technical Paper, No. 2011-38-0028; SAE International in United States: Warrendale, PA, USA, 2011. [Google Scholar]
  2. Gultepe, I.; Sharman, R.; Williams, P.D.; Zhou, B.; Ellrod, G.; Minnis, P.; Trier, S.; Griffin, S.; Yum, S.S.; Gharabaghi, B.; et al. A review of high impact weather for aviation meteorology. Pure Appl. Geophys. 2019, 176, 1869–1921. [Google Scholar] [CrossRef]
  3. Gultepe, I.; Isaac, G.A.; Williams, A.; Marcotte, D.; Strawbridge, K.B. Turbulent heat fluxes over leads and polynyas, and their effects on Arctic clouds during FIRE. ACE: Aircraft observations for April 1998. Atmos. Ocean 2003, 41, 15–34. [Google Scholar] [CrossRef]
  4. Kessner, A.L.; Wang, J.; Levy, R.C.; Colarco, P.R. Remote sensing of surface visibility from space: A look at the United States East Coast. Atmos. Environ. 2013, 81, 136–147. [Google Scholar] [CrossRef] [Green Version]
  5. Gultepe, I.; Müller, M.D.; Boybeyi, Z. A new visibility parameterization for warm-fog applications in numerical weather prediction models. J. Appl. Meteorol. Clim. 2006, 45, 1469–1480. [Google Scholar] [CrossRef]
  6. Gultepe, I.; Milbrandt, J.A.; Zhou, B. Marine Fog: A Review on Microphysics and Visibility Prediction, Marine Fog: Challenges and Advancements in Observations, Modeling Forecasting; Springer: Cham, Switzerland, 2017; pp. 345–394. [Google Scholar]
  7. Zhou, B.; Du, J.; Gultepe, I.; Dimego, G. Forecast of low visibility and fog from NCEP: Current status and efforts. Pure Appl. Geophys. 2012, 169, 895–909. [Google Scholar] [CrossRef]
  8. Gultepe, I.; Pagowski, M.; Reid, J. A satellite-based fog detection scheme using screen air temperature. Weather Forecast 2007, 22, 444–456. [Google Scholar] [CrossRef]
  9. Gultepe, I.; Pearson, G.; Milbrandt, J.A.; Hansen, B.; Platnick, S.; Taylor, P.; Cober, S.G. The fog remote sensing and modeling field project. Bull. Am. Meteorol. Soc. 2009, 90, 341–360. [Google Scholar] [CrossRef]
  10. Koschmieder, H. Therie der horizontalen sichtweite. Beitrage zur Physik der freien Atmosphare 1924, 12, 171–181. [Google Scholar]
  11. Gultepe, I.; Milbrand, J. Microphysical observations and mesoscale model simulation of a warm fog case during FRAM project. J. Pure Appl. Geophys. 2007, 164, 1161–1178. [Google Scholar] [CrossRef]
  12. Beheng, K.D. A parameterization of warm cloud microphysical conversion processes. Atmos. Res. 1994, 33, 193–206. [Google Scholar] [CrossRef]
  13. Claxton, B.M. Using a neural network to benchmark a diagnostic parameterization: The Met Office’s visibility scheme. Q. J. R. Meteorol. Soc. 2008, 134, 1527–1537. [Google Scholar] [CrossRef]
  14. Gultepe, I.; Isaac, G.A. An analysis of cloud droplet number concentration for climate studies: Emphasis on constant Nd. Q. J. R. Meteorol. Soc. 2004, 130, 2377–2390. [Google Scholar] [CrossRef]
  15. Wilkinson, J.M.; Porson, A.N.F.; Bornemann, F.J.; Weeks, M.; Field, P.R.; Lock, A.P. Improved microphysical parameterization of drizzle and fog for operational forecasting using the Met Office Unified Model. Q. J. R. Meteorol. Soc. 2013, 139, 488–500. [Google Scholar] [CrossRef]
  16. Gultepe, I.; Isaac, G.A. Scale effects on averaging of cloud droplet and aerosol number concentrations: Observations and models. J. Clim. 1999, 12, 1268–1279. [Google Scholar] [CrossRef]
  17. Fei, H.; Hong, W.; Junping, Q.; Guofu, W. Retrieval of atmospheric horizontal visibility by statistical regression from NOAA/AVHRR satellite data. J. Ocean Univ. China 2006, 5, 207–212. [Google Scholar] [CrossRef]
  18. Hadjimitsis, D.G.; Clayton, C.; Toulios, L. Retrieving visibility values using satellite remote sensing data. Phys. Chem. Earth 2010, 35, 121–124. [Google Scholar] [CrossRef]
  19. Huang, Q.; Hanesiak, J.; Savelyev, S.; Papakyriakou, T.; Taylor, P.A. Visibility during blowing snow events over arctic sea ice. Weather Forecast 2008, 23, 741–751. [Google Scholar] [CrossRef]
  20. Eldridge, R.G. The relationship between visibility and liquid water content in fog. J. Atmos. Sci. 1971, 28, 1183–1186. [Google Scholar] [CrossRef]
  21. Jiwei, Z.; Suping, Z.; Xiaojing, W.; Yingchen, L.; Jingwu, L. The Research on Yellow Sea Sea Fog Based on MODIS Data: Sea Fog Properties Retrieval and Spatial-Tempo-ral Distribution. J. Ocean Univ. China 2009, 39, 311–318. [Google Scholar]
  22. Gultepe, I.; Zhou, B.; Milbrandt, J.; Bott, A.; Li, Y.; Heymsfield, A.J.; Ferrier, B.; Ware, R.; Pavolonis, M.; Kuhn, T. A review on ice fog measurements and modelling. Atmos. Res. 2014, 151, 2–19. [Google Scholar] [CrossRef]
  23. McClelland, J.L.; Rumelhart, D.E. PDP Research Group. Parallel distributed processing. Psychol. Biol. Models 1986, 2, 216–271. [Google Scholar]
  24. Xue, D.; Li, C.; Liu, Q. Visibility characteristics and the impacts of air pollutants and meteorological conditions over Shanghai, China. Environ. Monit. Assess. 2015, 187, 363. [Google Scholar] [CrossRef] [PubMed]
  25. Quan, H. The Trend of Visibility and Its Affecting Factors in Chongqing. J. Chongqing Univ. 2003, 5, 151–154. [Google Scholar]
  26. Lawrence, M.G. The relationship between relative humidity and the dewpoint temperature in moist air: A simple conversion and applications. Bull. Am. Meteorol. Soc. 2005, 86, 225–234. [Google Scholar] [CrossRef]
  27. Zhao, P.; Zhu, Y.; Zhang, Q. A summer weather index in the East Asian pressure field and associated atmospheric circulation and rainfall. Int. J. Climatol. 2012, 32, 375–386. [Google Scholar] [CrossRef]
  28. Kutiel, H.; Hirsch-Eshkol, T.R.; Türkeş, M. Sea level pressure patterns associated with dry or wet monthly rainfall conditions in Turkey. Theor. Appl. Climatol. 2001, 69, 39–67. [Google Scholar] [CrossRef]
  29. Ping, Q.; Yiyang, X.; Lili, L.; Yi, L.; Naiguang, H. Character Analysis of Sea Fog in Bohai Bay from 1988 to 2010. Plat. Meteorol. 2014, 33, 285–293. [Google Scholar]
  30. Weibing, W. Navigation Experience of Northeast Arctic Channel. Mar. Technol. 2016, 4, 7–9. [Google Scholar]
  31. Guoqiang, X. Research on the Navigation Environment and Safety Navigation of the Arctic Northeast Route. Master’s Thesis, Dalian Maritime University, Dalian, China, 2014. [Google Scholar]
  32. Li, Y. The Research on the Navigation Environment of Arctic Passage. Master’s Thesis, Dalian Maritime University, Dalian, China, 2011. [Google Scholar]
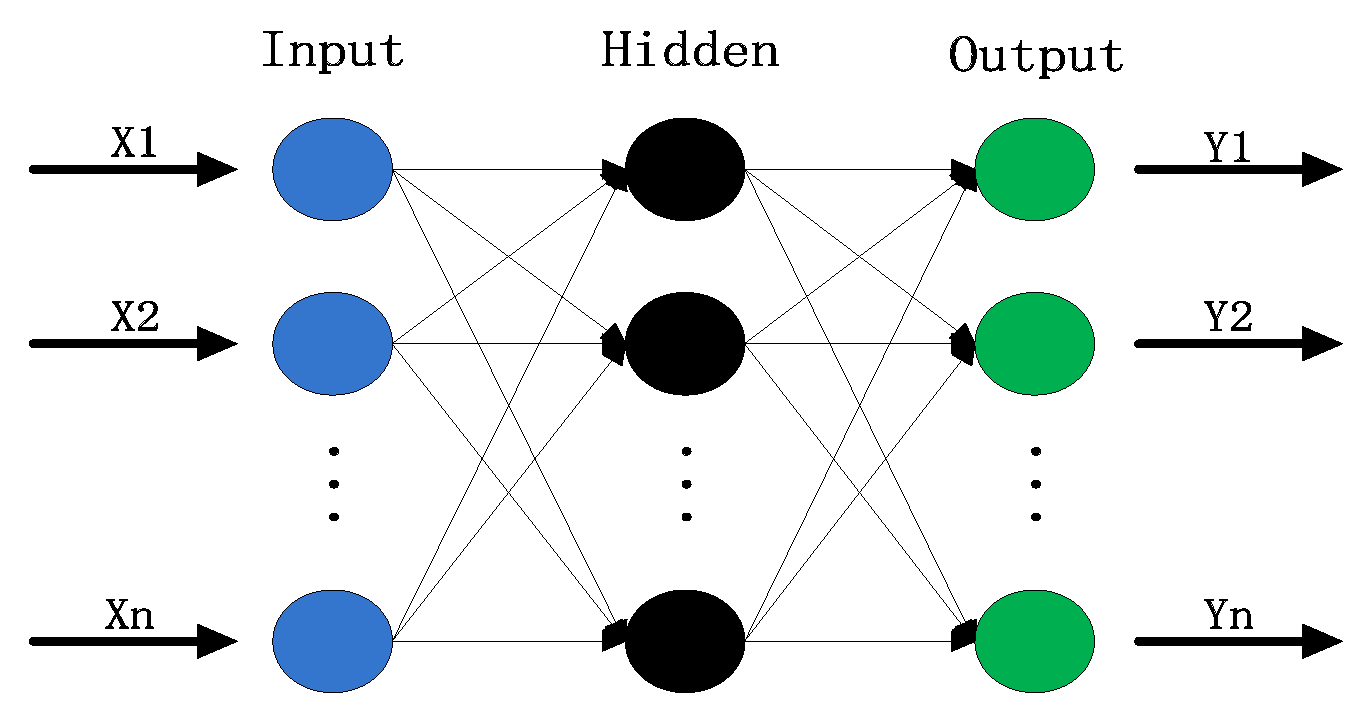
Figure 1. Topological structure of the BP network which includes only one layer of the hidden layer.
Atmosphere 10 00314 g001
Figure 2. Technical flowchart.
Atmosphere 10 00314 g002
Figure 3. Artificial neural network model for inferring visibility.
Atmosphere 10 00314 g003
Figure 4. The navigation trajectory of the Chinese ninth Arctic science expedition.
Atmosphere 10 00314 g004
Figure 5. Comparison between the mean relative error of each month under different sample conditions and the relative error under the condition that the month of sample data is the same as the month of referred visibility.
Atmosphere 10 00314 g005
Figure 6. Average relative error of the 12 months under the above two sample data conditions, with sample data of 5-year data, 15-year data, 25-year data and 35-year data respectively.
Atmosphere 10 00314 g006
Figure 7. The relative error of referred visibility compared to the data from Chinese ninth Arctic science expedition.
Atmosphere 10 00314 g007
Figure 8. The average of 6-hour changes in visibility in August and September 2018, in the Arctic.
Atmosphere 10 00314 g008
Figure 9. Monthly mean visibility of 10 years, 2009–2018, in the gridded locations of the Arctic.
Atmosphere 10 00314 g009
Figure 10. Yearly mean visibility in the Arctic from 2009–2018.
Atmosphere 10 00314 g010
Figure 11. The spatial variability of visibility at 00:00 on August 1, 2018 and 00:00 on September 1, 2018.
Atmosphere 10 00314 g011
Table 1. Rule for classifying the visibility level.
Visibility Level12345678910
Visibility Value (km)<=0.050.05~0.20.2~0.50.5~11~22~44~1010~2020~50>=50
Table 2. Amount of ICOADS data, including atmosphere visibility, SLP, AT, RH, SST and WS for each month, from 1981–2016 in the Arctic (180° W–180° E, 60° N–90° N).
Month123456789101112
Amount
(1981–2015)
144571447617947196022139026887346763282630249223521758515920
Amount
(2016)
93596197491611171248132915131395117910571092
Table 3. The relative error of referred visibility under different sample conditions with sample data from 2011 to 2015.
DataTest
123456789101112
Training
Sample
10.0970.1080.1270.1370.1430.1820.2060.2180.1670.0940.0860.095
20.0930.1010.1160.1110.0950.1250.1570.1950.1540.0860.0830.092
30.1280.1200.1060.0750.0960.1510.1930.2170.1760.0970.1030.118
40.0780.0700.0750.0440.0650.1270.1740.2100.1600.0820.0720.099
50.0860.0780.0860.0600.0510.0990.1420.1830.1340.0680.0750.097
60.1310.1280.1440.0540.0450.0930.1240.1640.1380.1440.1610.219
70.1630.1570.1440.1060.0880.1110.1450.1900.1550.1530.1670.202
80.1140.1060.1040.0770.0690.1160.1430.1930.1440.0940.1110.133
90.0820.0780.0880.0830.0860.1260.1480.1820.1370.0700.0770.096
100.1260.1280.1240.1270.1100.1150.1380.1800.1330.0750.1020.158
110.1010.1030.1090.1030.1010.1240.1590.2000.1410.0780.0670.099
120.0890.1000.1220.1080.0950.1280.1520.1970.1460.0880.0740.100
Average0.1070.1060.1120.0900.0870.1250.1570.1940.1490.0940.0980.126
Table 4. Relative error of referred visibility under different sample conditions with sample data from 2001 to 2015.
DataTest
123456789101112
Training
Sample
10.1010.0990.1130.1060.0890.1270.1580.1910.1380.0810.0880.088
20.1110.1040.1080.1110.1490.2350.2980.2890.1940.0940.0900.094
30.1200.1100.1000.0750.0850.1560.2040.2190.1540.0920.1110.117
40.0790.0720.0720.0450.0510.1030.1460.1840.1300.0690.0700.099
50.0860.0780.0780.0500.0440.0970.1340.1690.1310.0630.0710.108
60.1230.1160.1170.0610.0430.0990.1400.1800.1390.1010.1250.142
70.1360.1300.1190.0790.0550.0970.1350.1850.1510.1180.1420.181
80.0960.0930.0850.0670.0550.0980.1340.1780.1350.0780.1000.148
90.0910.0850.0900.0710.0590.1050.1360.1730.1290.0680.0870.109
100.0960.0920.1030.0820.0680.1070.1480.1800.1250.0680.0870.113
110.0920.0840.0960.0740.0730.1170.1460.1870.1350.0780.0740.093
120.0890.0850.0980.0700.0670.1170.1430.1850.1370.0780.0710.089
Average0.1020.0960.0980.0740.0700.1220.1600.1930.1410.0820.0930.115