1. Introduction
The extensive distribution of cloud macro-physical properties has an important effect on the cloud radiative effect associated with the atmospheric radiation transfer process, and on the cloud precipitation associated with the water cycle process. The cloud amount, cloud height (base and top), and the occurrence time determine the cloud radiative effect [
1,
2,
3]. During daytime, the cloud type and cloud height determine the cool or warm effect of a cloud to the surface [
4]. At night, almost all types of clouds have a warming effect. However, our knowledge of cloud processes, which is one of the largest uncertainties in cloud parameterization for simulating models in atmospheric circulation and climate change [
5,
6], is inadequate. A long-term observation of the cloud is essential. Satellite observations provide an opportunity to assess cloud processes from a global perspective [
7,
8,
9]. Cloud profiling radar on-board the CloudSat satellite combined with cloud-aerosol lidar on-board the CALIPSO satellite can scan the cloud from space and produce cloud products with complementary advantages of laser and microwave measurement for the cloud vertical structure [
10,
11,
12]. Cloud vertical structure is relevant to the cloud micro-physical properties as well [
13]. Cloud base height is one of the fundamental cloud variables of cloud vertical structure [
14].
Except for detection in space, ground-based detections by using lidar have made a sizeable effort and contribution to monitoring the macro-physical properties of clouds, based on lidar networks [
14,
15]. Several researchers have studied the remote sensing of cloud vertical structure using CloudSat, CALIPSO, and ground-based observation together. Kim et al. reported that the cloud base height derived from the Cloud Profiling Radar (CPR) and ground-based lidar are generally in good agreement with each other (coefficient of determination in linear relationship, ~0.996) [
16]. A good agreement in cloud top height and cloud base height with cirrus cloud optical depth between ground-based lidar and space-borne Cloud-Aerosol Lidar with Orthogonal Polarization (CALIOP ) was found in Seoul, Korea [
17]. Blanchard et al. [
18] reported that cloud fraction occurrences from ground-based instruments correlated well with both CALIPSO operational products and combined CALIPSO-CloudSat retrievals, with a hit rate of 85%, and misdetections were mainly attributed to sensitivity loss and distance between the satellite track and the station. Comparisons of cloud base height detected by ceilometers and CALIPSO were also carried out in the southern Appalachian mountains [
19].
With regard to the accurate estimation of variations in local cloud and the parameterization of local cloud models, observation samples of satellites are comparatively sparse. It is necessary to compare the cloud base height measured by the satellite with the ground-based detection. Thus, we collect the 2B-CLDCLASS-LIDAR product data and ground-based lidar data measured over Jinhua site or Hefei site to investigate the distribution of cloud base height over Eastern China.
Section 2 describes the 2B-CLDCLASS-LIDAR product and the method used to determine the cloud base height from lidar data. In
Section 3, the relationship between cloud base height and cloud type is investigated. The comparisons of vertical cloud base height distribution measured by 2B-CLDCLASS-LIDAR with ground-based lidar observations are given in
Section 3. Finally, a summary and conclusions are presented in
Section 4.
2. Experiments and Methods
The cloud measurement products CloudSat and CALIPSO were collected for study. The level 2 cloud scenario classification product 2B-CLDCLASS-LIDAR [
8], which combines CPR and CALIOP from CloudSat and CALIPSO, provided the information on cloud type, cloud base height, and cloud precipitation (the product is available from the website
http://www.cloudsat.cira.colostate.edu/data-products/level-2b/2b-cldclass-lidar). Four-year 2B-CLDCLASS-LIDARdata from 2007 to 2010 was used in this paper. The parameter “PrecipitationFlag” of 2B-CLDCLASS-LIDAR can be used to classify the precipitation situations of cloud layers. The number “0” for “PrecipitationFlag” represents a cloud with no precipitation. Numbers “1, 2, 3” for “PrecipitationFlag” mark the cloud layers with liquid precipitation, solid precipitation, and possible drizzle, respectively, which are regarded as precipitation cloud layers. The cloud types in 2B-CLDCLASS-LIDAR are identified as stratus (St), stratocumulus (Sc), cumulus (Cu, including cumulus congestus), nimbostratus (Ns), altocumulus (Ac), altostratus (As), deep convective (cumulonimbus), or high (cirrus and cirrostratus) cloud based on the “CloudLayerType” parameter. The “CloudLayerBase” stores the cloud base height information of a detected cloud layer. The research region, Eastern China, is limited from 25.0° N to 35.0° N and 110.0° E to 122.5° E, which mostly consists of land regions (see
Figure 1). We divided this area into grid boxes of 1.0° × 1.0° in latitude and longitude.
In the defined region, two lidar observation sites (see
Figure 1) had been set up to measure the vertical structure of macro- and micro-physical properties of aerosols and clouds. The National Institute for Environmental Studies (NIES) lidar in the Hefei site had thirty months of observation data from January 2012 to October 2014 [
20,
21]. This lidar had three channels at wavelengths of 532 nm and 1064 nm and depolarization at 532 nm. The vertical resolution was 7.5 m and time resolution was 15 min, with a signal accumulation of 3000 shots in 5 minutes. The operated lidar in Jinhua site was the Dual-wavelength Mie Polarization Raman Lidar (DMPRL) system [
22], emitting laser pulses at 532 nm and 1064 nm, with a repetition rate of 20 Hz. The elastic scattered signals, including depolarization at 532 nm and Raman scattered signal at 607 nm, can be received simultaneously. The vertical resolution was 7.5 m and time resolution was 30 s. The DMPRL was used for detection during June 2013 to July 2014 in Jinhua area.
There are many methods to determine the cloud base height from lidar signals such as the differential zero-crossing method [
23], threshold method [
23,
24,
25], multiscale detection algorithm [
26], semidiscretization processing technique [
27], and so on [
12,
28]. One of the tough problems of cloud layer determination from lidar signal profiles is the treatment of noise. All the above methods more or less eliminate noise in different ways. In this study, every tiny feature is distinguished using a differential zero-crossing method, as before [
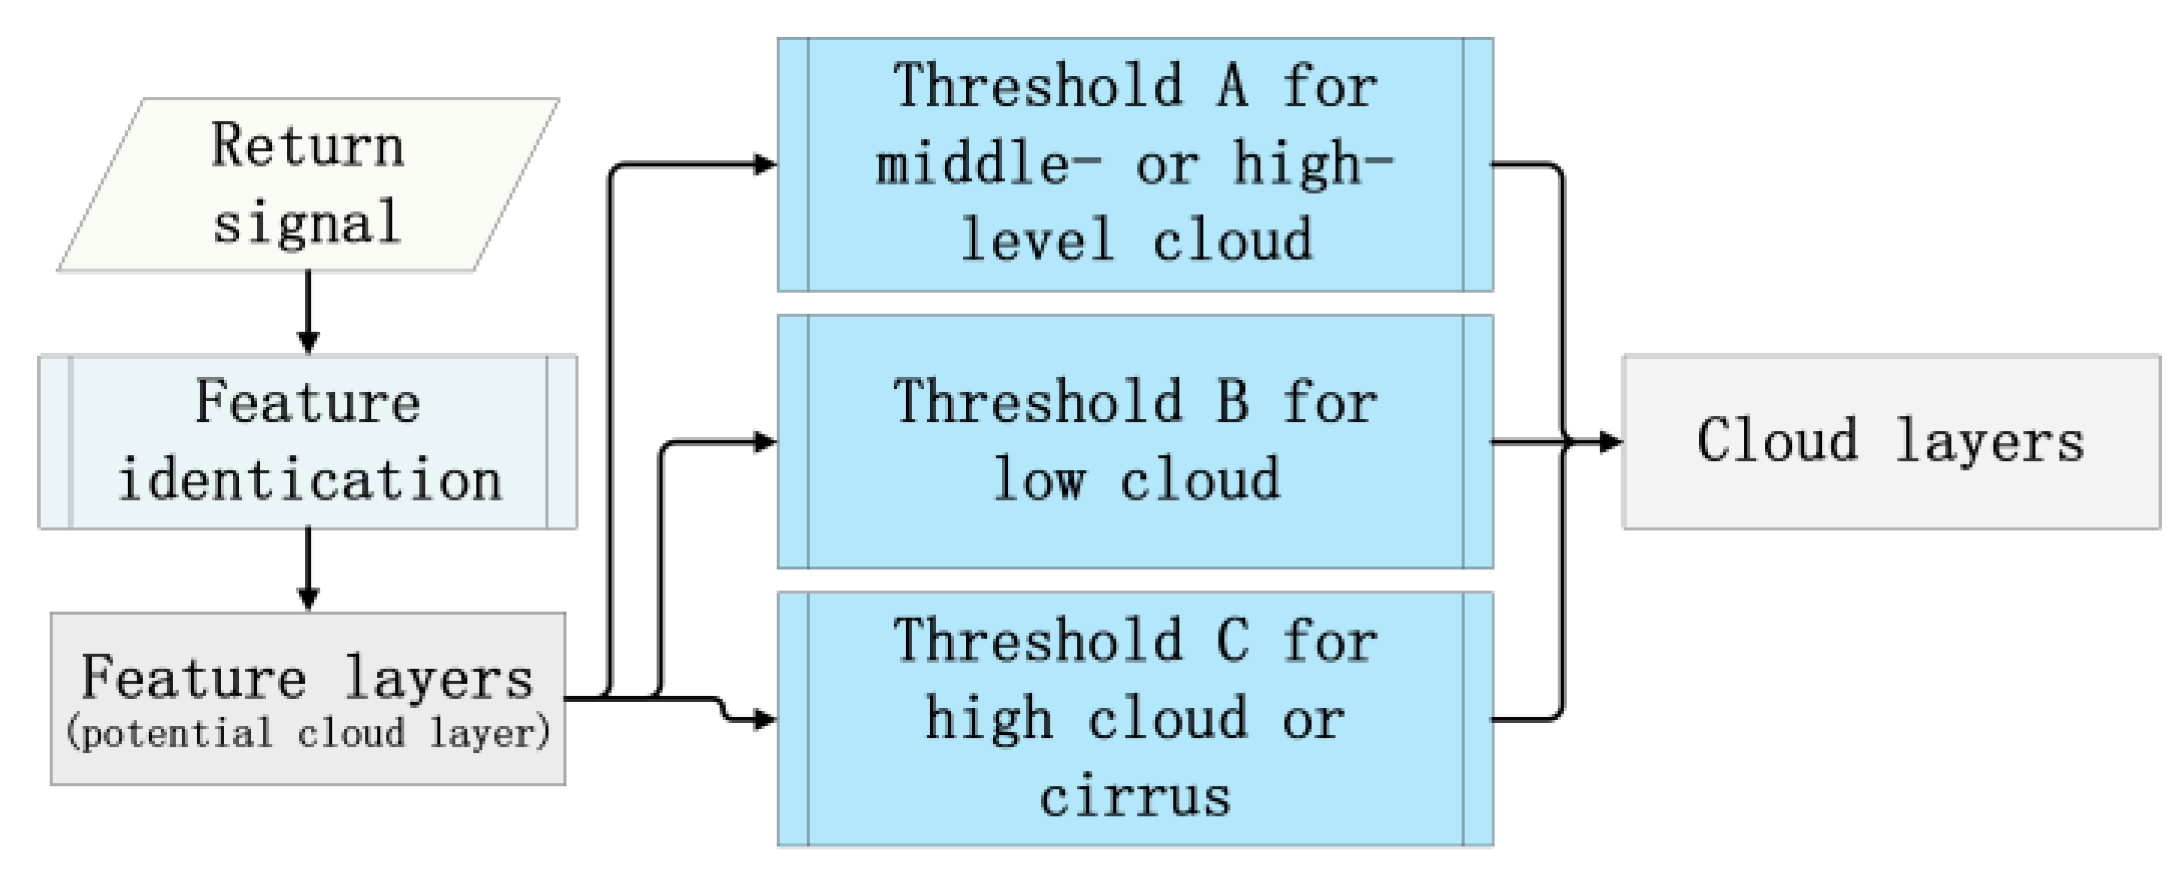
29]. Then, the feature layers can be identified as cloud layers or aerosol layers. Furthermore, the volume depolarization ratio (VDR) profiles at 532 nm are used in some scenes to improve the accuracy of identified cloud results. The detailed algorithm flow is shown in
Figure 2. What needs to be mentioned is that we set three thresholds for clouds in different situations. In terms of general cloud (middle-level cloud), it has the apparent differentia of the value of feature peak return signal (RS) minus feature base RS, compared to the aerosol layer. For lower clouds, they always have an obvious attenuation to lidar signal, and their effective cloud top height, which is lower than the real cloud top height, can be measured due to the fact that the laser goes through the cloud and decreases to the background signal level. For thin cloud appearing at high altitude, it is hard to be discriminated from the aerosol layer due to the weak return signal, however, the VDR has a great advantage in this task [
30].
Figure 3 illustrates the process of cloud layer detection. The initial search height is 150 m, which is the top height of the blind area. The threshold value of an averaged cloud layer VDR is 0.1 for high cloud or cirrus cloud.
The cloud occurrence frequency (Fcloud) is derived from the ratio of the number of cloud occurrences Ncloud per grid box over the number of observations Nprofiles in that grid box: Fcloud = Ncloud / Nprofiles. It can be used to derive the occurrence frequency FX of a given cloud type X. The occurrence frequency of cloud base height is derived by the same method for each grid box: FCBH = Nbin / Ntotal. The Nbin and Ntotal represent the number of cloud base of eight types in each bin, divided from vertical space (0–20 km) at a step of 0.5 km, and the total number in all bins, respectively. This method is applied for every season to derive a seasonally averaged frequency in every grid box.
In our study, if multi-layer cloud appeared, we only considered the first cloud layer. This is because, on the one hand, the lidar signal suffers from extinction, preventing it from detecting any other upper cloud layers. On the other hand, the combined CALIPSO and CloudSat cloud product (2B-CLDCLASS-LIDAR) can describe multi-layer cloud depending on CPR, due to its advantage of cloud penetration capability. The satellite observation time over the defined region was limited (always midnight and noon at local standard time), hence, the cloud fraction measured by the satellite or ground-based observation was unmatched. Therefore, to reduce this influence, the ground-based observation time was limited during 13:00–15:00 and 1:00–3:00 at local standard time (LST). The year timeframe difference and its influence among the three observation databases is illustrated in
Section 3.
3. Results
The geographical distributions of normal profile number and cloud fraction derived over 2007–2010 are shown in
Figure 4. The normal profile number is defined as the ratio of the amount of profiles in a single 1.0° × 1.0° grid box to the maximal amount of all grid boxes in the defined region. The maximal amount of profiles is 15237. In
Figure 4a, it clearly shows that the seasonal variation can be derived based on about 2000–3000 profiles in each grid box.
Figure 4b shows the heterogeneity in geographical distribution. The grid containing Jinhua site has a larger cloud fraction than that of the grid containing Hefei site.
It is well known that the cloud base height of non-precipitation cloud has an extensive distribution in the vertical direction. In contrast, precipitation cloud has a lower height especially for convective precipitation cloud.
Figure 5 shows the occurrence frequency of cloudless, non-precipitation cloud or precipitation cloud (
Figure 5a) and the occurrence frequency of eight cloud types of non-precipitation cloud or precipitation cloud (
Figure 5b) over the defined region. In
Figure 5a, it is obvious that non-precipitation cloud dominates the cloud fraction. The cloudless occurrence frequencies of ground-based lidars over Hefei site (which is very close to the result in a previous study [
21]) and Jinhua site are higher than that of 2B-CLDCLASS-LIDAR over the defined region. However, the grid box containing Hefei site has a better agreement with the ground-based lidar measurement than the equivalent comparison for Jinhua. The difference in Jinhua site is because the grid box area is larger than a single-point and because of the variability in year-average cloud fraction among the different year timeframes. In
Figure 5b, for precipitation cloud, the occurrence frequency of cumulus, nimbostratus, and deep convection cloud, collectively, is higher than 17%. As for non-precipitation cloud, the occurrence frequency of cirrus, altocumulus, and stratocumulus cloud, collectively, is higher than 18%. That is to say, the contributions to cloud base height of cirrus, altocumulus, and stratocumulus clouds of non-precipitation cloud cannot be ignored in the cloud base distribution.
3.1. Cloud Base Height and Cloud Type
Over the defined region, the cloud base height parameter of the 2B-CLDCLASS-LIDAR product can be used to investigate the relationships between cloud base height and cloud type.
Figure 6 shows the occurrence frequencies of cloud base height for eight cloud types. For non-precipitation cloud in
Figure 6a, the occurrence frequency of cloud base height can be divided into three types, including high type, middle type, and low type. The cirrus cloud can be regarded as the high type, with the range of cloud base height from 5.5 to 17 km. The middle type consists of altostratus cloud and altocumulus cloud, with the cloud base height ranging from 0.5 to 8.5 km. The other cloud types with cloud base heights below 3.5 km are regarded as low cloud. As for the precipitation cloud in
Figure 6b, with the peak in occurrence frequency at 1 to 1.5 km, the cloud base heights for all of the eight cloud types are below 3 km.
3.2. Comparison of Cloud Base Height Distribution between Two Ground-Based Observation Sites
The retrieval method of cloud base heights from lidar data is described in
Section 2. Unfortunately, the observation time of the lidar data is later than the 2B-CLDCLASS-LIDAR product data. Therefore, we attempt to counterbalance the influence of the timeframe problem in this study.
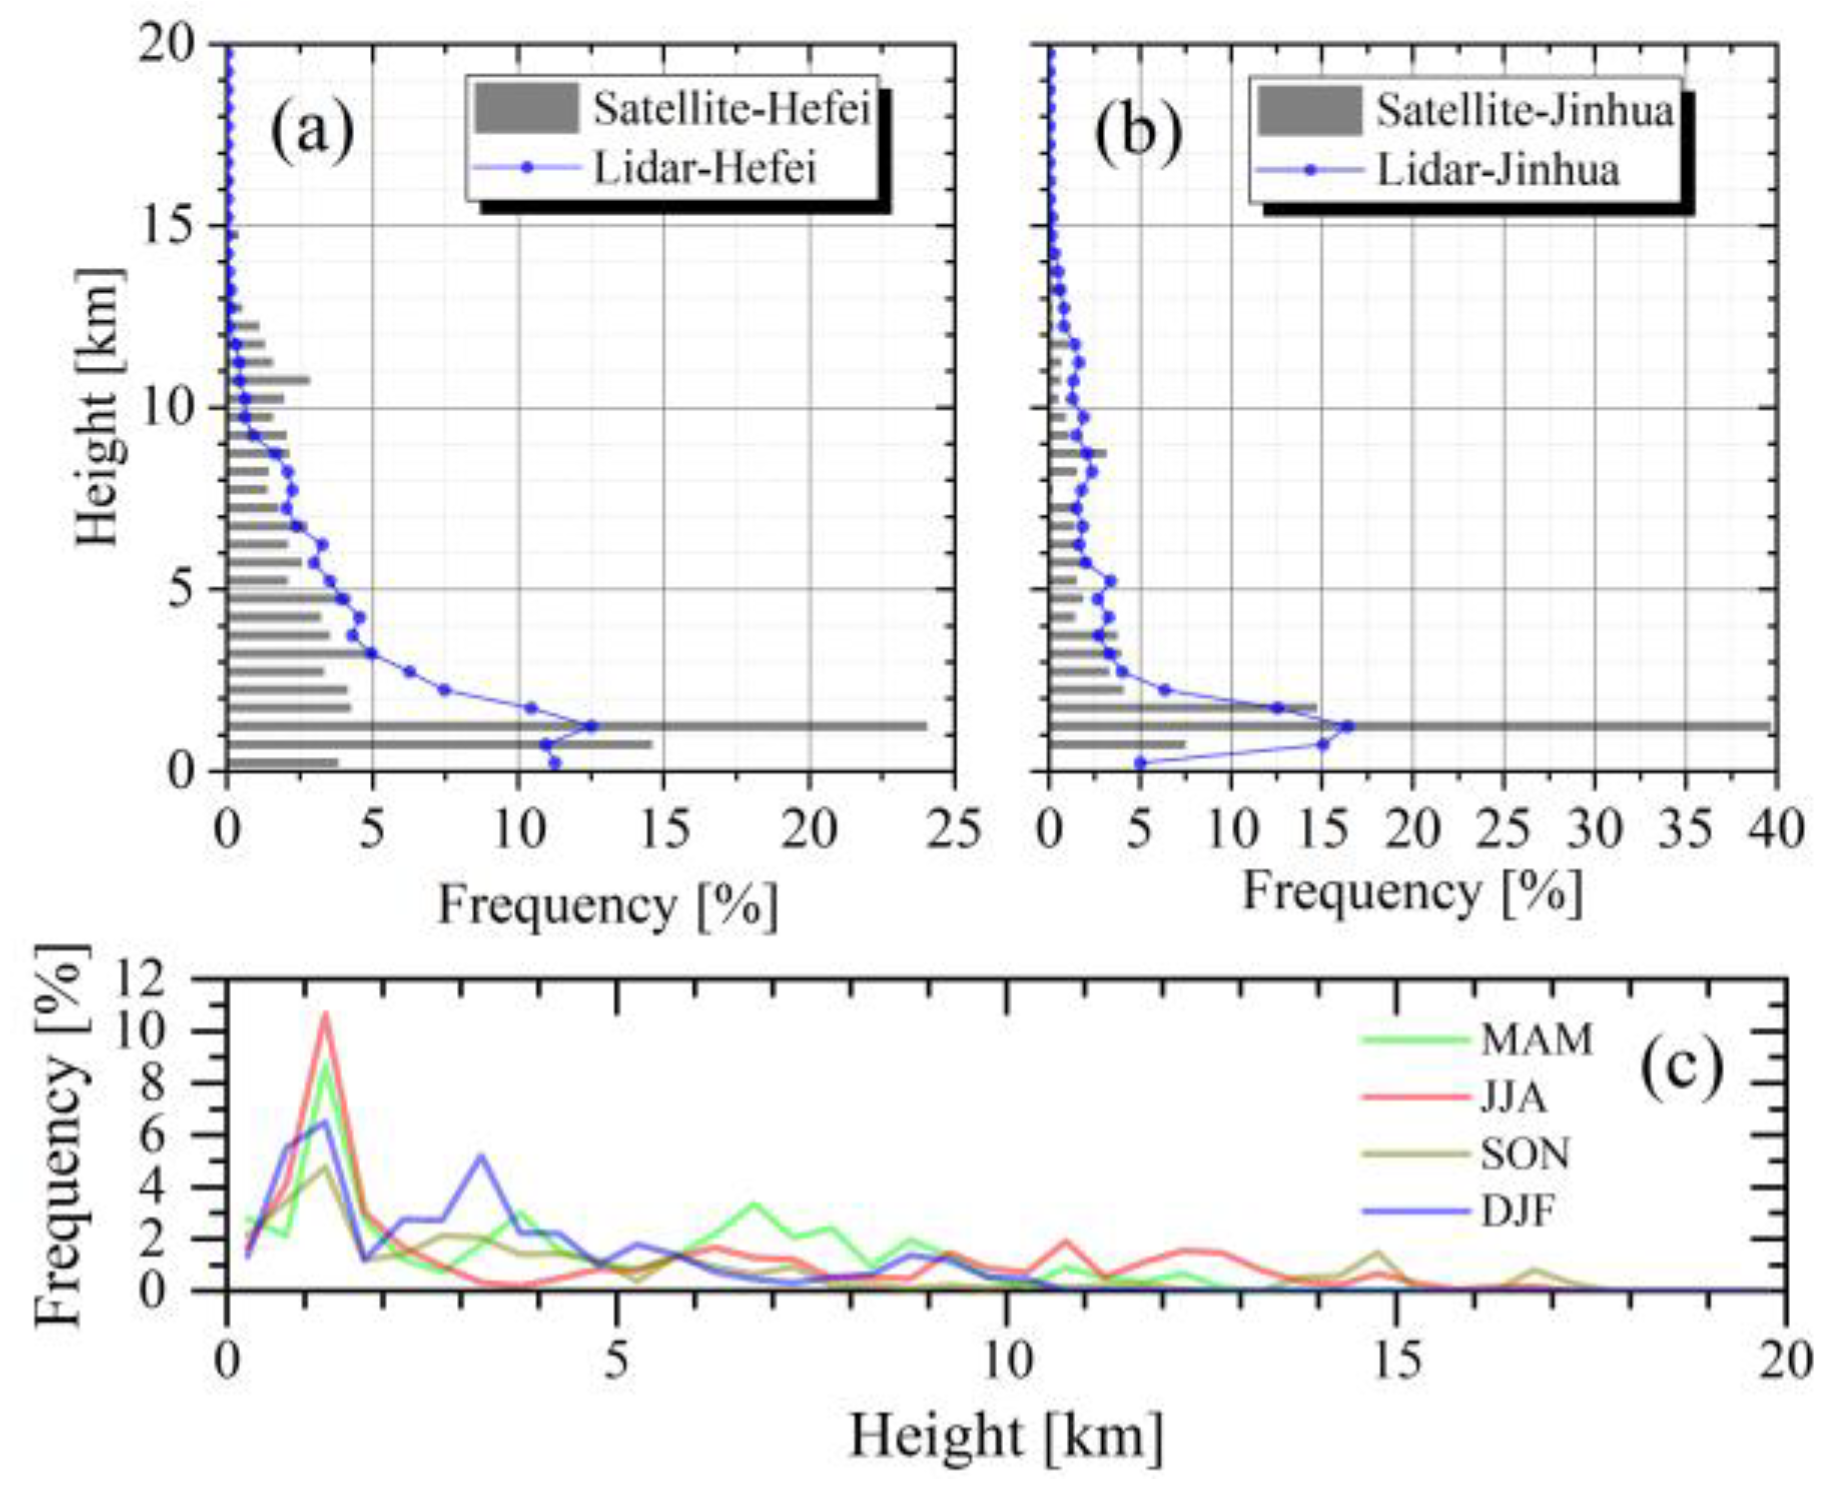
Figure 7 shows the occurrence frequency of cloud base height derived from ground-based lidars in Hefei and Jinhua sites and from 2B-CLDCLASS-LIDAR in matched grid boxes. The cloud base height occurrence frequency of 2B-CLDCLASS-LIDAR or ground-based lidar over Jinhua city has good consistency in the vertical cloud base height distribution. For the ground-based lidar in Hefei city, the occurrence frequency of cloud base height is different at 11 km and below 3 km. There may be three reasons here for this. The first is year variation (timeframe problem). Because of the different year timeframes of the three databases, the difference between the lidar measurement and the matched grid box will be enlarged.
Figure 7c illustrates the standard deviations of cloud base height distributions during the four years. The cloud base height distribution near 1 km has a larger fluctuation in each season. However, below 1.5 km, the differences between ground-based lidars and satellites are larger than the year variations, which may be caused by the two reasons below. The second reason is from lidar measurement. The single-point observation has a representativeness problem. The third reason is from satellite measurement. The Surface clutter or blind-zone of the radar on CPR brings about the misdetection of the lower cloud layers. The first and third reasons need to be highly considered.
The detailed differences in cloud base height distribution between the two ground-based observation sites are shown in
Figure 8. In
Figure 8b, Hefei site has a decreasing frequency of the cumulus and stratocumulus cloud fractions, which leads to the decreasing frequency of cloud base height at 1–2 km (see
Figure 8a) in both ground-based lidar and satellite measurement, because the cloud base heights of cumulus and stratocumulus contribute to the cloud base height distribution at about 0–3 km (see
Figure 6). Hefei site has an increasing frequency of cirrus cloud fraction, however the ground-based lidar measurement has an inverse change at about 11 km. This is because the laser energy of lidar in Hefei city is weaker than that in Jinhua city, which results in the missing measurement of the cirrus cloud over Hefei area. It is obvious that satellite and ground-based lidar measurements have a good agreement for the change in cloud base height distribution between the two sites, which indicates that the 2B-CLDCLASS-LIDAR can appropriately distinguish the cloud type fraction change between the two sites. The large divergence between the two measurements at about 1–2 km may result from yearly variation.
3.3. Seasonal Variation in Cloud Base Height Based on Satellite and Ground-Base Observations
To respectively investigate the seasonal variation in cloud base height distribution for the satellite and ground-based observations in the two sites,
Figure 9 shows the seasonal occurrence frequencies of cloud base height in four seasons. Over Hefei site, the cloud with cloud base height at 0–0.5 km (cumulus [
7]) has a higher frequency in 2B-CLDCLASS-LIDAR, whose difference is higher than the yearly variation at the corresponding height (see
Figure 7c). This is probably because the persistent high humidity environment [
31] brings more rainy days. This phenomenon is more obvious in the monsoon period [
32] (see
Figure 9b,d). However, this phenomenon does not appear in the satellite measurement. In summer over Jinhua area, the East Asian monsoon does not bring more low clouds to the contrary, it brings less low clouds (see
Figure 9f) due to the control of the western North Pacific subtropical high after the plum rain season. The difference correlations for seasonal variation in cloud base height distribution between the satellite and ground-based observations in the two sites are shown in
Figure 10. The difference for seasonal variation in cloud base height distribution is derived from the frequencies of the cloud base height minus the averaged seasonal fraction during the four seasons. Over Hefei site, the slope of linear fitting is 0.55, which is less than that in Jinhua site. The grid box containing Jinhua site has a clearer description of the seasonal change in cloud base height distribution in Jinhua site, although the year variation effect exists here. More comparisons between them should be presented.
4. Conclusions
The vertical distribution of cloud base height is an essential element for the radiation process and the climate model. We used the 2B-CLDCLASS-LIDAR product, which combines CloudSat and CALIPSO, and observational data from ground-based lidars to investigate the vertical distribution of cloud base height over the defined region (Eastern China). The method described in
Section 2 is used to retrieve the cloud base height from lidar measurements. The clouds are classified into precipitation and non-precipitation clouds to investigate the occurrence frequencies of eight cloud types and their cloud base heights. The occurrence frequency of non-precipitation cloud is dominated by altocumulus, stratocumulus, and cirrus clouds. The precipitation clouds have higher occurrence frequencies in nimbostratus, cumulus, and deep convective clouds. The occurrence frequencies of vertical cloud base height distribution measured by the two lidar sites are compared with the 2B-CLDCLASS-LIDAR product, as well as the seasonal results. The difference in occurrence frequencies of cloud types between the two sites is in good agreement with the difference in cloud base height distribution between the two sites, based on either satellite or ground-based measurements. The seasonal results for vertical cloud base height distribution over Jinhua area and Hefei area indicate the influences of local climate on cloud base height distribution. The difference in seasonal occurrence frequencies of cloud base height distributions between lidar and satellite measurements in Jinhua site indicates the seasonal resolution of cloud base height distribution by the 2B-CLDCLASS-LIDAR product. Therefore, the 2B-CLDCLASS-LIDAR product has the ability to differentiate the variations in cloud type fraction associated with the cloud base height distribution between the two sites, however the ability to differentiate the seasonal changes in cloud base height distribution is only potential in Jinhua site and is insufficient in Hefei site. Of course, the different timeframes is a negligible factor, which needs to be improved in future studies. The main reasons for the insufficiency aspect may be the limitations of CPR in the lower cloud layer.
Cloud is the product of a dynamic and thermodynamic coupling process under local and large-scale climate influences. Lidar is a powerful tool to continuously monitor the cloud process. The gradually improving lidar network brings the possibility of complementation between satellite and ground-based observations of cloud macro-physical properties. The comparison of vertical cloud base height distribution is beneficial to this complementation. In addition, the understanding of the cloud base height distribution is important for the study of local weather models. The combined satellite and ground-based observations can better uncover the geographical and seasonal distribution of cloud base height. Therefore, in future studies we will compare more areas and look for the differences between these regions.


