Heat Waves and Human Well-Being in Madrid (Spain)


Abstract
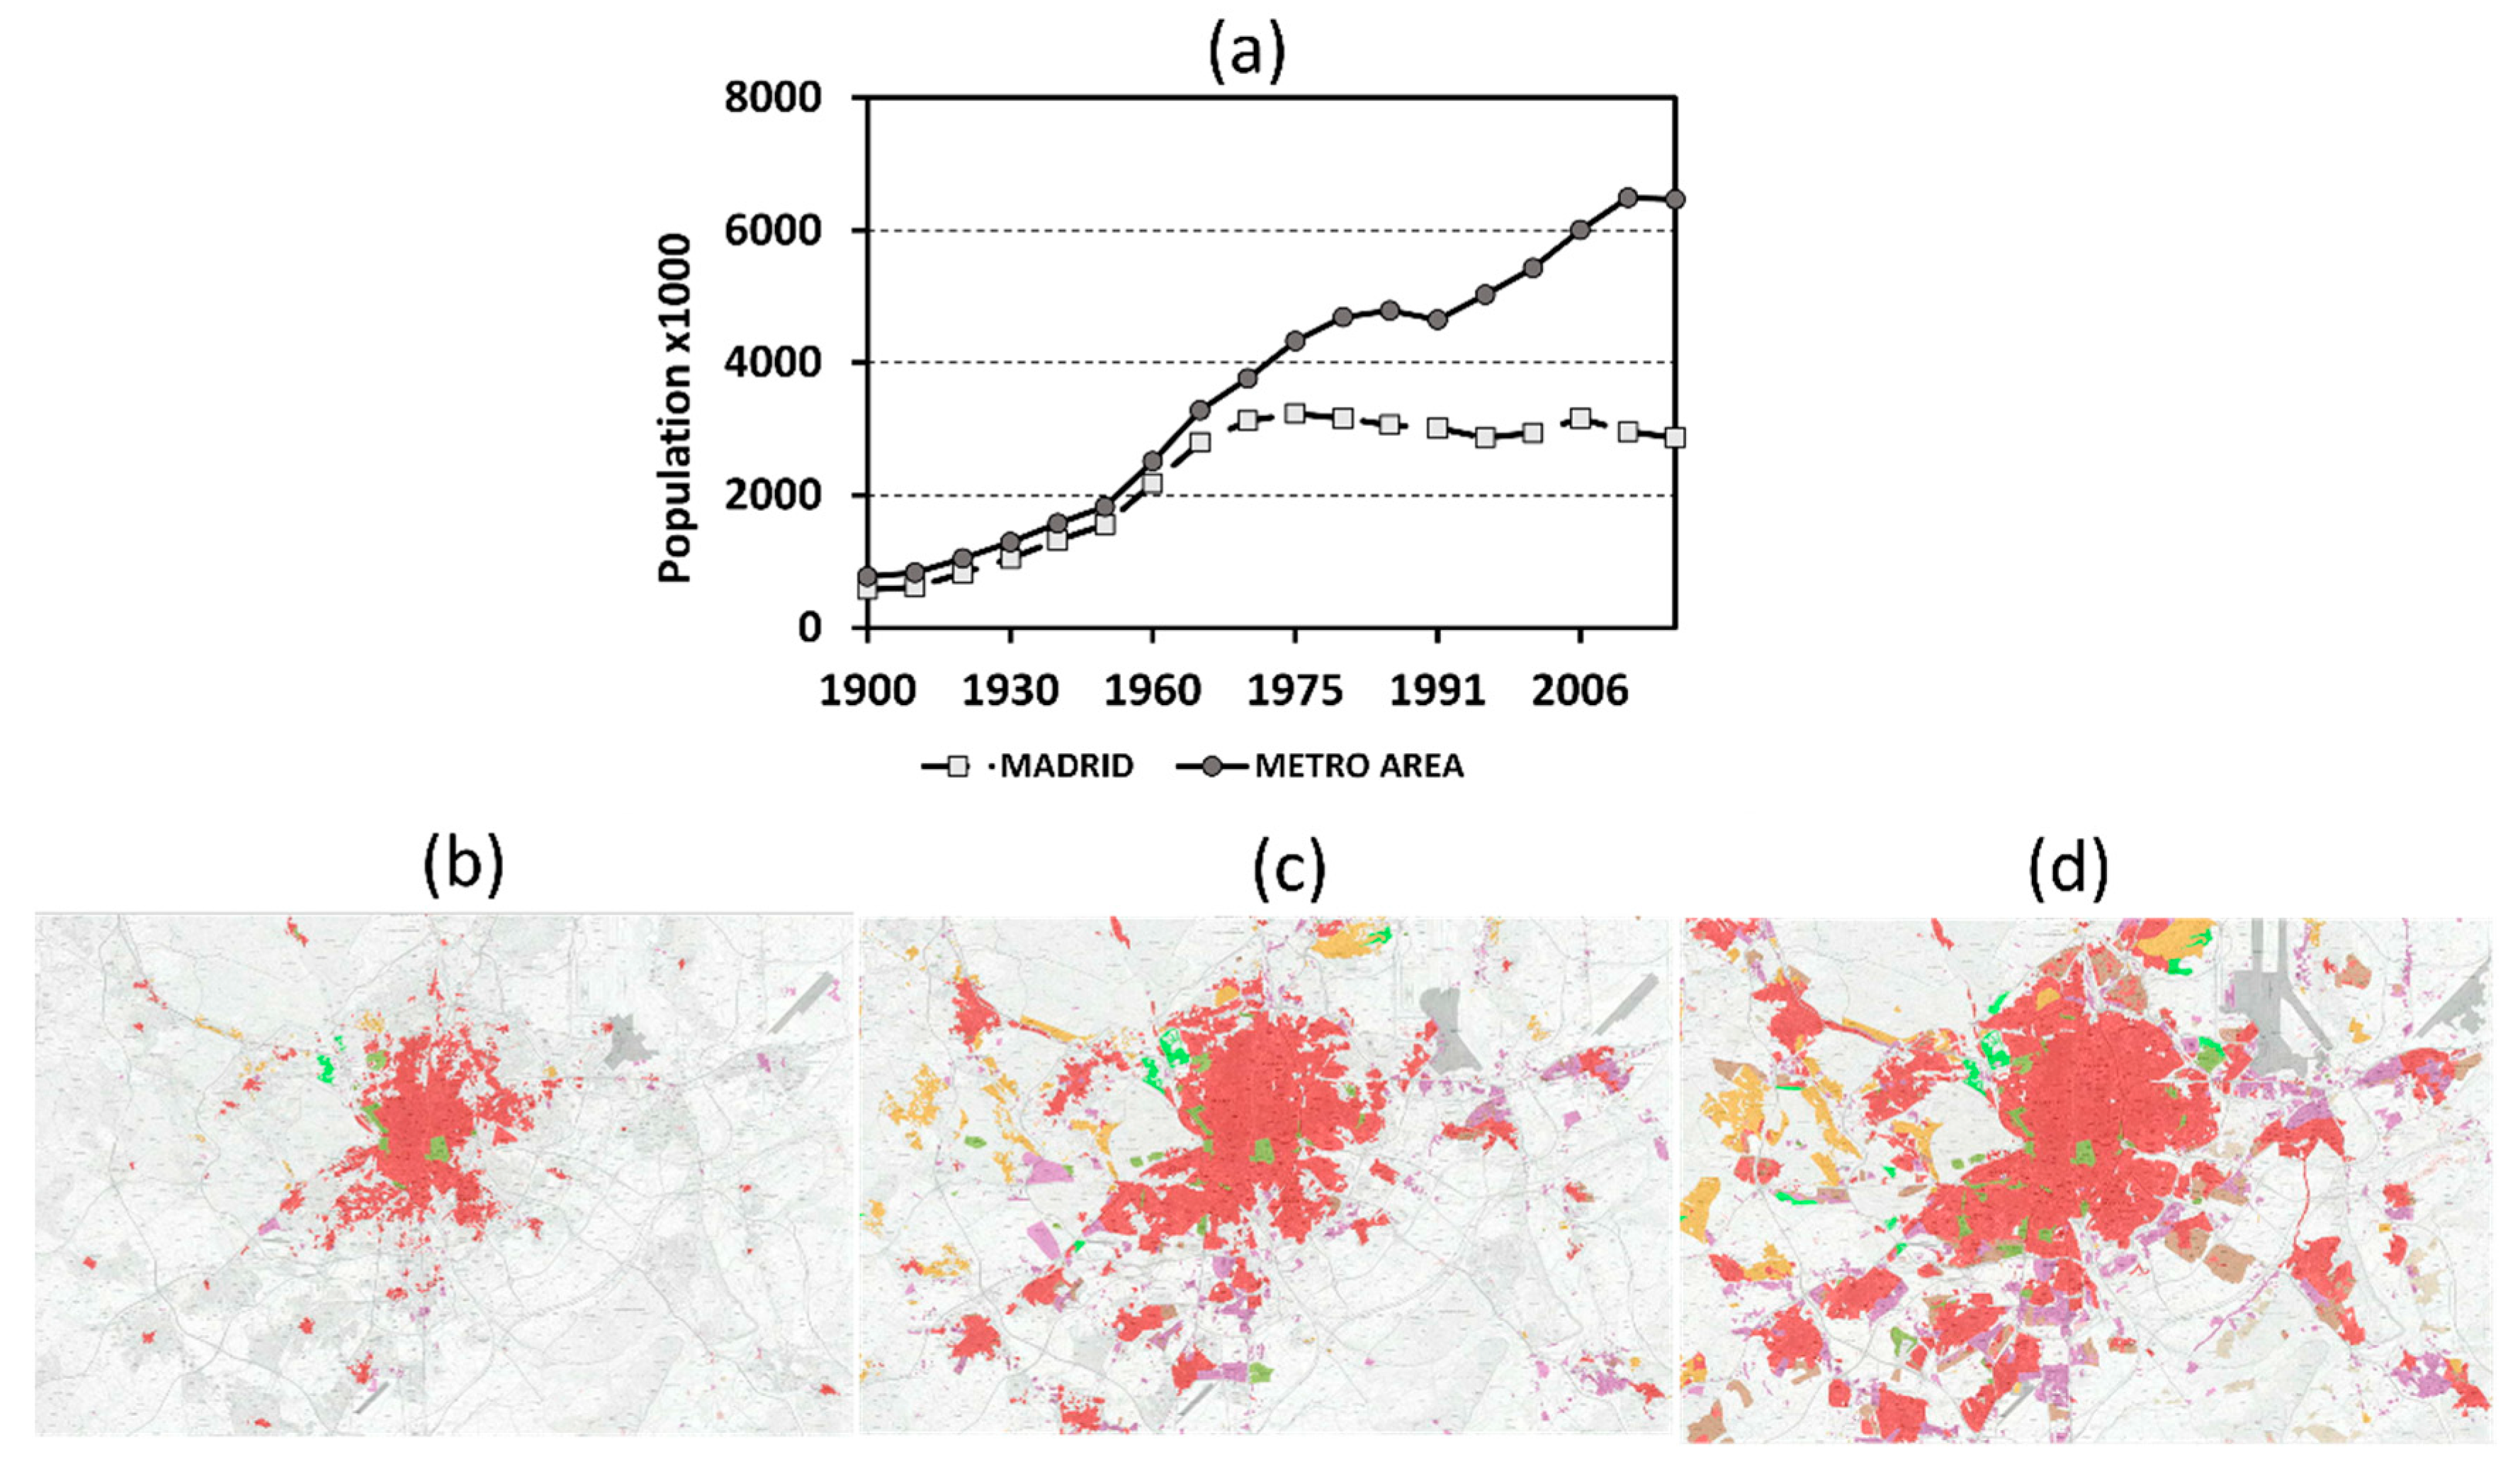
1. Introduction
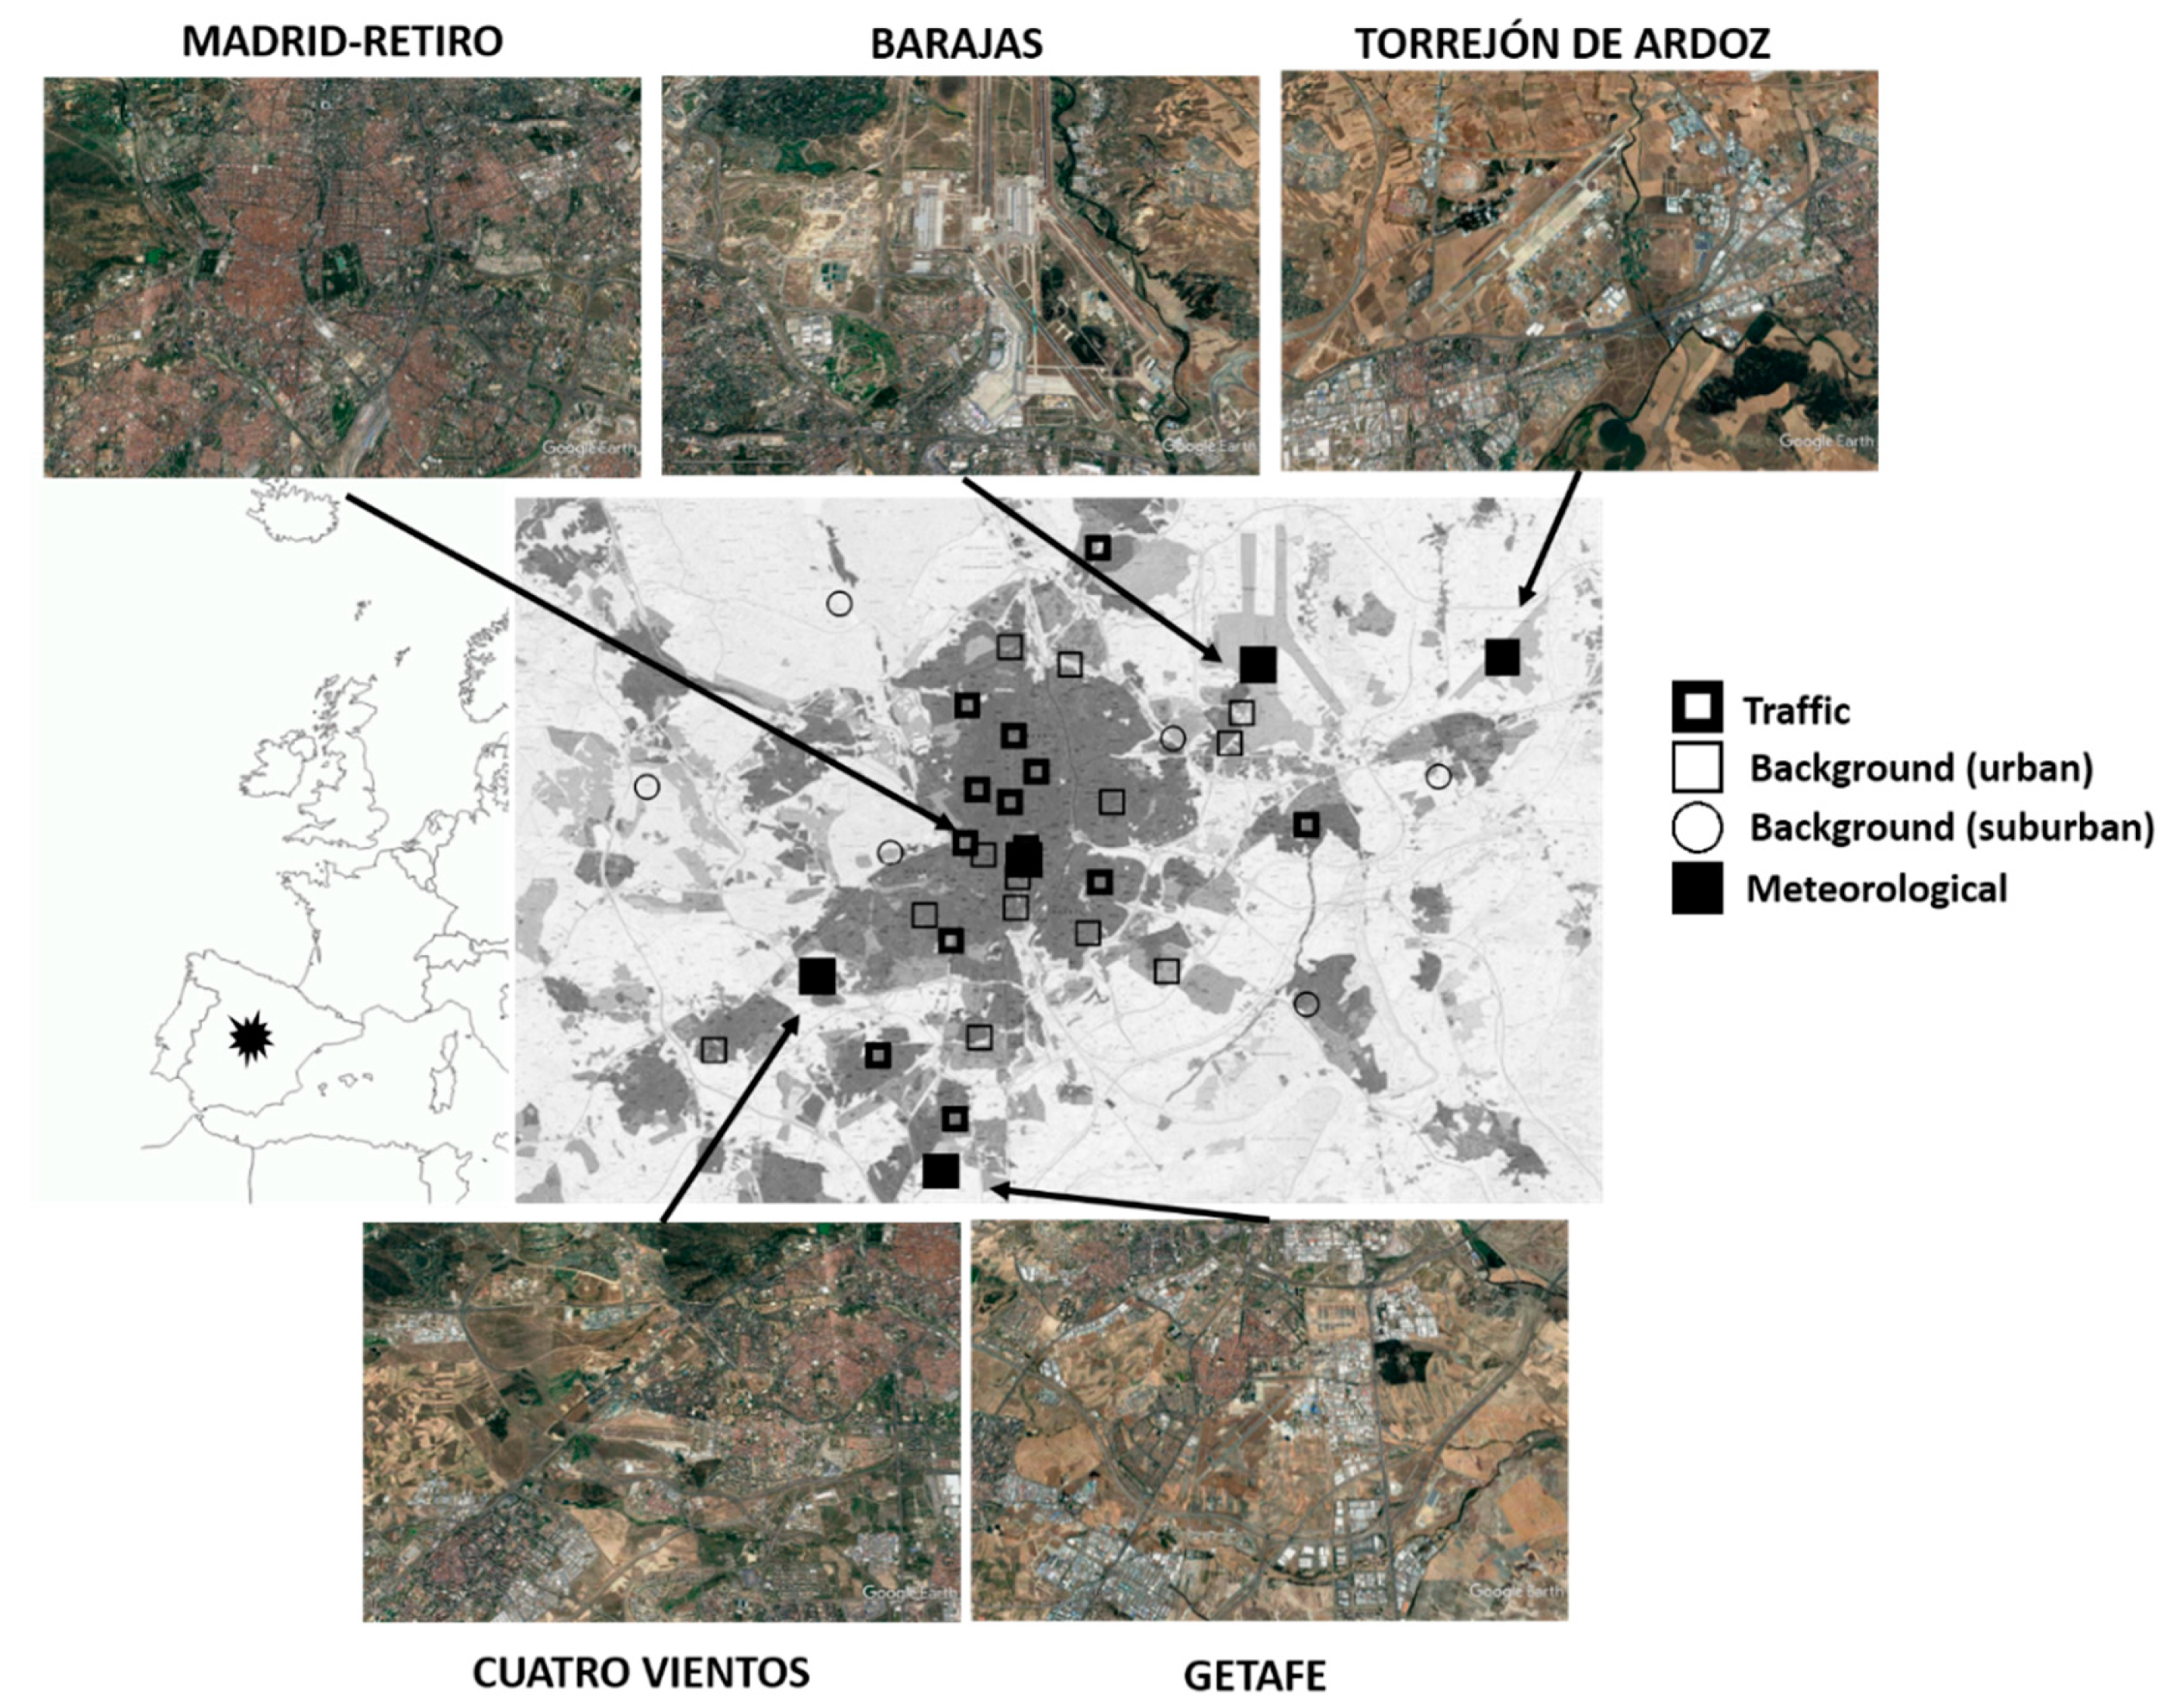
2. Data and Methodology
3. Results
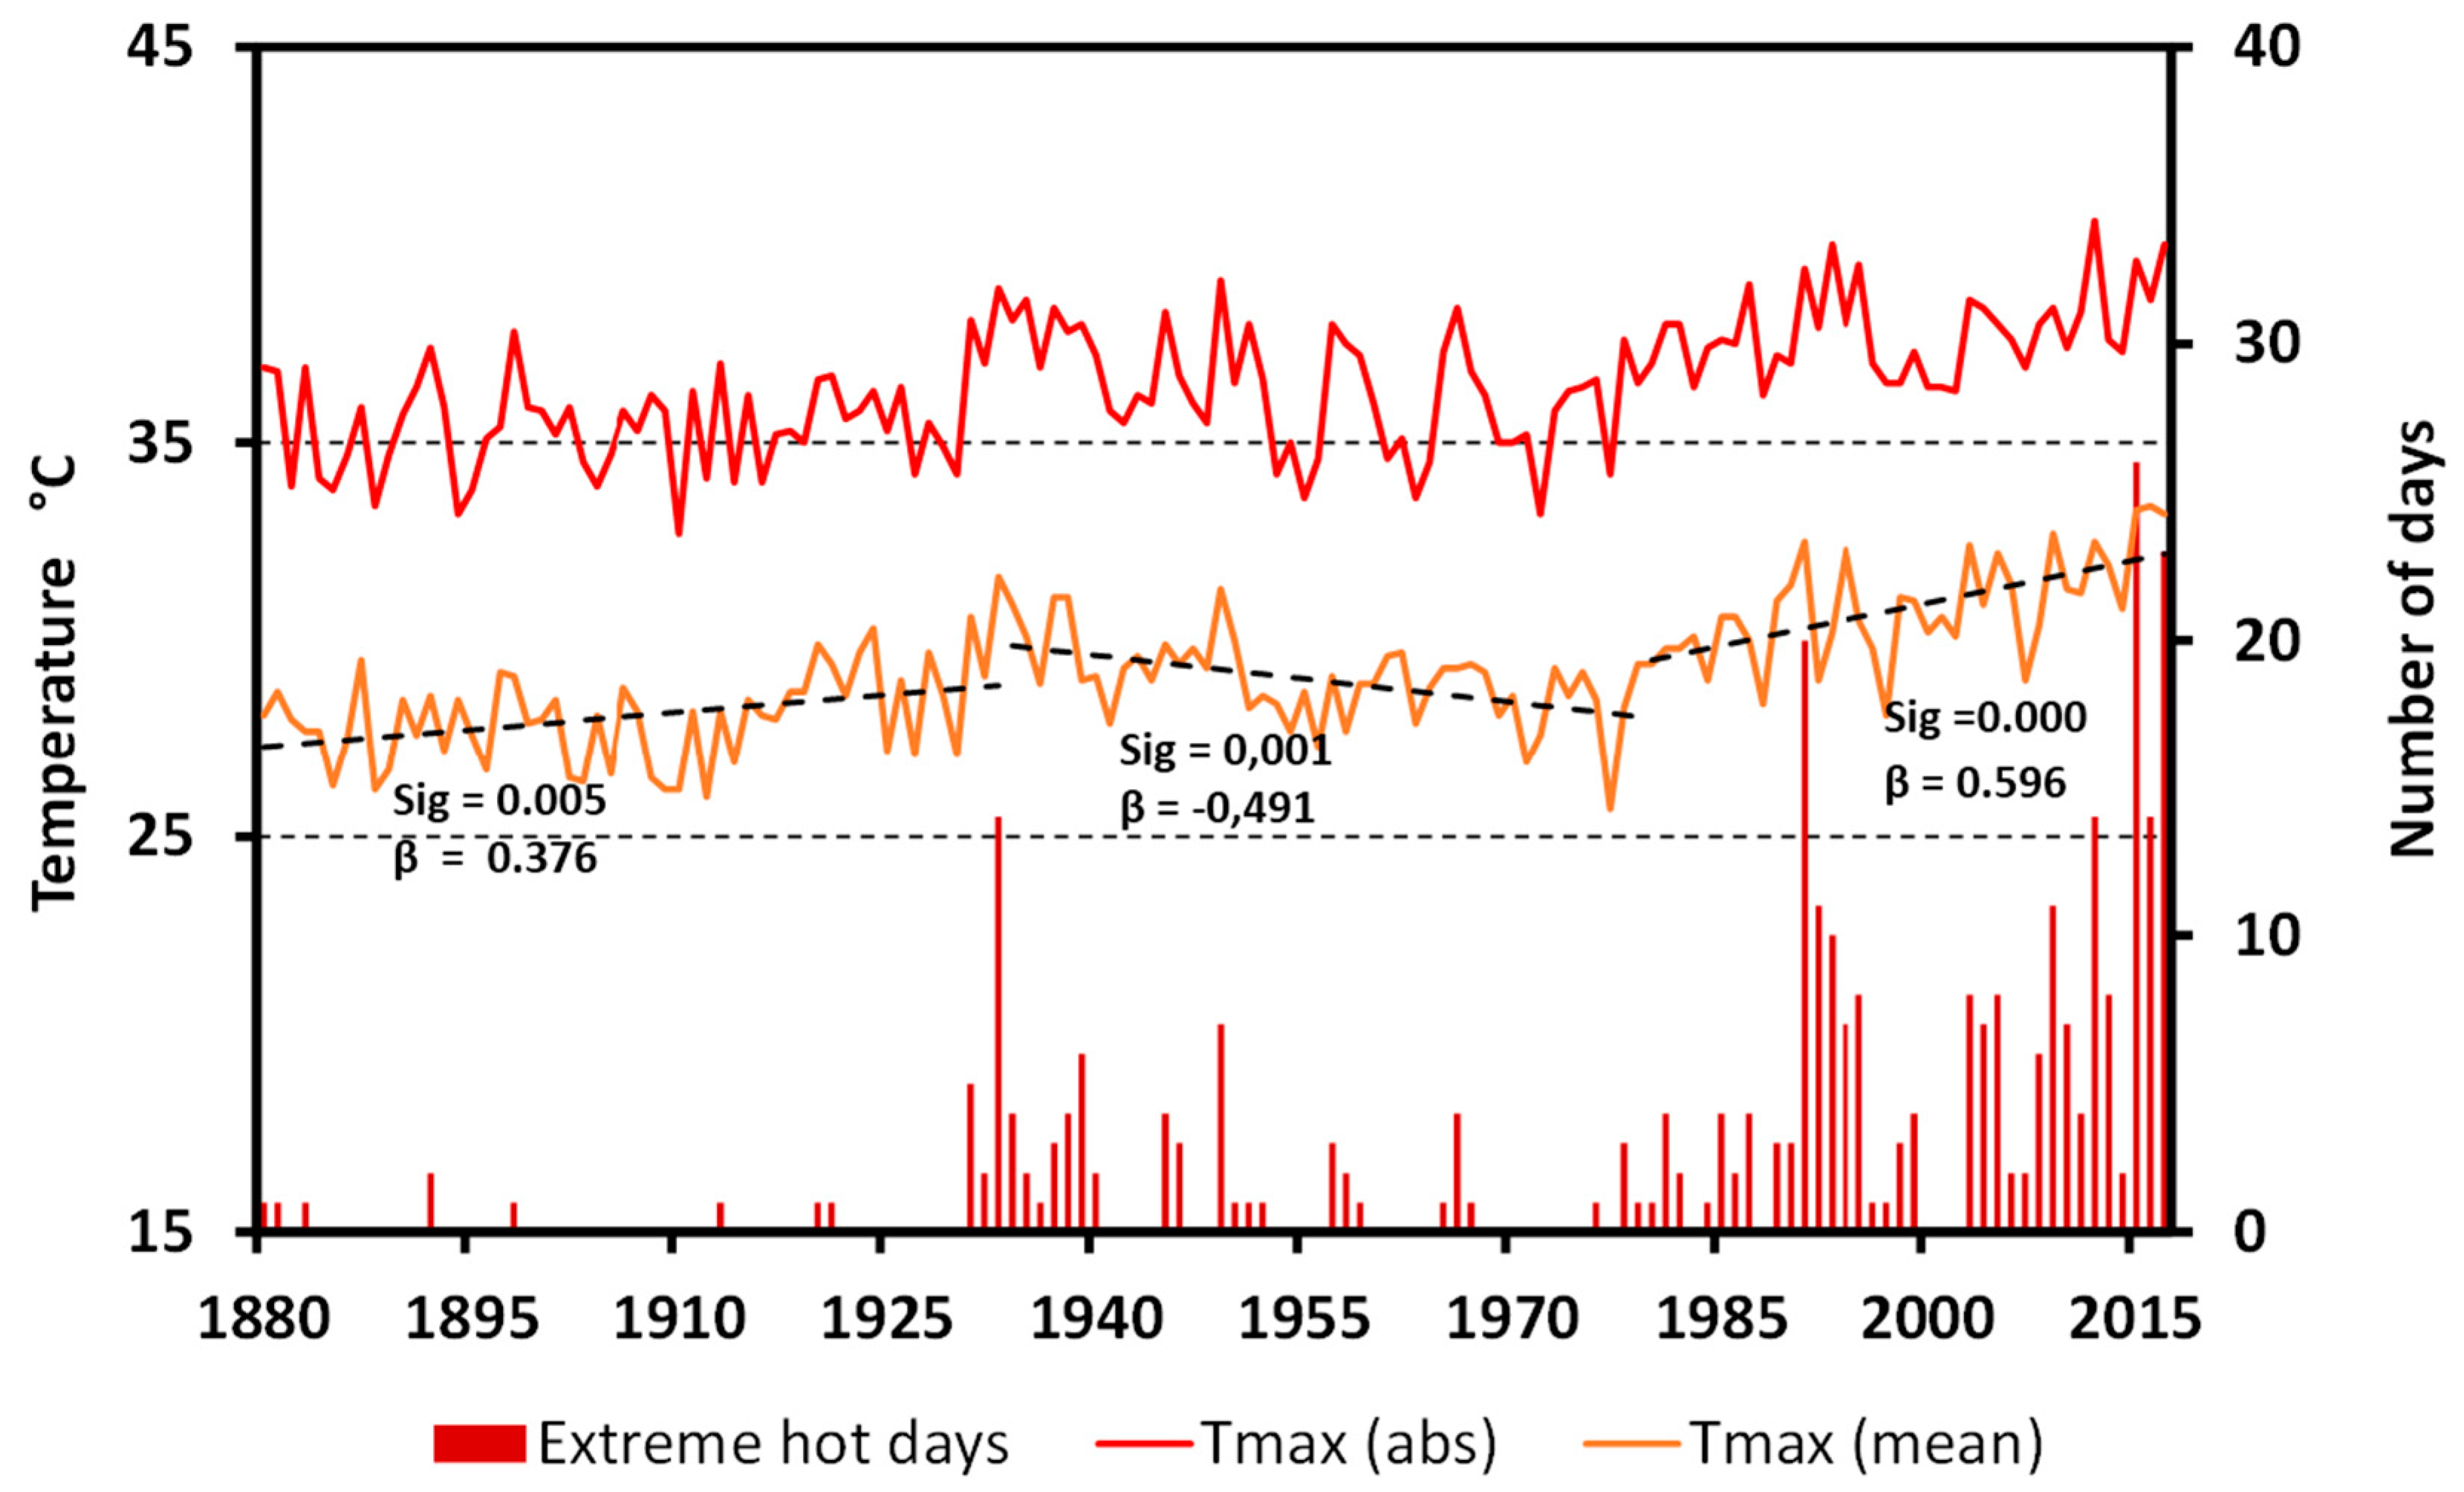
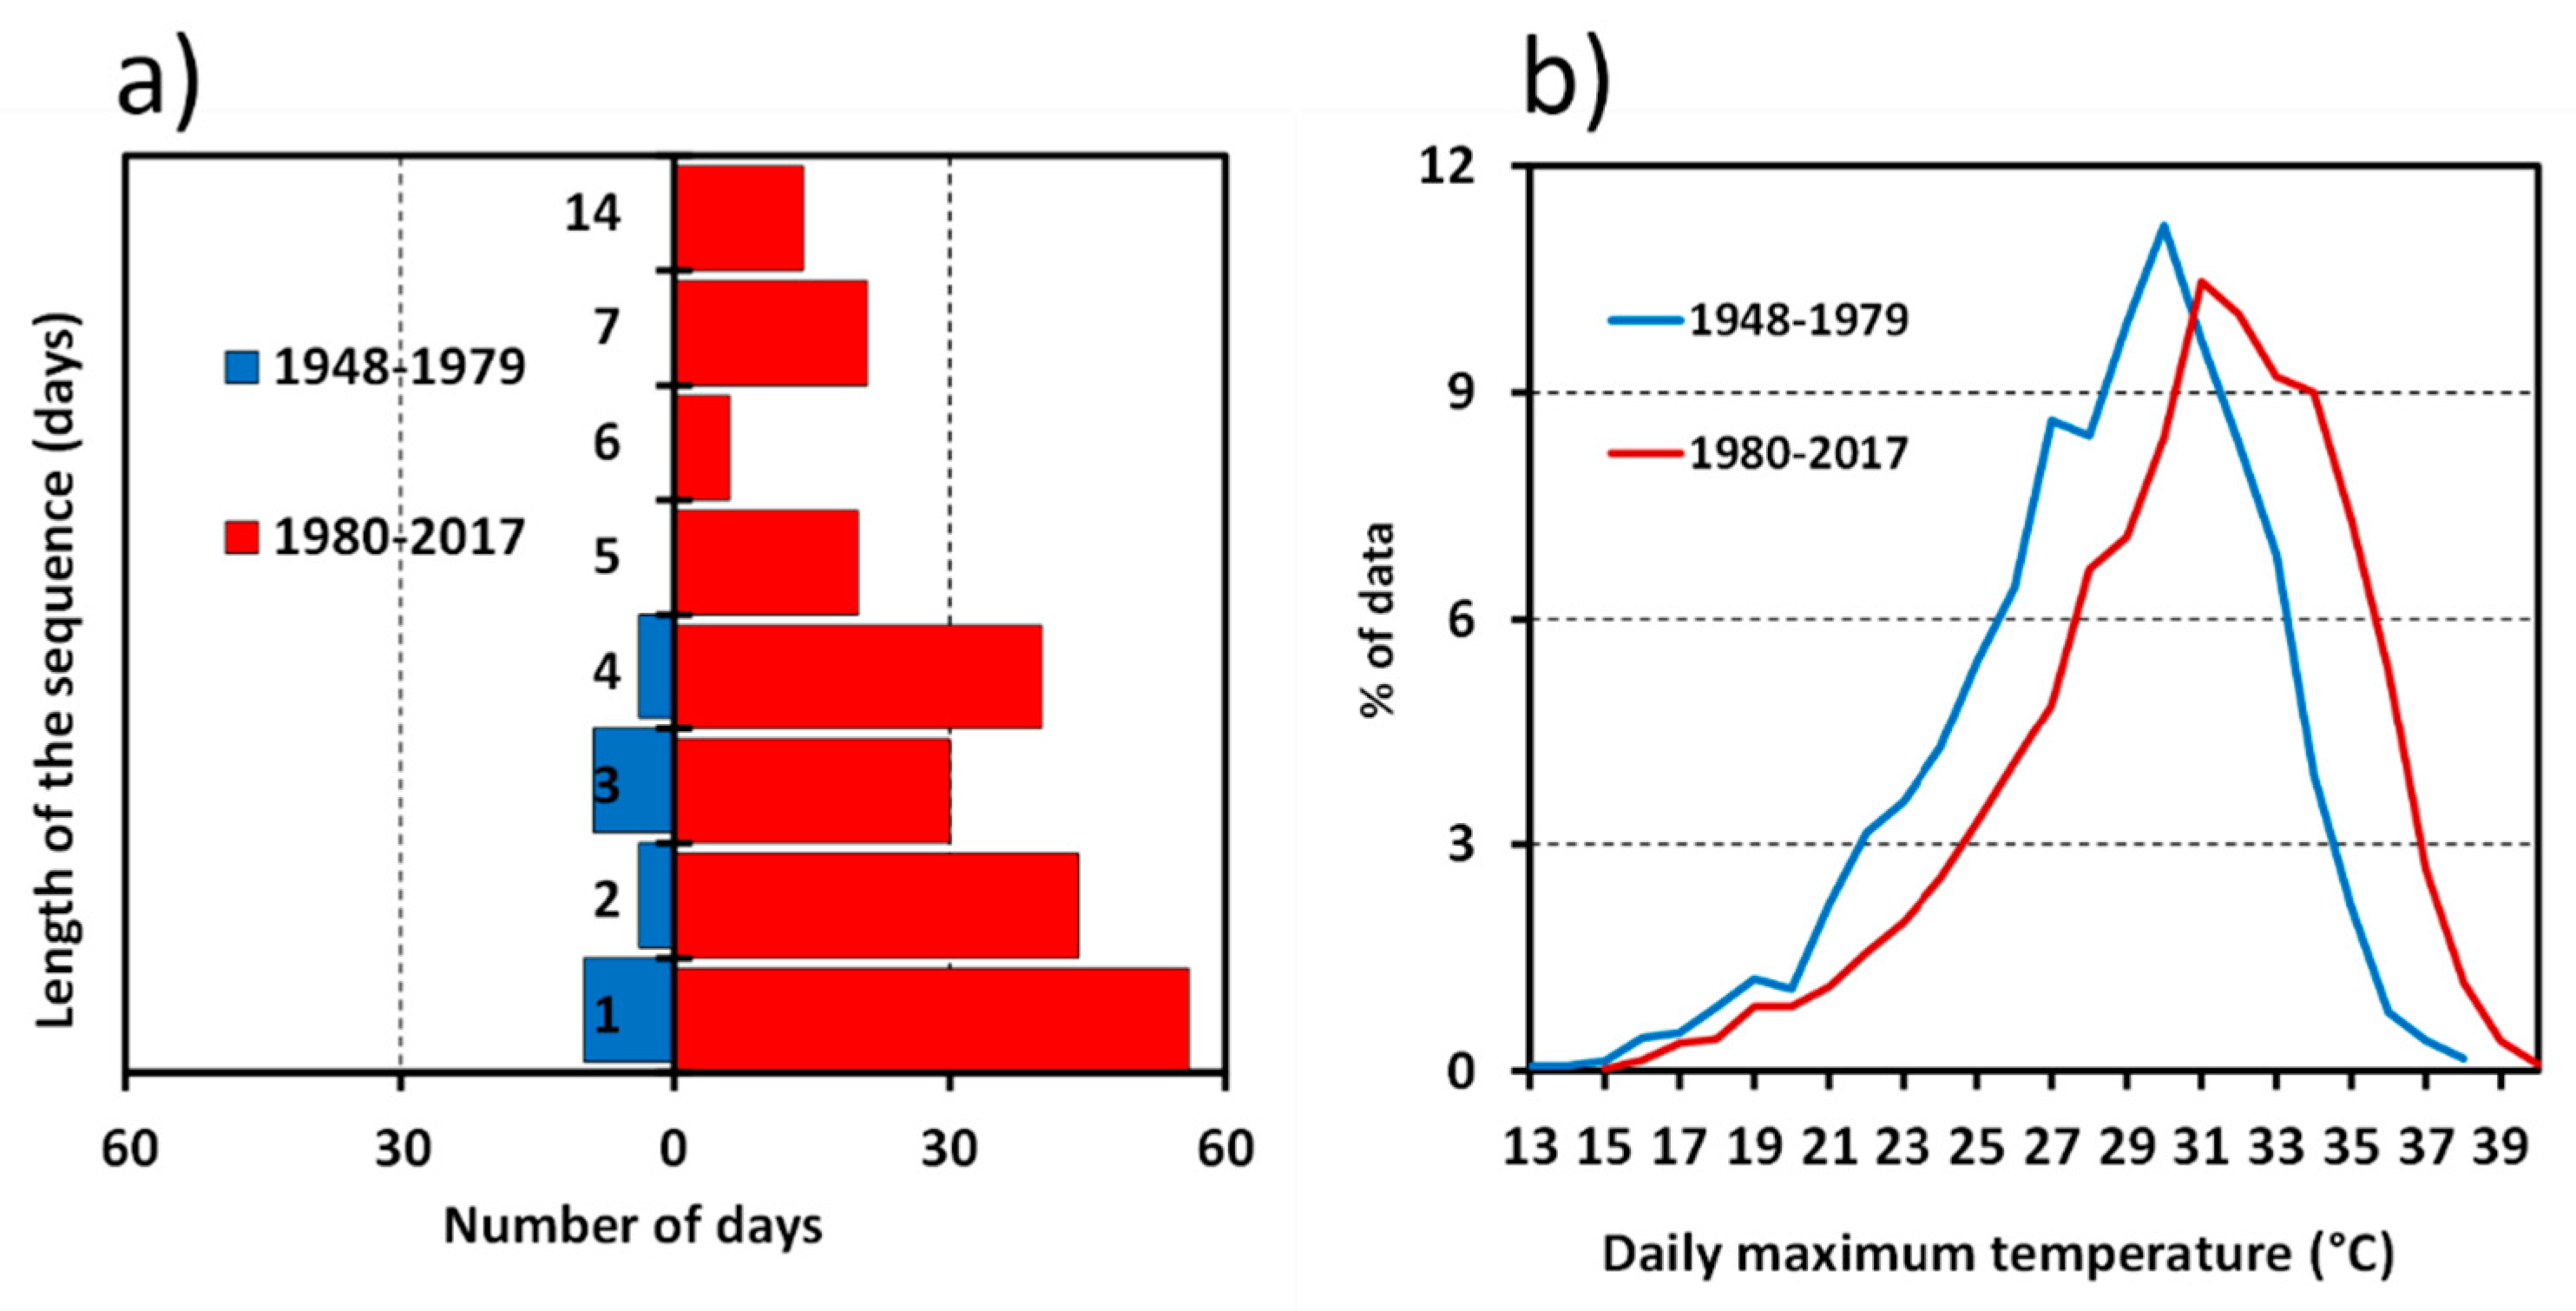
3.1. Long-Term Trends on Heat Waves Occurrence
3.2. Heat Waves and UHI
3.2.1. CLUHI
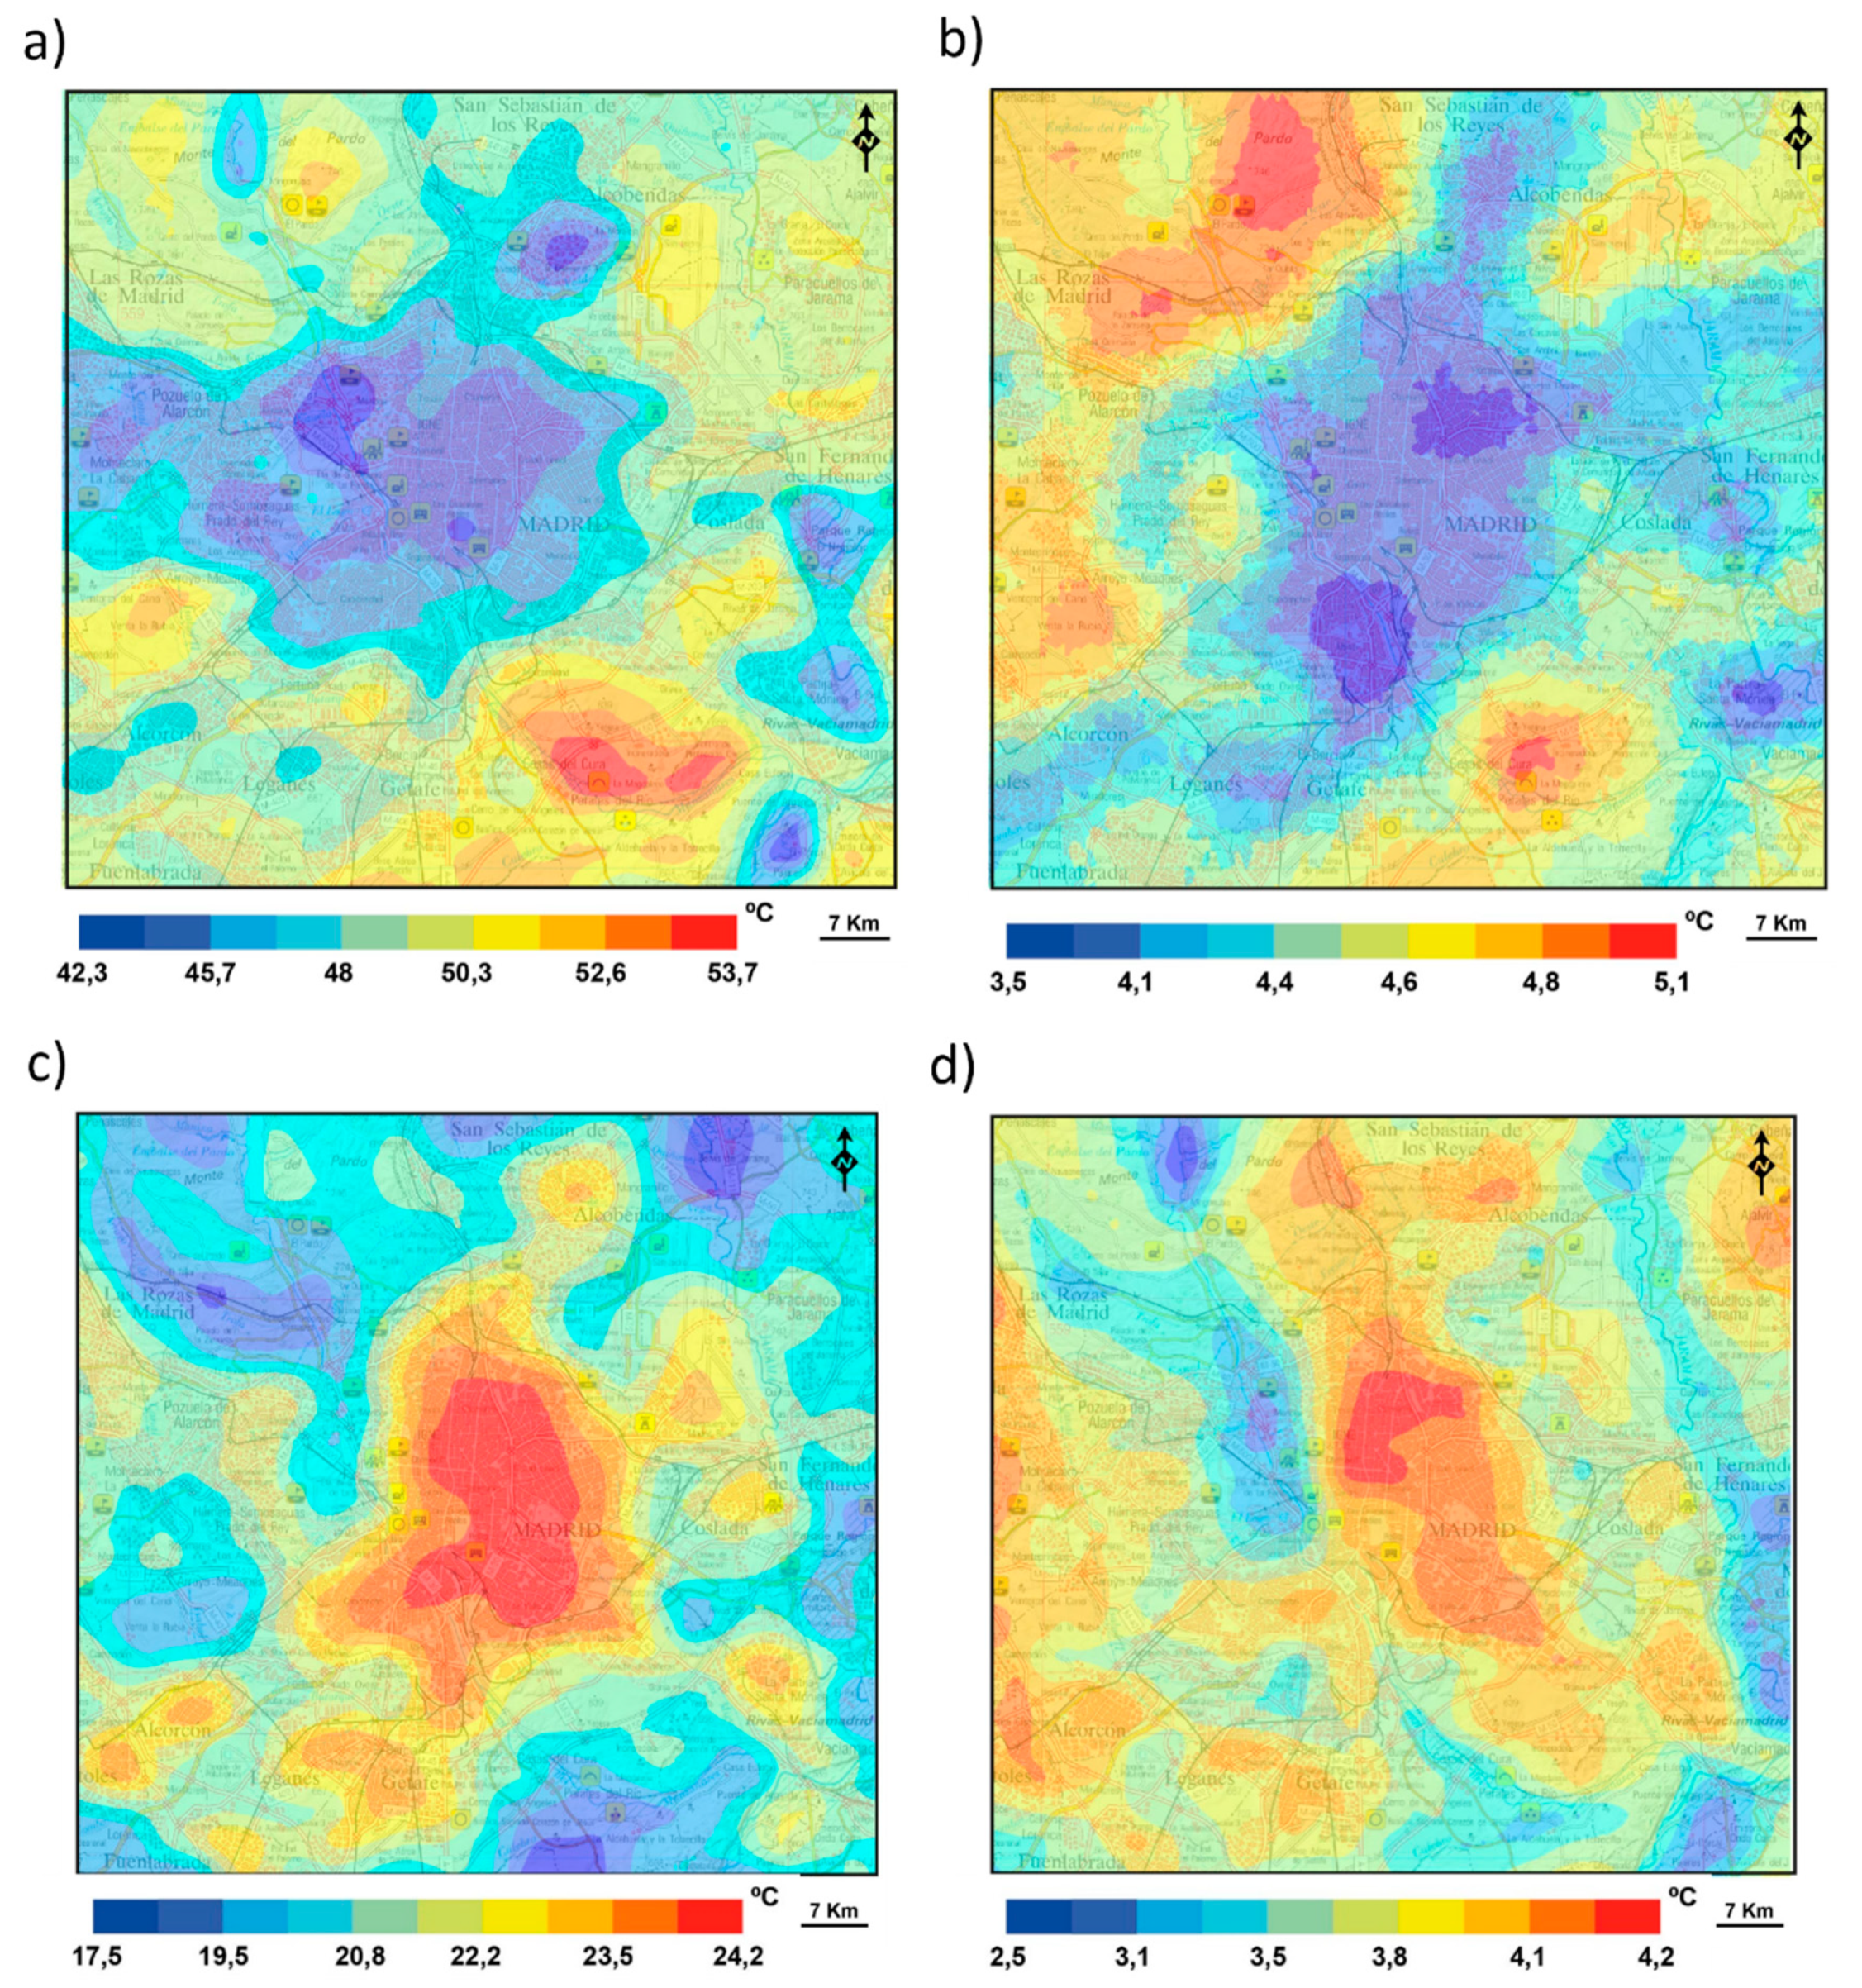
3.2.2. SUHI
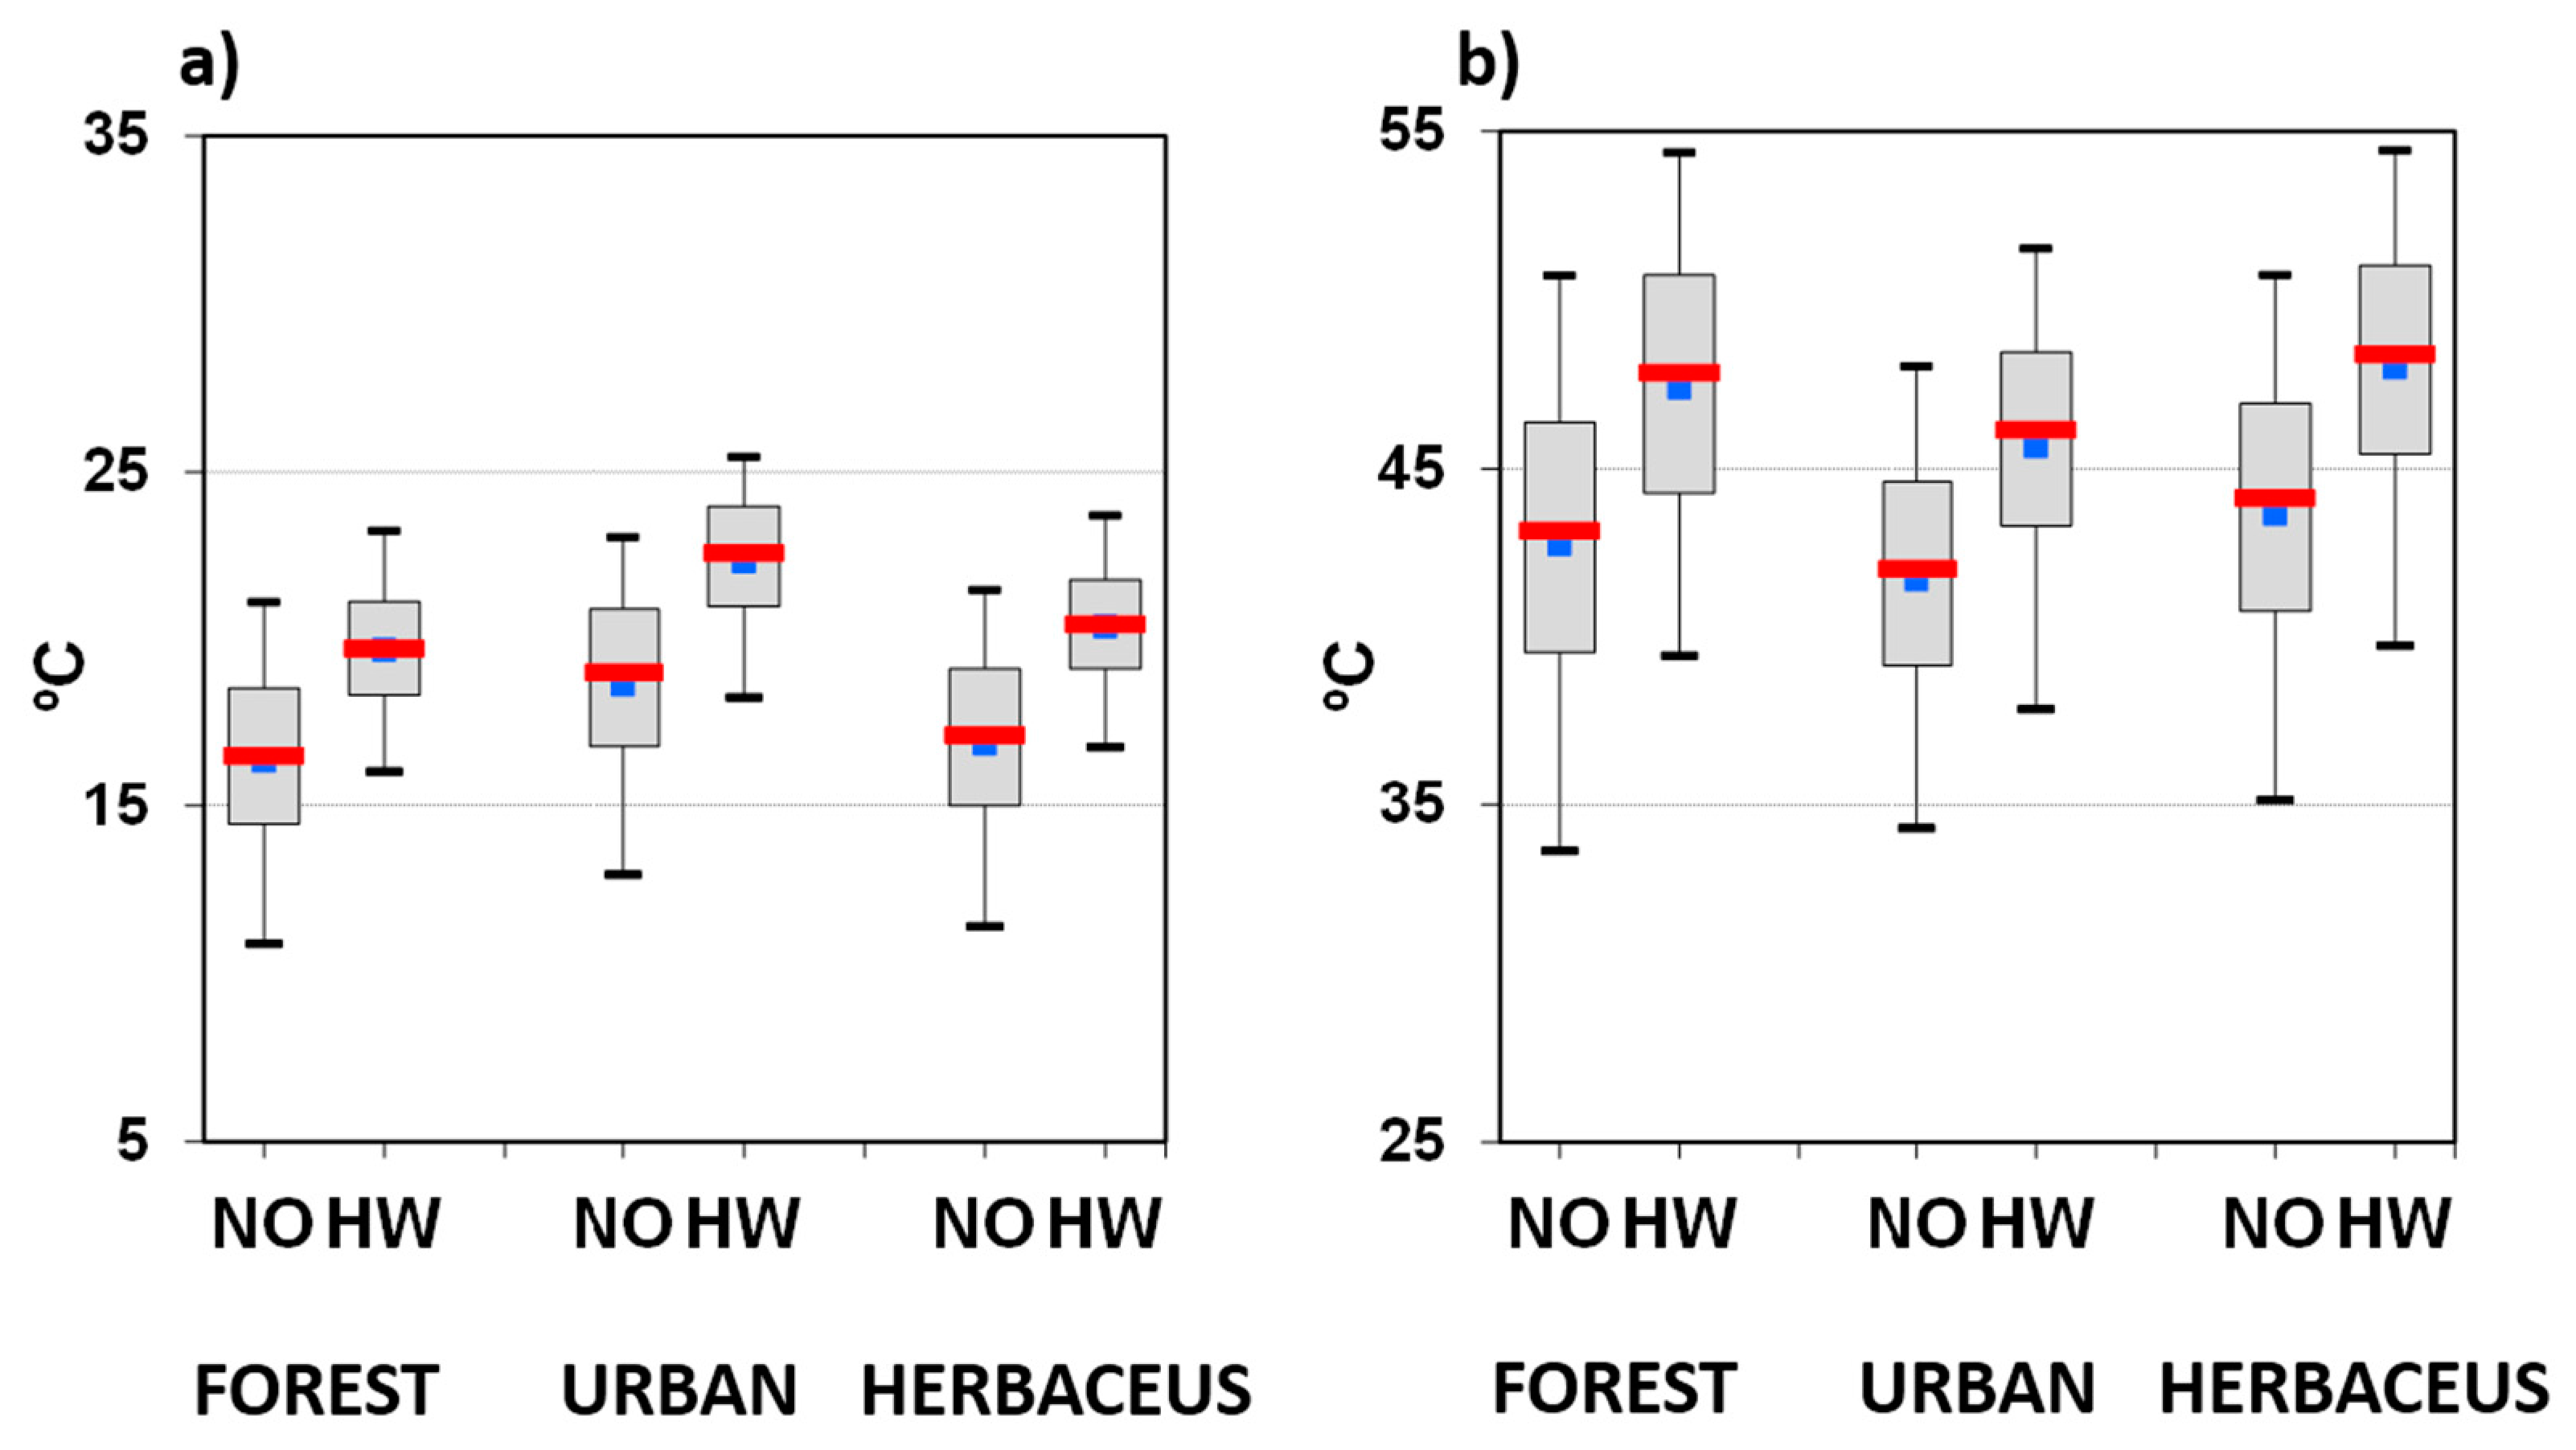
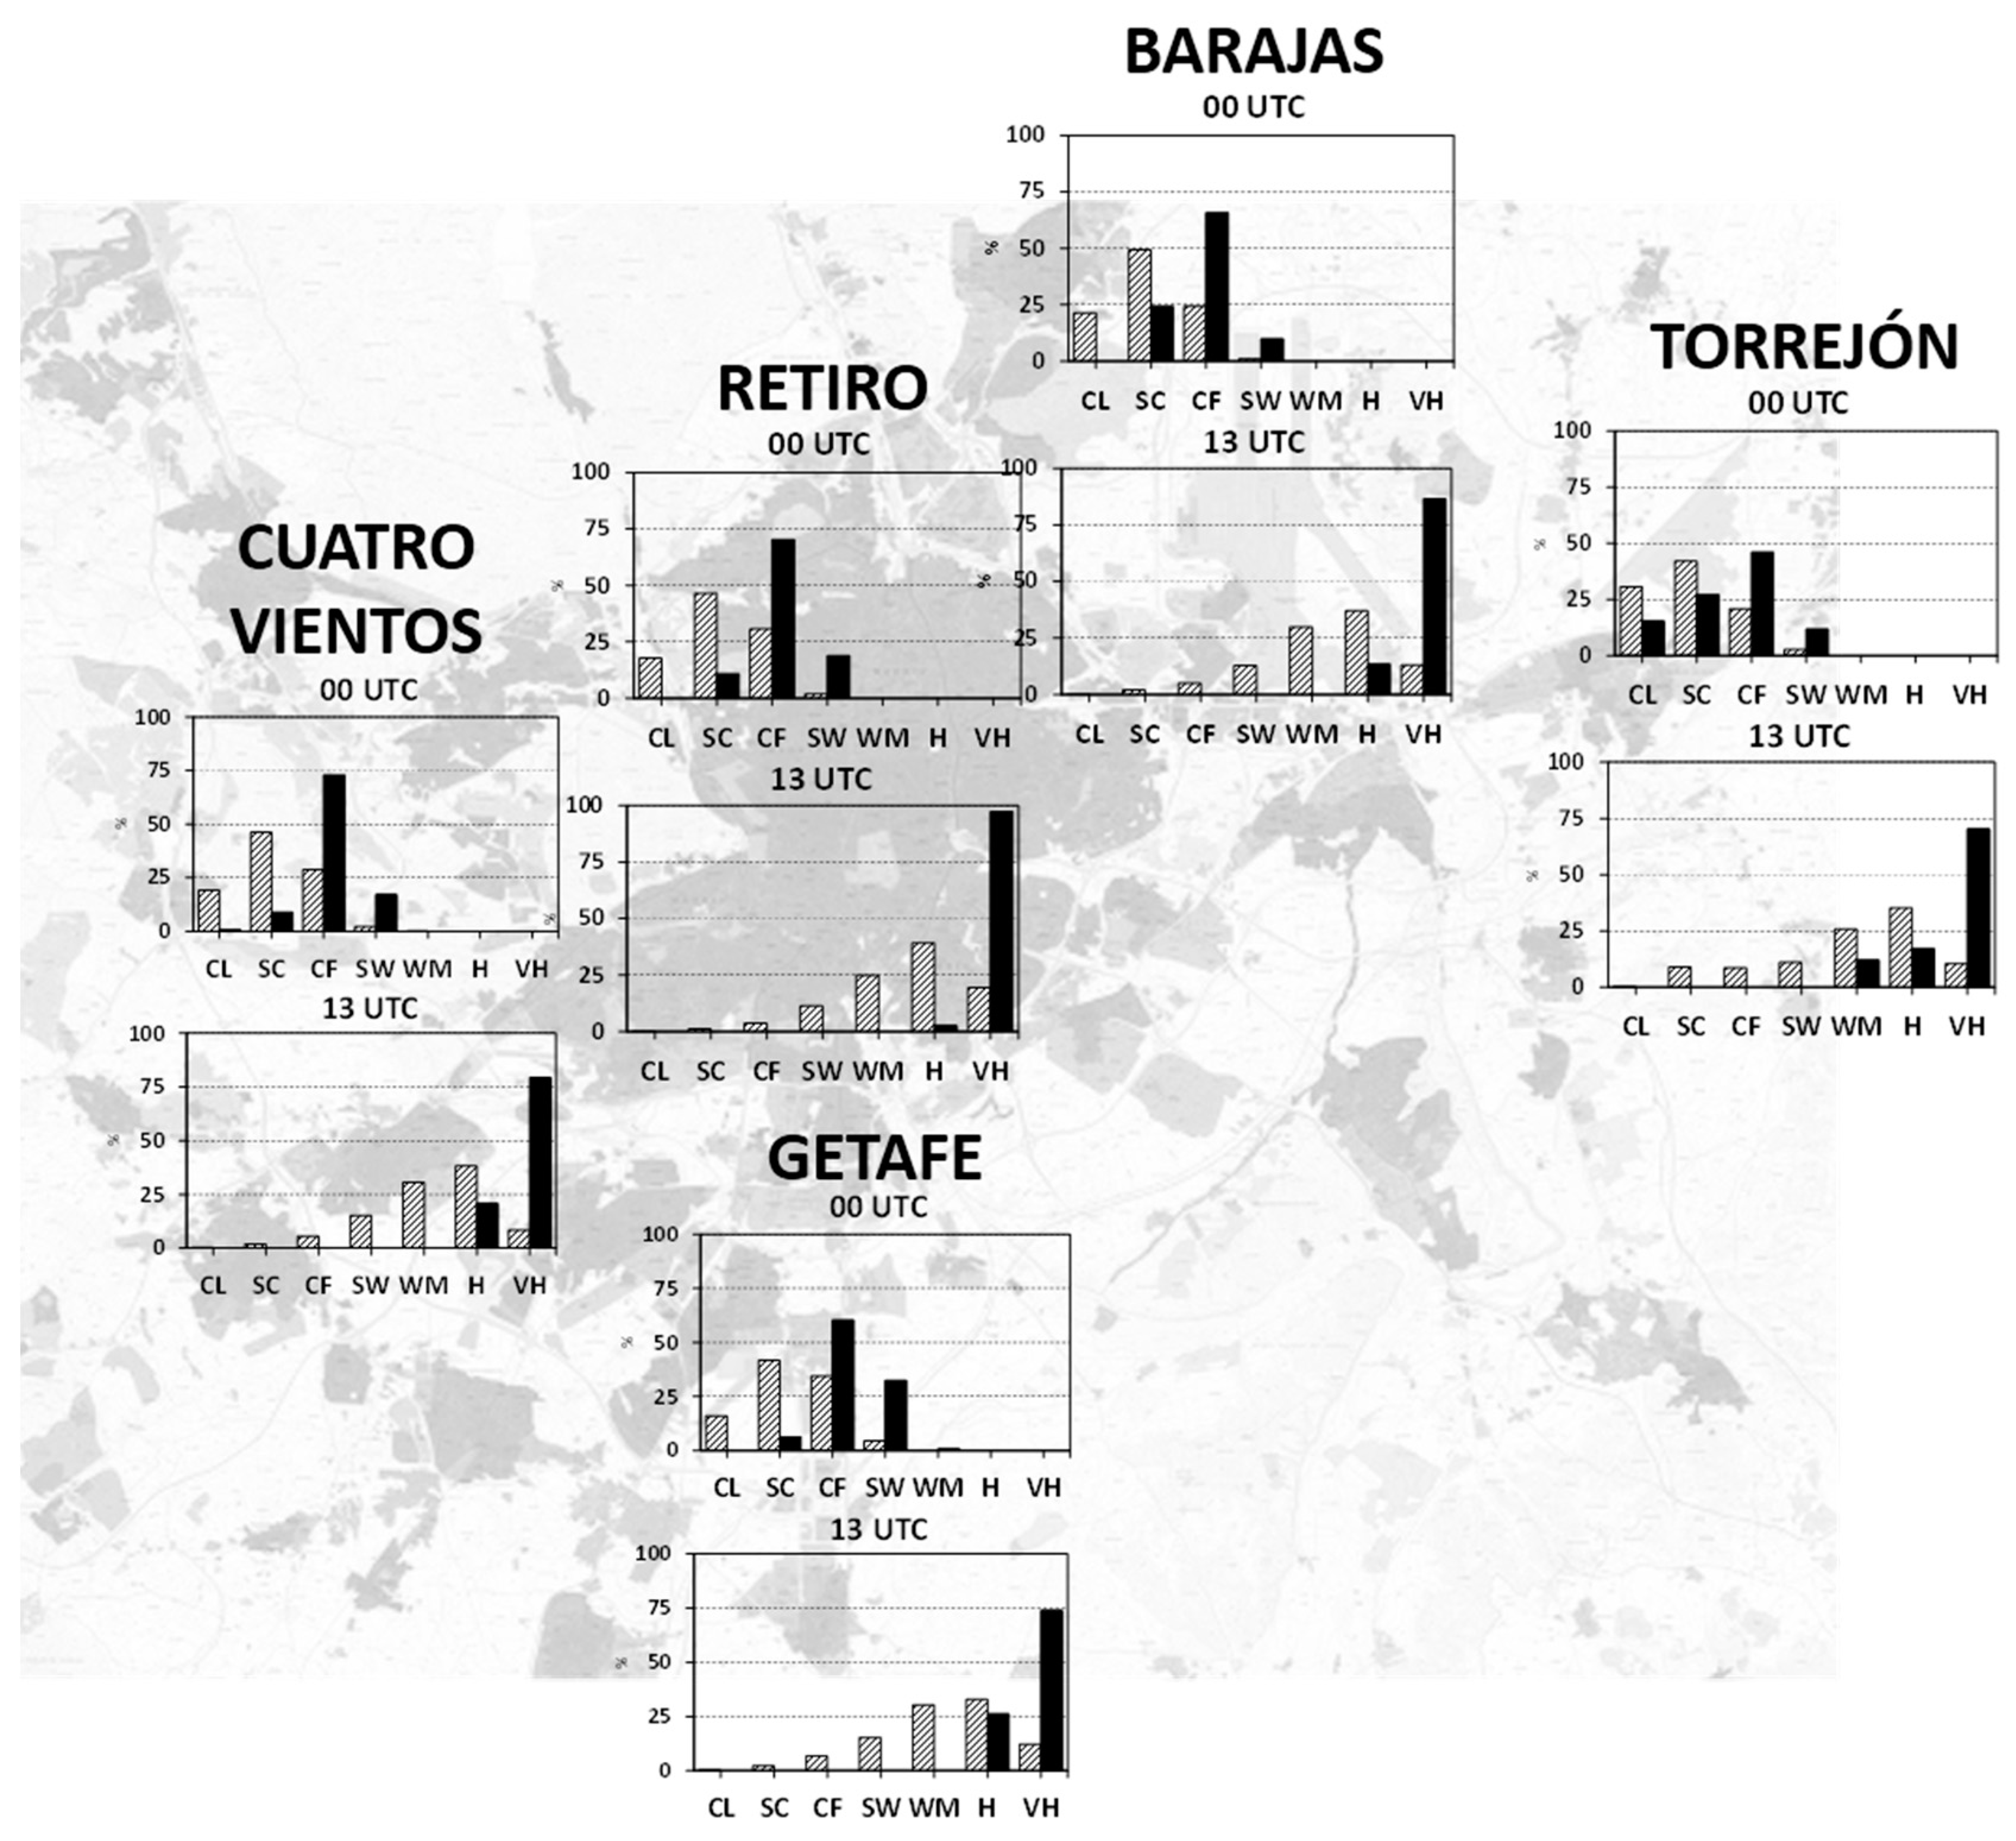
3.2.3. Physiologic Urban Heat Island
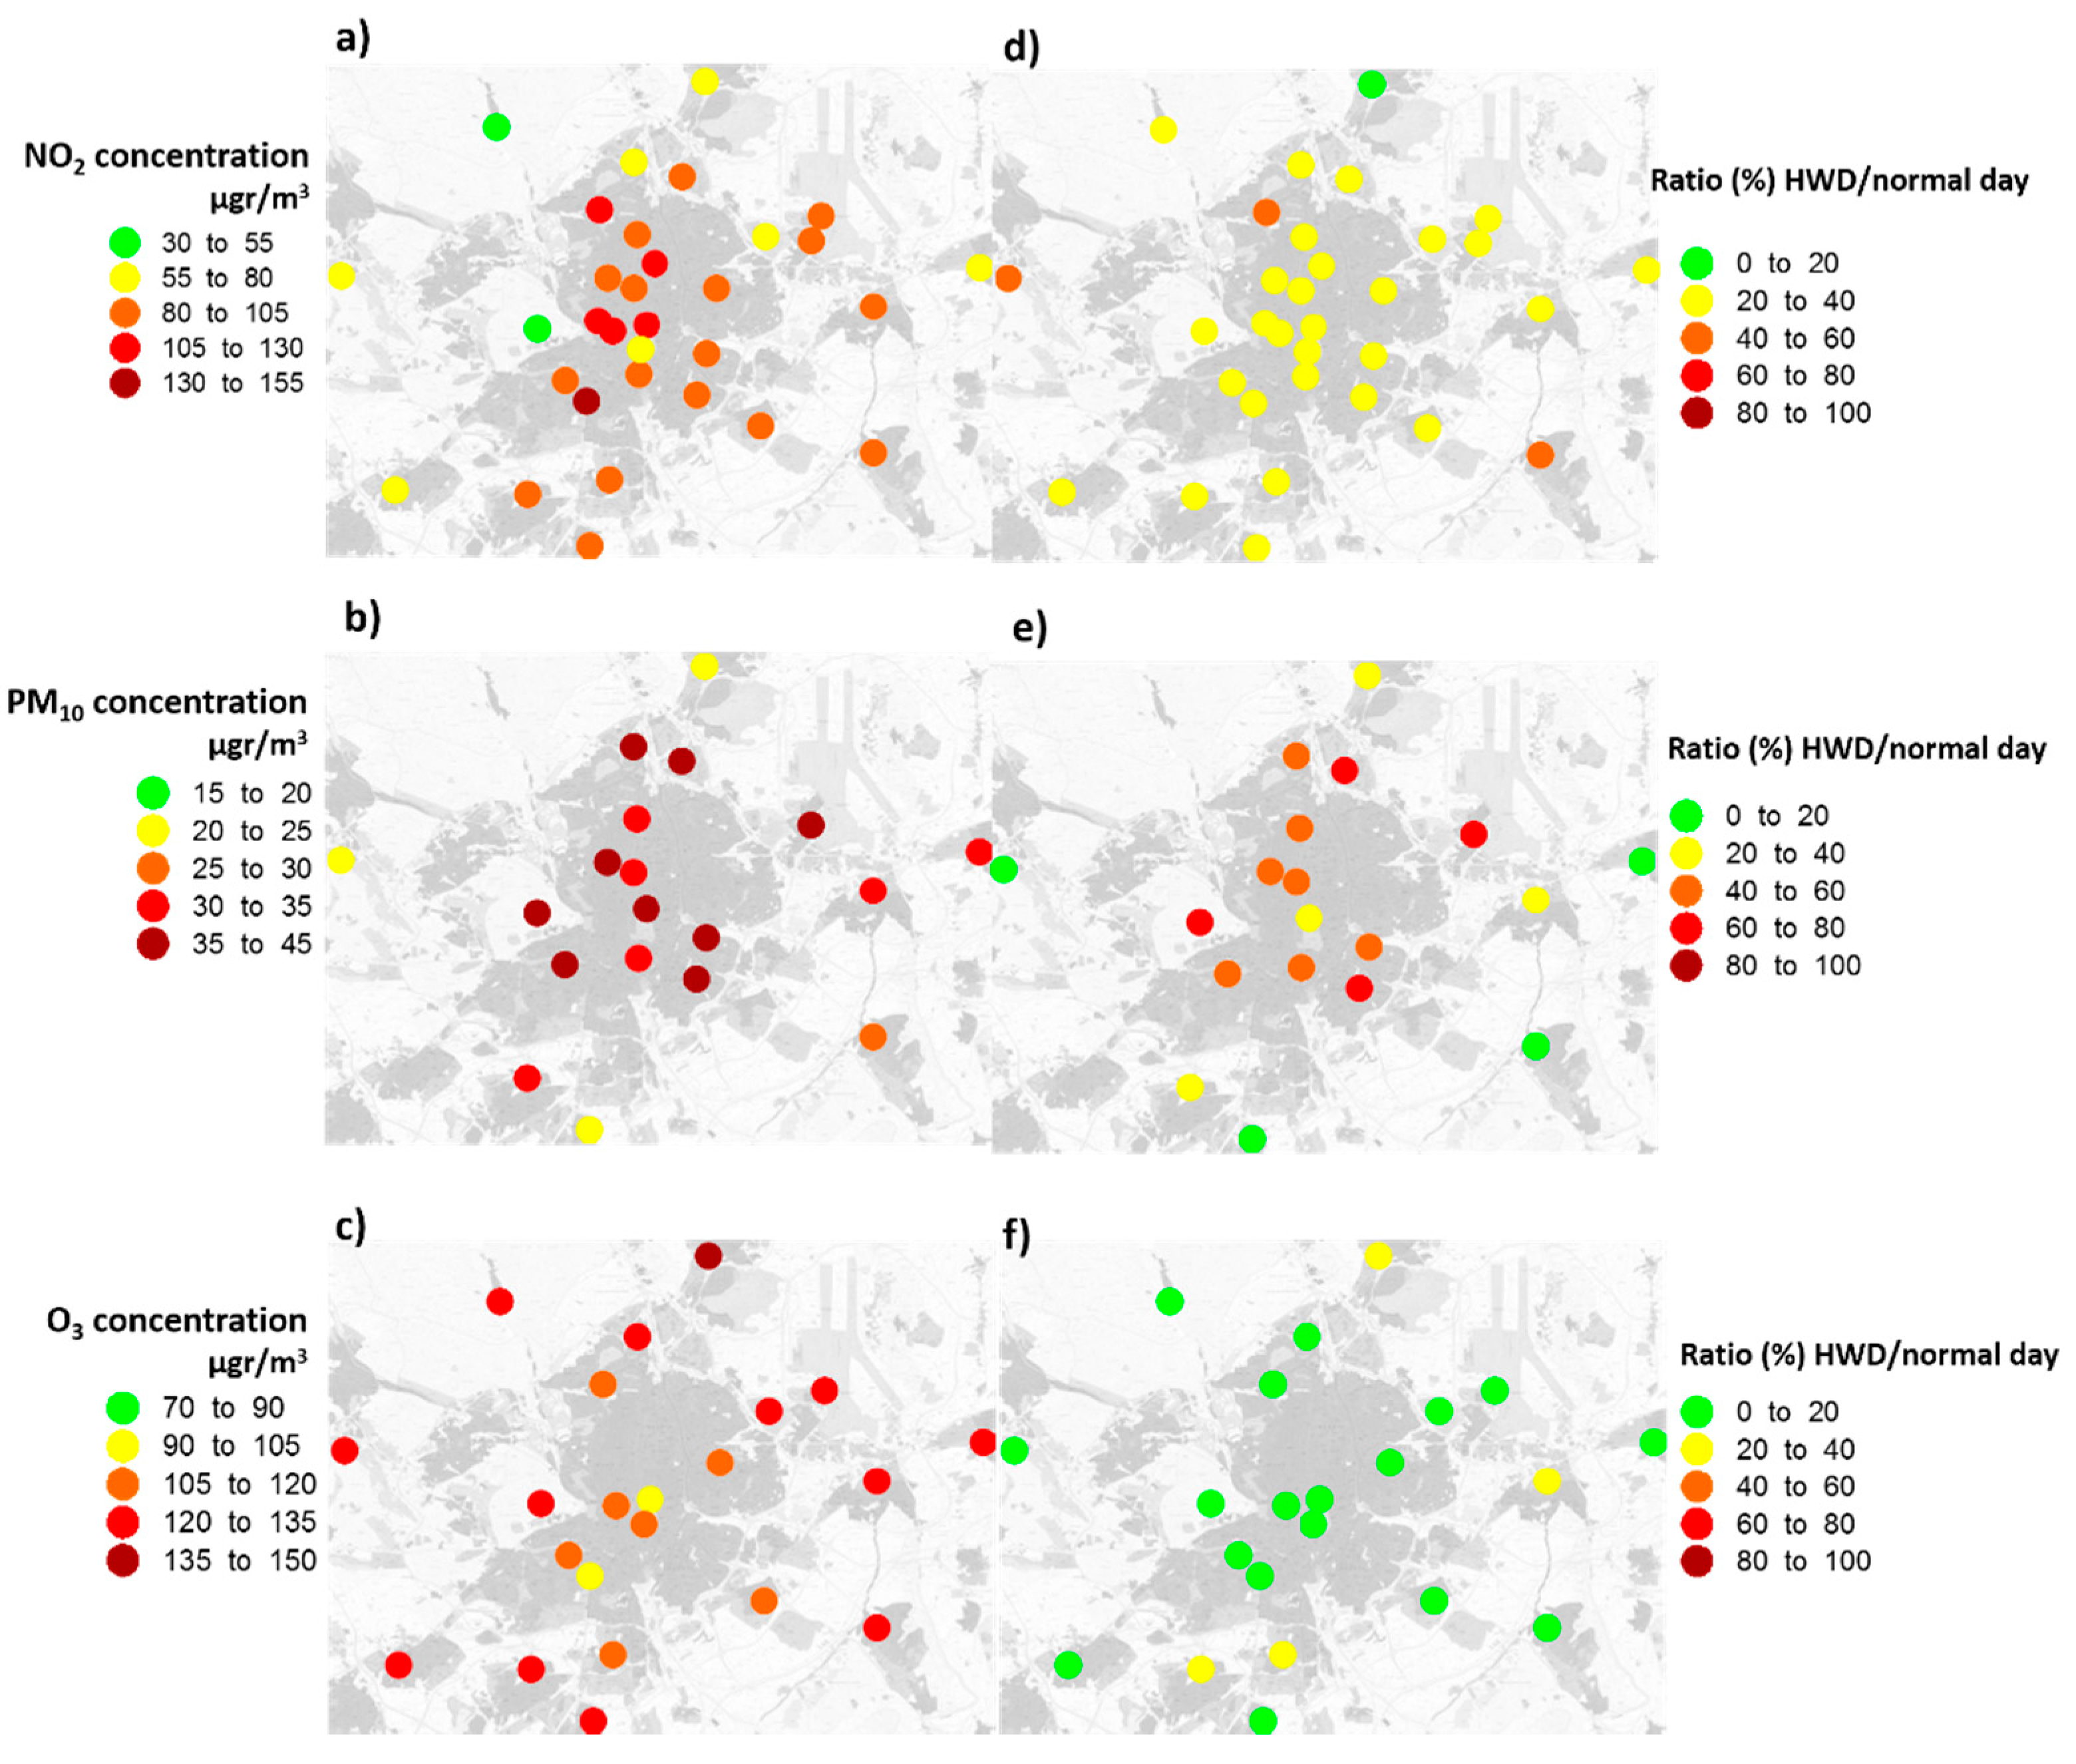
3.3. Air Quality During Heat Waves
4. Discussion and Conclusions
Author Contributions
Funding
Acknowledgments
Conflicts of Interest
References
- Schär, C.; Vidale, P.L.; Luthi, D.; Frei, C.; Haberli, C.; Liniger, M.A.; Appenzeller, C. The role of increasing temperature variability in European summer heat waves. Nature 2004, 427, 332–336. [Google Scholar] [CrossRef] [PubMed]
- Zampieri, M.; Russo, S.; Di Sabatino, S.; Michetti, M.; Scoccimarro, E.; Gualdi, S. Global assessment of heat wave magnitudes from 1901 to 2010 and implications for the river discharge of the Alps. Sci. Total Environ. 2016, 571, 1330–1339. [Google Scholar] [CrossRef]
- Meelh, G.A.; Tebaldi, C. More Intense, more frequent, and longer lasting heat waves in the 21st century. Science 2004, 305, 994–997. [Google Scholar] [CrossRef]
- Tebaldi, C.; Hayhoe, K.; Arblaster, J.M.; Meehl, G.A. Going to extremes. Clim. Chang. 2006, 79, 185–211. [Google Scholar] [CrossRef]
- Gedzelman, S.D.; Austin, S.; Cermak, R.; Stefano, N.; Partridge, S.; Quesenberry, S.; Robinson, D.A. Mesoscale aspects of the Urban Heat Island around New York City. Theor. Appl. Climatol. 2003, 75, 29–42. [Google Scholar]
- Lokoshchenko, M.A. Urban ‘heat island’ in Moscow. Urb. Clim. 2014, 10, 550–562. [Google Scholar] [CrossRef]
- Wilby, R. Past and projected trends in London’s urban heat island. Weather 2006, 58, 251–260. [Google Scholar] [CrossRef]
- Oke, T.R. The energetic basis of the urban heat island. Q. J. R. Met. Soc. 1982, 108, 1–24. [Google Scholar] [CrossRef]
- Arnfield, A.J. Two decades of urban climate research: A review of turbulence, exchanges of energy and water, and the urban heat island. Int. J. Climatol. 2003, 23, 1–26. [Google Scholar] [CrossRef]
- Basu, R.; Samet, J.M. Relation between elevated ambient temperature and mortality: A review of the epidemiologic evidence. Epidemiol. Rev. 2002, 24, 190–202. [Google Scholar] [CrossRef]
- Conti, S.; Meli, P.; Minelli, G.; Solimini, R.; Toccaceli, V.; Vichi, M.; Beltrano, C.; Perini, L. Epidemiologic study of mortality during the summer 2003 heat wave in Italy. Environ. Res. 2005, 98, 390–399. [Google Scholar] [CrossRef]
- Tan, J.; Zheng, Y.; Tang, X.; Guo, C.; Li, L.; Song, G.; Zhen, X.; Yuan, D.; Kalkstein, A.J.; Chen, H. The urban heat island and its impact on heat waves and human health in Shanghai. Int. J. Biometeorol. 2010, 54, 101–112. [Google Scholar] [CrossRef]
- Smid, M.; Russo, S.; Costa, A.C.; Granell, C.; Pebesma, E. Ranking European Capitals by Exposure to Heat Waves and Cold Waves. Urban. Clim. 2019, 27, 388–402. [Google Scholar] [CrossRef]
- Kovats, R.S.; Valentini, R.; Bouwer, L.M.; Georgopoulou, E.; Jacob, D.; Martin, E.; Rounsevell, M.; Soussana, J.-F. Europe. In Climate Change 2014: Impacts, Adaptation, and Vulnerability Part B: Regional Aspects. Contribution of Working Group II to the Fifth Assessment Report of the Intergovernmental Panel on Climate Change; Barros, V.R., Field, C.B., Dokken, D.J., Mastrandrea, M.D., Mach, K.J., Bilir, T.E., Chatterjee, M., Ebi, K.L., Estrada, Y.O., Genova, R.C., et al., Eds.; Cambridge University Press: Cambridge, UK; New York, NY, USA, 2014; pp. 1267–1326. [Google Scholar]
- Scortichini, M.; De Sario, M.; de’Donato, F.K.; Davoli, M.; Michelozzi, P.; Stafoggia, M. Short-Term Effects of Heat on Mortality and Effect Modification by Air Pollution in 25 Italian Cities. Int. J. Environ. Res. Public Health 2018, 15, 1771. [Google Scholar] [CrossRef]
- Tomlinson, C.J.; Chapman, L.; Thornes, J.E.; Baker, C.J. Including the urban heat island in spatial heat health risk assessment strategies: A case study for Birmingham, UK. Int. J. Health. Geogr. 2011, 10. [Google Scholar] [CrossRef]
- Rizwan, A.; Dennis, L.; Liu, C. A review on the generation, determination and mitigation of Urban Heat Island. J. Environ. Sci. 2008, 20, 120–128. [Google Scholar] [CrossRef]
- Mills, G. Urban climatology: History, status and prospects. Urban. Clim. 2014, 10, 479–489. [Google Scholar] [CrossRef]
- Stewart, I.D. A systematic review and scientific critique of methodology in modern urban heat island literature. Int. J. Climatol. 2011, 31, 200–217. [Google Scholar] [CrossRef]
- Laaidi, K.; Zeghnoun, A.; Dousset, B.; Bretin, P.; Vandentorren, S.; Giraudet, E.; Beaudeau, P. The Impact of heat Islands on Mortality in Paris during the August 2003 Heat Wave. Environ. Health Perspect. 2012, 120, 254–259. [Google Scholar] [CrossRef]
- Lehoczky, A.; Sobrino, J.A.; Skoković, D.; Aguilar, E. The Urban Heat Island Effect in the City of Valencia: A Case Study for Hot Summer Days. Urban Sci. 2017, 1, 9. [Google Scholar] [CrossRef]
- Cheval, S.; Dumitrescu, A. The summer surface urban heat island of Bucharest (Romania) retrieved from MODIS images. Theor. Appl. Climatol. 2015, 121, 631–640. [Google Scholar] [CrossRef]
- Mendelsohn, R.; Kurukulasuriya, P.; Basist, A.; Kogan, F.; Williams, C. Climate analysis with satellite versus weather station data. Clim. Chang. 2007, 81, 71–83. [Google Scholar] [CrossRef]
- Fanger, P.O. Thermal Comfort; McGraw-Hill: New York, NY, USA, 2008. [Google Scholar]
- Koppe, C.; Kovats, S.; Jendritzky, G.; Menne, B. Heat-Waves: Risks and Responses. In Health and Global Environmental Change; WHO Series N° 2; WHO: Copenhagen, Denmark, 2004; 123p, Available online: http://www.euro.who.int/en/publications/abstracts/heat-waves-risks-and-responses (accessed on 5 November 2018).
- Höppe, P.R. Heat balance modelling. Experientia 1993, 49, 741–745. [Google Scholar] [CrossRef]
- VDI. Methods for the Human-Biometeorological Assessment of Climate and Air Hygiene for Urban and Regional Planning. Part I: Climate; VDI Guideline 3787; Beuth/Verlag: Berlin, Germany, 1998; Available online: https://www.vdi.eu/guidelines/vdi_3787_blatt_2-umweltmeteorologie_methoden_zur_human_biometeorologischen_bewertung_von_klima_und_lufthygiene/ (accessed on 5 November 2018).
- Kalisa, E.; Fadlallah, S.; Amani, M.; Nahayo, L.; Habiyaremye, G. Temperature and air pollution relationship during heatwaves in Birmingham, UK. Sustain. Cities Soc. 2018, 43, 111–120. [Google Scholar] [CrossRef]
- Schnell, J.L.; Prather, M.J. Co-occurrence of extremes in surface ozone, particulate matter, and temperature over eastern North America. Proc. Natl. Acad. Sci. USA 2017, 114, 2854–2859. [Google Scholar] [CrossRef]
- Zhang, H.; Wang, Y.; Park, T.; Deng, Y. Quantifying the relationship between extreme air pollution events and extreme weather events. Atmos. Res. 2017, 188, 64–79. [Google Scholar] [CrossRef]
- Kerr, G.H.; Waugh, D.W. Connections between summer air pollution and stagnation. Environ. Res. Lett. 2018, 13, 084001. [Google Scholar] [CrossRef]
- Wang, Y.; Xie, Y.; Cai, L.; Dong, W.; Zhang, Q.; Zhang, L. Impact of the 2011 southern US drought on ground-level Fine aerosol concentration in summertime. J. Atmos. Sci. 2015, 72, 1075–1093. [Google Scholar] [CrossRef]
- Wang, Y.; Xie, Y.; Dong, W.; Ming, Y.; Wang, J.; Shen, L. Adverse effects of increasing drought on air quality via natural processes. Atmos. Chem. Phys. 2017, 17, 12827–12843. [Google Scholar] [CrossRef]
- INE. Cifras Oficiales de Población Resultantes de la Revisión del Padrón Municipal a 1 de Enero. Available online: https://www.ine.es/jaxiT3/Datos.htm?t=2881 (accessed on 5 October 2018).
- Dirección General de Tráfico. Available online: http://www.dgt.es/es/seguridad-vial/estadisticas-e-indicadores/parque-vehiculos/tablas-estadisticas/2017/ (accessed on 25 November 2018).
- Ayuntamiento de Madrid. Available online: https://www.madrid.es/portales/munimadrid/es/Inicio/El-Ayuntamiento/Estadistica/Areas-de-informacion-estadistica/Trafico-transportes-y-comunicaciones/Intensidad-trafico/Intensidad-del-trafico/?vgnextfmt=default&vgnextoid=b3c644c95c9b8210VgnVCM2000000c205a0aRCRD&vgnextchannel=b355bc87e8986210VgnVCM2000000c205a0aRCRD (accessed on 25 November 2018).
- Brunet, M.; Saladié, O.; Jones, P.; Sigró, J.; Aguilar, E.; Moberg, A.; Lister, D.; Walther, A.; Almarza, C. The development of a new dataset of Spanish Daily Adjusted Temperature Series (SDATS) (1850–2003). Int. J. Climatol. 2006, 26, 1777–1802. [Google Scholar] [CrossRef]
- Pongracz, R.; Bartholy, J.; Dezso, Z. Remotely sensed thermal information applied to urban climate analysis. Adv. Space Res. 2006, 37, 2191–2196. [Google Scholar] [CrossRef]
- Cheval, S.; Dumitrescu, A.; Bell, A. The urban heat island of Bucharest during the extreme high temperatures of July 2007. Theor. Appl. Climatol. 2009, 97, 391–401. [Google Scholar] [CrossRef]
- Hung, T.; Uchihama, D.; Ochi, S.; Yasuoka, Y. Assessment with satellite data of the urban heat island effects in Asian mega cities. Int. J. App. Earth. Obs. Geoinf. 2006, 8, 34–48. [Google Scholar] [CrossRef]
- Wan, Z.; Zhang, Y.; Zhang, Y.Q.; Li, Z.L. Quality assessment and validation of the global land surface temperature. International. J. Remote Sens. 2004, 25, 261–274. [Google Scholar] [CrossRef]
- Rigo, G.; Parlow, E.; Oesch, D. Validation of satellite observed thermal emission with in-situ measurements over an urban surface. Remote Sens. Environ. 2006, 104, 201–210. [Google Scholar] [CrossRef]
- European Commission, Joint Research Center. Available online: http://forobs.jrc.ec.europa.eu/products/glc2000/glc2000.php (accessed on 1 December 2018).
- Portal Abierto de Datos. Ayuntamiento de Madrid. Available online: https://datos.madrid.es/portal/site/egob/menuitem.c05c1f754a33a9fbe4b2e4b284f1a5a0/?vgnextoid=f3c0f7d512273410VgnVCM2000000c205a0aRCRD&vgnextchannel=374512b9ace9f310VgnVCM100000171f5a0aRCRD&vgnextfmt=defaultURL (accessed on 16 January 2019).
- Red de Calidad del Aire de la Comunidad de Madrid. Available online: https://gestiona.madrid.org/azul_internet/html/web/InformExportacionAccion.icm?ESTADO_MENU=8 (accessed on 16 January 2019).
- Histórico de Informes de Episodios Naturales. Available online: https://www.miteco.gob.es/es/calidad-y-evaluacion-ambiental/temas/atmosfera-y-calidad-del-aire/calidad-del-aire/evaluacion-datos/fuentes-naturales/anuales.aspx (accessed on 16 January 2019).
- Stewart, I.D.; Oke, T.R. Local Climate Zones for urban temperature studies. Bull. Am. Meteorol. Soc. 2012, 93, 1879–1900. [Google Scholar] [CrossRef]
- Russo, S.; Sillmann, J.; Fischer, E.M. Top ten European heatwaves since 1950 and their occurrence in the coming decades. Environ. Res. Lett. 2015, 10, 124003. [Google Scholar] [CrossRef]
- Díaz, J.L.; García-Herrera, R.; Trigo, R.M.; Linares, C.; Valente, M.A.; De Miguel, J.M.; Hernández, E. The impact of the summer 2003 heat wave in Iberia: How should we measure it? Int. J. Biometeorol. 2006, 50, 159–166. [Google Scholar] [CrossRef]
- Montero, J.C.; Miron, I.J.; Criado, J.J.; Linares, C.; Díaz, J. Difficulties of defining the term, “heat wave”, in public health. Int. J. Environ. Health Res. 2013, 23, 377–379. [Google Scholar] [CrossRef]
- Díaz, J.L.; Jordán, A.; García, R.; López, C.; Alberdi, J.C.; Hernández, E.; Otero, A. Heat waves in Madrid 1986-1997: Effects on the health of the elderly. Int. Arch. Occup. Environ. Health 2002, 75, 163–170. [Google Scholar] [CrossRef]
- García–Herrera, R.; Díaz, J.; Trigo, R.M.; Hernández, F. Extreme summer temperatures in Iberia: Health impacts and associated synoptic conditions. Ann. Geophys. 2005, 23, 239–251. [Google Scholar] [CrossRef]
- Linares, C.; Díaz, J. Impact of high temperatures on hospital admissions: Comparative analysis with previous studies about mortality (Madrid). Eur. J. Public Health 2008, 18, 317–322. [Google Scholar] [CrossRef] [PubMed]
- ETCCDI Core Climate Indices. Available online: http://www.climdex.org/indices.html (accessed on 15 January 2018).
- Höppe, P. The physiological equivalent temperature—A universal index for the biometeorological assessment of the thermal environment. Int. J. Biometeorol. 1999, 43, 71–75. [Google Scholar] [CrossRef] [PubMed]
- Matzarakis, A.; Mayer, H.; Iziomon, M.G. Applications of a universal thermal index: Physiological equivalent temperature. Int. J. Biometeorol. 1999, 43, 76–84. [Google Scholar] [CrossRef]
- Mayer, H.; Höppe, P. Thermal comfort on man in different urban environments. Theor. Appl. Climat. 1987, 38, 43–49. [Google Scholar] [CrossRef]
- Matzarakis, A.; Mayer, H. Heat stress in Greece. Int. J. Biometeorol. 1997, 41, 34–39. [Google Scholar] [CrossRef]
- Murena, F. Measuring air quality over large urban areas: Development and application of an air pollution index at the urban area of Naples. Atmos. Environ. 2004, 38, 6195–6202. [Google Scholar] [CrossRef]
- Sánchez-Benítez, A.; García-Herrera, R.; Barriopedro, D.; Sousa, P.M.; Trigo, R.M. The Earliest European Summer Mega-heatwave of Reanalysis Period. Geophys. Res. Lett. 2018, 45, 1955–1962. [Google Scholar] [CrossRef]
- Peña-Ortiz, C.; Barriopedro, D.; García-Herrera, R. Multidecadal Variability of the Summer Length in Europe. J. Clim. 2015, 28, 5375–5388. [Google Scholar] [CrossRef]
- Querol, X.; Alastuey, A.; Moreno, T.; Viana, M.M.; Castillo, S.; Pey, J.; Rodríguez, S.; Artiñano, B.; Salvador, P.; Sánchez, M.; et al. Spatial and temporal variations in airborne particulate matter (PM10 and PM2.5) across Spain 1999–2005. Atmos. Environ. 2008, 42, 3964–3979. [Google Scholar] [CrossRef]
- Salvador, P.; Artíñano, B.; Viana, M.M.; Querol, X.; Alastuey, A.; González-Fernández, I.; Alonso, R. Spatial and temporal variations in PM10 and PM2.5 across Madrid metropolitan area in 1999–2008. Proc. Environ. Sci. 2011, 4, 198–208. [Google Scholar] [CrossRef]
- Abaurrea, J.; Asín, J.; Cebrián, A.C.; Centelles, A. Modeling and forecasting extreme hot events in the central Ebro valley, a continental-Mediterranean area. Glob. Planet. Chang. 2007, 57, 43–58. [Google Scholar] [CrossRef]
- Nastos, P.T. and Matzarakis, A. Variability of tropical days over Greece within the second half of the twentieth century. Theor. Appl. Climatol. 2008, 93, 75–89. [Google Scholar] [CrossRef]
- Shevchenko, O.; Lee, H.; Snizhko, S.; Mayer, H. Long–term analysis of heat waves in Ukraine. Int. J. Climatol. 2014, 34, 1642–1650. [Google Scholar] [CrossRef]
- Unkaševic, M.; Tošic, I. Seasonal analysis of cold and heat waves in Serbia during the period 1949–2012. Theor. Appl. Climatol. 2015, 120, 29–40. [Google Scholar] [CrossRef]
- Ramos, A.M.; Trigo, R.M.; Santo, F.E. Evolution of extreme temperatures over Portugal: Recent changes and future scenarios. Clim. Res. 2011, 48, 177–192. [Google Scholar] [CrossRef]
- Kyselý, J. Recent severe heat waves in central Europe: How to view them in a long–term prospect? Int. J. Climatol. 2010, 30, 89–109. [Google Scholar] [CrossRef]
- Tomczyk, A.M.; Półrolniczak, M.; Bednorz, E. Circulation conditions effect on the occurrence of heat waves in Western and Southwestern Europe. Atmosphere 2017, 8, 31. [Google Scholar] [CrossRef]
- Li, D.; Bou-Zeid, E. Synergistic interactions between urban heat islands and heat waves: The impact in cities is larger than the sum of its parts. J. Appl. Meteorol. Climatol. 2013, 52, 2051–2064. [Google Scholar] [CrossRef]
- Li, D.; Sun, T.; Liu, M.; Yang, L.; Wang, L.; Gao, Z. Contrasting responses of urban and rural surface energy budgets to heat waves explain synergies between urban heat islands and heatwaves. Environ. Res. Lett. 2015, 10, 054009. [Google Scholar] [CrossRef]
- Li, D.; Sun, T.; Liu, M.; Wang, L.; Gao, Z. Changes in wind speed under heat waves enhance urban heat islands in the Beijing Metropolitan Area. J. Appl. Meteorol. Climatol. 2016, 55, 2369–2371. [Google Scholar] [CrossRef]
- Founda, D.; Pierros, F.; Petrakis, M.; Zerefos, C. Inter-decadal variations and trends of the Urban Heat Island in Athens (Greece) and its response to heat waves. Atmos. Res. 2015, 161–162, 1–13. [Google Scholar] [CrossRef]
- Schatz, J.; Kucharik, C.J. Urban climate efects on extreme temperatures in Madison, Wisconsin, USA. Environ. Res. Lett. 2015, 10, 094024. [Google Scholar] [CrossRef]
- Scott, A.; Waugh, D.W.; Zaitchik, B.F. Reduced Urban Heat Island intensity under warmer conditions. Environ. Res. Lett. 2018, 13. [Google Scholar] [CrossRef]
- Founda, D.; Santamouris, M. Synergies between Urban Heat Island and Heat Waves in Athens (Greece), during an extremely hot summer. Sci. Rep. 2017, 7, 10973. [Google Scholar] [CrossRef]
- Zhao, l.; Oppenheimer, M.; Zhu, Q.; Baldwin, J.W.; Ebi, K.L.; Bou-Zeid, E.; Guan, K.; Liu, L. Interactions between urban heat islands and heat waves. Environ. Res. Lett. 2018, 13. [Google Scholar] [CrossRef]
- Zhao, L.; Lee, X.; Smith, R.B.; Oleson, K. Strong contributions of local background climate to urban heat islands. Nature 2014, 511, 216–219. [Google Scholar] [CrossRef]
- Wilby, R.L. Constructing climate change scenarios of urban heat island intensity and air quality. Environ. Plan. B Plan. Des. 2008, 35, 902–911. [Google Scholar] [CrossRef]
- Sachindra, D.A.; Ng, A.; Muthukumaran, S.; Perera, B.J.C. Impact of Climate Change on Urban Heat Island Effect and Extreme Temperatures: A Case Study. Q. J. R. Met. Soc. 2016, 142, 172–186. [Google Scholar] [CrossRef]
- McCarthy, M.P.; Harpham, C.; Goodess, C.M.; Jones, P.D. Simulating climate change in UK cities using a regional climate model, HadRM3. Int. J. Climatol. 2011, 32, 1875–1888. [Google Scholar] [CrossRef]
- Schwarz, N.; Lautenbach, S.; Seppelt, R. Exploring indicators for quantifying surface urban heat islands of European cities with MODIS land surface temperatures. Remote Sens. Environ. 2011, 115, 3175–3186. [Google Scholar] [CrossRef]
- Zhou, D.; Zhao, S.; Liu, S.; Zhang, L.; Zhu, C. Surface urban heat island in China’s 32 major cities: Spatial patterns and drivers. Remote Sens. Environ. 2014, 152, 51–61. [Google Scholar] [CrossRef]
- Yang, Q.; Huang, X.; Li, J. Assessing the relationship between surface urban heat islands and landscape patterns across climatic zones in China. Sci. Rep. 2017, 7, 9337. [Google Scholar] [CrossRef]
- López Gómez, A.; López Gómez, J.; Fernández, F.; Moreno, A. El Clima Urbano. Teledetección de la isla de Calor en Madrid; Ministerio de Obras Públicas y Transportes: Madrid, Spain, 1993. [Google Scholar]
- Sobrino, J.A.; Oltra-Carrió, R.; Sòria, G.; Jiménez-Muñoz, J.C.; Franch, B.; Hidalgo, C.; Mattar, Y.; Julien, J.C.; Romaguera, M.; Gómez, J.A.; et al. Evaluation of the surface urban heat island effect in the city of Madrid by thermal remote sensing. Int. J. Remote Sens. 2013, 34, 3177–3192. [Google Scholar] [CrossRef]
- Xiao, H.; Kopecká, M.; Guo, S.; Guan, Y.; Cai, D.; Zhang, C.; Zhang, X.; Yao, W. Responses of Urban Land Surface Temperature on Land Cover: A Comparative Study of Vienna and Madrid. Sustainability 2018, 10, 260. [Google Scholar] [CrossRef]
- García Herrera, R.; Prieto, L.; Díaz, J.; Hernández, E.; Teso, T. Synoptic conditions leading to extremely high temperatures in Madrid. Annal. Geophys. 2002, 20, 237–245. [Google Scholar] [CrossRef][Green Version]
- Gabriel, K.M.A.; Endlicher, W.R. Urban and rural mortality rates during heat waves in Berlin and Brandenburg, Germany. Environ. Pollut. 2011, 159, 2044–2050. [Google Scholar] [CrossRef]
- Royé, D. The effects of hot nights on mortality in Barcelona, Spain. Int. J. Biometeorol. 2017, 61, 2127–2140. [Google Scholar] [CrossRef]
- Vineis, P. Climate change and the diversity of its health effects. Int. J. Public Health 2010, 55, 81–82. [Google Scholar] [CrossRef]
- Zander, K.K.; Botzen, W.J.W.; Oppermann, E.; Kjellstrom, T.; Garnett, S.T. Heat stress causes substantial labour productivity loss in Australia. Nat. Clim. Chang. 2015, 5, 647–651. [Google Scholar] [CrossRef]
- Díaz, J.; Linares, C.; García-Herrera, R.; López, C.; Trigo, R. Impact of temperature and air pollution on the mortality of children in Madrid. J. Occup. Environ. Med. 2004, 46, 768–774. [Google Scholar] [CrossRef]
- Díaz, J.; López, A.; Carmona, R.; Mirón, J.; Luna, M.Y.; Linares, C. Short-term effect of heat waves on hospital admissions in Madrid: Analysis by gender and comparison with previous findings. Environ. Pollut. 2018, 243, 1648–1656. [Google Scholar] [CrossRef] [PubMed]
- Reyes, M.; Díaz, J.; Tobias, A.; Montero, J.C.; Linares, C. Impact of Saharan dust particles on hospital admissions in Madrid (Spain). Int. J. Environ. Health Res. 2014, 24, 63–72. [Google Scholar] [CrossRef]
- López-Bueno, J.A.; Díaz, J.; Linares, C. Differences in the impact of heat waves according to urban and peri-urban factors in Madrid. Int. J. Biometeorol. 2019, 63, 371–380. [Google Scholar] [CrossRef]
- Díaz, J.; Carmona, R.; Mirón, I.J.; Ortiz, C.; León, I.; Linares, C. Geographical variation in relative risks associated with heat: Update of Spain’s Heat Wave Prevention Plan. Environ. Int. 2015, 85, 273–283. [Google Scholar] [CrossRef]


| Station | WMO Code | Latitude | Longitude | Altitude | Period | LCZ 1 |
|---|---|---|---|---|---|---|
| Barajas | 8221 | 40.494 N | 3.567 E | 609 | 1961–2017 | 8/D |
| Madrid-Retiro | 8222 | 40.417 N | 3.683 E | 667 | 1880–2017 | 2/B |
| Cuatro Vientos | 8223 | 40.371 N | 3.785 E | 691 | 1961–2017 | 5/D |
| Getafe | 8224 | 40.294 N | 3.724 E | 618 | 1961–2017 | 6/D |
| Torrejón de Ardoz | 8227 | 40.497 N | 3.446 E | 617 | 1961–2017 | 8/D |
| PET | Thermal Sensation | Physiological Stress Level |
|---|---|---|
| <4 | Very cold | Extreme cold stress |
| 8 | Cold | Strong cold stress |
| 13 | Cool | Moderate cold stress |
| 18 | Slightly cool | Slight cold stress |
| 23 | Comfortable | No thermal stress |
| 29 | Slightly warm | Slight heat stress |
| 35 | Warm | Moderate heat stress |
| 41 | Hot | Strong heat stress |
| >41 | Very hot | Extreme heat stress |
| Pollution Category | PI | PM10 24-h Average (μg·m−3) | NO2 24-h Max. (μg·m−3) | O3 8-h Daily Max. (μg·m−3) |
|---|---|---|---|---|
| Unhealthy | 100 | 500 | 1900 | 500 |
| Unhealthy for sensitive groups | 85 | 238 | 950 | 223 |
| Moderate pollution | 70 | 144 | 400 | 180 |
| Low pollution | 50 | 50 | 200 | 120 |
| Good quality | 25 | 20 | 40 | 65 |
| Non Outbreak Days | Saharan Outbreak Days | |
|---|---|---|
| Non heat wave days | 486 | 233 |
| Heat waves days | 20 | 54 |
| Chi-Square test | 47.81 * | |
| Stations experiencing PM10 daily exceedances (% of the total) | 28.65 | 51.53 |
© 2019 by the authors. Licensee MDPI, Basel, Switzerland. This article is an open access article distributed under the terms and conditions of the Creative Commons Attribution (CC BY) license (http://creativecommons.org/licenses/by/4.0/).
Share and Cite
Rasilla, D.; Allende, F.; Martilli, A.; Fernández, F. Heat Waves and Human Well-Being in Madrid (Spain). Atmosphere 2019, 10, 288. https://doi.org/10.3390/atmos10050288
Rasilla D, Allende F, Martilli A, Fernández F. Heat Waves and Human Well-Being in Madrid (Spain). Atmosphere. 2019; 10(5):288. https://doi.org/10.3390/atmos10050288
Chicago/Turabian StyleRasilla, Domingo, Fernando Allende, Alberto Martilli, and Felipe Fernández. 2019. "Heat Waves and Human Well-Being in Madrid (Spain)" Atmosphere 10, no. 5: 288. https://doi.org/10.3390/atmos10050288
APA StyleRasilla, D., Allende, F., Martilli, A., & Fernández, F. (2019). Heat Waves and Human Well-Being in Madrid (Spain). Atmosphere, 10(5), 288. https://doi.org/10.3390/atmos10050288