Article

High-Resolution Simulations of the Urban Thermal Climate in Suzhou City, China

1
Jangsu Climate Center, Nanjing 210008, China
2
CMA-NJU Joint Laboratory for Climate Prediction Studies, Institute for Climate and Global Change Research, School of Atmospheric Sciences, Nanjing University, Nanjing 210023, China
3
Suzhou Meteorological Bureau, Suzhou 215021, China
*
Author to whom correspondence should be addressed.
Atmosphere 2019, 10(3), 118; https://doi.org/10.3390/atmos10030118
Submission received: 16 January 2019 / Revised: 13 February 2019 / Accepted: 26 February 2019 / Published: 4 March 2019
(This article belongs to the Special Issue Urban Thermal Risk)

Abstract

:
City thermal discomfort conditions have been exacerbated by the rapid urbanization processes in China. High-resolution urban thermal climate simulations can help us to understand urban climate features and produce better urban designs. In this paper, a single-layer urban canopy model (UCM) combined with Landsat satellite data and high-resolution meteorological forcing data was used to simulate very-high-resolution characteristics of temperature and humidity at the urban canopy level, and the heat index at the pedestrian level was also estimated. The research shows that the National center of environmental forecasting, Oregon state university, Air force and Hydrological research lab (NOAH)-UCM model can simulate the distribution of meteorological elements for different land uses in a fine and effective manner, making it an effective approach to obtaining the fundamental data for urban climate analysis. The spatial distribution pattern of urban heat islands in Suzhou is highly consistent with urban land cover fraction. High-density and medium-density urban areas are centers of urban heat islands, and the annual number of high-temperature days and heat indices over the high-density and medium-density urban areas are markedly higher than those in low-density cities and suburbs, indicating that urban development has a significant impact on the urban thermal environment.

1. Introduction

Presently, more than half of the world’s population lives in urban areas, and the process of urbanization continues, especially in developing countries such as China and India. For example, the urban population in China increased from 172.45 million in 1978 to 813.47 million in 2017, and the urban population ratio increased from 17.92% in 1978 to 58.52% in 2017 (Figure 1). During urbanization processes, the land surface changes and the population increases quickly and continuously. Human activities in urban areas release large amounts of anthropogenic waste heat flux and air conditioning and irrigation in cities also release lots of anthropogenic latent heat flux; these together change the climate and environment of the city and affect the urban water supply, energy supply, ecosystem, and living environment [1]. Many cities are suffering from heat waves, air pollution and water pollution, and the health risks to urban residents are also increasing [2,3,4,5,6]. Designing sustainable, healthy, comfortable, and pleasant cities has become a global concern. To achieve this goal, it is necessary to consider climate information during urban planning and design.
Urban planning and design require high resolution urban climate data, especially with a horizontal resolution less than 1 km, because the scale of an urban neighborhood is usually several kilometers [8]. Observations from weather stations are usually the easiest way to get the climate status, but this conventional method has a relatively low spatial resolution, and their initial purpose is normally for mesoscale (10–100 km) weather services. Numerical models are widely used in urban climate studies, for example, mesoscale models for the city scale, and atmospheric boundary layer model, computational fluid dynamics (CFD) tools and large eddy simulation (LES) models for the neighborhood scale [9]. The mesoscale models lack detailed information at the pedestrian level, and the CFD and LES models are rather expensive, both in terms of time cost and computing resource consumption. With the development of urban canopy models (UCMs), it is possible to represent detailed urban meteorological information in urban canopy levels in a more effective way because the pedestrian-level urban climates are usually the local responses of specific land cover to large-scale synoptic forcing. As a kind of urban land surface model, UCMs can output detailed dynamic, thermal, and radiation information of the urban canopy levels. Yokoyama (2017) [10] found that high-resolution numerical simulations could reflect detailed effects of topography and land use, and improve calculation accuracy, especially during the nighttime. In this paper, we used a single-layer UCM [11,12,13,14] combined with Landsat-TM satellite data and a global meteorological forcing dataset to simulate the detailed distribution of air temperature, wind speed, and humidity at urban canopy level in a specific city (Suzhou, China). Based on the simulation results, this paper discusses the climate characteristics, such as urban heat islands, high-temperature days, and heat index, for different density levels of urban buildings. These results can provide information to create an urban climate analysis map for the urban development, planning, and improvement of human settlements.

2. Model and Data

2.1. Numerical Model

In this paper, we used the UCM established by Kusaka et al. [11,12,13,14], which is a widely used parameterization scheme for dealing with artificial surface land–surface processes in cities. The model considers the physical processes in the urban canopy based on representative street canyons, which are considered to be the basic unit of the city. Generally, there are three facets of surface canyons: roofs, pavements, and wall surfaces. The UCM simulates the respective energy balance processes over the three facets, and finally, the total heat fluxes exchange between each street canyon and the upper atmosphere is calculated. Therefore, the UCM can consider the surface sensible heat flux, latent heat flux, and its overall effects in street canyons in a more detailed manner according to the geometric features of the urban surface. The UCM can effectively describe the distributions of temperature, wind speed, humidity, sensible heat, latent heat, and so on, in the urban canopy level over the urban area, thereby obtaining the features of heat islands, the energy and water balances [15,16], and so on. This paper mostly focuses on the microscale urban climate at urban canopy levels (i.e., the space between the buildings which make up the urban streets and under their roofs); an offline version of UCM is a good compromise between detailed urban climate information and time-consuming mesoscale running. In the single-layer UCM model, the urban canopy air temperature is calculated with the heat fluxes from different urban canopy facets (wall, roof, and road), and the wind speed in the urban canopy is calculated using an empirical model, using the following equations [11]:
U s = U r exp ( 0.386 h w )
and   U r = U a ψ m ψ m r
where, Us is the wind speed in urban canopy, Ur is the wind speed at the height of building roof, Ua is the wind speed from the atmospheric forcing data; h is the building height and w is the urban canopy width. ψm and ψmr are the universal function in the urban canopy and at the roof level respectively.
Based on the simulation results, the National Oceanic and Atmospheric Administration (NOAA) Heat Index (HI) was selected for the heat stress analysis [17,18] of human comfort. The HI considers temperature and relative humidity as the main meteorological factors affecting the degree of comfort for the human body. It is an index that combines the air temperature and relative humidity to determine the body temperature, i.e., our personal perception of the degree of heat. The HI (units: °C) is expressed as
HI = c 1 + c 2 T + c 3 R + c 4 T R + c 5 T 2 + c 6 R 2 + c 7 T 2 R + c 8 T R 2 + c 9 T 2 R 2
where R is relative humidity (units: %), and C1–C9 are empirical parameters.

2.2. Research Area and Data

Suzhou is an important city in the Yangtze River Delta region, with a population of nearly ten million and an annual GDP of 273 billion US Dollars (according to 2017 annual statistics). Previous studies have shown that Suzhou experienced a rapid exacerbation of urban heat islands [19]. The offline version of the UCM coupled with the National center of environmental forecasting, Oregon state university, Air force and Hydrological research lab (NOAH) land surface model was used in our research. The model-driven meteorological field was the Global Meteorological Forcing Dataset for Land Surface Modeling (ds314.0) developed by the Hydrological Laboratory of the University of Preston. It is a high-resolution global dataset covering 50 years (1948–2008) and is mainly used for driving land surface models. The dataset integrates global observational data and numerical reanalysis data from the National Centers for Environmental Prediction (NCEP) and the National Center for Atmospheric Research (NCAR), including meteorological elements such as precipitation, temperature, wind speed, and radiation. The precipitation data from the Tropical Rainfall Measuring Mission (TRMM) satellites, the Global Precipitation Climatology Project (GPCP), and the Global Soil Moisture Observation Data Set, version 2 (GSWP-2) were used to calibrate the data. The dataset is long-term and reliable, with a spatial resolution of 1.0° × 1.0° and a temporal resolution of 3 h, and has been applied in many fields of research, such as meteorology and ecology.
The simulated region covered 31°–31.6° N, 120.2°–121° E, including the city of Suzhou and part of Taihu Lake. The horizontal grid resolution was 250 × 250 m, and the 25 m Landsat-TM satellite-observed land cover data of 2006 were used to obtain the surface coverage fractions of every land use type over each grid cell. Figure 2 shows the distribution of different underlying surface types within the simulated region, including cities, cropland, forest, and water. It shows that most of the urban area of Suzhou is of high-density urban type (impervious surface coverage ≥ 90%) and medium-density urban type (75% ≤ impervious surface < 90%), and a small part is of low-density urban type (50% ≤ impervious surface density < 75%). The areas where the impervious surface coverage is less than 50% are considered suburban areas. The building parameters used in UCM are the same as the default parameters in the weather research and forecasting model [20], and these parameters have been proven to work well in previous studies [21,22,23]. Only the anthropogenic heat from building and traffic releases is considered, because industrial releases are usually at a much higher level than the urban canopy and have little influence on urban-canopy-level climates [24]. The values of traffic and residential anthropogenic heat release intensities were estimated for the Suzhou Statistical Yearbook as in Yang (2017) [24]; the total intensity was around 20 W m−2, and no seasonal variations were considered due to the lack of data. The simulated period was from 2000 to 2008 because Suzhou city experienced quick urban expanding processes in the later 1990s and the early 2000s. The Landsat data used in this paper was for the year 2006, and only the 2000–2008 meteorological forcing data were used to keep the forcing data consistent with the land cover data. The model output frequency was 15 min, and the hourly results were calculated with the 15 min outputs. The meteorological conditions of each model grid were calculated with the separate tile method [25]. For each model grid, the air temperature, wind speed, specific humidity and relative humidity in the urban canopy level and the sensible heat and latent heat from different urban facets were outputted from the urban canopy module as in Kusaka (2001) [11], and the near-surface air temperature, wind speed and specific humidity over non-urban area (i.e., water, cropland and forest in this paper) were calculated with the Monnin-Obukhov Similarity Theory [26] using the simulated land surface conditions (including land surface temperature, soil moisture, sensible heat flux and latent heat flux) and the forcing data. Then the meteorological conditions of each grid were calculated with the weighted average method using land use type coverage fractions and the meteorological conditions over different land use type. The average air temperature of the pure vegetation grids (the sum of cropland coverage fraction and forest fraction equals 100%) was used as the rural reference value when the urban heat island intensity at each grid was calculated. The urban canopy level air temperature and relative humidity were used to analyze the spatial and temporal characteristics of the urban thermal conditions.

3. Results

3.1. Model Performance Evaluation

The near-surface meteorological fields simulated by mesoscale models are usually compared to the observations of air temperature at 2 m, relative humidity at 2 m, and wind speed at 10 m at conventional weather stations to evaluate the model performance. This method is not always suitable for microscale urban simulations because the purpose and design of conventional weather stations is to capture the mesoscale processes of tens of to several hundred kilometers, not the urban microscale processes. We evaluated the single-layer UCM performance using observations from a network of 21 automatic weather stations in the Suzhou area, as shown in Figure 3. The instruments of these automatic weather stations (AWS) are usually installed in different kinds of urban neighborhoods and better represent urban climate conditions than do conventional observations because the instrument installation height is always 2 m for both wind speed and temperature. This height is often less than the building height and indicates the observations taking place at the urban canopy level. Due to the limit observation period of the AWS stations—most of them started observations in late 2006 or 2007—only the data of both simulations and observations in 2007 and 2008 were used for the evaluation. The mean bias (MB), root-mean-square error (RMSE) and correlation coefficient (R) were calculated as shown in Table 1. The simulated mean air temperature in the urban canopy at the 21 meteorological stations was 17.4 °C; compare this with the observed mean temperature of 17.1 °C. The RMSE of the air temperature was 2.10 °C and the R value was 0.93. The UCM-simulated urban canopy relative humidity was 52.2%, which is slightly higher than the station-observed average (50.8%) with a mean bias (MB) of 1.4%. The model underestimated the urban-canopy-level wind speed with a MB of −0.81 m s−1; the RMSE was 1.24 m s−1 and the R value was 0.51. This is because the wind speed in the urban canopy in UCM is calculated using an empirical method [11]. The spatial distributions of the RMSE and R of air temperature at 21 stations are shown in Figure 3. The RMSE varied from 1.51 to 2.53 °C and the R varied from 0.88 to 0.98. The performance of the offline model over the mountainous area was not so validate as over the flat area because the topography effect was not considered. The biggest RMSE of occurred at the stations near low hills (less than 50 m) and the lowest R value occurred at the same station as well.

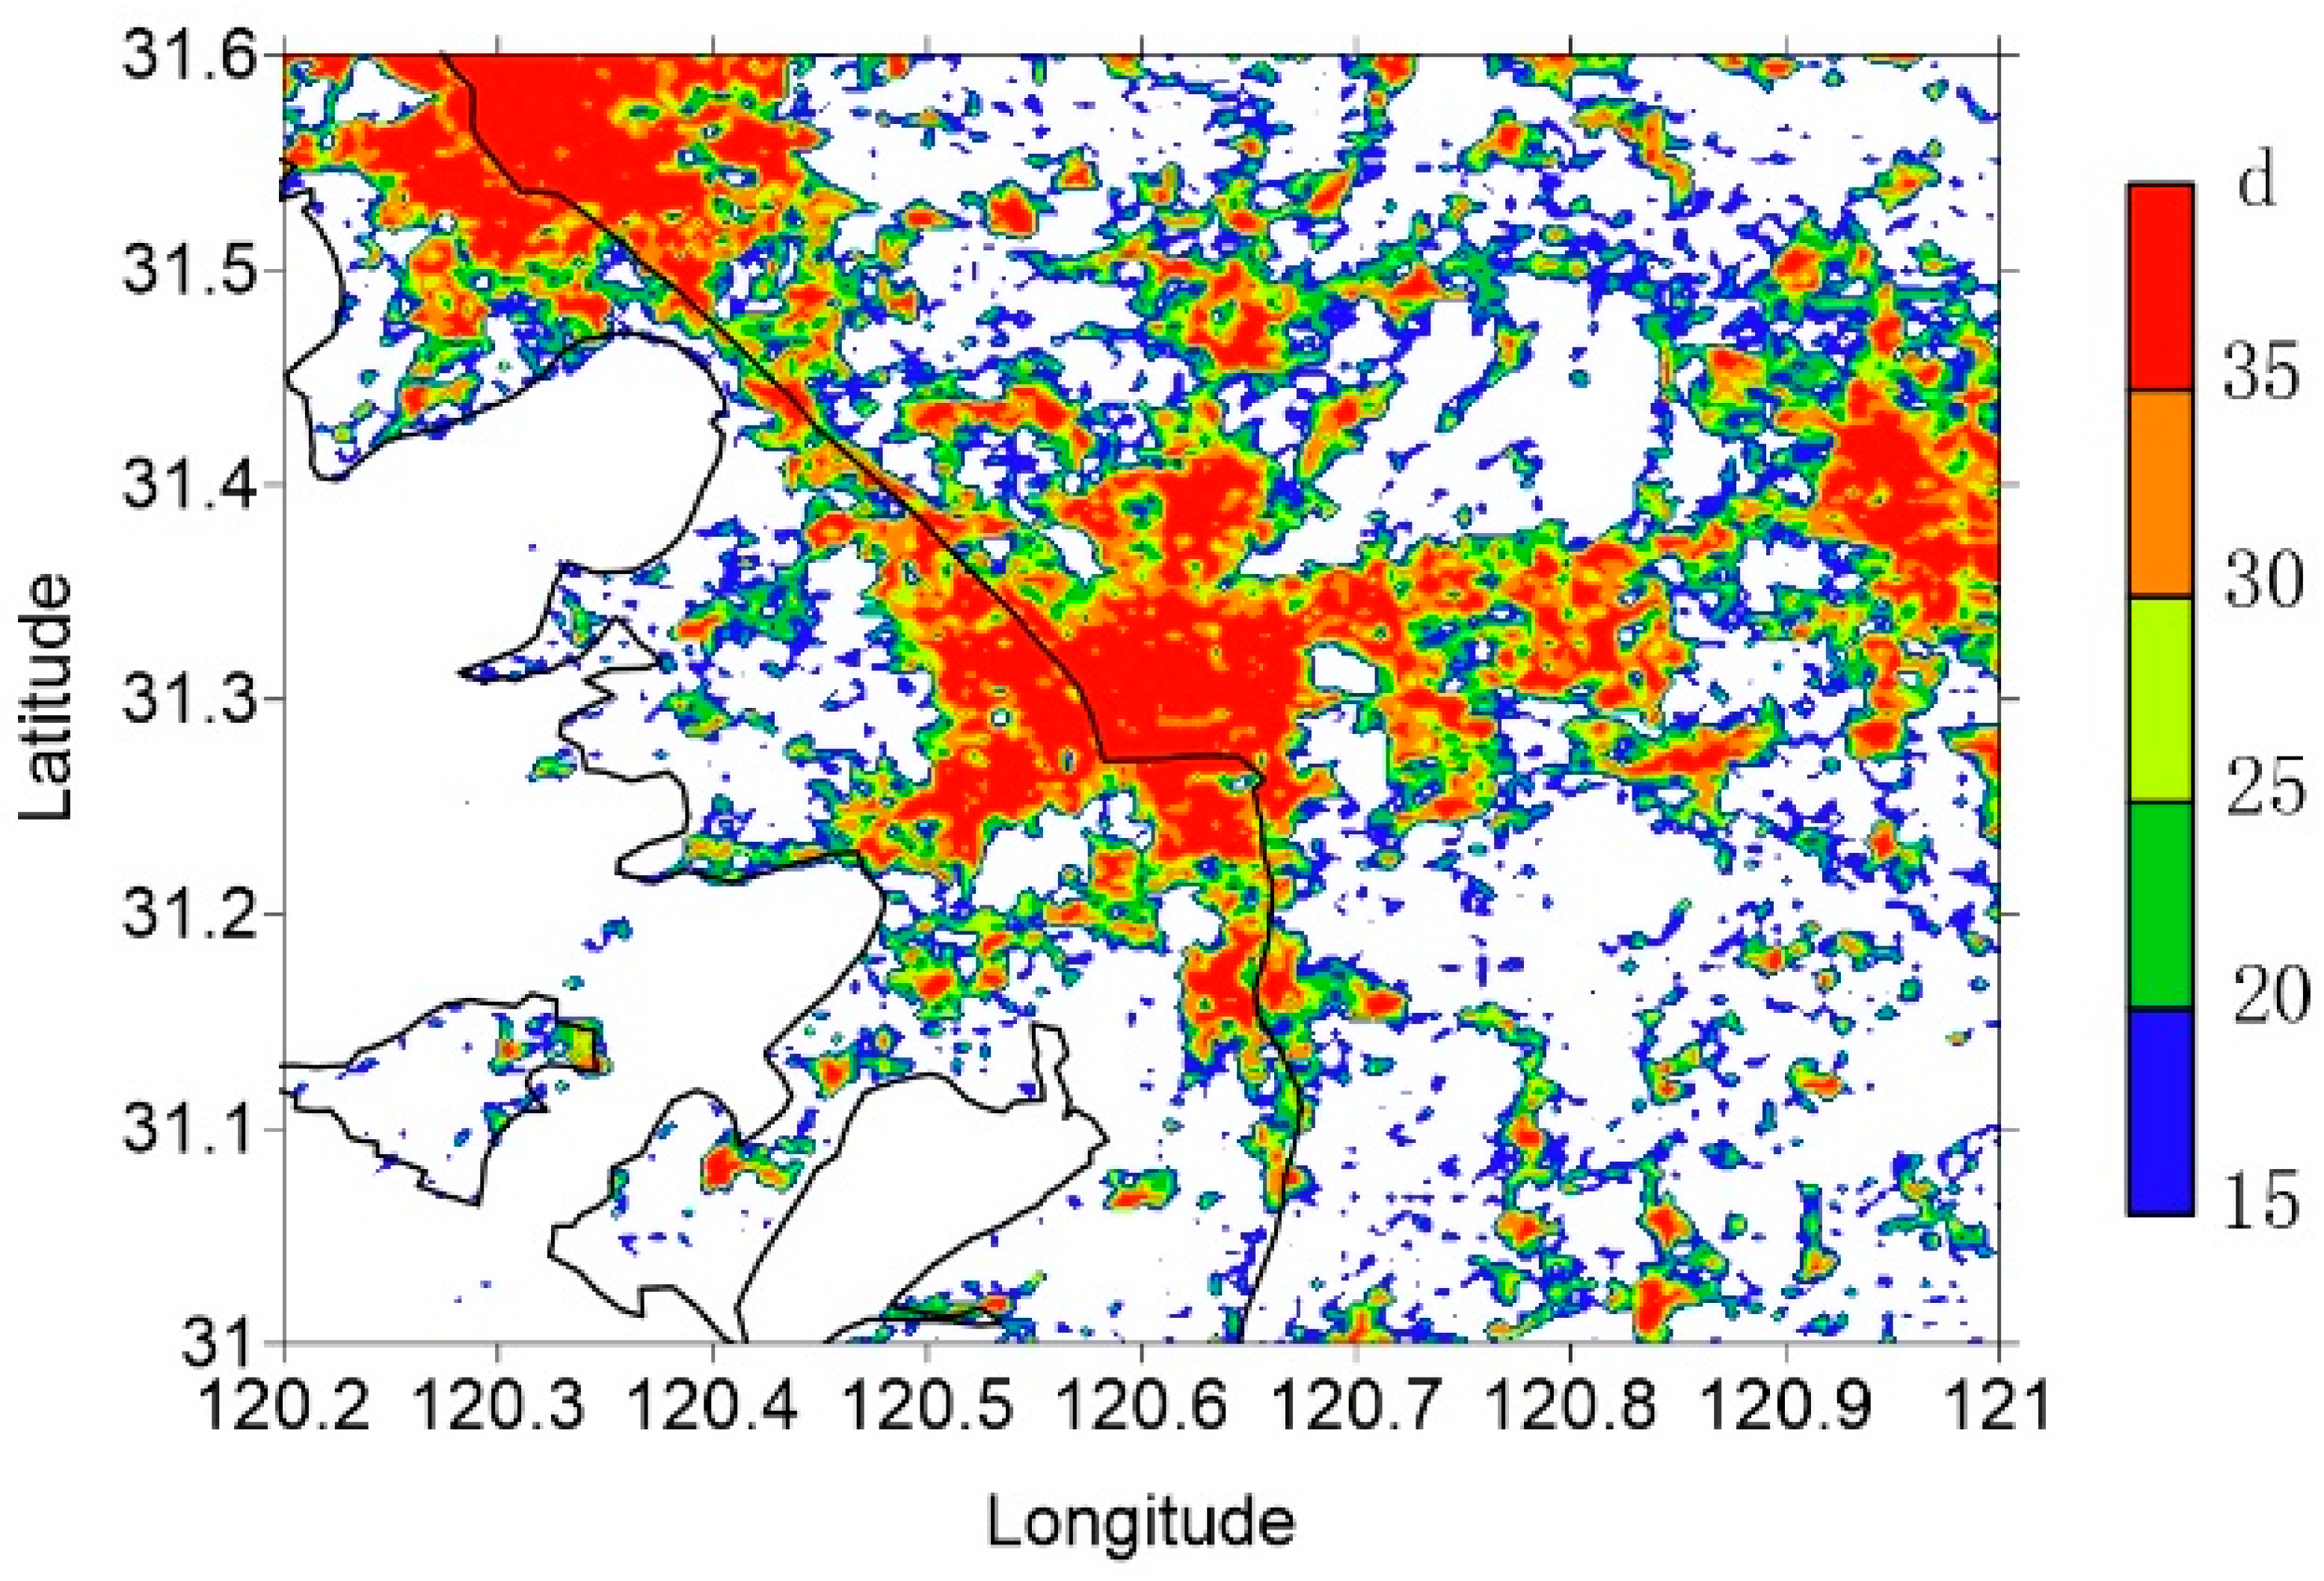
3.2. Urban Canopy Heat Islands

The horizontal distribution of the simulated nine-year average surface air temperature in Suzhou is illustrated in Figure 4. The surface air temperature in areas covered by buildings is higher than that over other underlying surfaces. The densely packed area in the center of the city has the highest air temperature. With decreasing urban building coverage, the temperature decreases greatly from the urban to the rural area. Water and vegetation have a direct cooling effect on the air temperature. In the grid cells where rivers, water, and vegetation are relatively dense, the temperature is 0.5–0.8 °C lower than in those grid cells densely covered by buildings.
The model results also show that there is a clear urban heat island (UHI) phenomenon in Suzhou. The UHI intensities of different urban types (high intensity, medium intensity, and low intensity) were calculated as the difference between the urban-covered grids and the respective averages of the vegetation-covered grids. The average annual heat island intensity in the high-density urban area is about 1.2 °C, about 1.0 °C in medium-density urban areas, and about 0.8 °C in low-density urban areas. In areas where the building coverage is less than 50%, the urban heat island intensity is about 0.4 °C. The spatial distribution pattern of heat islands is closely consistent with the type of land use. This is similar to the analysis of surface temperature observations from Moderate-resolution Imaging Spectroradiometer (MODIS) and Landsat-TM satellite data [19].
The urban heat island intensity in Suzhou changes with the seasons. Specifically, it is strongest in summer, when the urban heat island intensity in the high-density urban area is above 1.5 °C. In autumn, the average value is 1.2 °C; in spring, it is about 0.5 °C; and in winter it is only about 0.3 °C (Figure 5). The cooling effect of water bodies on urban heat islands is also very clear. Due to the thermal characteristics of water, the surface air temperature over water in summer is lower than the land surface air temperature and far below the surface temperature of areas covered by buildings. This cooling effect is most noticeable in summer and can reach 0.5–1.0 °C. In winter, the water temperature is higher than the above air temperature, meaning that the cooling effect of water bodies is negative and a warming impact occurs (figures not shown here).
According to the National Ecological Garden City Standard of China, a summer daily mean urban heat island intensity of ≤2.5 °C is the basic requirement for a national ecological garden city. In this paper, the recommendations of China’s Urban Heat Island Effect Assessment Technical Guide were used to classify the urban heat island intensity into five levels according to ΔT (the temperature difference between cities and suburbs): Grade 1—no urban heat island (ΔT ≤ 0.5 °C); Grade 2—weak urban heat island (0.5 °C< ΔT ≤ 1.5 °C); Grade 3—medium urban heat island (1.5 °C < ΔT ≤ 2.5 °C); Grade 4—strong urban heat island (2.5 °C < ΔT ≤ 3.5 °C); Grade 5—extreme urban heat island (ΔT > 3.5 °C). From the annual average heat island intensity level distribution, it can be seen that the urban heat islands over suburban areas are commonly weak. Medium urban heat island intensity only appears in summer, and mainly in medium- and high-density urban areas. The spatial distribution of urban heat island intensity shows that stronger urban heat islands occurred in a bigger area in summer and autumn than in winter and spring (Figure 6). In summer, more than 40% of the urban area experienced an urban heat island phenomenon, and the ratio of the area where an urban heat island stronger than Grade 2 appeared to the whole city area was about 0.43.
The probability distribution functions (PDFs) of UHI/urban cool island (UCI) intensities are shown in Figure 7. Both strong UHI and strong UCI occurred in the simulations. The maximum urban heat island usually occurred in the high-density urban area and at night because of the high urban heat storage in the daytime and its release at night. The frequency of strong UCI (cooler than −1.0 °C) is very small (less than 1%), but the probability of weak UCI (−0.5 °C) is relatively high, especially in winter. Figure 8 illustrates the annual and seasonal averages of variations in diurnal UHI intensity. It indicates that UCIs occur commonly after sunrise, especially in spring and winter. This is because at this time the solar radiation starts to heat the rural surface while the solar radiation is shadowed by buildings and cannot reach the urban canopy level, and the longwave radiation cooling of the urban canopy still continues at the same time. This phenomenon usually lasts 1–3 h, as shown in Figure 8. The largest probability of a UCI occurs in winter because the solar elevation angle is lower compared to other seasons and the downward solar radiation flux is weak; also, the low solar elevation angle causes long building shadows. This results in the weakest UCI and strongest UHI occurring in summer and the strongest UCI and weakest UHI occurring in winter. Another factor causing the weak UHI effect in winter is that the precipitation is low in winter in this area and the soil moisture is low in the surrounding rural area. The dry soil moisture decreases the contrast between the urban area and the surrounding environment; this has also been documented in the previous fully coupled mesoscale simulations, as in reference [19]. The diurnal variations of UHIs over different urban types also showed that the UCIs occurred more frequently over the high-density urban areas because the buildings are higher and the shadowing effect is more prominent than over the other two urban area types. For all seasons, the UHIs most frequently occur between 0 and 0.1 °C. UCIs in a temperature less than −1 °C and UHIs in a temperature greater than 2 °C rarely happened.

3.3. Heat Index

The hourly averaged model results were used to calculate the number of high-temperature days occurring in different regions. If the urban canopy air temperature is greater than 35 °C once on one day at a grid cell, a high-temperature day is counted for that grid point. Figure 9 shows the average annual high-temperature day distribution. Due to the urban heat island effect, the number of high-temperature days in urban areas is much higher than that in other regions. The annual average number of high-temperature days in urban central areas is more than 35. In medium-density urban areas, this figure is about 30, and in low-density areas it is about 25. The annual average number of high-temperature days in the suburban and rural areas is about 15–20, which is less than in the urban area.
The heat index was also calculated based on the hourly model results and divided into four levels: (1) Caution—long-term exposure to outdoor activities may cause fatigue, and continuous activities may lead to heat cramps; (2) Extreme caution—possibility of heat cramps and mild heat stroke, and continuing work may cause heat stroke; (3) Danger—heat cramps and mild heat stroke are most likely to occur, and continuing work may cause heat stroke; (4) Extreme danger—heat stroke will occur.
When the heat index is above Grade 2, outdoor workers should be cautious because continuous outdoor activities may lead to heat stroke and this is harmful to human health. The detailed distribution of the day numbers of Grade 2 heat index is a useful estimation to help the urban design and the outdoor job management to reduce the health risks of the elderly and weak population and the out workers in different urban areas. In the suburbs, the number of extreme caution days is less than 15, while the possibility of its occurrence in urban areas is much higher, being more than 35 in high- and medium-density urban areas (Figure 10). Compared to the distribution of high-temperature days (Figure 9), the number of extreme caution days is more prevalent in the same area, and the affected area is larger, because of both air temperature and humidity effects. Suzhou is located in the East Asian monsoon region, with abundant summer precipitation. In summer, there are many rainy days and high levels of precipitation. The air is damp, which affects perspiration and cooling in humans. There is a high chance of heat cramp and mild heat stroke, even if the temperature is less than 35 °C. The averaged UHI intensity of these caution days is above 1.2 °C, while means that UHIs may enhance the heat index. This is because all of these caution days appear in the summertime, when the incident solar radiation is strong and conditions are favorable for the formation of UHIs.

4. Discussion and Conclusions

In this paper, long-term UCM simulations were used to obtain the distribution characteristics of air temperature, wind speed, and humidity in the Suzhou area. Then, the basic characteristics of the urban climates, including the thermal environment, ventilation capacity and heat index were analyzed. The results showed the following:
(1) The UCM can effectively simulate the impact of the city’s different underlying surfaces (cropland, forest, and water bodies) on the meteorological environment. It can provide characteristics of meteorological elements such as air temperature, wind speed, and humidity in the urban area to high temporal and spatial resolution, which is an effective way to obtain urban climatic maps.
(2) The spatial distribution of urban heat islands and the type of land use are in good agreement. The high-density urban area is the heat island center. The annual average heat island intensities in high-, medium-, and low-density urban areas are 1.2 °C, 1.0 °C, and 0.8 °C, respectively. The average annual heat island level is Grade 2, with weak heat island intensity. Medium urban heat island intensity only appears in summer and mainly in medium- and high-density urban areas.
(3) In urban areas, the ventilation capacity is Grade 3, indicating a medium ventilation capacity. The suburbs have good ventilation capacity. The ventilation capacity around Taihu Lake is strongest. In winter and spring, the ventilation capacity generally rises, whereas it decreases in summer and autumn.
(4) The number of high-temperature days, the heat index, and the days of weak ventilation in high- and medium-density urban areas are higher than those in low-density cities and suburbs, indicating that urban development has a significant impact on the meteorological environment, and stronger UHI and weak urban ventilation capability usually occur in summer.
The offline UCM was used in our simulations and has been proven to be an effective tool for obtaining very-high-resolution (~100 m) urban canopy climate conditions on a neighborhood scale. However, there are still some uncertainties and shortcomings which need to be solved in future studies. Because of the heterogeneous features of urban areas, these simply classified urban building parameters may introduce uncertainties into the simulations; recently, the World Urban Database and Access Portal Tools (WUDAPT) project has been introduced into the urban surface energy balance simulations. In this paper we still use the conventional parameters because the WUDAPT datasets for Suzhou City are currently unavailable, but they are promising for improving the simulations in future studies. Also, the forcing data used in this study are in a relatively coarser resolution compared to the land cover dataset. With the development of numerical models, more and more higher-resolution reanalysis data will be available and will act as better meteorological forcing fields.

Author Contributions

Conceptualization, N.Z., methodology, N.Z., Validation, Y.C. and Y.Z., writing-original draft preparation, Y.C., writing-review and editing, N.Z., project administration, N.Z.

Funding

This paper is supported by the Chinese National Key Research and Development Program (Grant No. 2016YFA0600303) and the National Natural Science Foundation of China (Grant No. 41675008 and 51538005).

Conflicts of Interest

The authors declare no conflict of interest.

References

  1. Baklanov, A.; Grimmond, C.S.B.; Carlson, D.; Terblanche, D.; Tang, X.; Bouchet, V.; Hovsepyan, A. From urban meteorology, climate and environment research to integrated city services. Urban Clim. 2018, 23, 330–341. [Google Scholar] [CrossRef]
  2. Li, D.; Bou-Zeid, E. Synergistic interactions between urban heat islands and heat waves: The impact in cities is larger than the sum of its parts. J. Appl. Meteorol. Climatol. 2013, 52, 2051–2064. [Google Scholar] [CrossRef]
  3. Founda, D.; Santamouris, M. Synergies between Urban Heat Island and Heat Waves in Athens (Greece), during an extremely hot summer (2012). Sci. Rep. 2012, 7, 10973. [Google Scholar] [CrossRef] [PubMed]
  4. Hamnett, S. Designing high-density cities for social and environmental sustainability. Aust. Plan. 2011, 48, 61–64. [Google Scholar] [CrossRef]
  5. Katzschner, L.; Mulder, J. Regional climatic mapping as a tool for sustainable development. J. Environ. Manag. 2008, 87, 262–267. [Google Scholar] [CrossRef] [PubMed]
  6. Leung, Y.K.; Yip, K.M.; Yeung, K.H. Relationship between thermal index and mortality in Hong Kong. Meteorol. Appl. 2008, 15, 399–409. [Google Scholar] [CrossRef] [Green Version]
  7. National Bureau of Statistics. Available online: http://www.stats.gov.cn (accessed on 26 September 2018).
  8. Oke, T.R.; Mills, G.; Christen, A.; Voogt, J.A. Urban Cliamtes; Cambridge University Press: Cambridge, UK, 2017; ISBN 9781139016476. [Google Scholar]
  9. Zhang, N.; Jiang, W.; Hu, F. Numerical method study of how buildings affect the flow characteristics of an urban canopy. Wind Struct. 2004, 7, 159–172. [Google Scholar] [CrossRef]
  10. Yokoyama, M.; Tanaka, T.; Sugiyama, T.; Sadohara, S. Making climatic zoning maps in Yokohma-Comparison among different resolution calculations. J. Heat Island Inst. Int. 2017, 12, 107–114. [Google Scholar]
  11. Kusaka, H.; Kondo, H.; Kikegawa, Y.; Kimura, F. A simple single-layer urban canopy model for atmospheric models: Comparison with multi-layer and slab models. Boundary Layer Meteorol. 2001, 101, 329–358. [Google Scholar] [CrossRef]
  12. Kusaka, H.; Kimura, F. Coupling a single-layer urban canopy model with a simple atmospheric model: Impact on urban heat island simulation for an idealized case. J. Meteorol. Soc. Jpn. 2004, 82, 67–80. [Google Scholar] [CrossRef]
  13. Kusaka, H.; Kimura, F. Thermal effects of urban canyon structure on the nocturnal heat island: Numerical experiment using a mesoscale model coupled with an urban canopy model. J. Appl. Meteorol. 2004, 43, 1899–1910. [Google Scholar] [CrossRef]
  14. Chen, F.; Kusaka, H.; Bornstein, R.; Ching, J.; Grimmond, C.S.B.; Grossmanclarke, S.; Loridan, T.; Manning, K.W.; Martilli, A.; Miao, S. The integrated WRF/urban modelling system: Development, evaluation, and applications to urban environmental problems. Int. J. Climatol. 2011, 31, 273–288. [Google Scholar] [CrossRef]
  15. Ryu, Y.H.; Baik, J.; Lee, S. A new single-layer urban canopy model for use in mesoscale atmospheric models. J. Appl. Meteorol. Climatol. 2011, 50, 1773–1794. [Google Scholar] [CrossRef]
  16. Chen, F.; Dudhia, J. Coupling an advanced land surface-hydrology model with the Penn State-NCAR MM5 modeling system. Part I: Model implementation and sensitivity. Mon. Weather Rev. 2001, 129, 569–585. [Google Scholar] [CrossRef]
  17. Anderson, G.B.; Bell, M.L.; Peng, R.D. Methods to calculate the heat index as an exposure metric in environmental health research. Environ. Health Perspect. 2013, 121, 1111–1119. [Google Scholar] [CrossRef] [PubMed]
  18. Zanobetti, A.; Oneill, M.S.; Gronlund, C.J.; Schwartz, J. Summer temperature variability and long-term survival among elderly people with chronic disease. Proc. Natl. Acad. Sci. USA 2012, 109, 6608–6613. [Google Scholar] [CrossRef] [PubMed] [Green Version]
  19. Zhao, Y.; Zhang, N.; Chen, Y.; Zhu, Y. Long term analysis of urban heat island using remote sensing data in lake tai basin. Plateau Meteorol. 2017, 36, 1394–1403. [Google Scholar]
  20. The Weather Research & Forecasting Model. Available online: http://www.wrf-model.org (accessed on 26 September 2018).
  21. Zhang, N.; Gao, Z.; Wang, X.; Chen, Y. Modeling the impact of urbanization on the local and regional climate in Yangtze River Delta, China. Theor. Appl. Climatol. 2010, 102, 331–342. [Google Scholar] [CrossRef]
  22. Zhang, N.; Chen, Y. A Case Study of the Upwind Urbanization Influence on the Urban Heat Island Effects along the Suzhou–Wuxi Corridor. J. Appl. Meteorol. Climatol. 2014, 53, 333–345. [Google Scholar] [CrossRef]
  23. Zhang, N.; Chen, Y.; Luo, L.; Wang, Y. Effectiveness of Different Urban Heat Island Mitigation Methods and Their Regional Impacts. J. Hydrometeorol. 2017, 18, 2991–3012. [Google Scholar] [CrossRef]
  24. Yang, J.; Liu, H.; Sun, J.; Zhu, Y.A.N.; Wang, X.; Xiong, Z.H.E.; Jiang, W. Further development of the RBLM model to study the impacts of greenery on urban thermal environment. J. Appl. Meteorol. Climatol. 2014. [Google Scholar] [CrossRef]
  25. Grimmond, C.S.B.; Blacketta, M.; Bestb, M.J.; Barlowc, J.; Baikd, J.-J.; Belcherc, S.E.; Bohnenstengelc, S.I.; Calmete, I.; Chenf, F.; Dandoug, A.; et al. The international urban energy balance models comparison project: first Results from Phase 1. J. Appl. Meteorol. Climatol. 2010, 49, 1268–1292. [Google Scholar] [CrossRef]
  26. Stull, R.B. An Introduction to Boundary Layer Meteorology; Springer: Dordrecht, The Netherlands, 1988; ISBN 978-94-009-3027-8. [Google Scholar]
Figure 1. The population and urbanization ratio of China [7].
Atmosphere 10 00118 g001
Figure 2. Simulated area and distribution of the major land use type coverage fractions: (a) impervious surface; (b) cropland; (c) forest; (d) water.
Atmosphere 10 00118 g002
Figure 3. Spatial distributions of the (a) root mean square error and (b) Correlation Coefficient of the near surface air temperature. The black dots indicate the locations of the meteorological stations used in this paper.
Atmosphere 10 00118 g003
Figure 4. The spatial distribution of the annual average near-surface temperature.
Atmosphere 10 00118 g004
Figure 5. Distribution of annual and seasonal averaged urban heat island intensities: (a) annual; (b) spring; (c) summer; (d) autumn; (e) winter.
Atmosphere 10 00118 g005
Figure 6. Same as Figure 3 but for urban heat island intensity index: (a) annual; (b) spring; (c) summer; (d) autumn; (e) winter.
Atmosphere 10 00118 g006
Figure 7. The probability distribution functions of hourly urban heat/cool island intensities.
Atmosphere 10 00118 g007
Figure 8. Diurnal variations of urban heat island (UHI) intensities over different urban type areas: (a) annual average; (b) spring average; (c) summer average; (d) autumn average; and (e) winter average.
Atmosphere 10 00118 g008
Figure 9. Same as Figure 2 but for annual average high-temperature day numbers.
Atmosphere 10 00118 g009
Figure 10. Same as Figure 2 but for annual average extreme caution day numbers.
Atmosphere 10 00118 g010
Table 1. Comparisons of simulated air temperature, relative humidity, and wind speed at the urban canopy level with observations in 2007 and 2008.
Meteorological FieldsObservationSimulationMean Bias (MB)Root Mean Square Error (RMSE)Correlation Coefficient (R)
Air temperature at urban canopy level (°C)17.417.1−0.32.100.93
Relative humidity at urban canopy level (%)50.852.21.49.700.85
Wind speed at urban canopy level (m s−1)2.962.15−0.811.240.51

