Article

A Review of Aerosol Chemical Composition and Sources in Representative Regions of China during Wintertime

1
School of Humanities, Economics and Law, Northwestern Polytechnical University, Xi’an 710129, China
2
College of Management, Shenzhen University, Shenzhen 518060, China
3
Key Lab of Aerosol Chemistry and Physics, State Key Laboratory of Loess and Quaternary Geology, Institute of Earth Environment, Chinese Academy of Sciences, Xi’an 710061, China
4
CAS Center for Excellence in Quaternary Science and Global Change, Xi’an 710061, China
5
School of Engineering and Applied Sciences, Harvard University, Cambridge, MA 02138, USA
6
School of Human Settlements and Civil Engineering, Xi’an Jiaotong University, Xi’an 710049, China
7
Laboratory of Atmospheric Chemistry, Paul Scherrer Institute (PSI), 5232 Villigen, Switzerland
*
Authors to whom correspondence should be addressed.
Atmosphere 2019, 10(5), 277; https://doi.org/10.3390/atmos10050277
Submission received: 31 March 2019 / Revised: 30 April 2019 / Accepted: 13 May 2019 / Published: 16 May 2019
(This article belongs to the Section Aerosols)

Abstract

:
Comparisons of aerosol composition and sources in different cities or regions are rather limited, yet important for an in-depth understanding of the spatial diversity of aerosol pollution in China. In this study, the data originating from 25 different winter aerosol mass spectrometer (AMS)/aerosol chemical speciation monitor (ACSM) studies were used to provide spatial coverage of the Beijing-Tianjin-Hebei (BTH), Guanzhong (GZ), Yangtze River Delta (YRD), and Pearl River Delta (PRD) regions. The spatial distribution and diurnal variations in aerosol composition and organic sources were analyzed to investigate the aerosol characteristics in the four regions. It was found that there were differences in the compositions of non-refractory particulate matter across the regions, e.g., more sulfate in the PRD versus more nitrate in the YRD, as well as in the organic sources, e.g., more coal combustion in BTH versus more biomass burning in GZ. The characteristics of the composition of NR-PM are similar when the campaigns were classified according to the winter of different years or the cities of different regions. The diurnal variation of the PRD-sulfate indicated its regional nature, whereas the organics from burning sources in two regions of northern China exhibited local characteristics. Based on these findings, we suggest that strict control policies for coal combustion and biomass burning emissions should be enforced in the BTH and GZ regions, respectively.

1. Introduction

In recent years, China has suffered from severe air pollution, especially during wintertime [1,2,3]. Measurements have shown that the daily average mass concentrations of PM2.5 (particulate matter with aerodynamic diameter ≤ 2.5 µm) during winter heating seasons in a number of major Chinese cities were about 1–2 orders of magnitude higher than concentrations in European Countries and in the US [1,3,4]. The severe air pollution was often accompanied by a sharp rise in respiratory diseases and extremely low visibility [5,6,7,8].
The urgent need to improve air quality has been recognized by the public and governments [9,10,11], and actions have since been taken by the authorities [9]. Identifying the major chemical compositions and sources is required to implement optimized and targeted pollution control strategies [12]. The quantification of the PM chemical composition and its sources can be acquired by the measurements of the mass spectrometric fingerprints of ambient PM samples [2].
The aerosol chemical speciation monitor (ACSM) and aerosol mass spectrometry (AMS) have been extensively used for online measurements of aerosol composition [1,13,14,15,16], including organics, sulfate (SO42−), nitrate (NO3), ammonium (NH4+), and chloride (Cl). The multilinear engine (ME-2) and positive matrix factorization (PMF) have been widely used for the source identification of organics [1,13,17,18,19]. Typically, the organics can be at least separated into primary (POA) and oxygenated organic aerosols (OOA). Studies have shown that OOA is a good surrogate for secondary organic aerosol (SOA) [20,21]. The POA sources can be further split up into coal combustion-related organic aerosol (CCOA), biomass burning-related organic aerosol (BBOA), cooking-related organic aerosol (COA), and traffic-related hydrocarbon-like organic aerosol (HOA) [2,20,22]. It has been concluded that the COA at a rural site originated from more than the emissions from cooking activities [23]. Consequently, COA from rural sites may be overestimated. Given that AMS/ACSM provide high time-resolution data [24,25], it is particularly useful when investigating the diurnal cycles and temporal variations of aerosol composition and organic sources.
Recently, several measurements of submicron aerosol compositions have been conducted using AMS/ACSM during winter heating seasons (see References in Table S1), and these studies mainly focused on the aerosol characteristics in four representative regions of northern (Beijing-Tianjin-Hebei, BTH), western (Guangzhong, GZ), eastern (Yangtze River Delta, YRD), and southern (Pearl River Delta, PRD) China [2]. Given the high cost and complexity of maintaining the instruments, most of the previous individual studies have mainly focused on the aerosol composition and sources at a specific location in one or a small number of study regions over a limited time period (see References in Table S1). Before 2016, the older reviews focused on the mass concentration of gases and particulate in China, and the differences in chemical compositions between China and other countries (See Table S1 in Li et al. (2017)). Recently, the reviews mainly focused on the interannual variations in aerosol compositions [26], the differences in aerosol composition and sources in north and south China [4], and the nitrate/sulfate (N/S) ratios in the four representative regions [2]. Thus, the differences in aerosol composition across the four representative regions cannot be found in previous individual AMS/ACSM studies or review papers. On the other hand, a comparison of the aerosol composition and sources across different cities or regions is important for a comprehensive understanding of the spatial diversity of aerosol pollution in China, as well as for policy-makers to develop effective air pollution control measures in specific areas of China.
The socioeconomic and meteorological factors are similar in the four representative regions of China [27]. Therefore, the air pollution control action issued by the Chinese government (http://www.jingbian.gov.cn/gk/zfwj/gwywj/41211.htm?from=timeline) mainly focuses on the joint prevention and control measures in each region [28]. Identification of the major sources and chemical species in each region is required for implementing the optimized and targeted pollution control strategies [12]. In this study, the data originating from 25 different winter AMS/ACSM measurements were used to provide spatial coverage of the four representative regions in China. To investigate the aerosol characteristics in the four regions, the spatial distributions of aerosol composition and organic sources were analyzed. Based on the findings, suggestions for air pollution control measures were provided to focus on different components or sources in the different regions.

2. Experiments

2.1. Sources of Data

As clearly articulated by Wang et al. [29]: “We searched studies with publication dates prior to March 2019 on the Web of Science platform (http://apps.webofknowledge.com/). The adopted keywords and phrases were the same as Wang et al. [29]. Studies were chosen on the basis of these conditions: (1) measurements in winter were included; (2) measurements in four representative regions (Figure 1) were included; (3) organic source apportionment was reported; If a certain source was not present, the concentration of that source was assumed to be zero; (4) if more than one measurement from numerous study sites was reported in one article [1,15], we consider each measurement as an independent study; and (5) If measurements took place at the same site in the same year—as specifically done by Elser et al., [15], Sun et al., [30], Huang et al., [1], Hu et al., [31], Sun et al., [32], and Zhang et al., [33]—each measurement was treated as an independent study. We selected 25 articles on the basis of the aforementioned conditions (Table S1).” The BTH and GZ regions represent a flat geography in the northern part of China. During wintertime, these two regions are dominated by calm weather in the winter, while the average temperatures are around zero in these two regions. PRD is dominated by the flat area. During wintertime, the average wind speed is 1.5–3 m s−1, and the average temperatures are from 13 to 16 °C. YRD is dominated by the flat area. During wintertime, YRD is characterized by calm weather conditions, where the average temperatures range from 2 to 7 °C.

2.2. Data Acquisition

For each selected study, we recorded the sampling site, location, campaign period, aerosol type (PM1 or PM2.5), mass concentration (µg m−3), mass fractions of aerosol species, and organic sources over entire campaign period. We used the Engauge Digitizer 2.24 (http://digitizer.sourceforge.net) to digitize and extract the data from the time-series and diurnal-variation graphs of the aerosol chemical species, organic sources, gaseous species, and meteorological parameters. The digitized data for each day was further averaged to obtain the daily averages of the chemical composition and organic sources at individual sites. Since we wanted to clarify the different contributions of coal combustion and biomass burning to primary PM in the BTH and GZ regions, we also digitized the BC data if available in the AMS/ACSM studies of these two regions. We could not ensure the same interval between the adjacent digitizing data. Therefore, bias could exist from this method. Given that we used daily average data, this bias should not have influenced the results from this study. Details regarding data acquisition can be found in Wang et al. [29].

2.3. Estimation of BC and Cl Sources

In winter in northern China, BC and Cl are mainly from primary emissions [15,32], and the contribution to Cl from traffic is negligible [2]. Thus, the daily averages of OA sources were used to apportion the sources of BC and Cl in northern China through the linear decomposition algorithm described in References [15,34]:
t B C = p = 1 3 t p × c p
t C l = p = 1 2 t p × c p
where the tBC represents the daily averages of the BC concentrations, tp in Equation (1) represents the daily averages of the HOA, BBOA, and CCOA, tp in Equation (2) represents the daily averages of the BBOA and CCOA, and cp represents the corresponding fitting parameters of the daily average concentrations.

3. Results

3.1. Mass Concentrations and Chemical Composition of Non-refractory Particulate Matter (NR-PM)

As shown in Table S1, the concentrations of average NR-PM concentrations at individual sites ranged from 15.4 to 247.0 µg m−3. The highest NR-PM value was observed at Xi’an in the GZ region [15], whilst the lowest was at Hong Kong in the PRD region [35]. The NR-PM concentrations were typically higher in the BTH and GZ regions, which were characterized by low wind speeds, low temperature, strong anthropogenic emissions, and heterogeneous reactions [36,37].
On the basis of 29 campaigns in China, the organics contributed 38–55% of NR-PM during wintertime. The average contributions of organics to NR-PM in BTH and GZ (53–55%) were higher than the contributions in the PRD and YRD (45–47%). Figure 2a shows the average chemical composition of inorganic species in the four regions. The relative contributions of inorganic species (i.e., SO42−, NO3, NH4+, and Cl) to NR-PM were different across the regions. NR-PM in the PRD and YRD regions was dominated by secondary inorganic aerosol (SIA), e.g., 52% in the PRD and 53% in the YRD. In contrast, this contribution dropped to 41% in BTH and 40% in GZ. In terms of SIA species in the PRD and YRD regions, the contribution from sulfate was higher than that from nitrate by 15% in the PRD, whilst nitrate contributed 6% more than sulfate in the YRD. The relative contribution of primary inorganic species (i.e., chloride) was notably higher in BTH (6.0%) and GZ (5.7%) compared to that in the PRD (1.9%) and YRD (2.4%). The higher chloride mass fractions and concentrations in the BTH and GZ regions were due to the enhanced burning activities during wintertime [1,16].
Note that the absolute sulfate concentrations were comparable between urban sites (Shenzhen and Guangzhou, 10.0–12.8 μg m−3) and nonurban sites (Heshan, 10.0 μg m−3) in the PRD region, indicating its similar regional distribution. The abundant sulfate in the PRD region was also attributed to the low contributions of other compositions (organics, nitrate, and ammonium) due to the low emission from local sources (e.g., limited coal combustion and biomass burning) and depletion during regional transport [38]. The high nitrate mass fraction in the YRD may be related to the intra-regional transport of air masses, which plays an important role in PM pollution in the YRD region [39]. Since nitrogen oxide shows a faster oxidation rate than sulfur dioxide [40], the high NO3/SO42− ratio was expected in the air masses over short-range transport. The nitrate could also be influenced by the temperature. This was proven through anti-correlation of the diurnal variations between the nitrate and temperature. Details can be found in the Section 3.3.
The inorganic and organic compositions of NR-PM were similar in the same region when the results were classified and averaged according to the year of the campaign (Figure 3a) or the cities of regions (Figure 3b). SIA dominated the NR-PM composition, with contributions ranging from 50% to 66% in the PRD and YRD regions. As an exception, only 40% of the NR-PM was made up of SIA in Shanghai in January 2013, which could be explained by the high organic mass fraction attributed mainly to SOA formations [1]. The higher mass fraction of sulfate in 2012 in the PRD was due to the influence of the regional transport of pollutants and the low level of local emissions in Hong Kong [35]. In the PRD region, SO42− was the most abundant SIA species, with contributions ranging from 24% to 40%. In the YRD region, the contribution from NO3 was higher than other SIA species, ranging from 16% to 27%. On the contrary, the organics and chloride dominated the NR-PM with contributions of 51–67% in the BTH and GZ regions.
The ion balances are overall neutral within the uncertainty measurements range [41,42] in the four representative regions. The average equivalent ratios of NH 4 + / SO 4 2 in the four regions were higher than 1 (BTH (1.83), GZ (1.89), PRD (1.25), YRD (2.0)), indicating the dominance of (NH4)2SO4. Furthermore, the molar ratios of NH 4 + to [ NO 3 + SO 4 2 ] were calculated, and were slightly higher than unity in BTH (1.08) and GZ (1.15), indicating the presence of NH4NO3 in the NR-PM. However, the ratio was less than 1 in the PRD (0.92) and YRD (0.98) regions, indicating the presence of chemical forms other than NH4NO3.

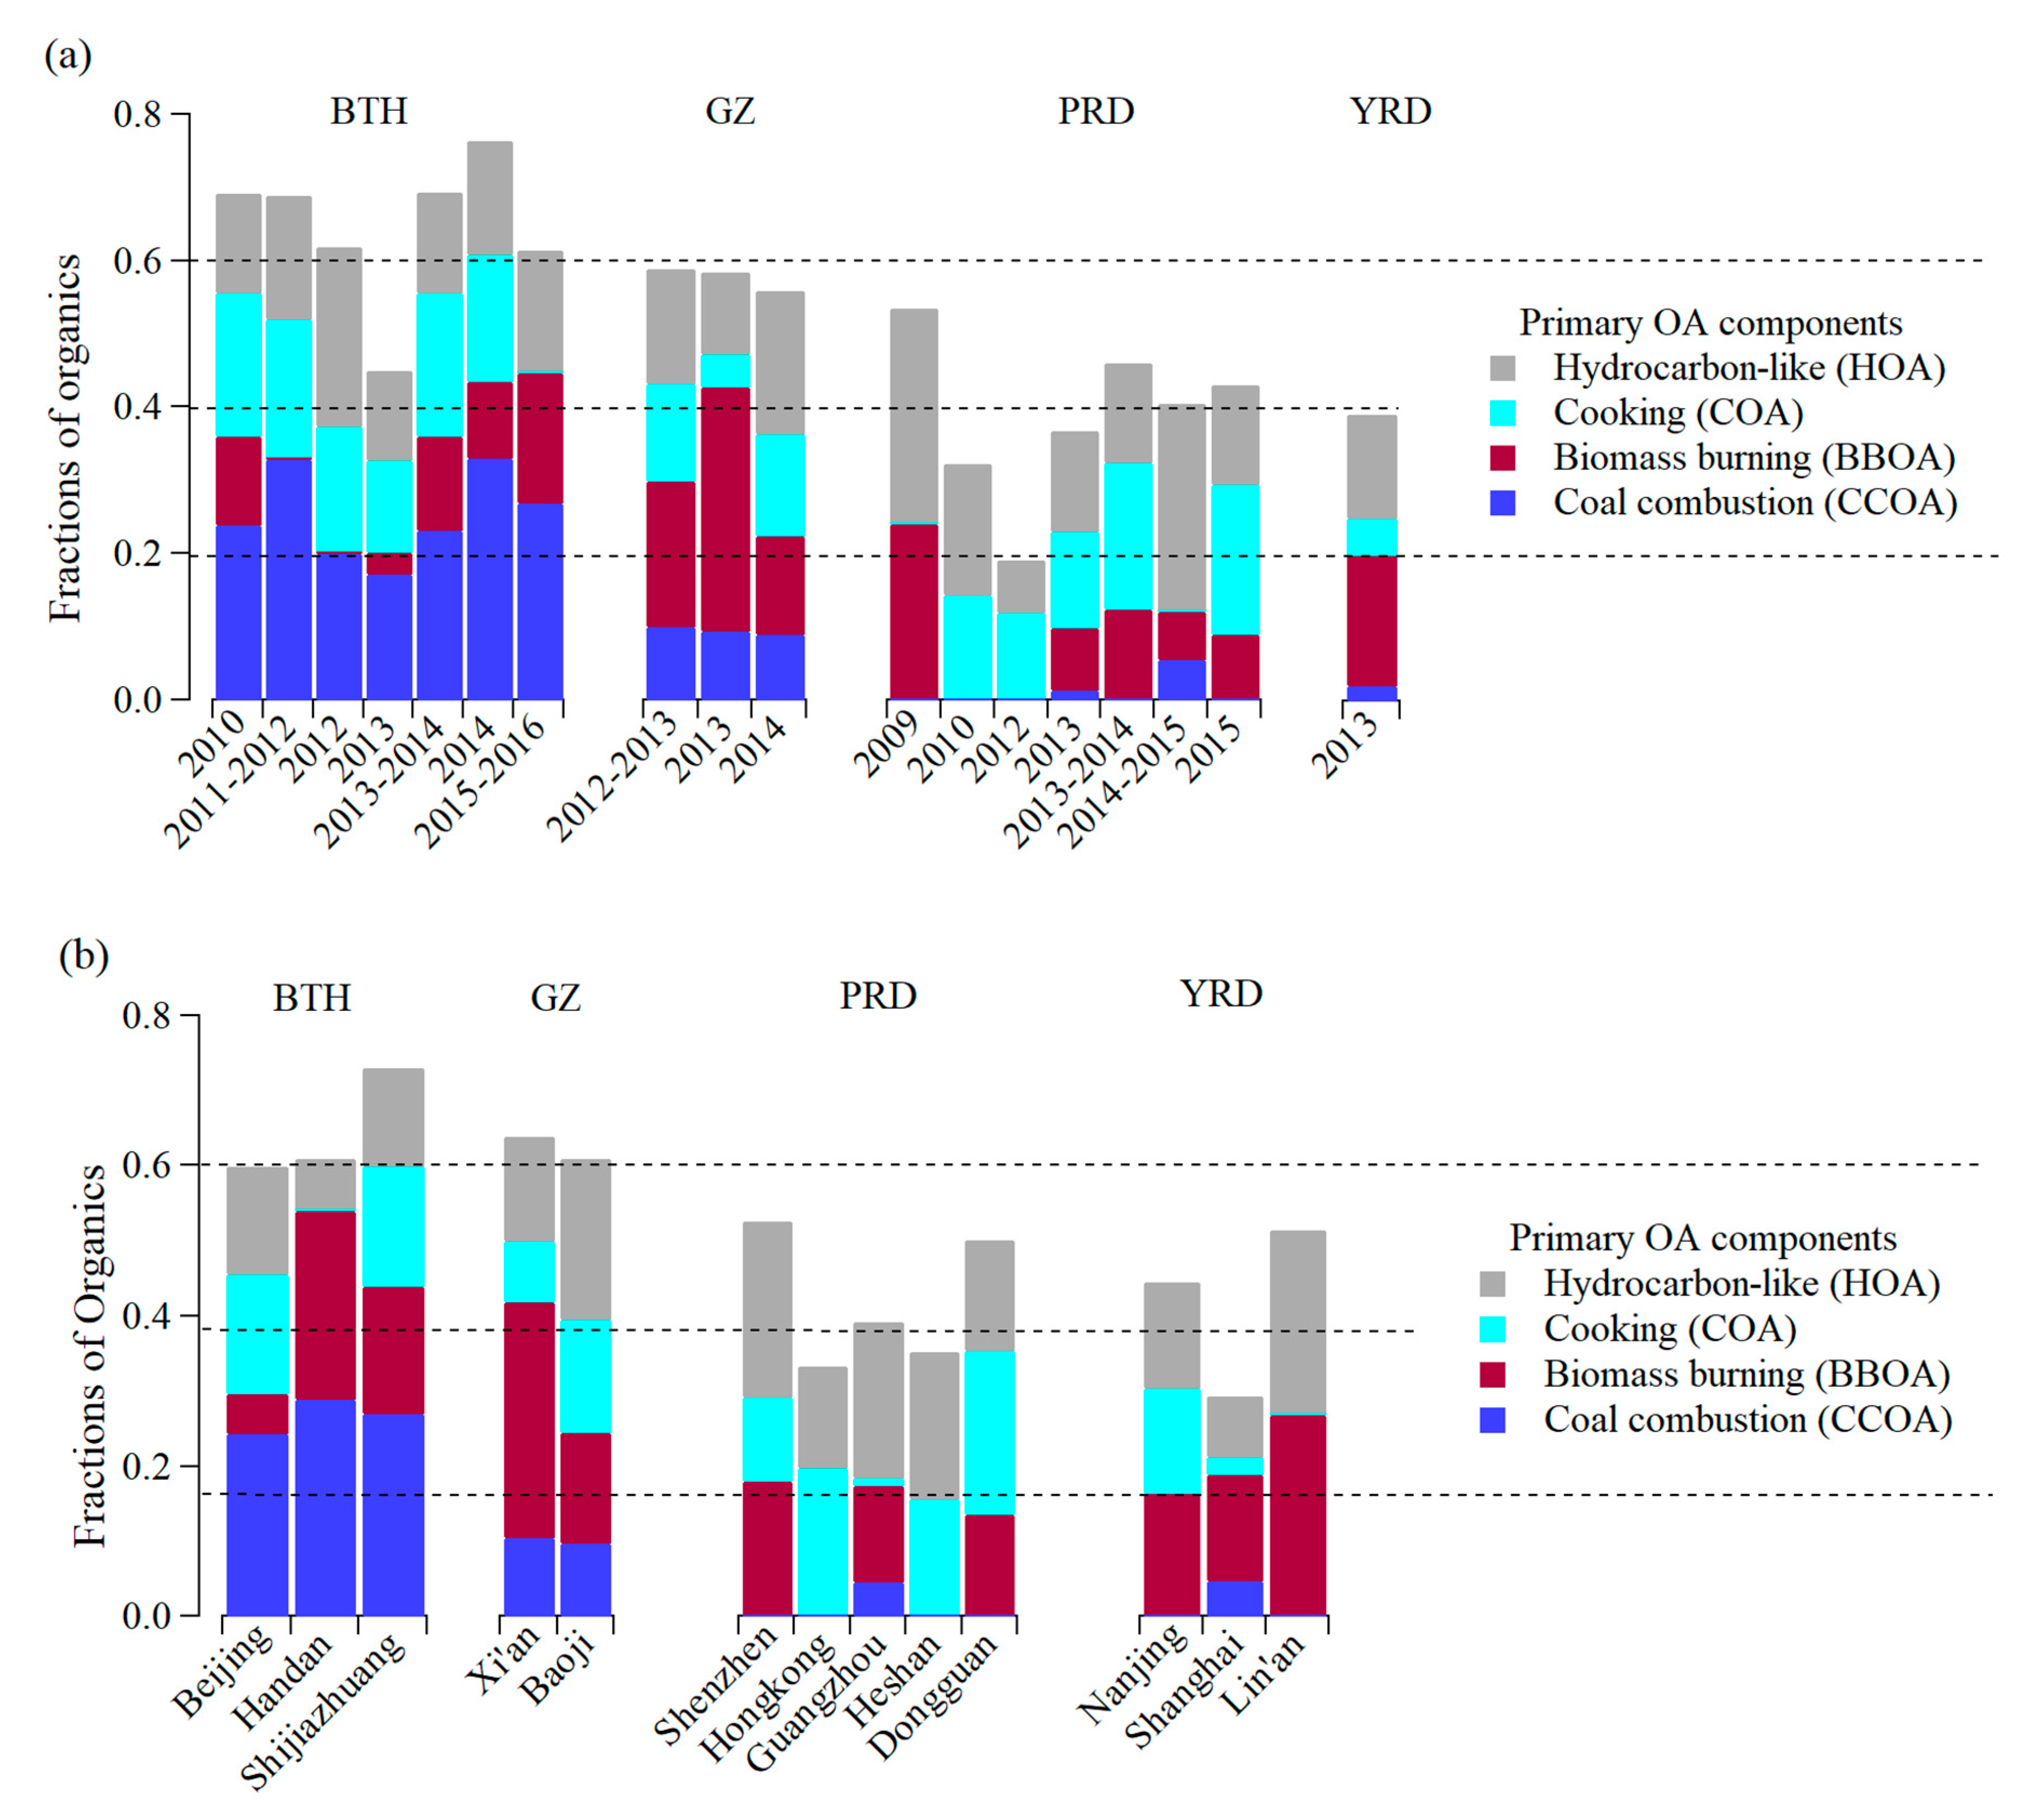
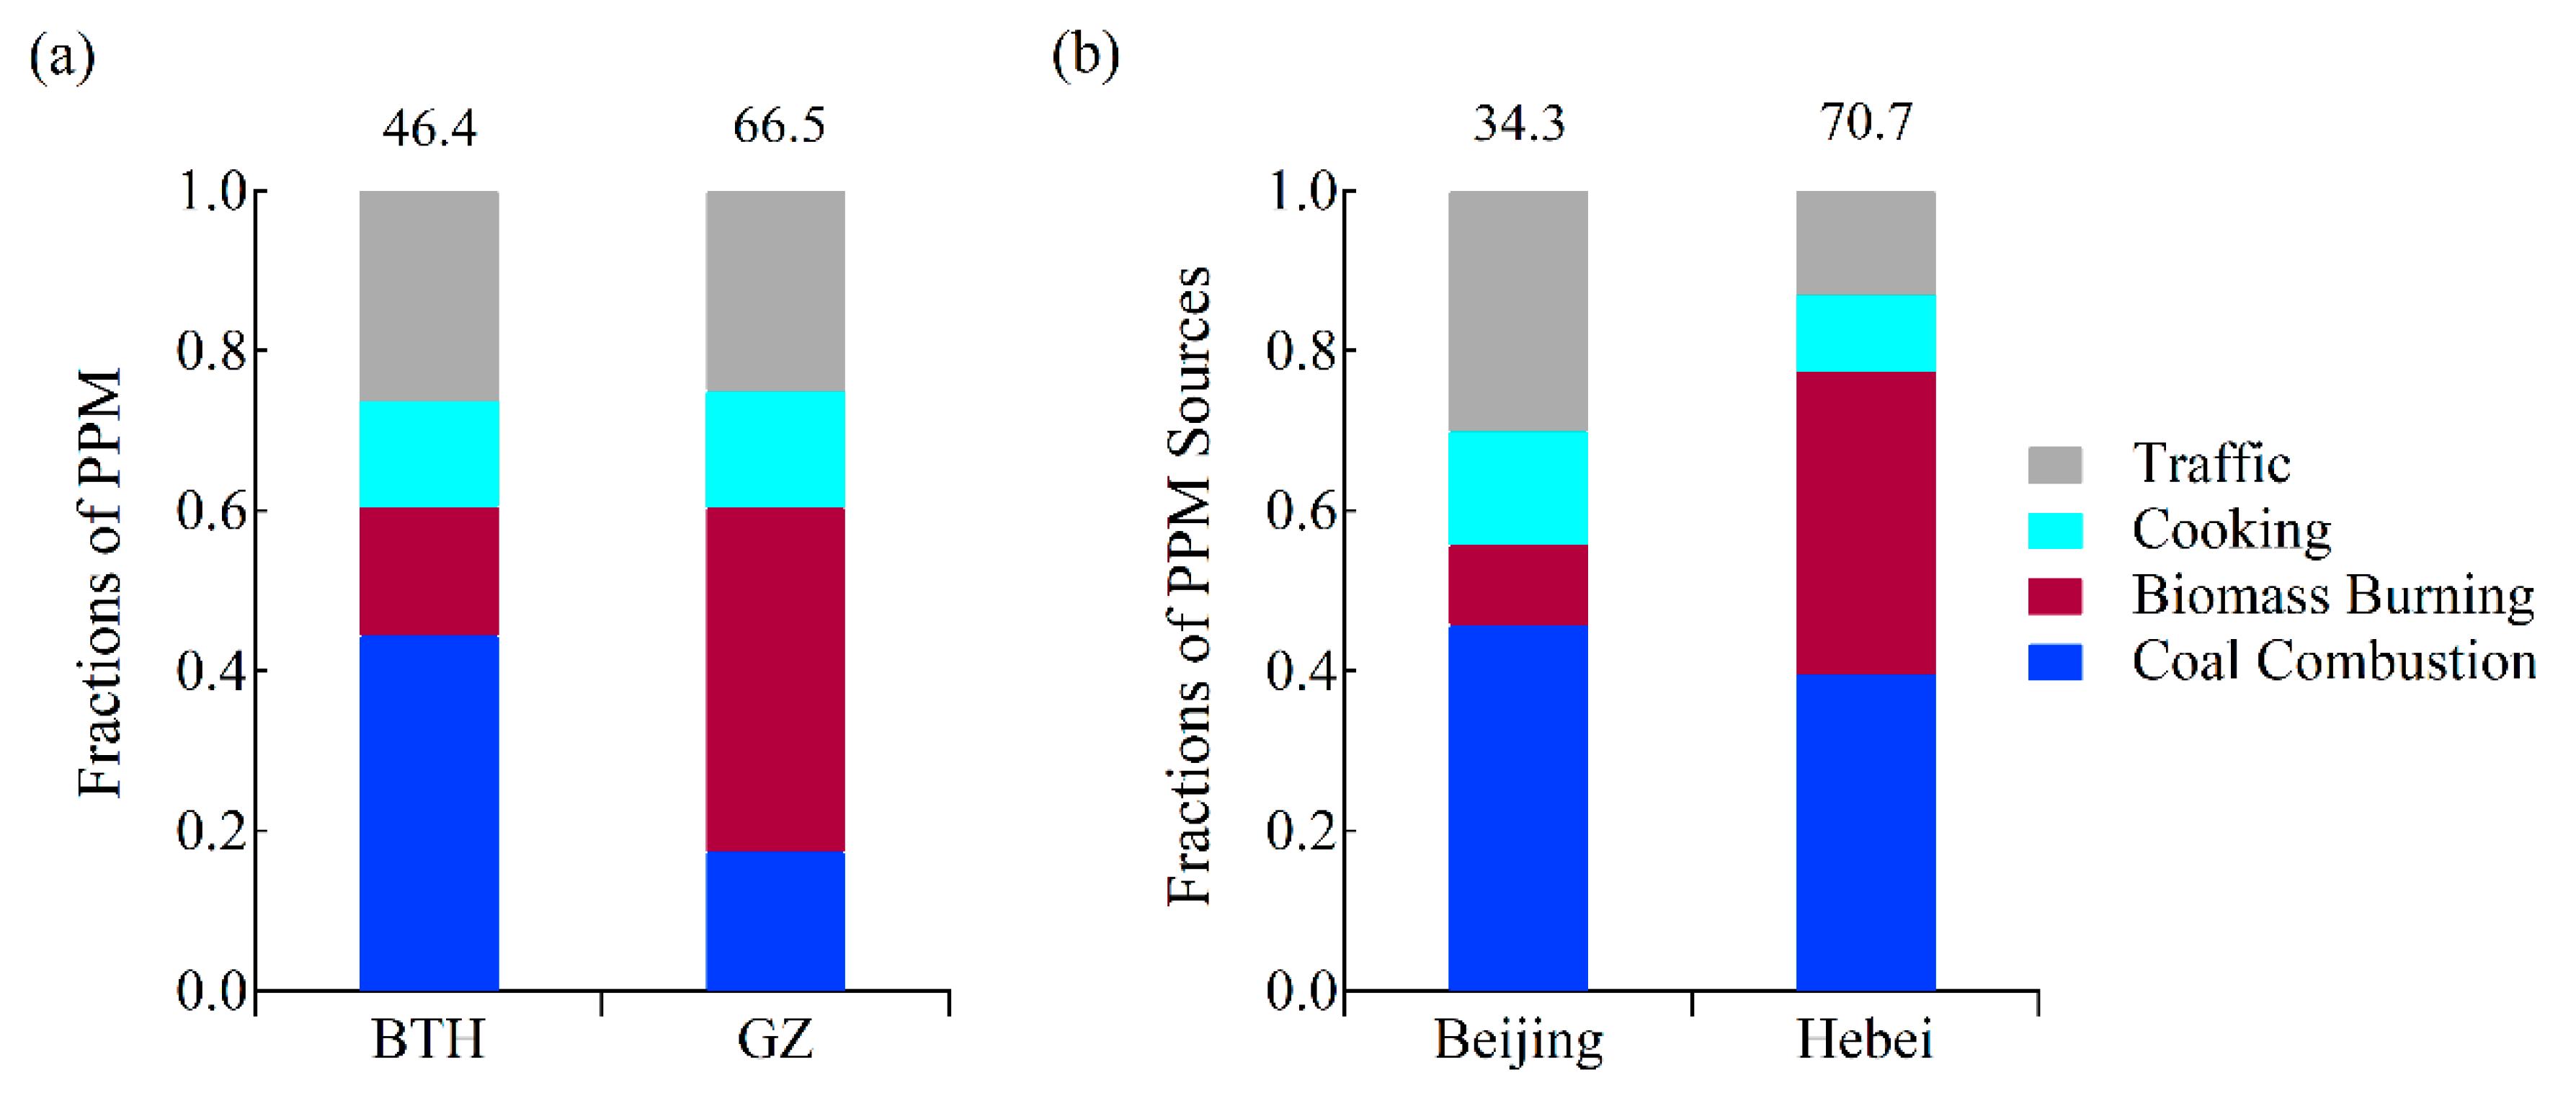
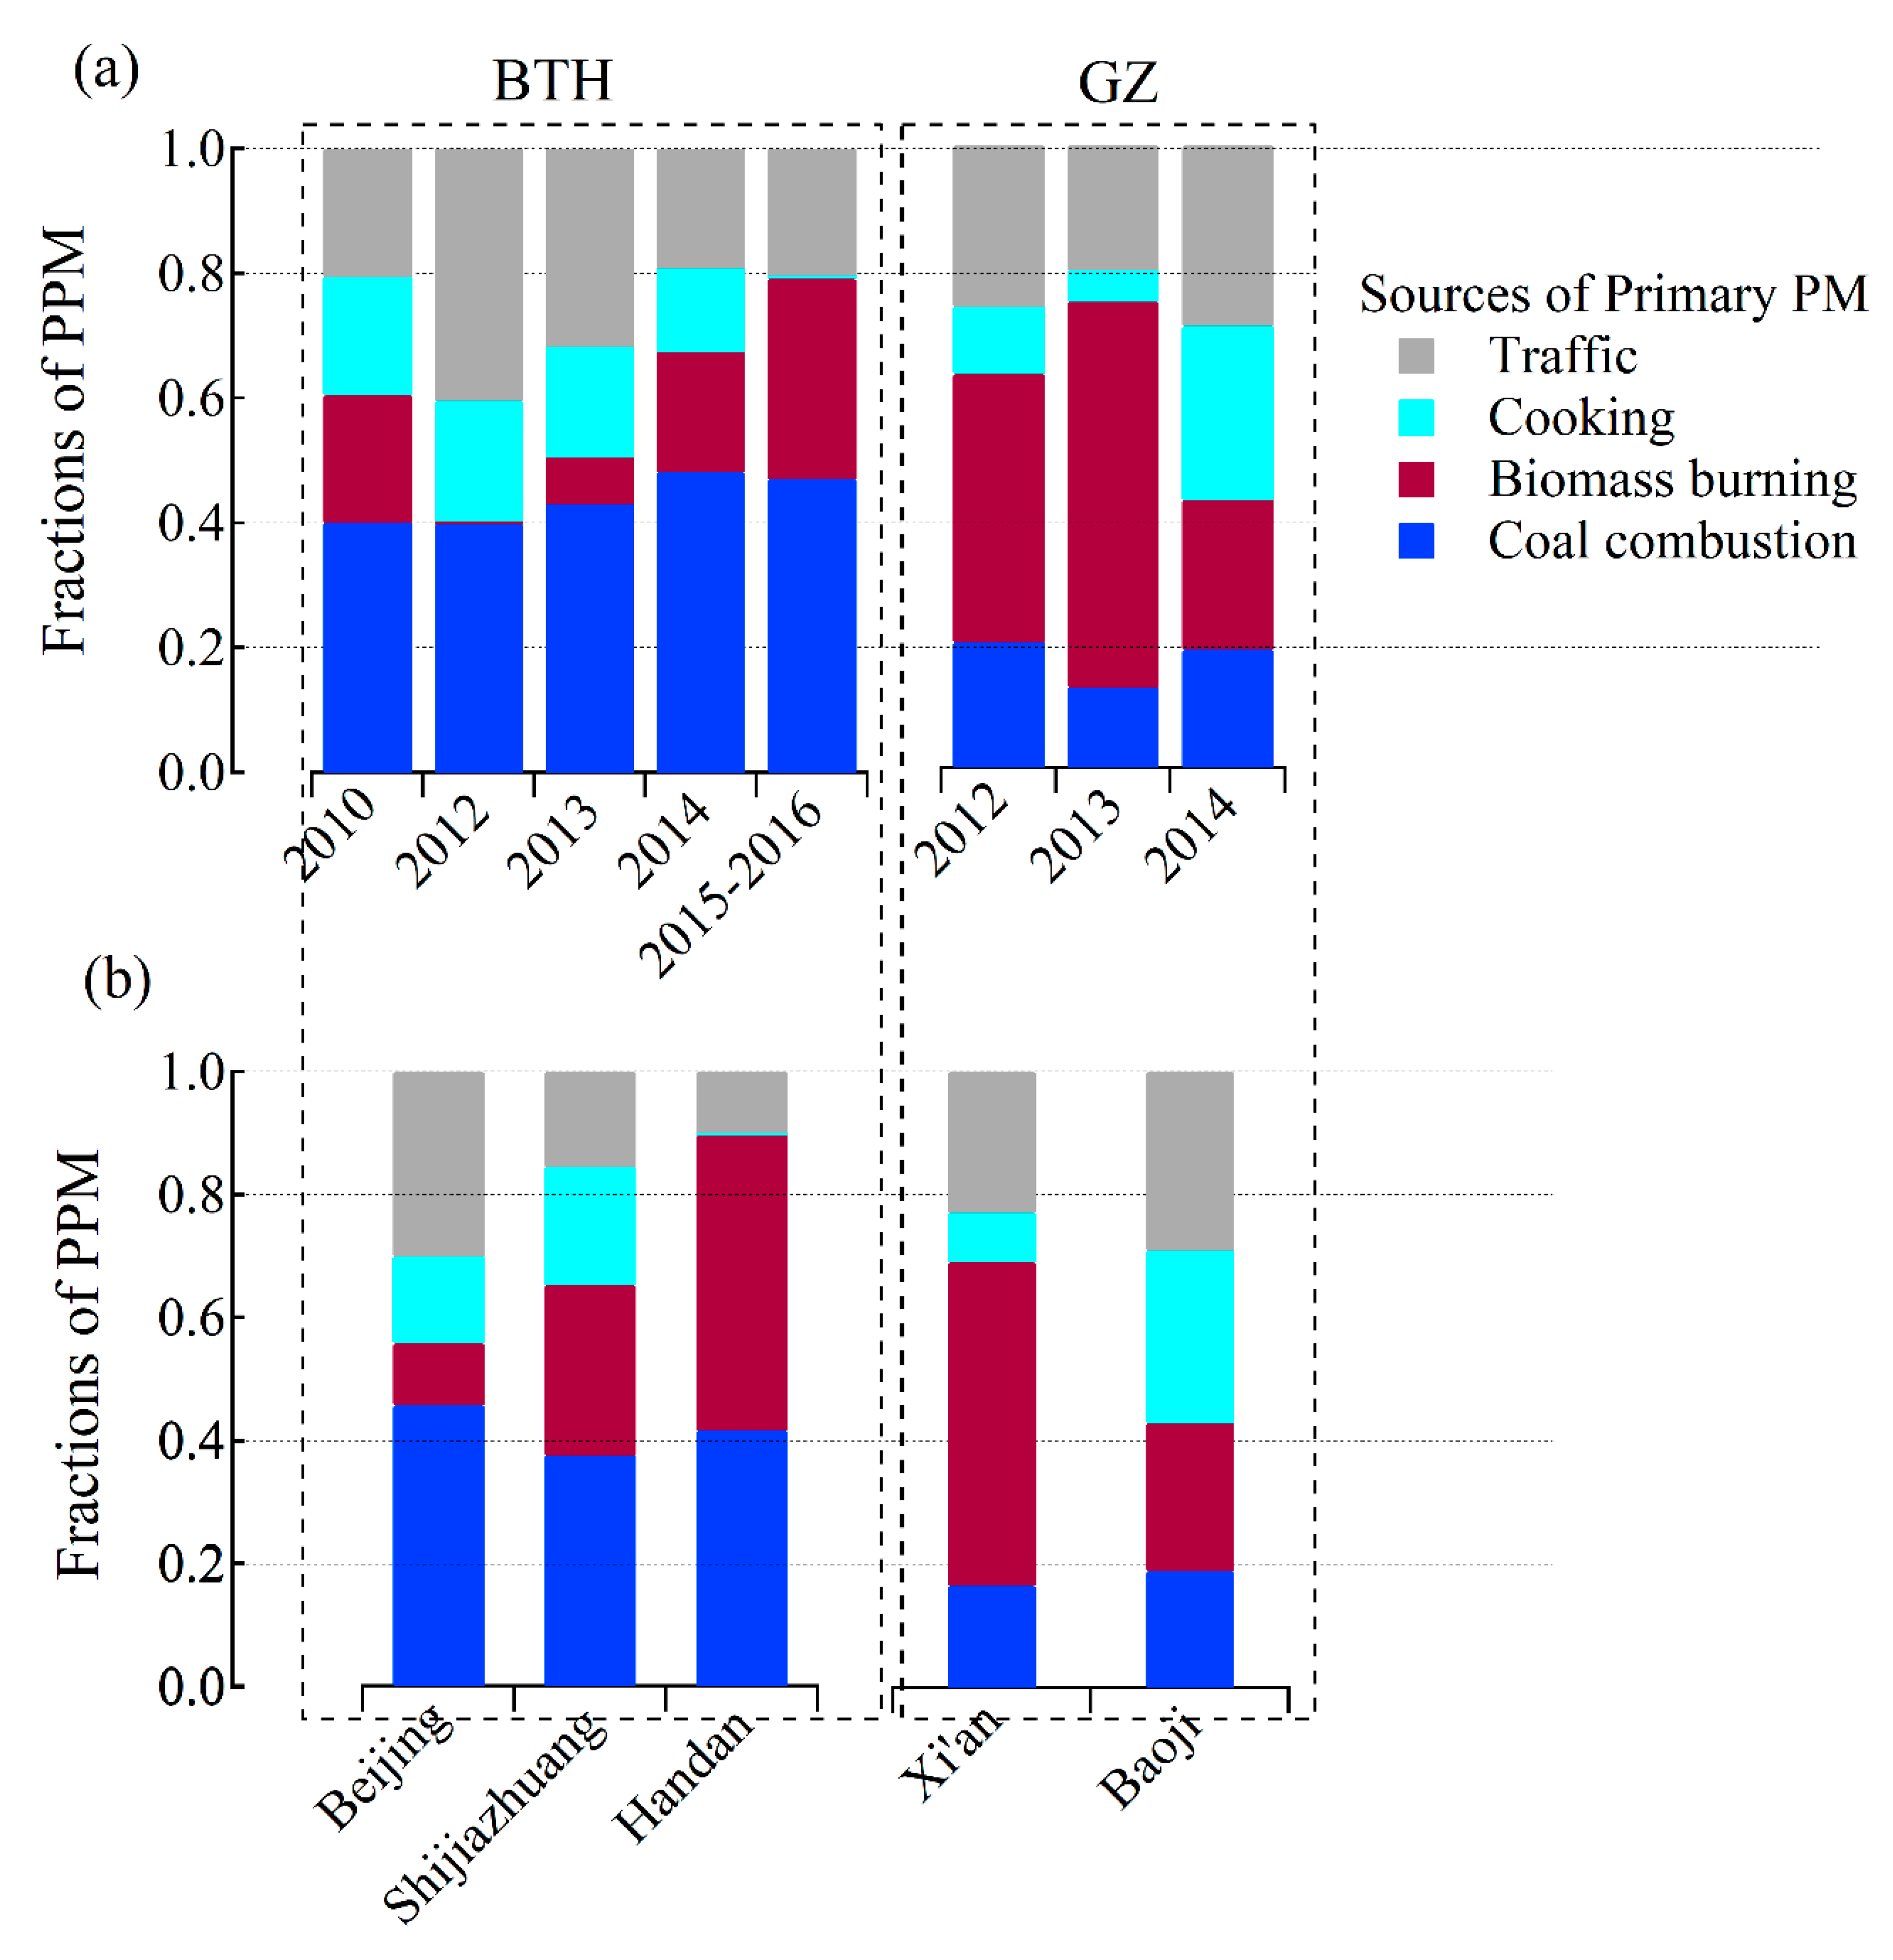
3.2. Sources of Particulate Matter

The organic sources were identified and quantified. Figure 2b shows the relative contributions of the main organic sources. The terms of low-volatility OOA (LV-OOA) and semi-volatile OOA (SV-OOA) were originally used, whilst newer studies referred to more oxidized OOA (MO-OOA) and less-oxidized OOA (LO-OOA) [22,31,35,43,44,45]. The OOAs at different aging levels are formed through different atmospheric processes (e.g., aqueous phase reactions and photochemical reactions). However, there is controversy as to which process dominates the formation of MO-OOA (or LO-OOA). Hu et al. [46] attribute formation of the LO-OOA (MO-OOA) to the aqueous phase (photochemical) reactions, whereas the opposite was observed in Xu et al. [47]. The OOA was correlated with the SIA species, with a coefficient of determination (R2) ranging from 0.59 to 0.93, indicating that the OOA was mainly secondary in its origin. In the BTH region, OOA was more correlated to nitrate (R2 = 0.60–0.82) than sulfate (R2 = 0.43–0.65) (e.g., References [22,32,48]). This might be due to the fact that sulfate increases sharply under high RH conditions (e.g., [22,32]), whilst nitrate and OOA increase less rapidly than sulfate [49,50]. In the PRD and YRD regions, MO-OOA was more correlated with SO42− (R2 = 0.49–0.93), whilst LO-OOA correlated more with NO3 (R2 = 0.40–0.83). This was due to the combined effect of the formation mechanism and volatility. In this study, the subtypes of OOA were merged for ease of comparison.
The contributions of organic sources were also different across the four regions (Figure 2b). Primary sources (e.g., HOA, COA, BBOA, and CCOA) dominated in the northern regions with mass fractions of 60% in BTH and 58% in GZ, respectively, whilst the major fraction of organics in the PRD and YRD regions consisted of OOA, that is, 65% in the PRD and 59% in the YRD. The most abundant POA were emissions from biomass burning in GZ (25%) and coal combustion in BTH (25%).
The organic composition was similar in the same region when the results were classified and averaged according to the year of the campaign (Figure 4a) or the cities of regions (Figure 4b). The organics were contributed mainly by POA in the BTH and GZ regions, with mass fractions of 56–79% (Figure 4a,b). Meanwhile, the exception was BTH, in January 2013, where the high OOA fraction was mainly due to heterogeneous reactions [51]. In terms of the primary organic species, CCOA contributed the most to OA in BTH with mass fractions of 17–40%, whereas the mass fractions of BBOA were highest (14–33%) in the GZ region. It should be noted that BBOA contributed 17% and 27% to OA mass concentrations in Handan and Shijiazhuang, respectively, which are two major cities of Hebei province in the BTH region. This indicated that the biomass burning emissions also played a nonnegligible role in air pollution in the Hebei province. However, the dominant contributor (27–29%) was still CCOA in Handan and Shijiazhuang.
The emissions from coal combustion contributed the most to primary particulate matter (PPM, including primary OA, Cl, and BC) in the BTH region, with an average mass contribution of 44% (Figure 5a,b). The contribution by emissions from coal combustion was highest in the different cities of this region with mass fractions ranging from 38% to 46% (Figure 6a), or in different years of the campaigns with mass fractions ranging from 40% to 48% (Figure 6b). Unlike the BTH region, the biomass burning emissions contributed the most to PPM in the GZ region, with an average of 43% (Figure 5a). The contributions from biomass burning emissions were highest in different years of the campaign with mass fractions of 43–62%, and in the city of Xi’an which had an average mass fraction of 52%. However, the contribution of biomass burning was lower than the emissions from cooking and traffic in Baoji in 2014 (Figure 6b). Since the campaign in Baoji occurred at the end of the heating season (27 February to 26 March 2014) and the temperatures had begun to rise, the biomass burning activities for domestic heating had probably decreased. To summarize, it was found that the dataset in different regions may represent to some extent the difference in compositions, e.g., more sulfate in the PRD versus more nitrate in the YRD, and in sources, e.g., more coal combustion in the BTH versus more biomass burning in GZ. The findings in this study confirmed some of the findings from older reviews, i.e., higher contributions from burning sources in northern China and secondary aerosols in southern China [4], high nitrate/sulfate (N/S) ratios in the YRD region, and low N/S ratios in the PRD region [2].
We reported on the enhanced secondary aerosol formations on polluted winter days in the four regions in China [29]. Specifically, the secondary aerosols increased on polluted days in the BTH and GZ regions. Thus, the average contributions from burning sources were reduced because of the enhanced secondary processes on polluted days. The enhanced nitrate formation on polluted days could increase the average mass fractions of nitrate in the PRD and YRD regions, whereas the reduced sulfate formation in the PRD region could decrease the average sulfate mass fraction.
We calculated the average composition of aerosol chemical species and organic sources on the days of the lowest 5% PM concentrations (Figure S1). We could observe that the background was similar to the average, i.e., more sulfate in the PRD, and more coal combustion in BTH versus more biomass burning in GZ. The only difference was that the background nitrate mass fraction was comparable to the sulfate in the YRD region.
Figure S2 shows the average meteorological data (i.e., wind speed, temperature, solar radiation, and relative humidity) during the measurements across the four regions. The low wind speed facilitated the accumulation of PM in the BTH and GZ regions. The high temperature in the PRD region facilitates the changes in the ammonium nitrate from particle to gas phase, which could partly explain why the mass fractions of ammonium nitrate were low in this region. The relatively high solar radiation and relative humidity in the PRD and YRD regions were favorable for the formation of secondary aerosols. Consequently, the mass fractions of the secondary aerosols were higher in these two regions.

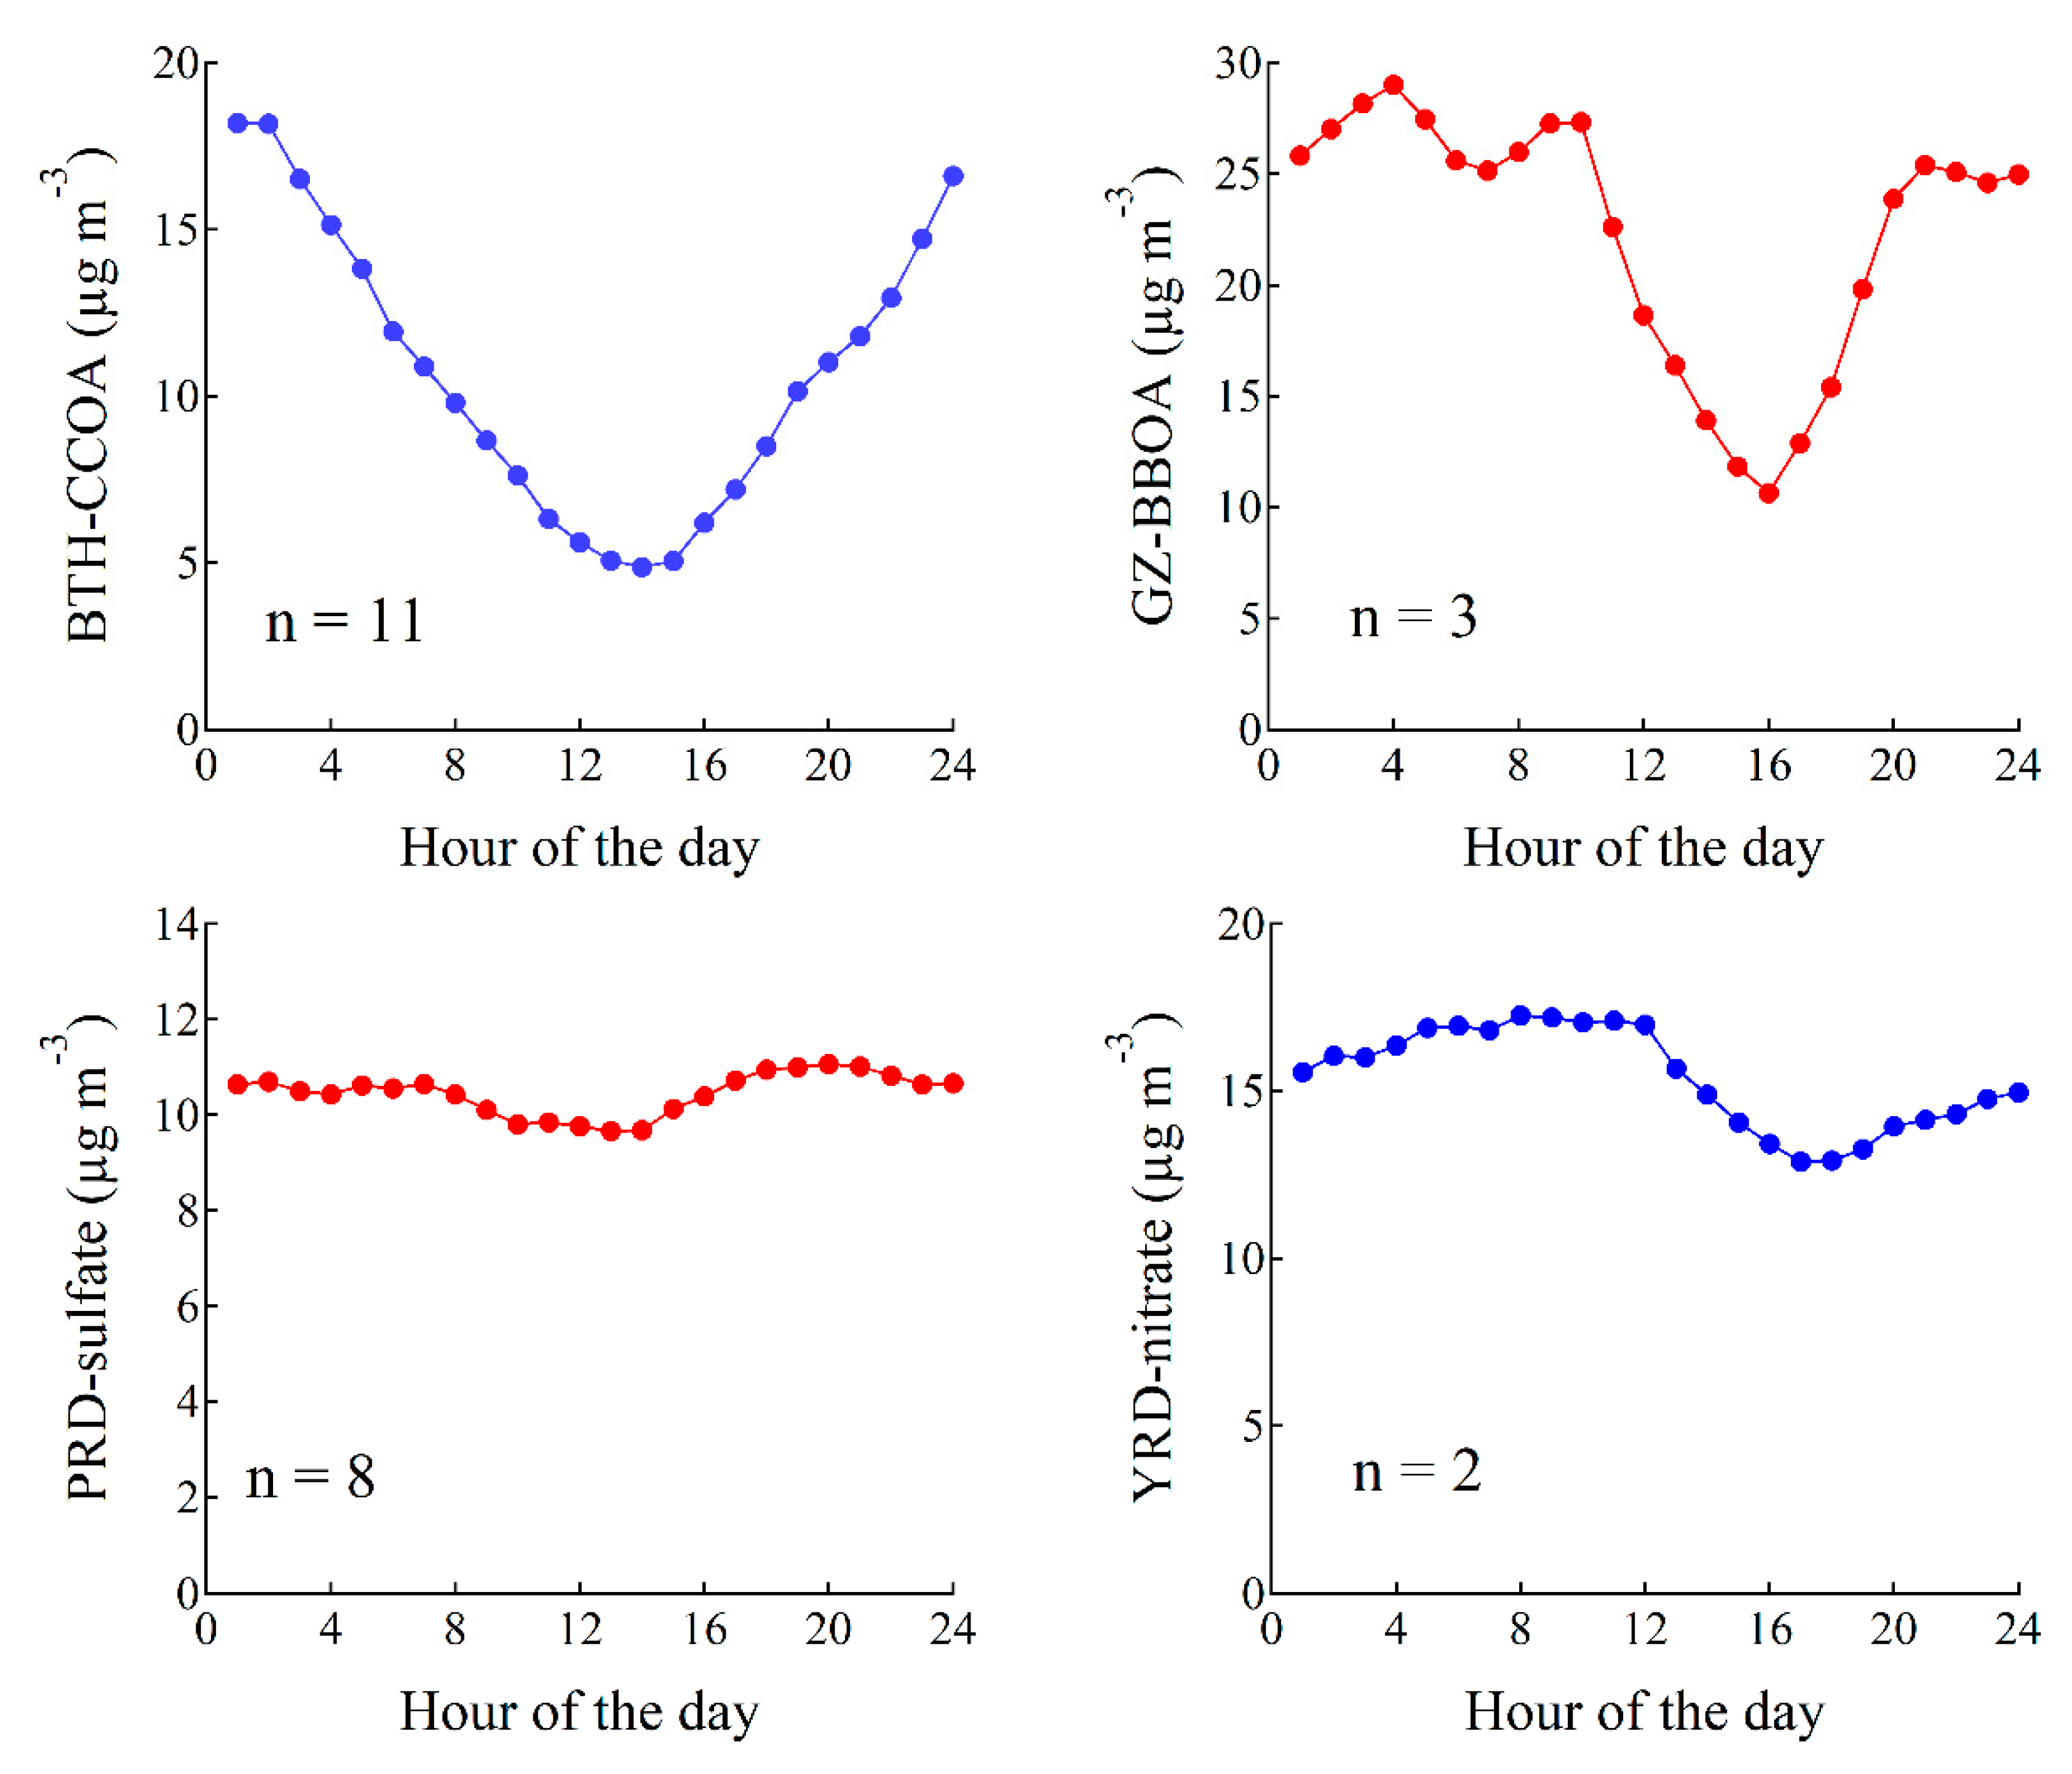
3.3. Diurnal Variations

Figure 7 shows the diurnal variations of BTH-CCOA, GZ-BBOA, PRD-sulfate, and YRD-nitrate, which were affected by the evolution of the mixing layer height that controlled the vertical dispersion of pollutants. The diurnal variations of the PRD-sulfate and YRD-nitrate were also influenced by solar radiation, which increased in the afternoon and favored the formation of secondary aerosols through gas-phase photochemical reactions. The diurnal variations of BTH-CCOA and GZ-BBOA were characterized by high concentrations at night and low concentrations in the afternoon. This was consistent with the enhanced (reduced) heating activities at night (in the afternoon), thereby indicating their local nature. In contrast, weak diurnal variations were observed for the PRD-sulfate, further supporting its regional distribution. The regional nature of the sulfate and its high contribution in the PRD region indicated that the aerosol characteristics in this region were mainly influenced by the regional transport. Indeed, previous studies have shown that long-range transport plays an important role in sulfate pollution over the PRD region, with contributions ranging from 66.8% to 94.0% across cities in the PRD region [52,53]. The diurnal variation in the YRD showed that nitrate exhibited high concentrations at night or in the morning and low concentrations in the afternoon, correlating to that of RH [54]. This indicated that the homogenous reaction might have influenced the nitrate formation. The diurnal variation of the YRD-nitrate anti-correlated with the temperature, indicating that the temperature facilitated the transfer of semi-volatile ammonium nitrate from the solid to gas phase.

4. Discussion

There were differences in the compositions of NR-PM across the regions, e.g., more sulfate in the PRD and more nitrate in the YRD. The regional nature of PRD-sulfate may imply that the air conditions in the PRD region are influenced more by the regional transport rather than the local emissions. Indeed, the superregional transport (transport from other regions) was reported to contribute 62% to PM, 80% to sulfate, and 56% to nitrate in the PRD region during wintertime [53,55]. Thus, the reduction of local emissions is not enough, and cooperation with other regions is necessary for the control of PM concentrations in the PRD region.
There were also differences in the organic sources across the regions, e.g., more coal combustion in BTH versus more biomass burning in GZ. The coal emissions can be from the power sector, the industrial sector, and the household [56]. Although the power sector consumes most of the coal, the emission factor of PM in coal-fired power plants is much lower than the factor from household solid fuel combustion (coal and biomass) [57,58]. It has been reported that residential emissions (coal and biomass) dominate the primary PM2.5 and OC emissions in northern China during wintertime [59]. Therefore, the high contributions of burning sources in northern China can be attributed to the household emissions.
Within the cities of the BTH and GZ regions, over time the control policies had not improved the air quality during wintertime up until 2017 when the PM2.5 mass concentration decreased by 34–50% in the BTH region and 23–29% in the GZ region compared to that in 2016 (Figure S3). The obvious reduction maybe related to the reduction in coal use for domestic heating and cooking by ~10 million tons in 2017 [28]. Till now, the use of biomass for domestic heating and cooking (household biomass burning) had not yet received attention, although the PM emission factors of 8.05 and 3.82 g kg−1 for crop residues and wood were much higher than the 1.30 g kg−1 for domestic coal burning and 0.53 g kg−1 for coal-fired power plants [57,58]. This could partly explain why the air condition is still severe in the cities of the GZ region and Hebei province, where BBOA is the primary or secondary contributor to POA (Figure S3).
The total compositional information of aerosol constituents in the four regions could provide some insights into the development of cost-effective measures. The inorganic and organic compositions of NR-PM are similar in cities of the same region and different across regions. Hence, it would be more effective to implement an air pollution control approach that prioritizes the reduction from sources at the regional level. In particular, strict control policies for coal combustion and biomass burning emissions should be enforced in the BTH and GZ regions, respectively.

5. Conclusions

The spatial distribution and diurnal variations of aerosol composition and organic sources were analyzed to investigate the aerosol characteristics in four regions. It was found that there were differences in the compositions of non-refractory particulate matter across the regions, e.g., more sulfate in the PRD versus more nitrate in the YRD, and in the organic sources, e.g., more coal combustion in BTH versus more biomass burning in GZ. The characteristics of the composition of NR-PM are similar when the campaigns were classified according to the winter of different years or the cities of different regions. The diurnal variations of the PRD-sulfate indicated its regional nature, whereas the organics from burning sources in two regions of northern China exhibited local characteristics. Household biomass burning should receive attention in the future, especially in the GZ region and Hebei province where BBOA is the primary or secondary contributor to POA. Moreover, cooperation with other regions is necessary for the control of PM concentrations in the PRD region. This study is of great significance for further understanding air pollution in China and providing a scientific basis for targeted air pollution control measures in specific regions.

Supplementary Materials

The following are available online at https://www.mdpi.com/2073-4433/10/5/277/s1, Figure S1: (a) chemical compositions of inorganic aerosols and (b) fractions of organic sources in four representative regions of China during wintertime on the days of the lowest 5% PM concentrations. The dotted box refers to the primary organic aerosols., Figure S2: comparison of meteorological data (wind speed, temperature, relative humidity, and solar radiation) in the four regions during the selected study period. The SR refers to the average solar radiation from 12:00 to 18:00, Figure S3: average mass concentration of PM2.5 during wintertime from 2014 to 2017 in representative cities of four regions, Table S1: summary of publications selected in this study.

Author Contributions

Conceptualization, Y.W., Q.W. and J.C.; Data curation, Y.W.; Formal analysis, Y.W. and M.Y.; Funding acquisition, Y.W., Q.W., A.S.H.P. and J.C.; Investigation, Y.W.; Methodology, Y.W. and Q.W.; Supervision, Q.W., Q.Q., A.S.H.P. and J.C.; Writing – original draft, Y.W.; Writing – review & editing, Q.W., J.Y. and J.C.

Funding

This work was funded by the National Natural Science Foundation of China (71804115 and 21661132005), the Key Research and Development Program of Shaanxi Province (2018ZDCXL-SF-30-5), the Swiss national Science Foundation (IZLCZ2_169986), the open Fund of the State Key Laboratory of Loess and Quaternary Geology (SKLLQG1834).

Acknowledgments

Qiyuan Wang acknowledges the Youth Innovation Promotion Association Chinese Academy of Sciences. We also acknowledge support from the Swiss Agency for Development and Cooperation (SDC) in the framework of the Sino-Swiss Cooperation on Air Pollution within the project “Breaking down the Dome”.

Conflicts of Interest

The authors declare no conflict of interest.

References

  1. Huang, R.J.; Zhang, Y.; Bozzetti, C.; Ho, K.F.; Cao, J.J.; Han, Y.; Daellenbach, K.R.; Slowik, J.G.; Platt, S.M.; Canonaco, F.; et al. High secondary aerosol contribution to particulate pollution during haze events in China. Nature 2014, 514, 218–222. [Google Scholar] [CrossRef] [Green Version]
  2. Li, Y.J.; Sun, Y.; Zhang, Q.; Li, X.; Li, M.; Zhou, Z.; Chan, C.K. Real-time chemical characterization of atmospheric particulate matter in China: A review. Atmos. Environ. 2017, 158, 270–304. [Google Scholar] [CrossRef]
  3. Tao, J.; Zhang, L.M.; Cao, J.; Zhang, R.J. A review of current knowledge concerning PM2.5 chemical composition, aerosol optical properties, and their relationships across China. Atmos. Chem. Phys. 2017, 17, 9485–9518. [Google Scholar] [CrossRef]
  4. Zhang, Y.; Cai, J.; Wang, S.; He, K.; Zheng, M. Review of receptor-based source apportionment research of fine particulate matter and its challenges in China. Sci. Total Environ. 2017, 586, 917–929. [Google Scholar] [CrossRef]
  5. Cao, J.; Xu, H.; Xu, Q.; Chen, B.; Kan, H. Fine particulate matter constituents and cardiopulmonary mortality in a heavily polluted Chinese city. Environ. Health Perspect. 2012, 120, 373–378. [Google Scholar] [CrossRef] [PubMed]
  6. Yang, L.X.; Zhou, X.H.; Wang, Z.; Zhou, Y.; Cheng, S.H.; Xu, P.J.; Gao, X.M.; Nie, W.; Wang, X.F.; Wang, W.X. Airborne fine particulate pollution in Jinan, China: Concentrations, chemical compositions and influence on visibility impairment. Atmos. Environ. 2012, 55, 506–514. [Google Scholar] [CrossRef]
  7. Wang, Q.; Cao, J.; Tao, J.; Li, N.; Su, X.; Chen, L.W.A.; Wang, P.; Shen, Z.; Liu, S.; Dai, W. Long-term trends in visibility and at Chengdu, China. PLoS ONE 2013, 8, e68894. [Google Scholar] [CrossRef] [PubMed]
  8. Lelieveld, J.; Evans, J.S.; Fnais, M.; Giannadaki, D.; Pozzer, A. The contribution of outdoor air pollution sources to premature mortality on a global scale. Nature 2015, 525, 367–371. [Google Scholar] [CrossRef]
  9. China’s State Council. Action Plan for Air Pollution Prevention and Control. 2013. Available online: http://gov.cn/zwgk/2013-09/12/ content_2486773.html (accessed on 10 September 2013).
  10. Beijing Municipal Government. 2013–2017 Clean Air Action Plan of Beijing. 2013. Available online: http://zfxxgk.beijing.gov.cn/110001/szfwj/2013-09/12/contentcae7ba16b4bb46d68d78a11e928aebcd.shtml (accessed on 2 September 2013).
  11. Shao, S.; Tian, Z.; Fan, M. Do the rich have stronger willingness to pay for environmental protection? New evidence from a survey in China. World Dev. 2018, 105, 83–94. [Google Scholar] [CrossRef]
  12. Cao, J.J. Pollution status and control strategies of PM2.5 in China. J. Earth Environ. 2012, 3, 1030–1036. [Google Scholar]
  13. Jimenez, J.L.; Canagaratna, M.R.; Donahue, N.M.; Prevot, A.S.H.; Zhang, Q.; Kroll, J.H.; DeCarlo, P.F.; Allan, J.D.; Coe, H.; Ng, N.L.; et al. Evolution of organic aerosols in the atmosphere. Science 2009, 326, 1525–1529. [Google Scholar] [CrossRef]
  14. Fröhlich, R.; Cubison, M.J.; Slowik, J.G.; Bukowiecki, N.; Prévôt, A.S.H.; Baltensperger, U.; Schneider, J.; Kimmel, J.R.; Gonin, M.; Rohner, U.; et al. The ToF-ACSM: A portable aerosol chemical speciation monitor with TOFMS detection. Atmos. Meas. Tech. 2013, 6, 3225–3241. [Google Scholar] [CrossRef]
  15. Elser, M.; Huang, R.-J.; Wolf, R.; Slowik, J.G.; Wang, Q.; Canonaco, F.; Li, G.; Bozzetti, C.; Daellenbach, K.R.; Huang, Y.; et al. New insights into PM2.5 chemical composition and sources in two major cities in China during extreme haze events using aerosol mass spectrometry. Atmos. Chem. Phys. 2016, 16, 3207–3225. [Google Scholar] [CrossRef]
  16. Sun, Y.; Du, W.; Fu, P.; Wang, Q.; Li, J.; Ge, X.; Zhang, Q.; Zhu, C.; Ren, L.; Xu, W.; et al. Primary and secondary aerosols in Beijing in winter: Sources, variations and processes. Atmos. Chem. Phys. 2016, 16, 8309–8329. [Google Scholar] [CrossRef]
  17. Paatero, P.; Tapper, U. Positive Matrix Factorization: A nonnegative factor model with optimal utilization of error estimates of data values. Environmetrics 1994, 5, 111–126. [Google Scholar] [CrossRef]
  18. Paatero, P. Least squares formulation of robust non-negative factor analysis. Chemom. Intell. Lab. Syst. 1997, 37, 23–35. [Google Scholar] [CrossRef]
  19. Canonaco, F.; Crippa, M.; Slowik, J.G.; Baltensperger, U.; Prévôt, A.S.H. SoFi, an Igor based interface for the efficient use of the generalized multilinear engine (ME-2) for source apportionment: Application to aerosol mass spectrometer data. Atmos. Meas. Tech. 2013, 6, 3649–3661. [Google Scholar] [CrossRef]
  20. Lanz, V.A.; Alfarra, M.R.; Baltensperger, U.; Buchmann, B.; Hueglin, C.; Prevot, A.S.H. Source apportionment of submicron organic aerosols at an urban site by factor analytical modelling of aerosol mass spectra. Atmos. Chem. Phys. 2007, 7, 1503–1522. [Google Scholar] [CrossRef] [Green Version]
  21. Zhang, Q.; Jimenez, J.L.; Canagaratna, M.R.; Allan, J.D.; Coe, H.; Ulbrich, I.; Alfarra, M.R.; Takami, A.; Middlebrook, A.M.; Sun, Y.L.; et al. Ubiquity and dominance of oxygenated species in organic aerosols in anthropogenically-influenced Northern Hemisphere midlatitudes. Geophys. Res. Lett. 2007, 34, L13801. [Google Scholar] [CrossRef]
  22. Wang, Y.C.; Huang, R.J.; Ni, H.Y.; Chen, Y.; Wang, Q.Y.; Li, G.H.; Tie, X.X.; Shen, Z.X.; Huang, Y.; Liu, S.X.; et al. Chemical composition, sources and secondary processes of aerosols in Baoji city of northwest China. Atmos. Environ. 2017, 158, 128–137. [Google Scholar] [CrossRef]
  23. Dall’Osto, M.; Paglione, M.; Decesari, S.; Facchini, M.C.; O’Dowd, C.; Plass-Duellmer, C.; Harrison, R.M. On the Origin of AMS “Cooking Organic Aerosol” at a Rural Site. Environ. Sci. Technol. 2015, 49, 13964–13972. [Google Scholar] [CrossRef]
  24. Jayne, J.T.; Leard, D.C.; Zhang, X.F.; Davidovits, P.; Smith, K.A.; Kolb, C.E.; Worsnop, D.R. Development of an Aerosol Mass Spectrometer for Size and Composition Analysis of Submicron Particles. Aerosol Sci. Technol. 2000, 33, 49–70. [Google Scholar] [CrossRef] [Green Version]
  25. Ng, N.L.; Herndon, S.C.; Trimborn, A.; Canagaratna, M.R.; Croteau, P.L.; Onasch, T.B.; Sueoer, D.; Worsnop, D.R.; Zhang, Q.; Sun, Y.L.; et al. An Aerosol Chemical Speciation Monitor (ACSM) for routine monitoring of the composition and mass concentrations of ambient aerosol. Aerosol Sci. Technol. 2011, 45, 770–784. [Google Scholar] [CrossRef]
  26. Zhu, Y.; Huang, L.; Li, J.; Ying, Q.; Zhang, H.; Liu, X.; Liao, H.; Li, N.; Liu, Z.; Mao, Y.; et al. Sources of particulate matter in China: Insights from source apportionment studies published in 1987–2017. Environ. Int. 2018, 115, 343–357. [Google Scholar] [CrossRef] [PubMed]
  27. Shao, S.; Li, X.; Cao, J.H.; Yang, L.L. China’s economic policy choices for governing smog pollution based on spatial spillover effects. Econ. Res. J. 2016, 9, 73–88. (In Chinese) [Google Scholar]
  28. MEP (Ministry of Environmental Protection of China). Environmental Quality Bulletin of China. Available online: http://www.zhb.gov.cn/hjzl/zghjzkgb/lnzghjzkgb/201805/P020180531534645032372.pdf (accessed on 1 July 2018). (In Chinese)
  29. Wang, Y.C.; Chen, J.; Wang, Q.Y.; Qin, Q.D.; Ye, J.H.; Han, Y.M.; Li, L.; Zhen, W.; Zhang, Y.X.; Zhi, Q.; et al. Increased secondary aerosol contribution and possible processing on polluted winter days in China. Environ. Int. 2019, 127, 78–84. [Google Scholar] [CrossRef]
  30. Sun, Y.; Du, W.; Wang, Q.; Zhang, Q.; Chen, C.; Chen, Y.; Chen, Z.; Fu, P.; Wang, Z.; Gao, Z. Real-Time Characterization of Aerosol Particle Composition above the Urban Canopy in Beijing: Insights into the Interactions between the Atmospheric Boundary Layer and Aerosol Chemistry. Environ. Sci. Technol. 2015, 49, 11340–11347. [Google Scholar] [CrossRef]
  31. Hu, W.; Hu, M.; Hu, W.W.; Zheng, J.; Chen, C.; Wu, Y.S.; Guo, S. Seasonal variations in high time-resolved chemical compositions, sources, and evolution of atmospheric submicron aerosols in the megacity Beijing. Atmos. Chem. Phys. 2017, 17, 9979–10000. [Google Scholar] [CrossRef] [Green Version]
  32. Sun, Y.L.; Jiang, Q.; Wang, Z.F.; Fu, P.Q.; Li, J.; Yang, T.; Yin, Y. Investigation of the sources and evolution processes of severe haze pollution in Beijing in January 2013. J. Geophys. Res. 2014, 119, 4380–4398. [Google Scholar] [CrossRef] [Green Version]
  33. Zhang, J.K.; Sun, Y.; Liu, Z.R.; Ji, D.S.; Hu, B.; Liu, Q.; Wang, Y.S. Characterization of submicron aerosols during a month of serious pollution in Beijing, 2013. Atmos. Chem. Phys. 2014, 14, 2887–2903. [Google Scholar] [CrossRef] [Green Version]
  34. Xu, J.; Zhang, Q.; Chen, M.; Ge, X.; Ren, J.; Qin, D. Chemical composition, sources, and processes of urban aerosols during summertime in northwest China: Insights from high-resolution aerosol mass spectrometry. Atmos. Chem. Phys. 2014, 14, 12593–12611. [Google Scholar] [CrossRef]
  35. Li, Y.J.; Lee, B.P.; Su, L.; Fung, J.C.H.; Chan, C.K. Seasonal characteristics of fine particulate matter (PM) based on high-resolution time-of-flight aerosol mass spectrometric (HR-ToF-AMS) measurements at the HKUST Supersite in Hong Kong. Atmos. Chem. Phys. 2015, 15, 37–53. [Google Scholar] [CrossRef] [Green Version]
  36. Zhang, Y.; Zhang, H.; Deng, J.; Du, W.; Hong, Y.; Xu, L.; Qiu, Y.; Hong, Z.; Wu, X.; Ma, Q. Source regions and transport pathways of PM2.5 at a regional background site in east China. Atmos. Environ. 2017, 167, 202–211. [Google Scholar] [CrossRef]
  37. Wang, J.D.; Zhao, B.; Wang, S.X.; Yang, F.M.; Xing, J.; Morawska, L.; Ding, A.J.; Kulmala, M.; Kerminen, V.M.; Kujansuu, J.; et al. Particulate matter pollution over China and the effects of control policies. Sci. Total. Environ. 2017, 584, 426–447. [Google Scholar] [CrossRef]
  38. Lanz, V.A.; Prévôt, A.S.H.; Alfarra, M.R.; Weimer, S.; Mohr, C.; DeCarlo, P.F.; Gianini, M.F.D.; Hueglin, C.; Schneider, J.; Favez, O.; et al. Characterization of aerosol chemical composition with aerosol mass spectrometry in Central Europe: An overview. Atmos. Chem. Phys. 2010, 10, 10453–10471. [Google Scholar] [CrossRef]
  39. Ying, Q.; Wu, L.; Zhang, H. Local and inter-regional contributions to PM2.5 nitrate and sulfate in China. Atmos. Environ. 2014, 94, 582–592. [Google Scholar] [CrossRef]
  40. Zhang, R.; Wang, G.; Guo, S.; Zamora, M.L.; Ying, Q.; Lin, Y.; Wang, W.; Hu, M.; Wang, Y. Formation of urban fine particulate matter. Chem. Rev. 2015, 115, 3803–3855. [Google Scholar] [CrossRef]
  41. Zhang, Q.; Jimenez, J.L.; Worsnop, D.R.; Canagaratna, M. A case study of urban particle acidity and its influence on secondary organic aerosol. Environ. Sci. Technol. 2007, 41, 3213–3219. [Google Scholar] [CrossRef] [PubMed]
  42. Zheng, B.; Zhang, Q.; Zhang, Y.; He, K.B.; Wang, K.; Zheng, G.J.; Duan, F.K.; Ma, Y.L.; Kimoto, T. Heterogeneous chemistry: A mechanism missing in current models to explain secondary inorganic aerosol formation during the January 2013 haze episode in North China. Atmos. Chem. Phys. 2015, 15, 2031–2049. [Google Scholar] [CrossRef]
  43. He, L.Y.; Huang, X.F.; Xue, L.; Hu, M.; Lin, Y.; Zheng, J.; Zhang, R.; Zhang, Y.H. Submicron aerosol analysis and organic source apportionment in an urban atmosphere in Pearl River Delta of China using high-resolution aerosol mass spectrometry. J. Geophys. Res. Atmos. 2011, 116, D12304. [Google Scholar] [CrossRef]
  44. Sun, C.; Lee, B.P.; Huang, D.; Li, Y.J.; Schurman, M.I.; Louie, P.K.; Luk, C.; Chan, C. Continuous measurements at the urban roadside in an Asian megacity by Aerosol Chemical Speciation Monitor (ACSM): Particulate matter characteristics during fall and winter seasons in Hong Kong. Atmos. Chem. Phys. 2016, 16, 1713–1728. [Google Scholar] [CrossRef]
  45. Cao, L.M.; Huang, X.F.; Li, Y.Y.; Hu, M.; He, L.Y. Volatility measurement of atmospheric submicron aerosols in an urban atmosphere in southern China. Atmos. Chem. Phys. 2018, 18, 1729–1743. [Google Scholar] [CrossRef] [Green Version]
  46. Hu, W.; Hu, M.; Hu, W.; Jimenez, J.L.; Yuan, B.; Chen, W.; Wang, M.; Wu, Y.; Chen, C.; Wang, Z.; et al. Chemical composition, sources, and aging process of submicron aerosols in Beijing: Contrast between summer and winter. J. Geophys. Res. Atmos. 2016, 121, 1955–1977. [Google Scholar] [CrossRef]
  47. Xu, J.; Shi, J.; Zhang, Q.; Ge, X.; Canonaco, F.; Prévôt, A.S.; Vonwiller, M.; Szidat, S.; Ge, J.; Ma, J.; et al. Wintertime organic and inorganic aerosols in Lanzhou, China: Sources, processes, and comparison with the results during summer. Atmos. Chem. Phys. 2016, 16, 14937–14957. [Google Scholar] [CrossRef]
  48. Sun, Y.L.; Wang, Z.F.; Fu, P.Q.; Yang, T.; Jiang, Q.; Dong, H.B.; Li, J.; Jia, J.J. Aerosol composition, sources and processes during wintertime in Beijing, China. Atmos. Chem. Phys. 2013, 13, 4577–4592. [Google Scholar] [CrossRef] [Green Version]
  49. Cheng, Y.; Zheng, G.; Wei, C.; Mu, Q.; Zheng, B.; Wang, Z.; Gao, M.; Zhang, Q.; He, K.; Carmichael, G. Reactive nitrogen chemistry in aerosol water as a source of sulfate during haze events in China. Sci. Adv. 2016, 2, e1601530. [Google Scholar] [CrossRef]
  50. Wang, G.; Zhang, R.; Gomez, M.E.; Yang, L.; Zamora, M.L.; Hu, M. Persistent sulfate formation from London Fog to Chinese haze. Proc. Natl. Acad. Sci. USA 2016, 113, 13630–13635. [Google Scholar] [CrossRef] [Green Version]
  51. Zheng, G.J.; Duan, F.K.; Su, H.; Ma, Y.L.; Cheng, Y.; Zheng, B.; Zhang, Q.; Huang, T.; Kimoto, T.; Chang, D.; et al. Exploring the severe winter haze in Beijing: The impact of synoptic weather, regional transport and heterogeneous reactions. Atmos. Chem. Phys. 2015, 15, 2969–2983. [Google Scholar] [CrossRef]
  52. Liu, J.; Wu., D.; Fan., S.J.; Mao, X.; Chen, H.Z. A one-year, on-line, multi-site observational study on water-soluble inorganic ions in PM2.5 over the Pearl River Delta region, China. Sci. Total Environ. 2017, 601–602, 1720–1732. [Google Scholar] [CrossRef]
  53. Lu, X.; Fung, J.C.H. Source apportionment of sulfate and nitrate over the Pearl River Delta Region in China. Atmosphere 2016, 7, 98. [Google Scholar] [CrossRef]
  54. Ge, X.; He, Y.; Sun, Y.; Xu, J.; Wang, J.; Shen, Y.; Chen, M. Characteristics and formation mechanisms of fine particulate nitrate in typical urban areas in China. Atmosphere 2017, 8, 62. [Google Scholar] [CrossRef]
  55. Wu, D.; Fung, J.C.H.; Yao, T.; Lau, A.K.H. A study of control policy in the Pearl River Delta region by usingthe particulate matter source apportionment method. Atmos. Environ. 2013, 76, 147–161. [Google Scholar] [CrossRef]
  56. Zheng, B.; Tong, D.; Li, M.; Liu, F.; Hong, C.; Geng, G.; Li, H.; Li, X.; Peng, L.; Qi, J.; et al. Trends in China’s anthropogenic emissions since 2010 as the consequence of clean air actions. Atmos. Chem. Phys. 2018, 18, 14095–14111. [Google Scholar] [CrossRef]
  57. Liu, F.; Zhang, Q.; Tong, D.; Zheng, B.; Li, M.; Huo, H.; He, K.B. High-resolution inventory of technologies, activities, and emissions of coal-fired power plants in China from1990 to 2010. Atmos. Chem. Phys. 2015, 15, 18787–18837. [Google Scholar] [CrossRef]
  58. Zhang, J.; Smith, K.R.; Ma, Y.; Ye, S.; Jiang, F.; Qi, W.; Liu, P.; Khalil, M.A.K.; Rasmussen, R.A.; Thorneloe, S.A. Greenhouse gases and other airborne pollutants from household stoves in China: A database for emission factors. Atmos. Environ. 2000, 34, 4537–4549. [Google Scholar] [CrossRef]
  59. Liu, J.; Mauzerall, D.L.; Chen, Q.; Zhang, Q.; Song, Y.; Peng, W.; Klimont, Z.; Qiu, X.; Zhang, S.; Hu, M.; et al. Air pollutant emissions from Chinese households: A major and underappreciated ambient pollution source. Proc. Natl. Acad. Sci. USA 2016, 113, 7756–7761. [Google Scholar] [CrossRef] [Green Version]
Figure 1. Locations of the Beijing-Tianjin-Hebei (BTH), Guanzhong (GZ), Yangtze River Delta region, (YRD), and Pearl River Delta region (PRD) regions. The map scale is 1:32,000,000.
Atmosphere 10 00277 g001
Figure 2. (a) Chemical compositions of non-refractory particulate matter (NR-PM) and (b) fractions of organic sources in the four representative regions of China during wintertime. The dotted box refers to the primary organic aerosols. The numbers above the bars represent the average mass concentrations of (a) total NR-PM and (b) organic aerosols across the four regions. BTH: Beijing-Tianjin-Hebei Region; GZ: Guanzhong region; PRD: Pearl River Delta region; YRD: Yangtze River Delta; OOA: oxygenated organic aerosols; HOA: hydrocarbon-like organic aerosol; COA: cooking organic aerosol; BBOA: biomass burning organic aerosol; CCOA: coal combustion organic aerosol.
Atmosphere 10 00277 g002
Figure 3. Relative composition of the non-refractory PM in (a) different years and (b) across the four regions.
Atmosphere 10 00277 g003aAtmosphere 10 00277 g003b
Figure 4. Relative contributions of primary organic sources to total organics in (a) different years and (b) different cities across the four regions.
Atmosphere 10 00277 g004
Figure 5. (a) Total contributions of the primary sources to primary particulate matter (PPM, including primary OA, chloride, and BC) in the Beijing-Tianjin-Hebei and Guanzhong regions, and in (b) Beijing and Hebei province of the Beijing-Tianjin-Hebei region. The numbers above the bars represent the average mass concentrations of PPM.
Atmosphere 10 00277 g005
Figure 6. Relative contributions of primary sources to the primary particulate matter (PPM, including primary OA, chloride, and BC) in (a) different years and (b) different cities of northern China.
Atmosphere 10 00277 g006
Figure 7. Average diurnal variations of BTH-CCOA, GZ-BBOA, PRD-sulfate, and YRD-nitrate in the four regions. n represents the number of data points used in the diurnal variation plots.
Atmosphere 10 00277 g007

