Article

Sensitivity of Nitrate Aerosol Production to Vehicular Emissions in an Urban Street

Department of Environmental Engineering and Energy, Myongji University, Yongin 17058, Gyunggi, Korea
Atmosphere 2019, 10(4), 212; https://doi.org/10.3390/atmos10040212
Submission received: 14 March 2019 / Revised: 12 April 2019 / Accepted: 18 April 2019 / Published: 22 April 2019

Abstract

:
This study investigated the sensitivity of nitrate aerosols to vehicular emissions in urban streets using a coupled computational fluid dynamics (CFD)–chemistry model. Nitrate concentrations were highest at the street surface level following NH3 emissions from vehicles, indicating that ammonium nitrate formation occurs under NH3-limited conditions in street canyons. Sensitivity simulations revealed that the nitrate concentration has no clear relationship with the NOx emission rate, showing nitrate changes of only 2% across among 16 time differences in NOx emissions. NOx emissions show a conflicting effect on nitrate production via decreasing O3 and increasing NO2 concentrations under a volatile organic compound (VOC)-limited regime for O3 production. The sensitivity simulations also show that nitrate aerosol is proportional to vehicular VOC and NH3 emissions in the street canyon. Changes of VOC emissions affect the nitrate aerosol and HNO3 concentrations through changes in the O3 concentration under a VOC-limited regime for O3 production. Nitrate aerosol concentration is influenced by vehicular NH3 emissions, which produce ammonium nitrate effectively under an NH3-limited regime for nitrate production. This research suggests that, when vehicular emissions are dominant in winter, the control of vehicular VOC and NH3 emissions might be a more effective way to degrade PM2.5 problems than the control of NOx.

1. Introduction

Nitrate aerosol is a fine particulate matter (PM2.5) component produced from the reaction of gas-phase nitrate (nitric acid; HNO3) and ammonia (NH3). During a haze event, nitrate aerosol often contributes to the total observed particle mass by as much or more than the organic fraction across East Asia [1,2,3,4]. As severe haze events have increased across East Asia [5], nitrate contributions to PM2.5 mass have also increased in polluted urban areas [1,6].
The production of nitrate aerosol in urban areas is affected by vehicular emissions such as nitrogen oxides (NOx = NO + NO2) and NH3 [7,8,9]. These vehicular emissions are highly concentrated and are transported by turbulence from the complex geometry of buildings, causing steep gradients of pollutant concentrations [10,11,12,13]. Nitrate aerosol chemistry is highly nonlinear and follows the concentrations of precursor gases and humidity, so the formation and distribution of nitrate aerosol are not spatially uniform [14,15]. Most modeling studies on nitrate aerosols are based on regional or global air-quality models that have clear limitations due to their coarse resolution [16,17,18]. Therefore, to accurately investigate nitrate formation in urban areas, fine-scale simulations that can conserve highly concentrated emission plumes and turbulence are necessary.
Meanwhile, policies regarding vehicular nitrate control focus on reduction of NOx (e.g., through banning diesel vehicles) [19,20], based on studies of regional or global air-quality modeling. However, studies from observation campaigns have often reported that other vehicle emissions are much more important than NOx emissions for nitrate production in urban areas [21,22,23]. Link et al. investigated the secondary formation of ammonium nitrate from vehicle exhaust using sampling and laboratory experiments in the Seoul Metropolitan Region (SMR) [21]. They found that the secondary production of ammonium nitrate from diesel exhausts is much lower than that from gasoline. They concluded that the NH3 source from gasoline vehicles could be more important than NOx emissions, indicating that SMR is an NH3-limited environment. Wen et al. studied nitrate formation during a severe PM2.5 pollution period and reported that high NH3 concentrations in the early mornings significantly accelerated the formation of fine particulate nitrate [23]. In addition, they found that the increased rate of nitrate aerosol had a strong positive correlation with ozone (O3) concentrations at night, indicating the essential role of oxidants in nitrate formation. Studies also reported that volatile organic compound (VOC) concentrations control nitrate formation by affecting the O3 levels [22,24]. These studies indicate that nitrate aerosols are affected by a complex chemical condition that involves NOx, NH3, and oxidants, whereas policy tends to focus exclusively on NOx control. Thus, understanding the favorable conditions for nitrate formation in urban areas is crucial for the design of air-quality policies.
Thus, this study investigates the distribution of nitrate aerosols and the favorable conditions for nitration formation in urban streets using a microscale coupled computational fluid dynamics (CFD)–chemistry model that can reproduce the turbulence from complex building geometries. Sensitivity simulations were conducted to examine the sensitivity of emissions to nitrate production by changing the emissions of precursor gases for nitrate aerosols and oxidants. The sensitivity simulation results reveal what significant factors lead to nitrate aerosol problems in urban streets.

2. Model Description and Simulation Set-Up

2.1. Model Description

A coupled CFD–chemistry model was used based on that proposed by Kim et al. [25]. The CFD model is based on the Reynolds-averaged Navier–Stokes equation (RANS) model and assumes a three-dimensional (3-D), nonrotating, nonhydrostatic, and incompressible airflow system [26]. This model was previously used to examine the flow and dispersion of both reactive gas pollutants [25,27] and reactive aerosol pollutants [25,28].
The model’s chemical mechanism includes a full tropospheric NOx–Ox–VOC chemistry scheme from a global 3-D chemical transport model (GEOS-Chem V11-1) [29]. GEOS-Chem was initially developed to solve global air chemistry issues; however, application of the GEOS-Chem model has now been extended to the regional scale. The GEOS-Chem model can successfully explain urban air quality, including cases of severe haze over East Asia [1,30,31]. The chemical scheme includes 140 species and 393 reactions, among which 61 reactions are photochemical. Among the 140 species simulated in the chemistry module, the CFD model transports 65 chemical tracers. Radical species with very short chemical lifetimes are not transported. Photolysis rate coefficients are calculated using the Fast-JX radiative transfer model [32,33].
The model also calculates aerosols that include sulfate, nitrate, ammonium, black carbon, and organic carbon [34,35]. Sulfate formation generally occurs via two pathways: the gas-phase oxidation of SO2 by OH and the aqueous-phase oxidation of SO2 by ozone and hydrogen peroxide. The CFD model only accounts for the gas-phase oxidation of SO2 by OH because it lacks an atmospheric physics module that simulates hydrometeors such as clouds and rain.
Nitrate and ammonium aerosol were calculated by partitioning the total NH3 and HNO3 between the gas and aerosol phases. We used the ISORROPIA-II model as a thermodynamic equilibrium model for aerosol partitioning [36,37] and employed it to calculate the thermodynamic equilibrium of a K+–Ca2+–Mg2+–NH4+–Na+–SO42−–NO3–Cl–H2O aerosol system based on the NH3, HNO3, and SO42− concentrations.
The model also includes the production of HNO3 via heterogeneous chemistry between aerosols and gases following Jacob (2000) [38]. The reactions that contribute to HNO3 production by heterogeneous chemistry can be written as:
2 NO2 → HNO3 + HONO
NO3 → HNO3
N2O5 → 2 HNO3.
The uptake coefficients, γ, of R2 and R3 were 10−4 and 0.1, respectively, following Jacob (2000) [38]. For R4, γ was set to 0.01 as suggested by Zhang et al. (2012) and Walker et al. (2012) [39,40]. N2O5 is essential for night-time nitrate aerosol chemistry; the production and loss reactions of N2O5 can be written as:
NO2 + NO3 + M → N2O5 + M
N2O5 + M → NO2 + NO3 + M
N2O5 + hν → NO3 + NO2.
The simulation of carbonaceous aerosols follows the GEOS-Chem model [35]. The primary carbonaceous aerosol follows the passive tracer without any chemical reactions. However, the model resolves primary Black Carbon (BC) and Organic carbon (OC) with a hydrophobic and a hydrophilic fraction for each (i.e., making four aerosol types) for deposition processes. All sources emit hydrophobic aerosols that then become hydrophilic with an e-folding time of 1.2 days, as per Cooke et al. (1999) [41]. Although secondary organic aerosol (SOA) chemistry is not considered in the model, we treat boundary inflow and the transport of SOAs. However, the model does not account for either dust or sea-salt aerosol.
The dry deposition of gases and aerosols was simulated with a standard big-leaf resistance-in-series model [42]. The model accounts for the dry deposition of 46 species, including aerosols. The CFD model has no atmospheric physics module that simulates hydrometeors (e.g., clouds and rain); thus, wet deposition was not calculated, following Kim et al. (2012) [25].

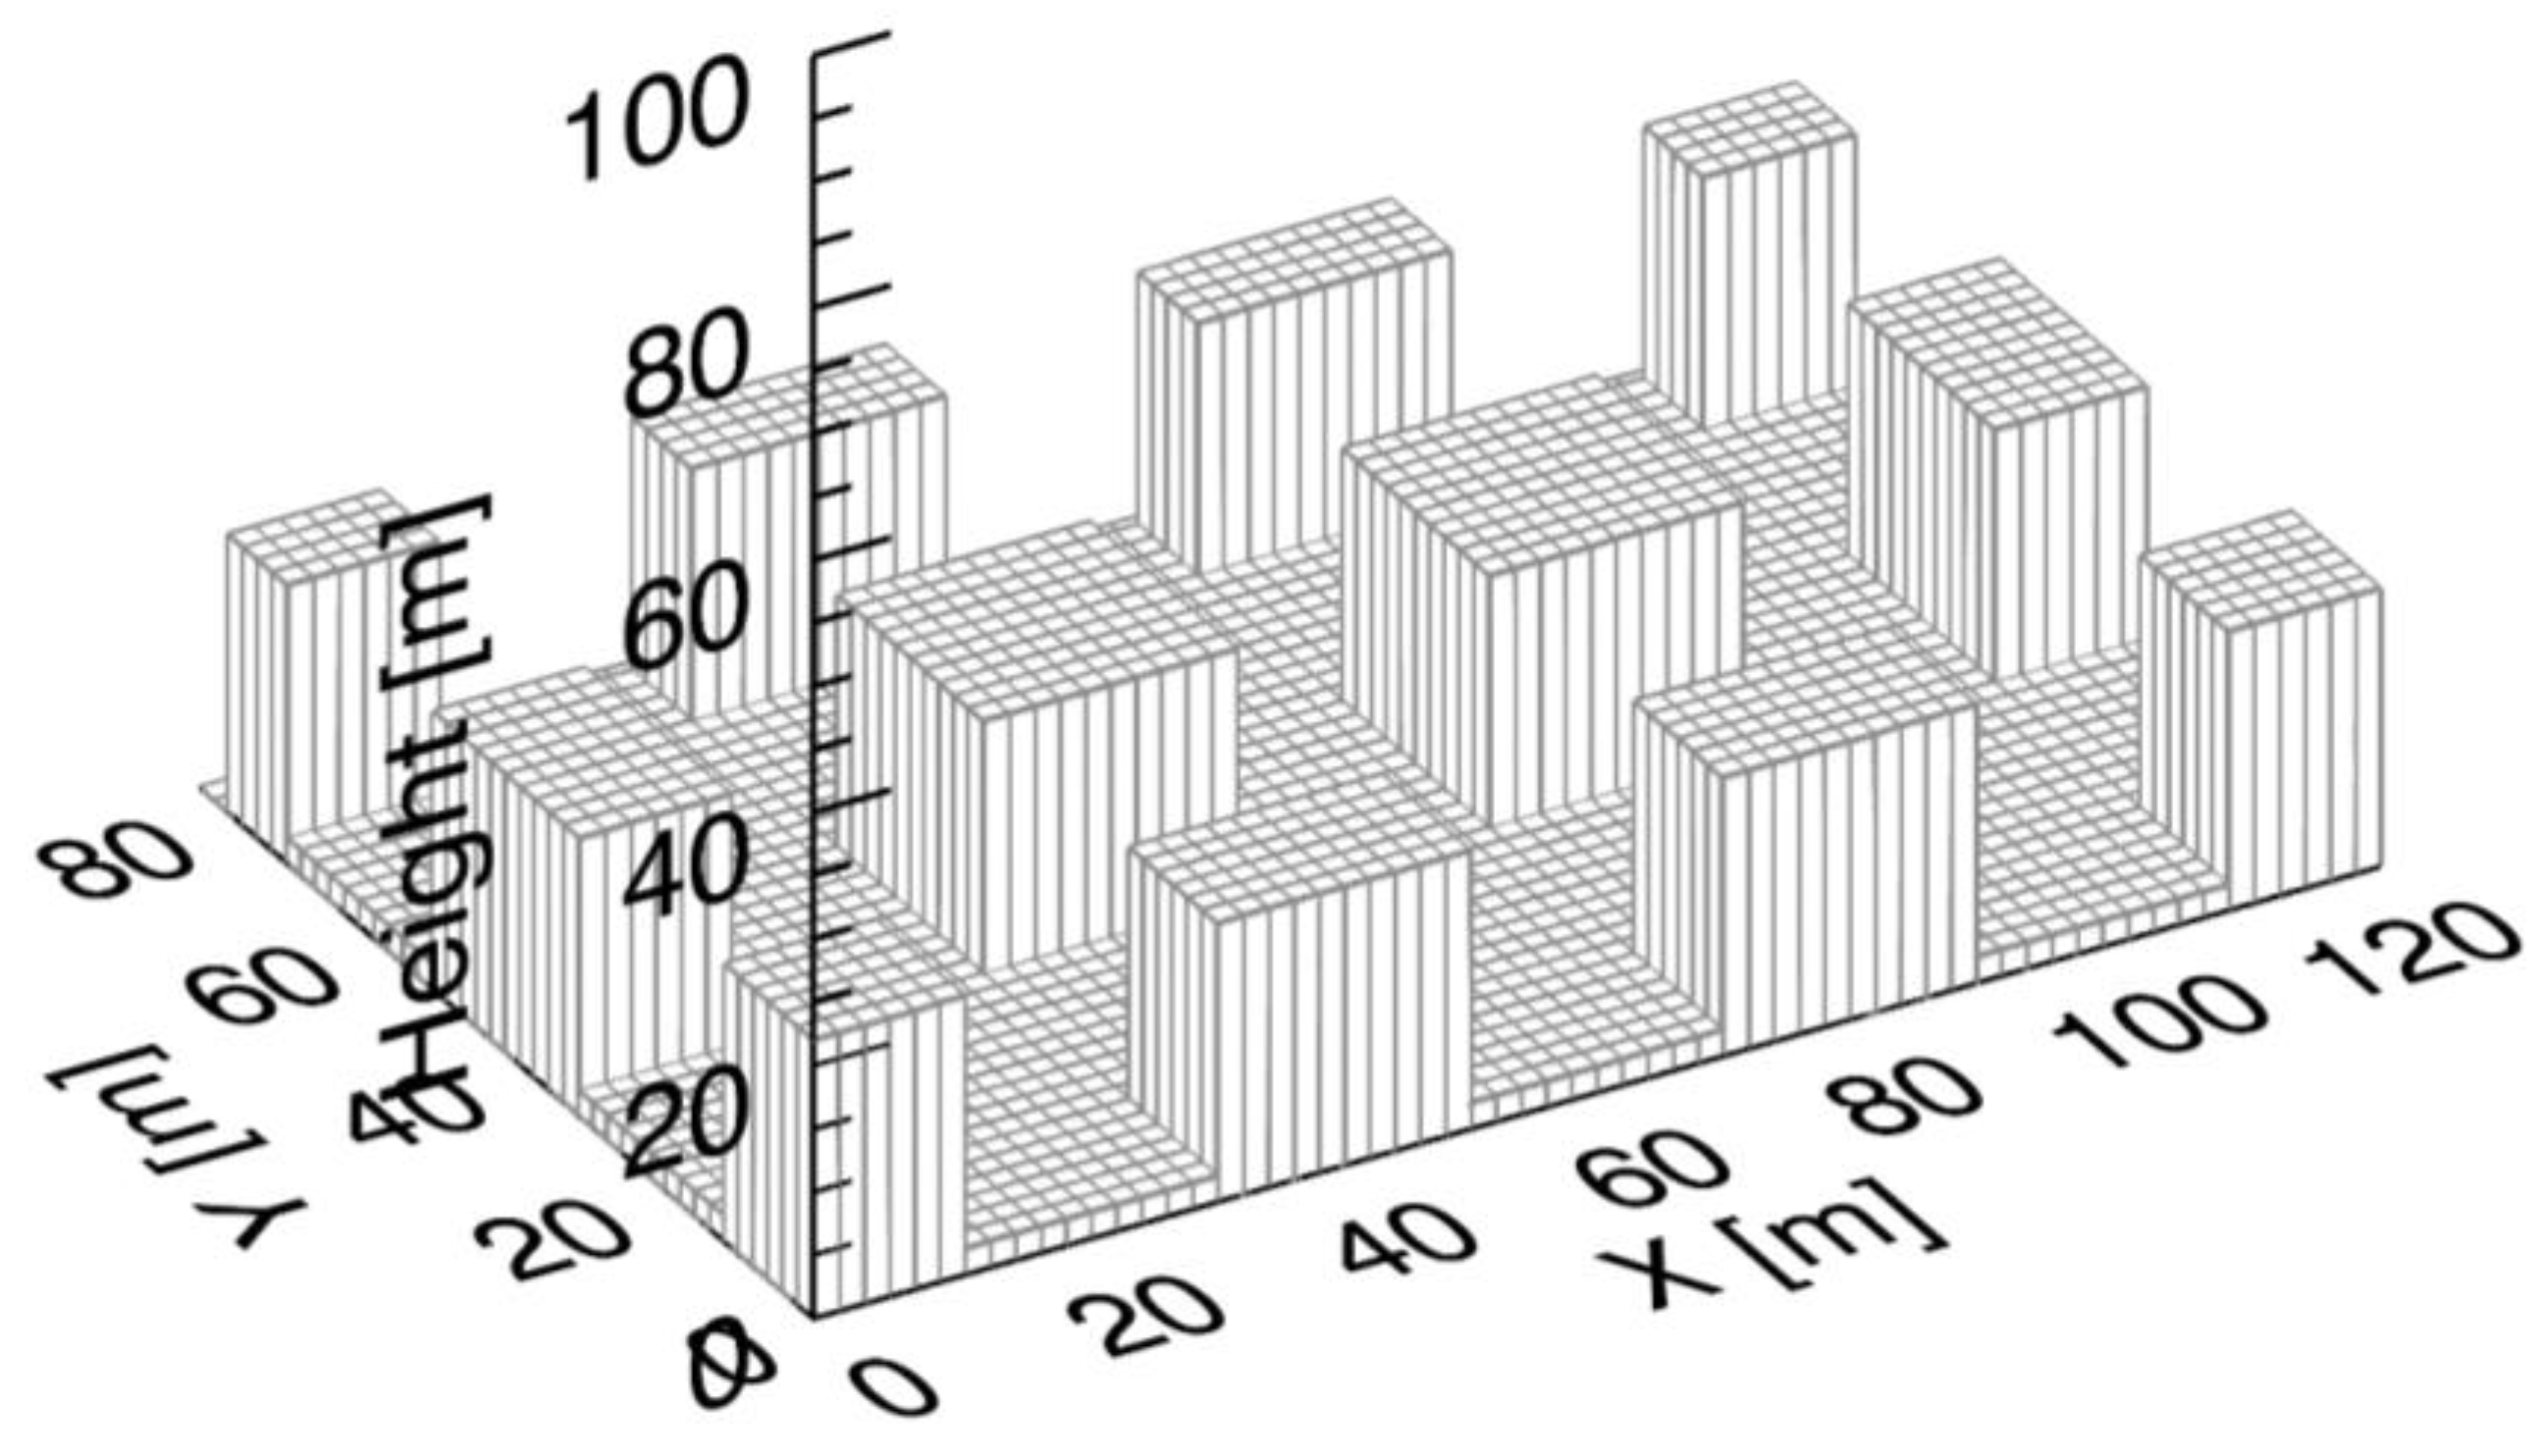
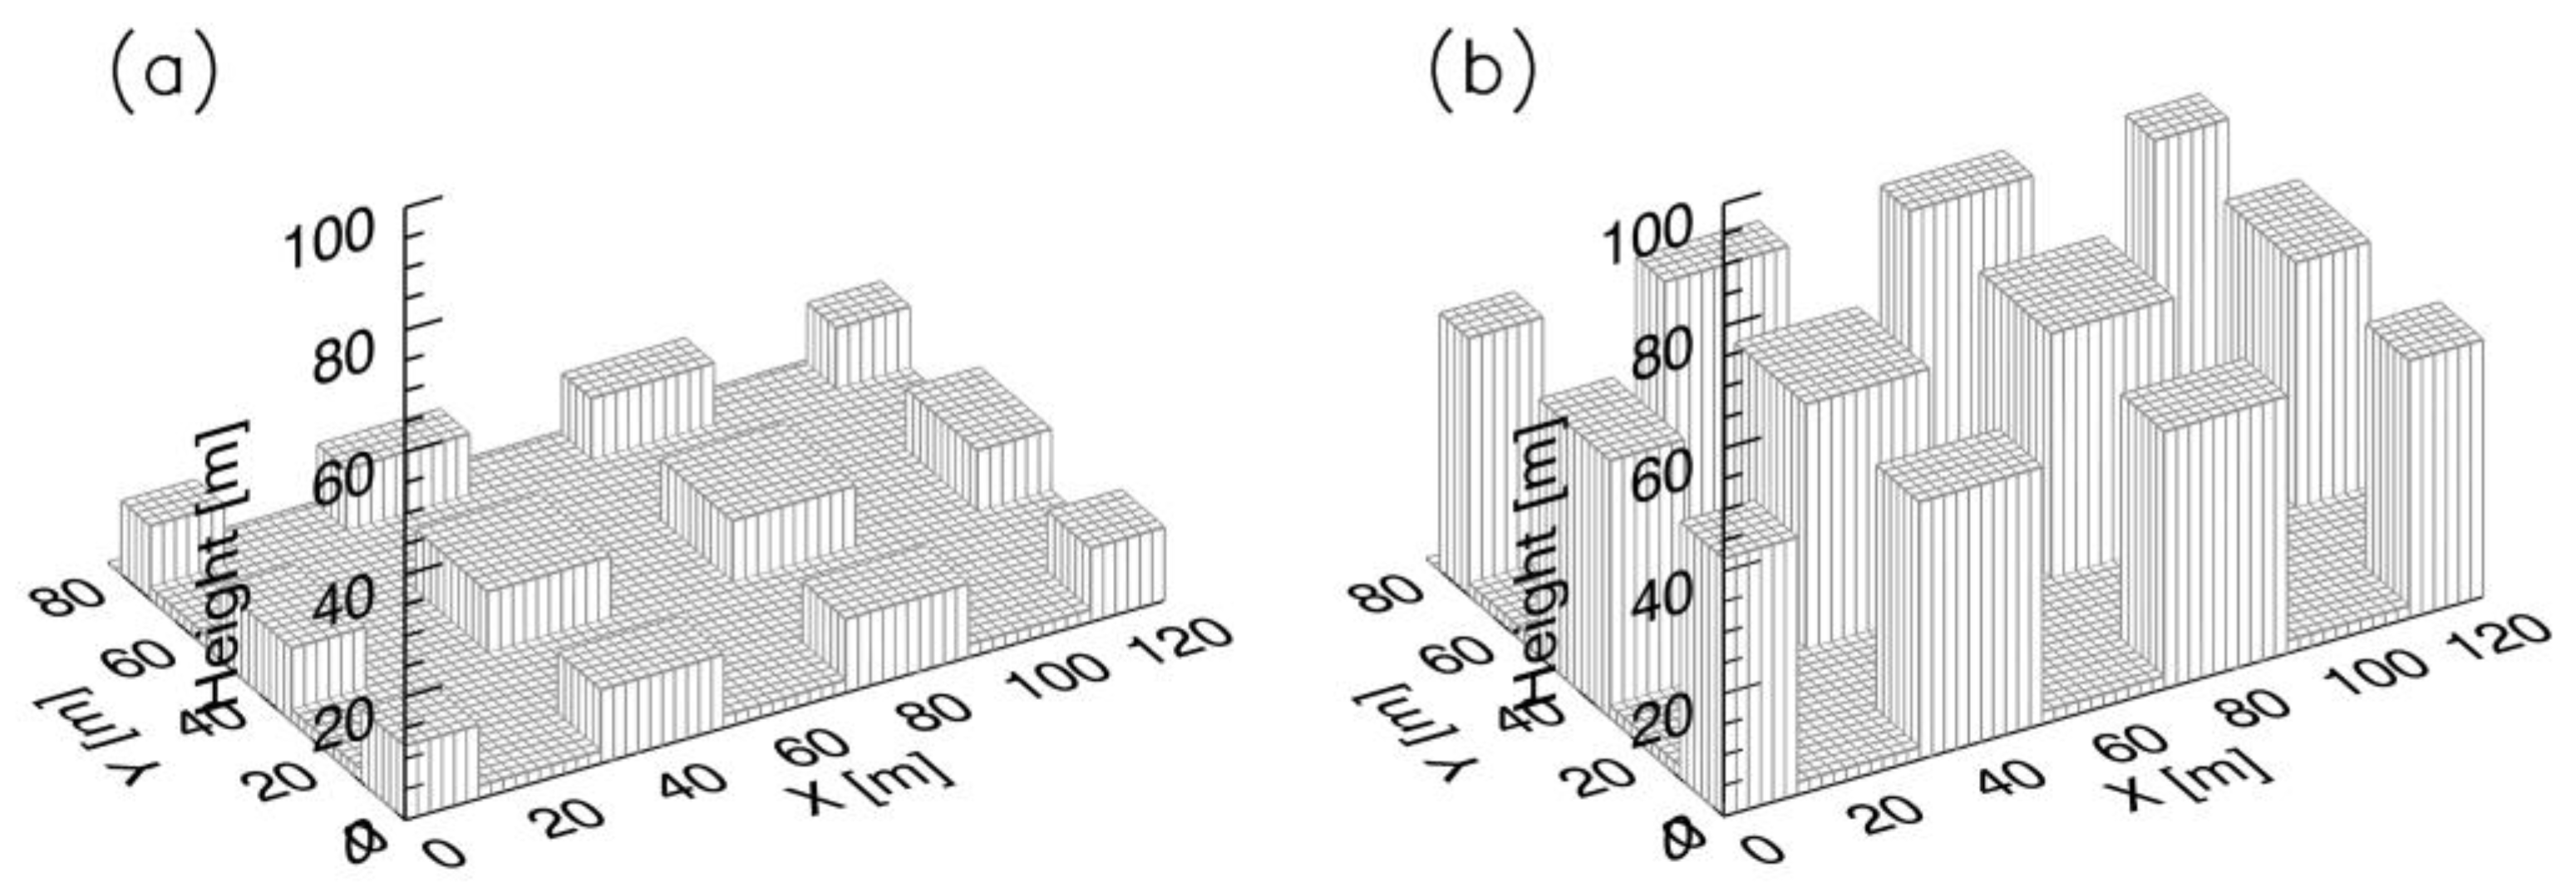
2.2. Simulation Set-Up

We assumed a street canyon selected for a simulation located in SMR, one of the most polluted cities, to investigate nitrate formation in urban streets. The domain size was 120 × 80 × 100 m in the x, y, and z directions, respectively. The grid intervals in all directions were 2 m, and the building height was 20 m with unified aspect ratios for all street canyons. Figure 1 shows the detailed structure of the simulation domain.
First, we set a control run (CNTL hereafter) with standard emissions. We estimated the pollutant emissions from average traffic volume in 2017 obtained from the Traffic Monitoring System (http://www.road.re.kr), which provides traffic statistics in SMR. On that basis, the daily traffic volume for each street was assumed to be 15,130 vehicles day−1. The monthly averaged diurnal variation in traffic volume was also obtained from the Traffic Monitoring System. Vehicular emissions were computed using the emission factor from the Clean Air Policy Support System (CAPPS) emission inventory [43] and calculated by multiplying the mean ratios of vehicle sizes in Korea. The emission factors following vehicle size and the ratios of vehicle size are summarized in Table 1 and Table 2, respectively. The calculated averaged emissions per vehicle were 0.10 g km−1, 0.15 g km−1, 0.015 g km−1, and 0.011 g km−1 for NOx, CO, VOC, and NH3, respectively. NOx emissions were separated into NO and NO2 emissions at a 10:1 ratio by volume [44]. Total VOC emissions were further speciated using the method developed by EMEP/EEA (2016) [45]. Table 3 lists the emission rate and ratios of speciated VOC in the CNTL simulation. All vehicular emissions were emitted at z = 1 m from 4 m wide area sources located at the center of the streets. Other emissions in the model domain were not considered in the simulation. Previous studies have reported that the largest proportion of emissions in SMR is vehicular emissions [43,46,47].
For meteorological conditions, we used values for the SMR in winter that provided favorable conditions for nitrate formation [48]. To simulate diurnal changes in buoyancy and their effects on transport and chemical reaction rates in the model, we used the hourly temperature and relative humidity obtained from the Seoul station of the Korea Meteorological Administration (http://web.kma.go.kr/eng/). Table 4 shows the hourly temperature and relative humidity used in this study. The wind speed on the rooftop was assumed to be the observed seasonal mean value for SMR, which is 2.4 m s−1. The wind direction is westerly (most frequently observed in winter) and is perpendicular to the street canyon [49]. The ambient wind speed and direction were fixed during a one-day simulation. The following vertical profiles of the wind, turbulent kinetic energy (TKE), and TKE dissipation rate were imposed:
U ( z ) =   u * cos θ κ l n ( z z 0 )
V ( z ) =   u * sin θ κ l n ( z z 0 )
W ( z ) =   0
k ( z ) =   u * 2 C μ 1 / 2 ( 1 z δ ) 2
ε ( z ) = C μ 3 / 4 k 3 / 2 κ z
Here, u, z0, and κ represent the friction velocity, roughness length (=0.05 m), and von Karman constant (=0.4), respectively; Cμ is an empirical constant (=0.0845), and θ is the wind direction. The surface and top boundary pressures in the model were assumed to be 1013.15 hPa and 993.72 hPa, respectively.
For the rooftop boundary conditions of the species, we used a reanalysis dataset from the Monitoring Atmospheric Composition and Climate (MACC) project in SMR with 6 h diurnal variations [50]. In addition, we used the boundary conditions of the species from the GEOS-Chem simulation with 6 h diurnal variations at SMR in winter for the species that were not provided in the MACC reanalysis dataset [51]. The initial conditions of the species were assumed as the concentrations of the boundary conditions in the first step. We conducted 48 h model simulations for each case: the first 24 h for the model spin-up, and the results from the last 24 h were used. The chemical and dynamical time steps were 1 min and 1 s, respectively.
Sensitivity simulations were conducted to examine the effect of emissions on nitrate aerosols in urban streets. Twelve sensitivity simulations were set by changing the vehicular emissions of NOx, VOC, and NH3. Each simulation was conducted with different emissions by multiplying the original emission by 0.25, 0.5, 2.0, and 4.0 for each species. We named the sensitivity simulations “species name” × “multiplying factor.” For example, simulations named NOx × 0.25, NOx × 0.5, NOx × 2, and NOx × 4 indicate multiplying the vehicular NOx by 0.25, 0.5, 2.0, and 4.0, respectively, while other emissions were fixed.

2.3. Model Validation
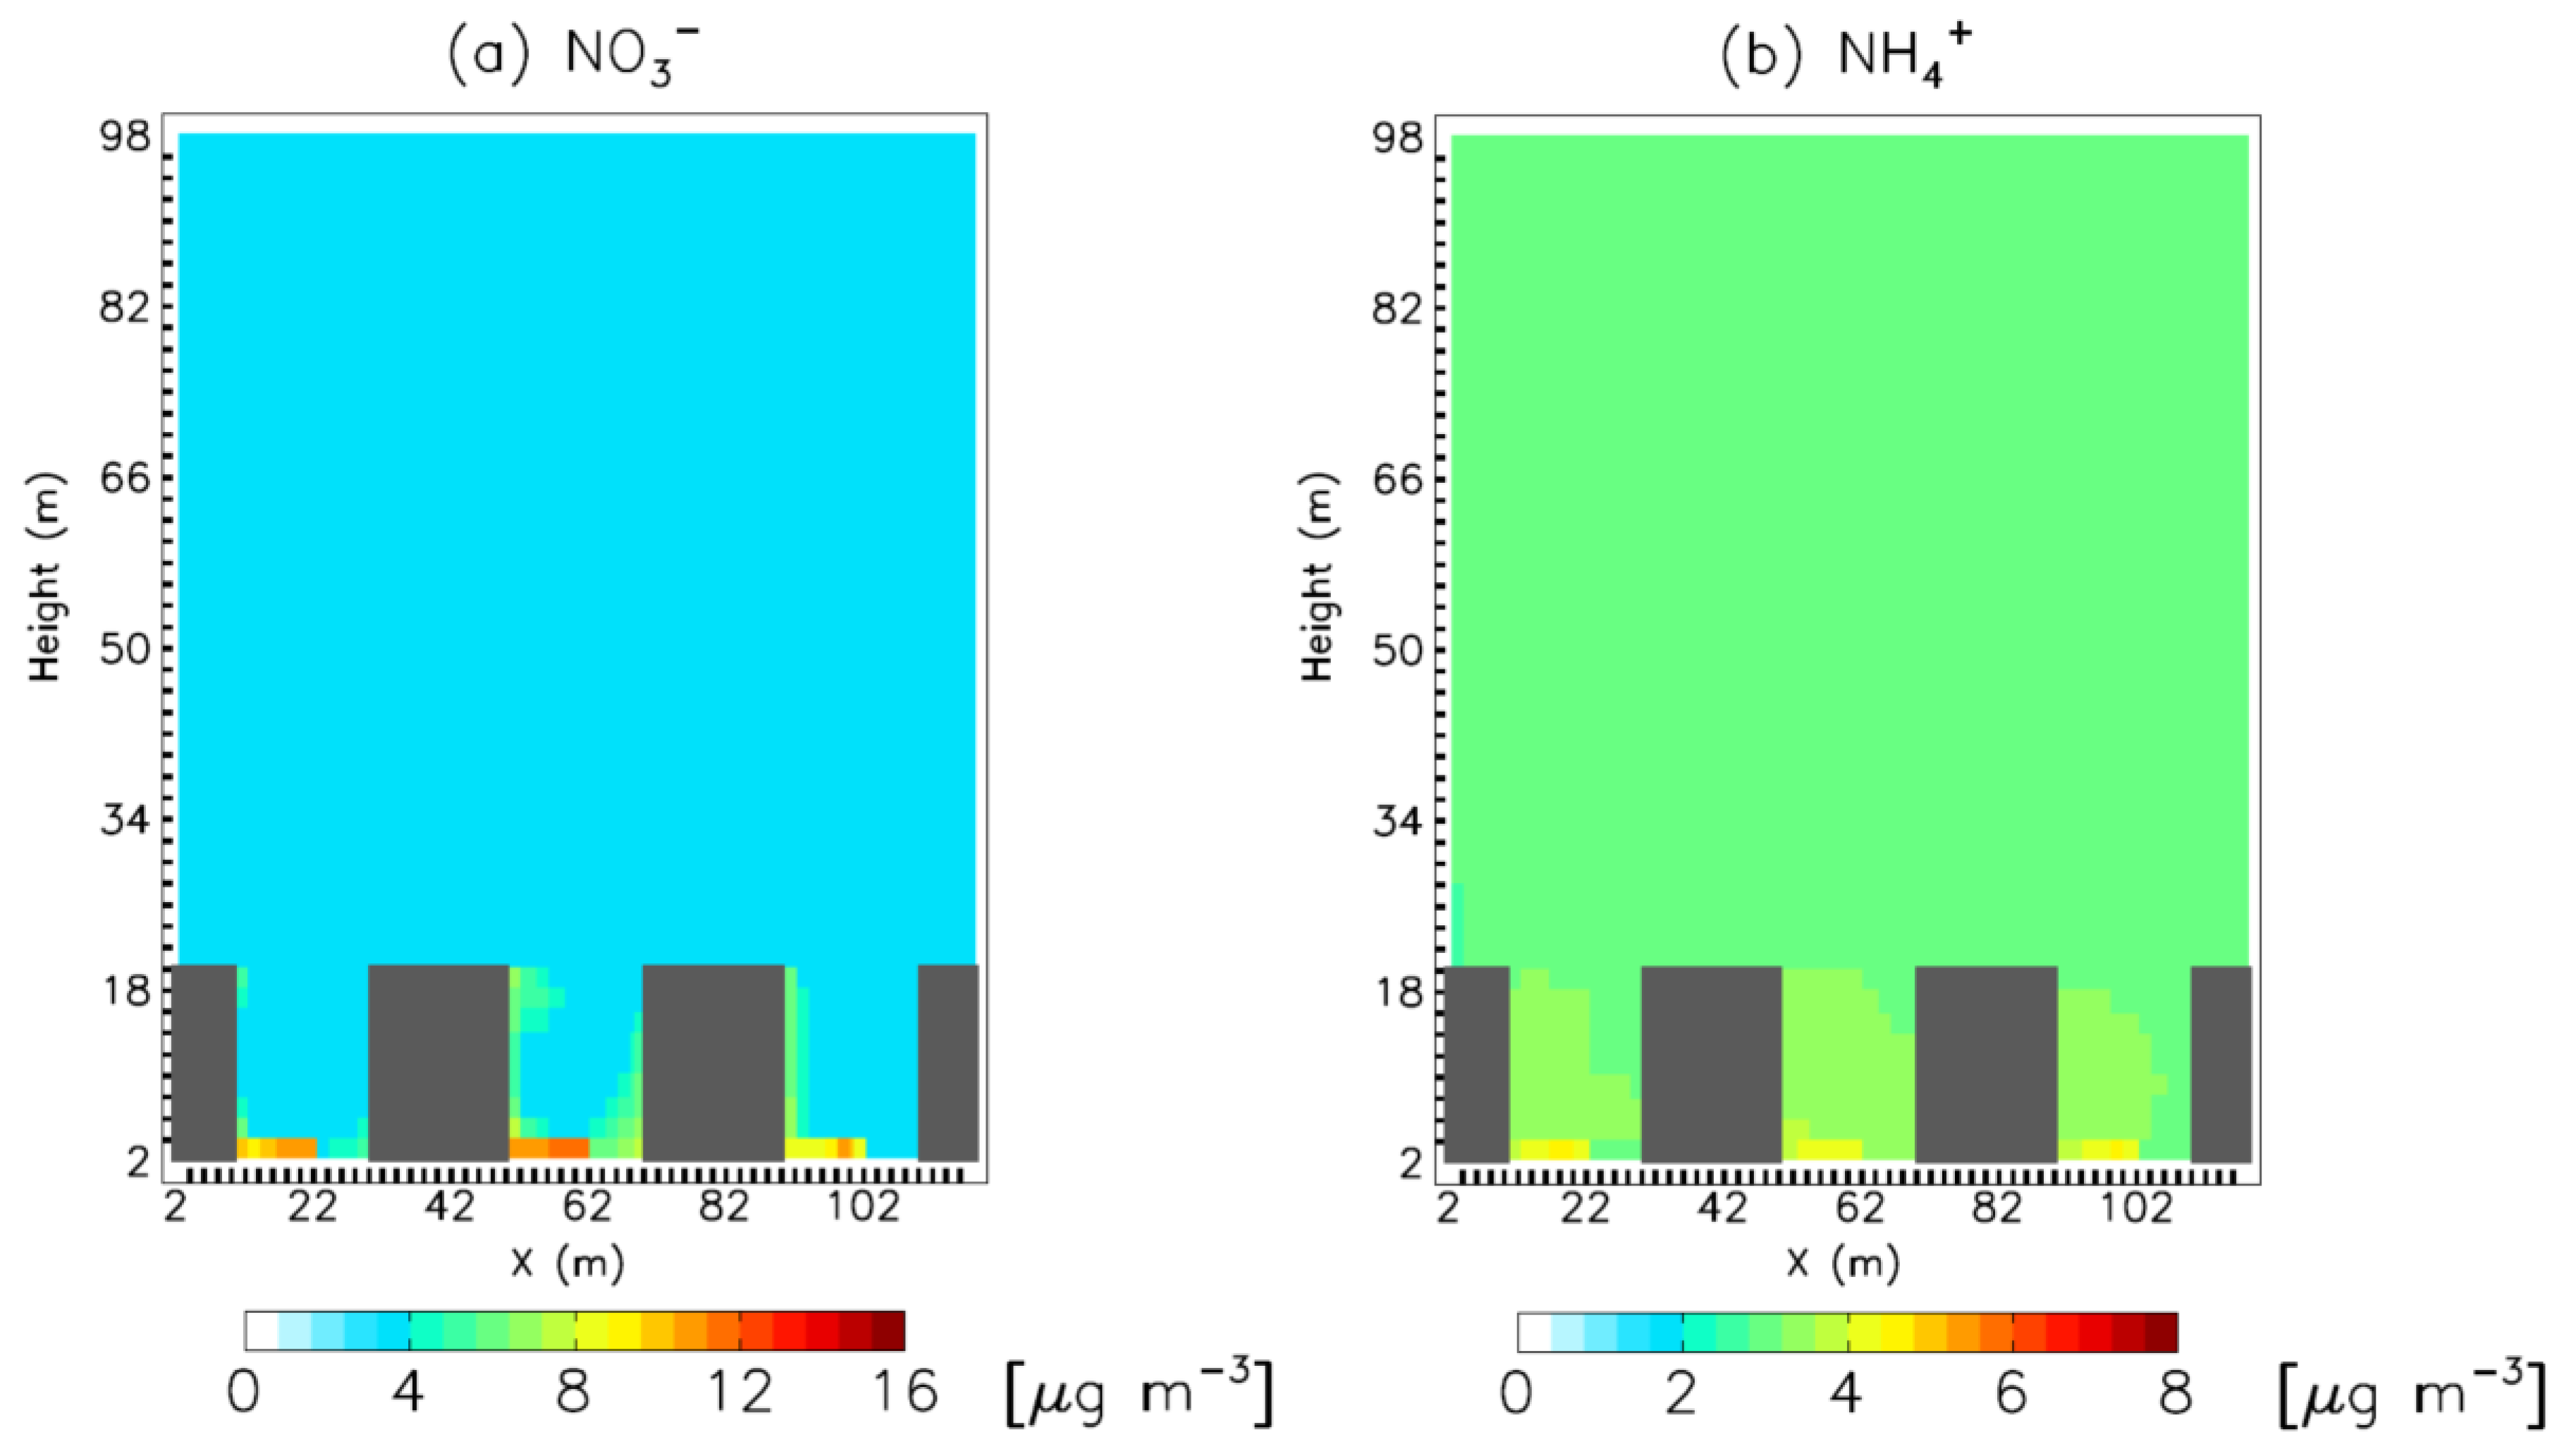
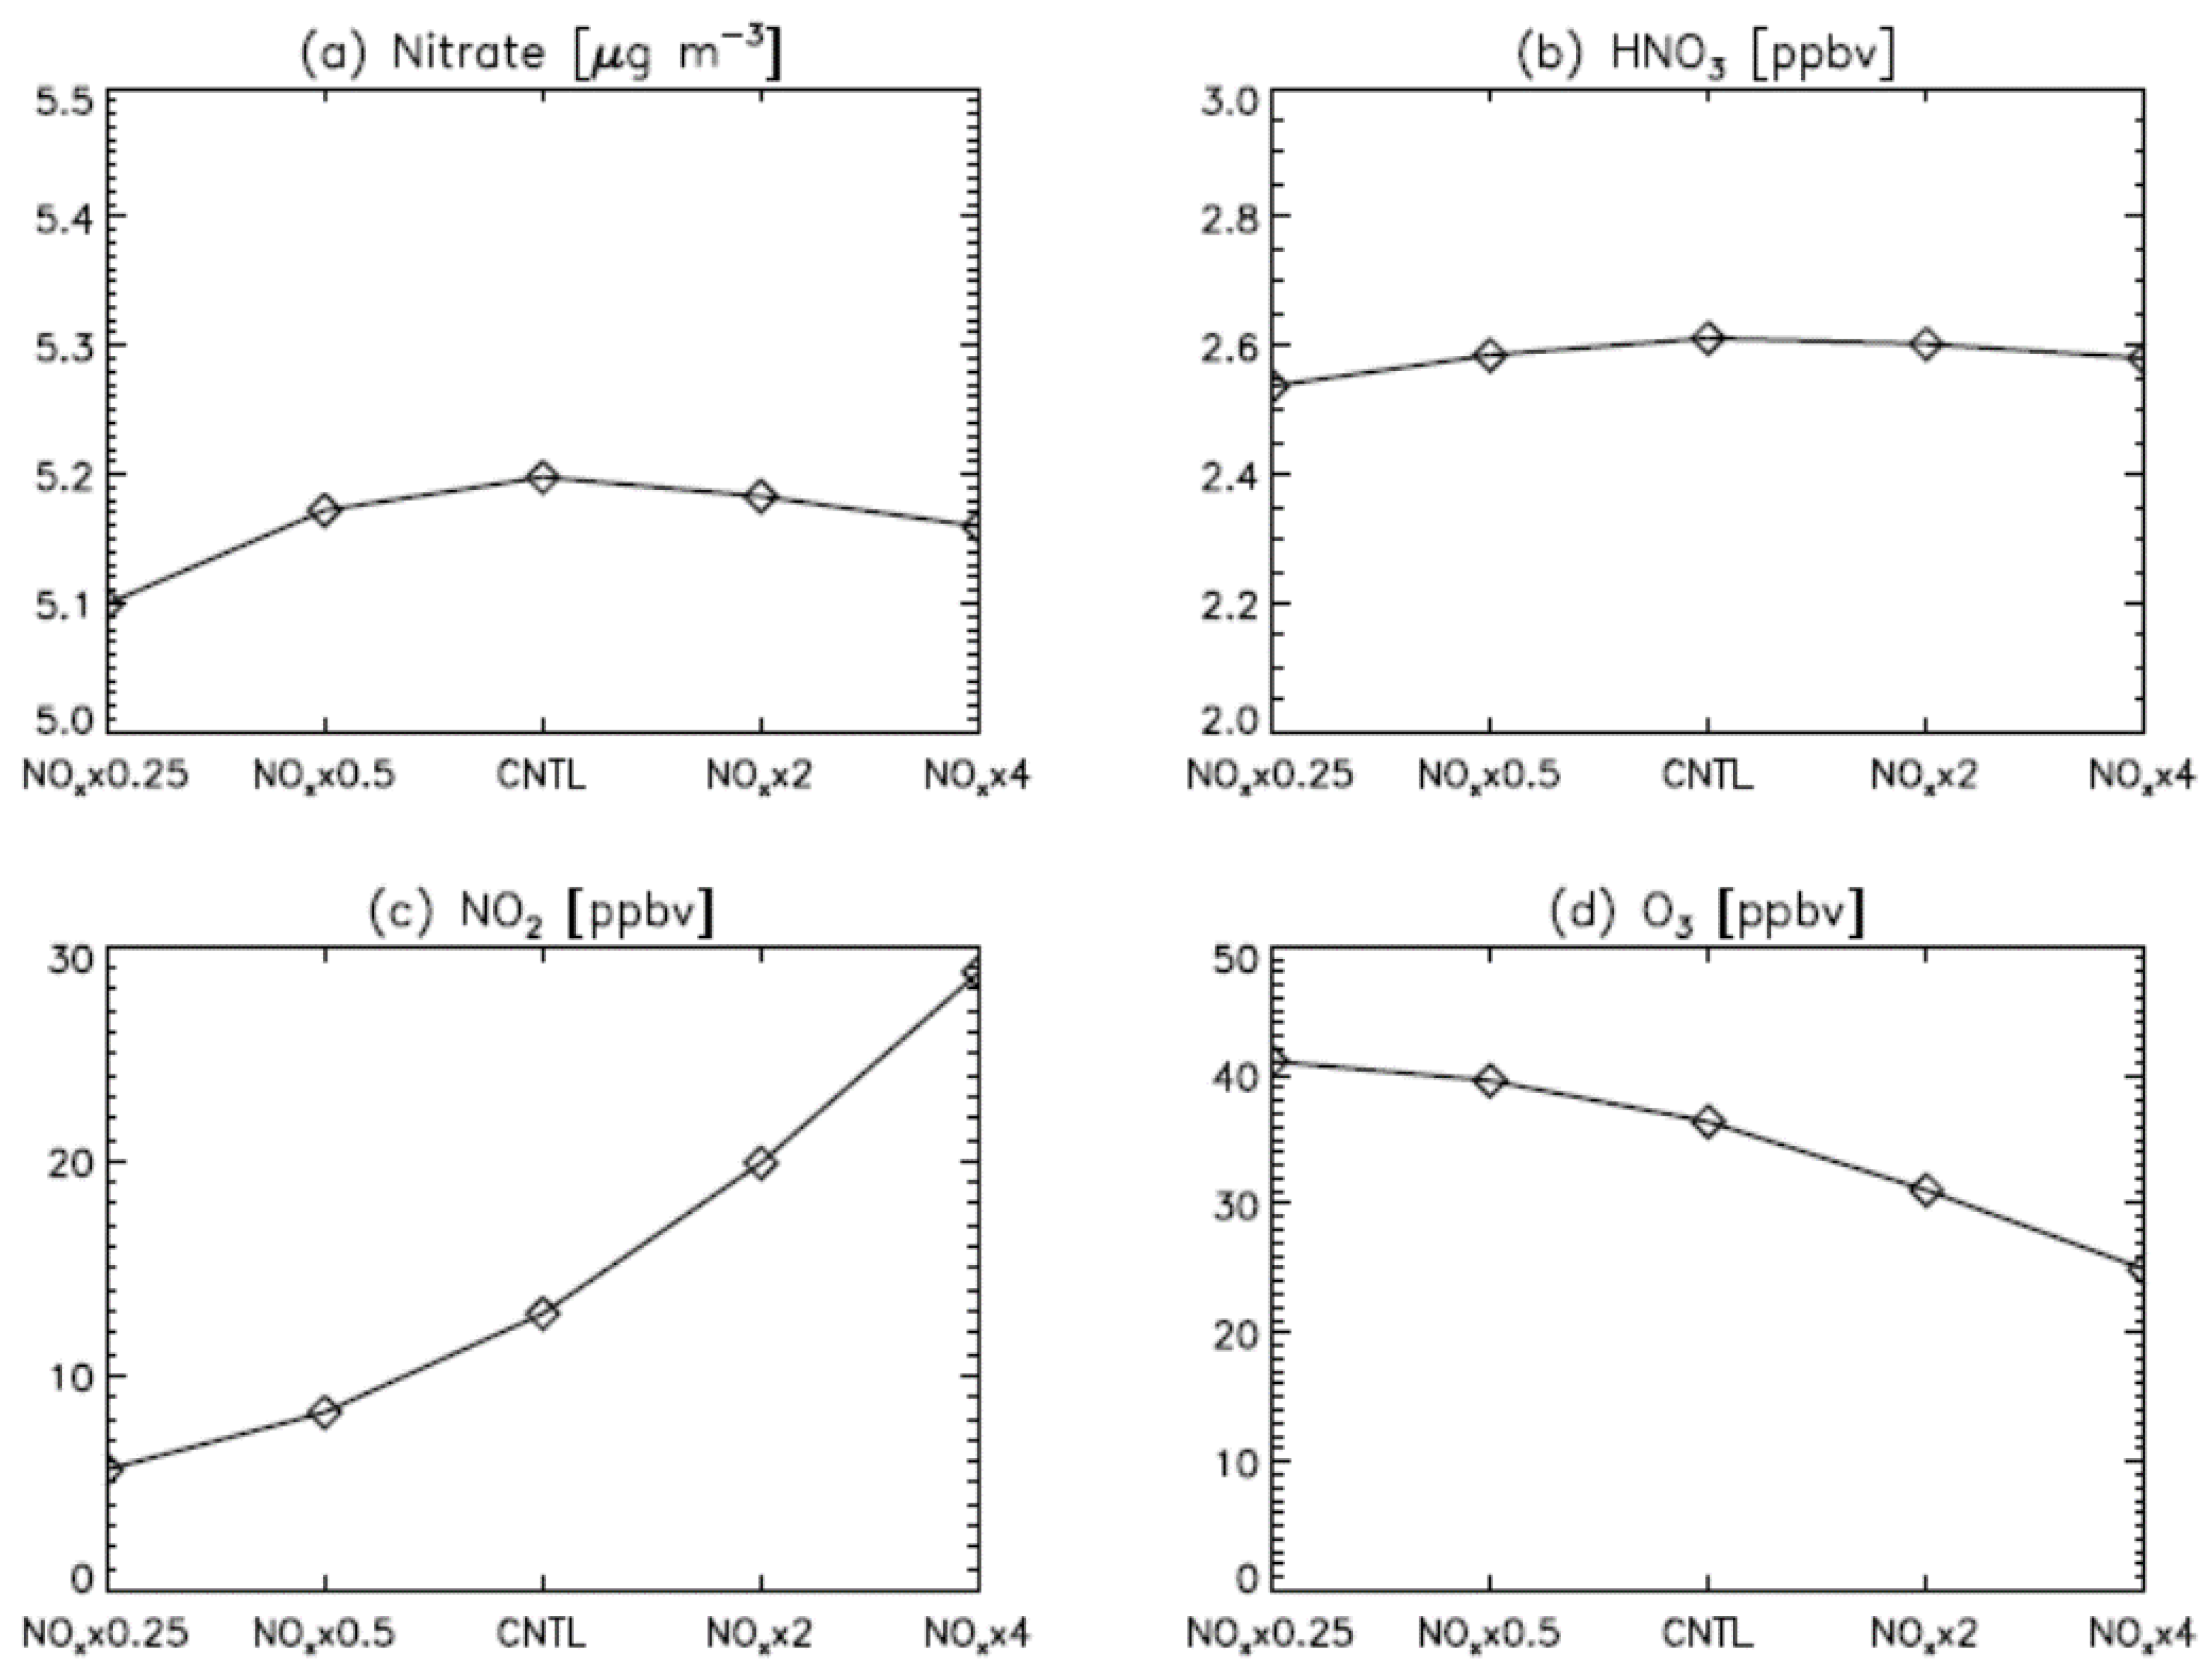
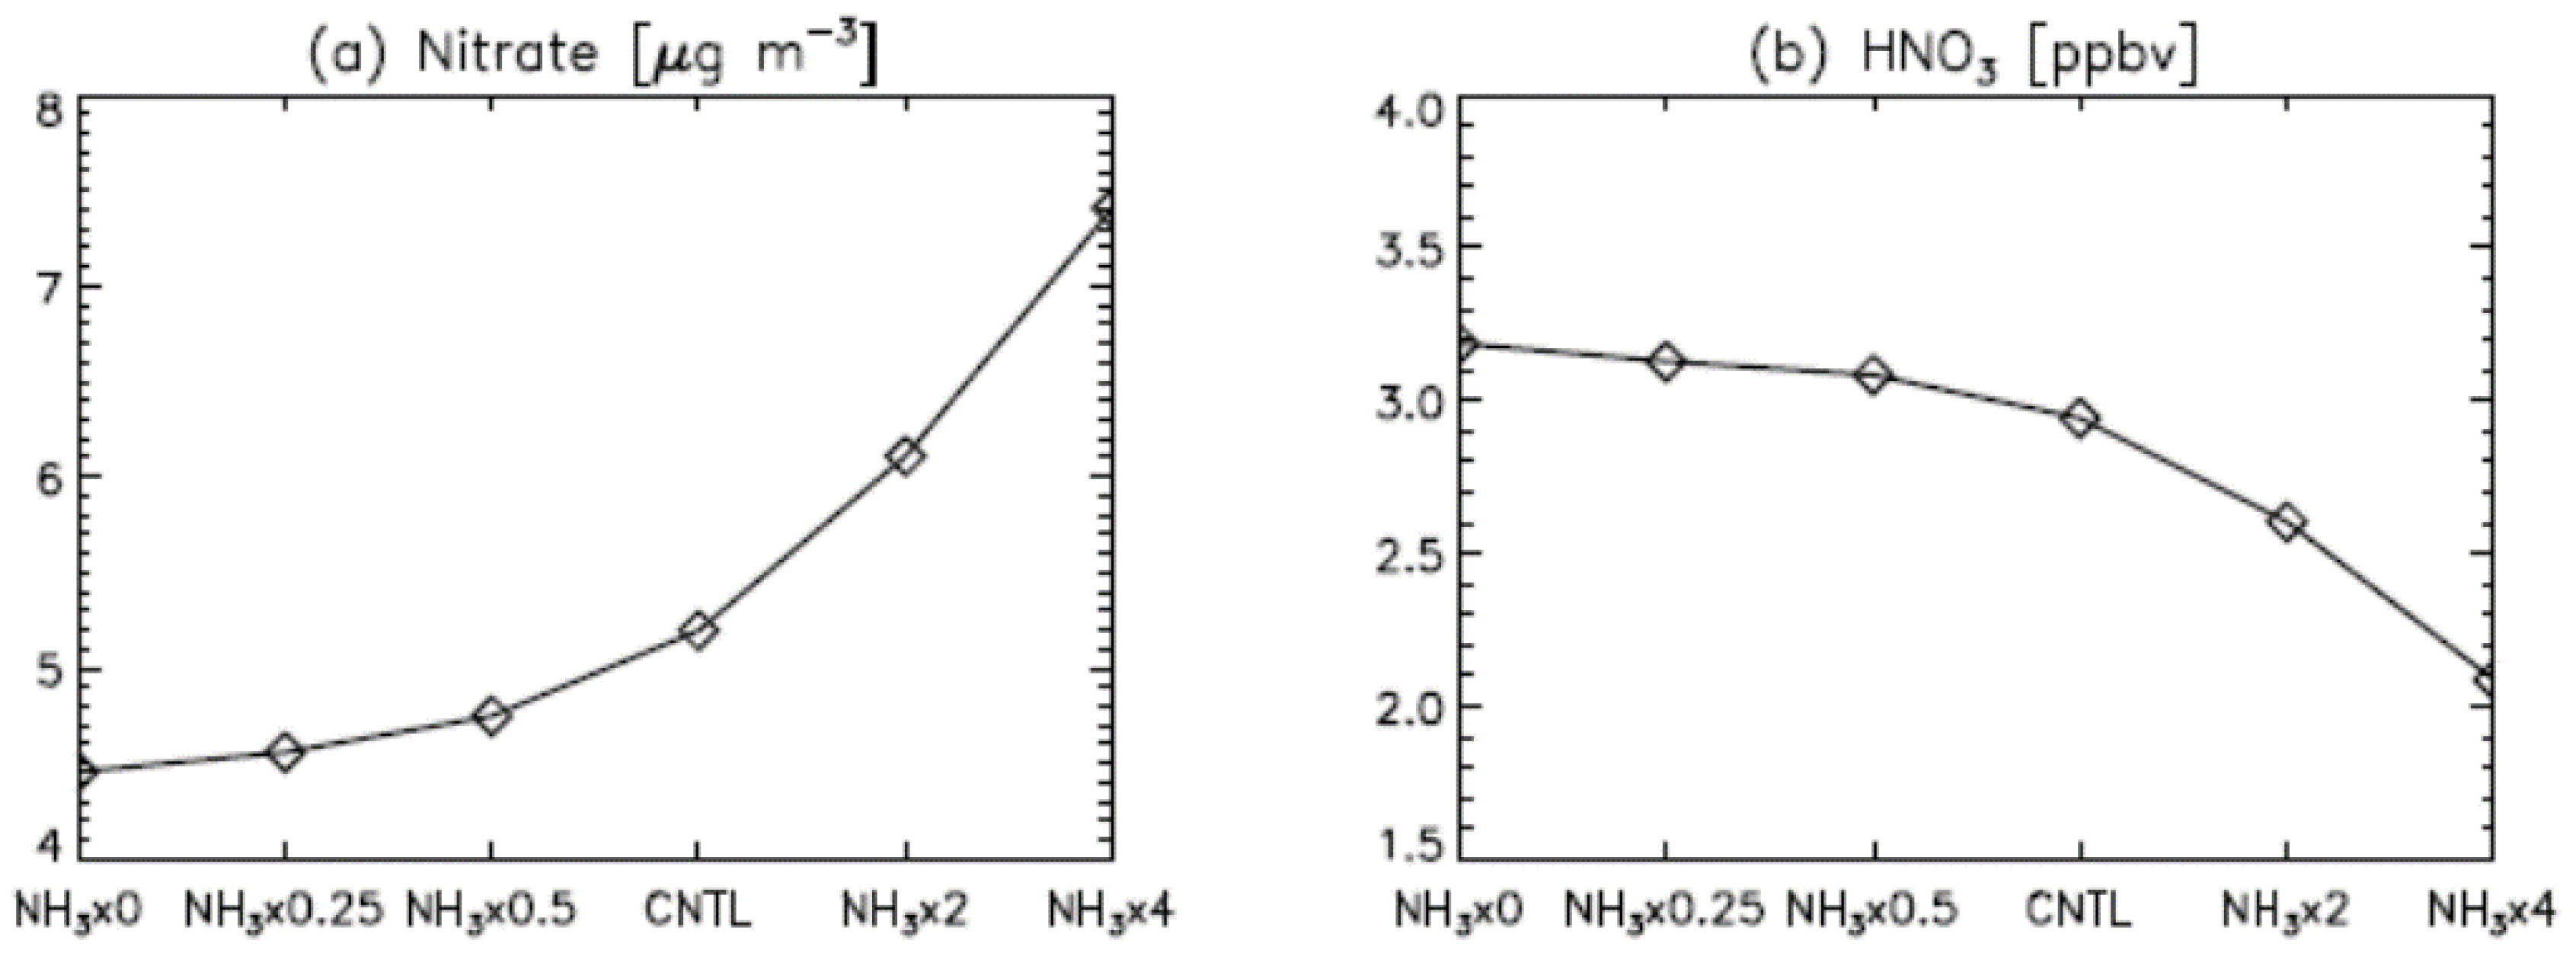
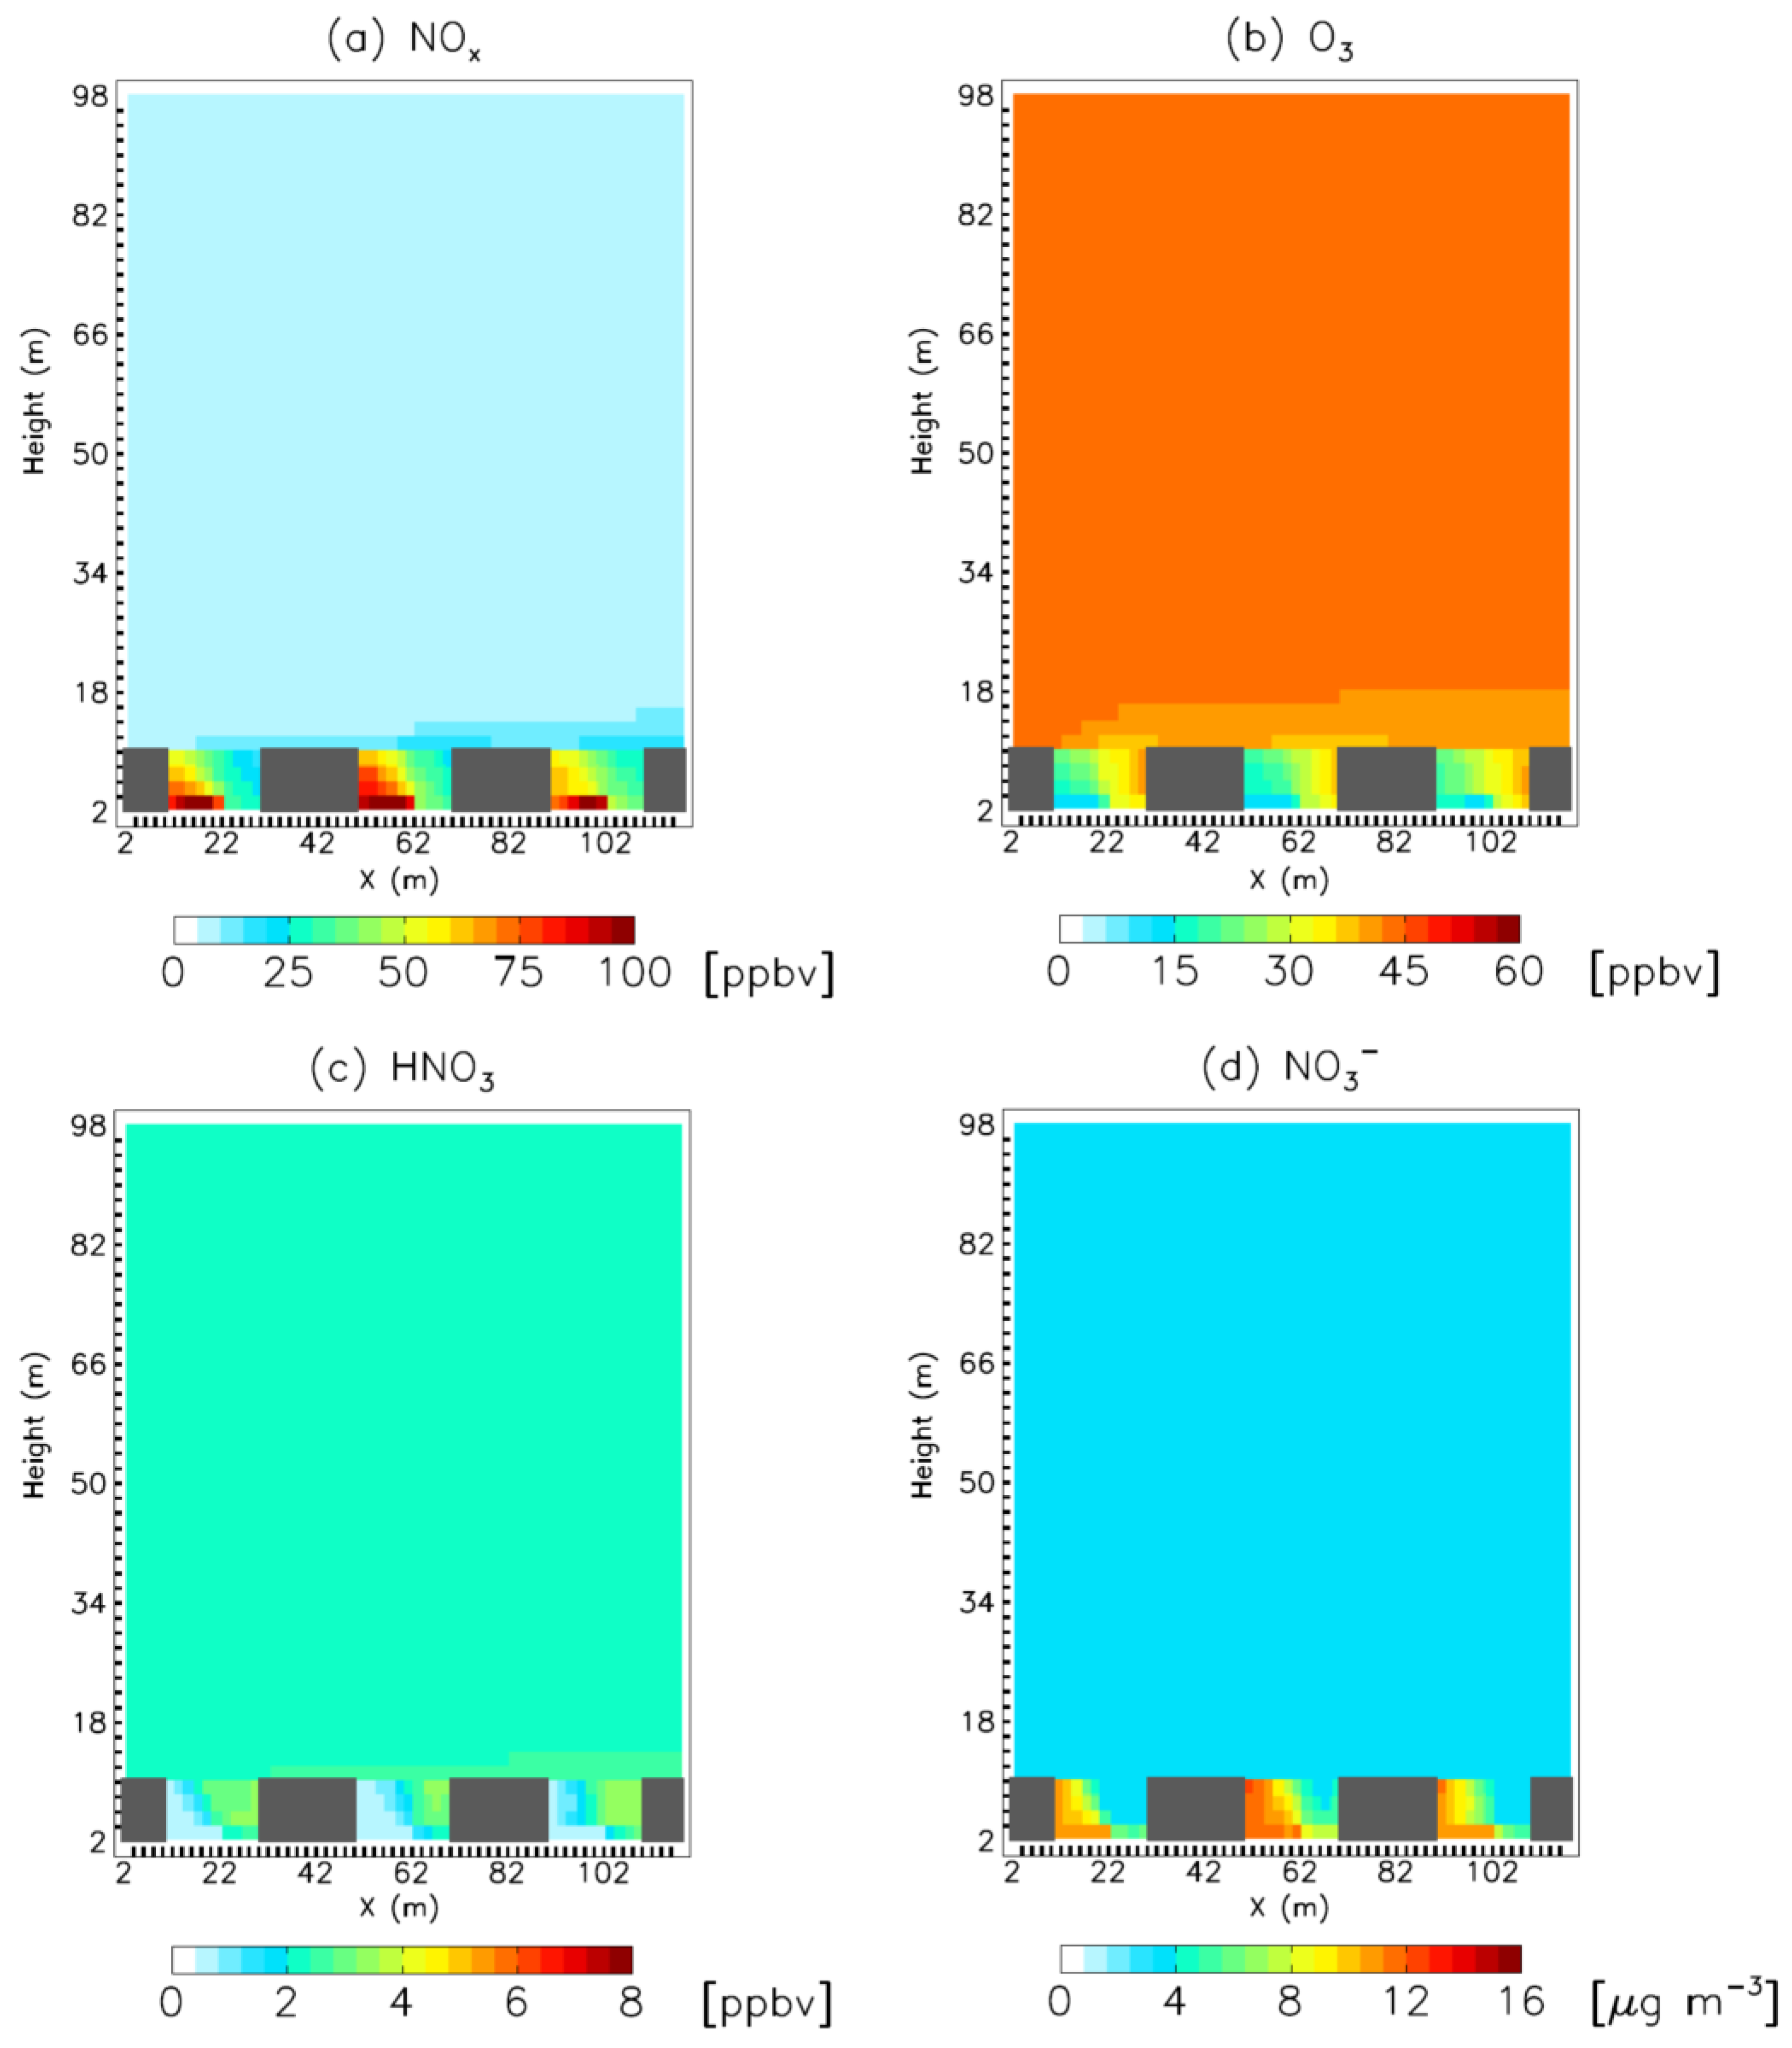
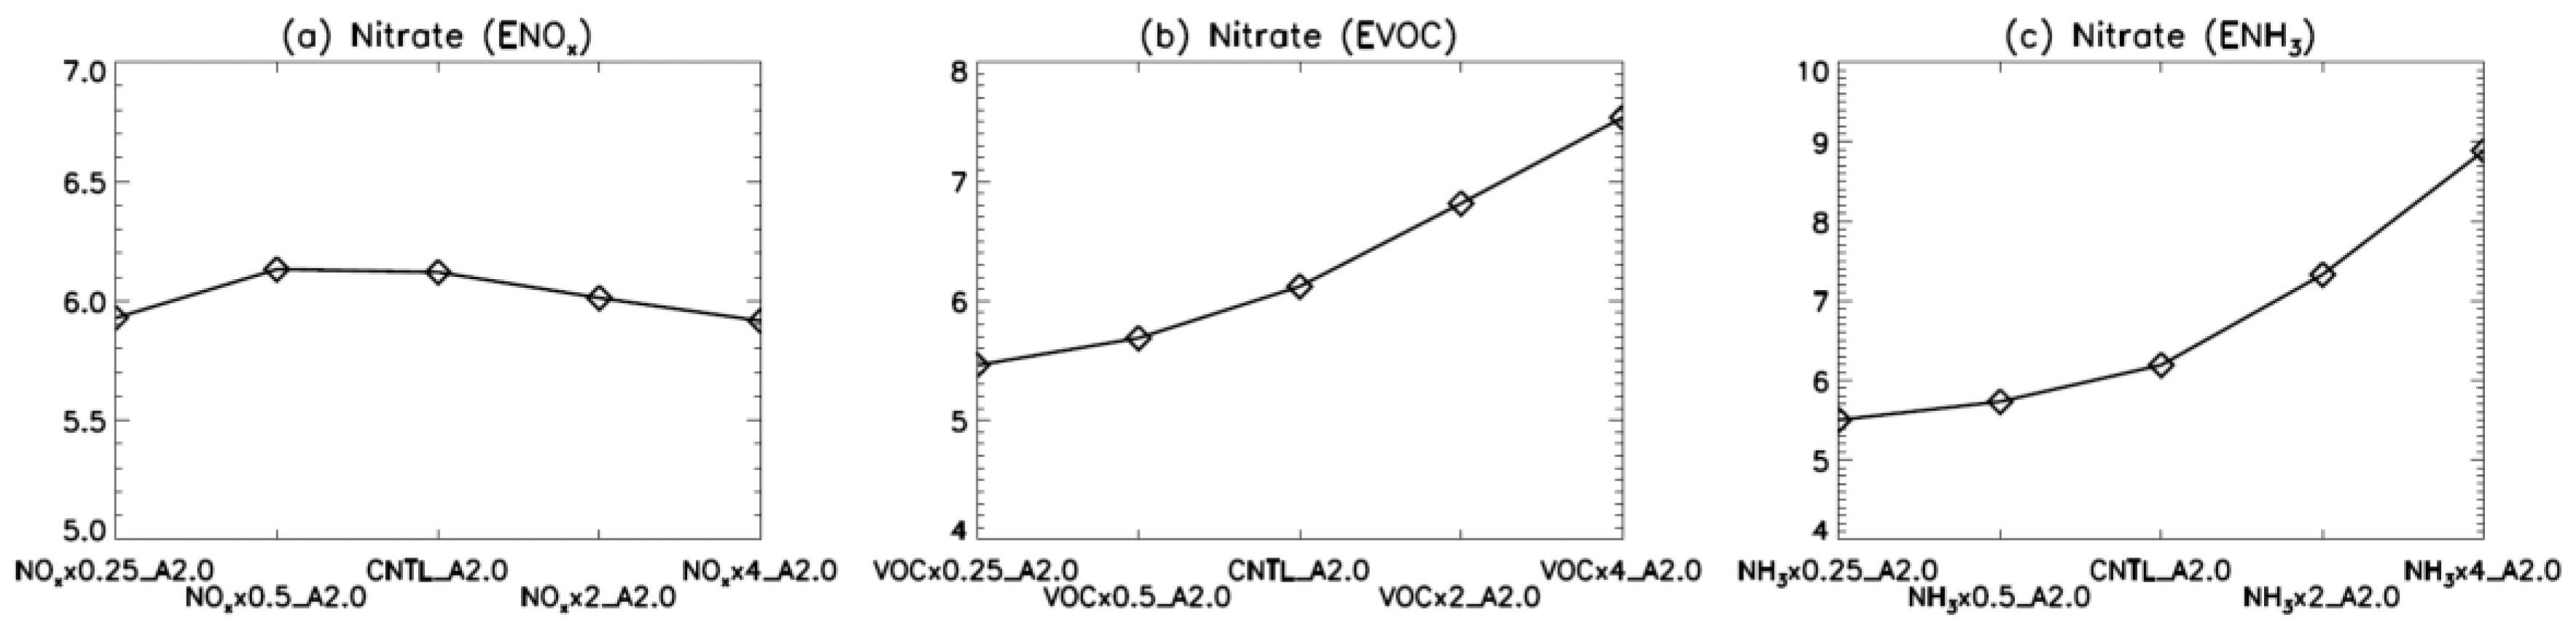
The coupled CFD–chemistry model in this study was thoroughly validated for the flow and dispersion of passive tracers in street canyons by comparing the results from this model with those from a wind tunnel, an idealized numerical study, and fluid experiments [25,27,52]. Park et al. (2015) found good agreements when comparing the model with wind tunnel data and experimental data by implementing improved wall functions for the momentum and thermodynamic energy equations in the CFD model to more accurately represent the effects of solid–wall boundaries [27].
The coupled CFD model also evaluated the dispersion of reactive pollutants compared with idealized simulations and field campaigns [25]. Kim et al. (2012) applied the coupled CFD–chemistry model to simulations using the same building configuration as in Baker et al. (2004) [25,53]. Their results showed that the concentrations of NOx and O3 have a pattern and magnitude consistent with the simulated concentrations by Baker et al. (2004) under steady-state O3–NO–NO2 photochemistry. Kim et al. (2012) reproduced reactive pollutants on Dongfeng Middle Street, Guangzhou, China, using a full tropospheric NOx–Ox–VOC chemistry scheme and compared the results to a field campaign by Xie et al. (2003) [13]. The coupled model, with the full photochemical mechanism, also successfully captured the time variation in the observed CO concentrations for both upwind and downwind sites in the Dongfeng Street canyon. However, the coupled model overestimated NOx concentrations compared to observations by Xie et al. (2003) due to estimating excessive NO emissions from traffic volume, implying the necessity of utilizing an accurate emissions inventory [13].
The coupled CFD model has also been used to evaluate the dispersion of reactive aerosol in street canyons [28]. Kim et al. (2019) evaluated the composition of PM1 in summer and winter in a street canyon by comparison with the field campaign in Elche, Spain, by Yubero et al. (2015) [28,54]. The model generally captured seasonal variations of PM1 in the street canyon. We evaluated the seasonal variation in nitrate concentration by comparing our model results to those of Yubero et al. (2015) [54]. Four simulations were conducted to represent the four seasons (spring, summer, autumn, and winter) in Elche, Spain. The street was approximately 7 m wide and surrounded by buildings that were approximately 25 m in height. The domain size was 20 m × 40 m × 50 m, and the number of grid points was 42 × 82 × 52. The meteorological conditions used were the observed seasonal mean values during the campaign periods. Pollutant emissions were estimated from traffic volume obtained from the Elche Traffic Office [54]. Vehicular emissions were computed using Spain’s emission rates in EMEP/EEA (2016). The detailed model configuration generally followed that of Kim et al. (2019) [28].
Figure 2 shows the observed and simulated nitrate concentrations by season. The observed nitrate concentrations were highest in winter and lowest in summer due to the thermal evaporation of nitrate aerosols, showing 1.3 and 0.3 μg m−3, respectively. The observed nitrate concentrations in spring and autumn were 0.4 and 0.5 μg m−3, respectively, falling between those in winter and summer and indicating the dominant effect of temperature on nitrate aerosol. The simulated nitrate concentrations were 1.0, 0.8, 1.0, and 1.4 μg m−3 in spring, summer, autumn, and winter, respectively, showing clear seasonal variation. The simulated concentrations reproduce the observed seasonal variation in nitrate concentration. However, the simulated nitrate concentration in summer was twice that of the observed magnitude, indicating the weaker thermal evaporation of ammonium nitrate predicted by the model. The model captured the magnitude of the observed nitrate in winter located within the standard deviation of the observed nitrate concentration. These results indicate that the model successfully calculated the nitrate aerosol in cold environments.

3. Results

Before investigating the production and sensitivity of nitrate aerosol, we checked the precursor gases of nitrate aerosol and oxidant concentrations that affect nitrate aerosol chemistry. Figure 3a indicates the meridionally averaged NOx concentration in the domain. The NOx concentration is highest at the street surface level, indicating that vehicular NOx emission is trapped by the canyon vortex in the street canyon. The NOx concentration reached 100 ppbv, ten times higher that outside the canyon, showing a steep gradient of NOx concentration in the street canyon. Note that concentrations in the three street canyons have slightly different values and dispersion patterns owing to different vortex patterns under non-infinite consecutive 3-D street canyons following the dispersion rates of TKE [26]. Figure 3b shows the spatial distribution of O3 concentration. The O3 concentration was lowest at the surface, showing a negative correlation with the NOx concentration. The O3 concentrations outside and inside the street canyon were 38 and 11 ppbv, respectively, suggesting NOx titration in the street canyon. This distribution of O3 and NOx fits the general dispersion pattern in the street canyon reported in previous studies [25,27]. Figure 3c displays the HNO3 concentration, which reached 3.8 ppbv in the street canyon. The HNO3 concentration in the street canyon was higher than that outside the street canyon, indicating the oxidation of HNO3 from vehicular NOx. However, the HNO3 concentration at the surface was the lowest, even though the NOx concentration was highest at the surface. The low level of HNO3 at the surface was caused by low O3 concentrations at the surface under VOC-limited conditions, suppressing the production of OH and HNO3. Figure 3d displays the NH3 concentrations; the daily averaged NH3 concentration reached 2.3 ppbv, with the highest value at the surface. The dispersion pattern of NH3 was similar to that of NOx, indicating the high impact of vehicular emissions.
Figure 4a shows the nitrate concentrations in the street canyon, which are higher than those outside the canyon, showing values of up to 11.4 μg m−3. The high concentration of nitrate aerosol is due to the high HNO3 concentration from vehicular NOx in the street canyon. However, the spatial pattern of nitrate aerosol in the street canyon differs from that of HNO3, because NH3 is a precursor gas of ammonium nitrate. The nitrate aerosol was highest at the surface following vehicular NH3. These high correlations between NH3 and nitrate aerosol indicate that ammonium nitrate forms under NH3-limited conditions in the street canyon. Figure 4b shows the ammonium concentration in the street canyon; the spatial distribution of ammonium aerosol is similar to that of nitrate, implying that most ammonium aerosols combine with nitrate aerosols in winter. The maximum concentration of ammonium aerosol was 4.7 μg m−3, and the spatial patterns of ammonium also indicate a low concentration of ammonium sulfate in winter. Note that the vehicular emission rate of SO2 was very low, implying that ammonium sulfate inside the street canyon might also be low [55]. The sum of the ammonium and nitrate concentrations was 16.1 μg m−3, higher than the air quality guidelines set by the World Health Organization (WHO, 10 μg m−3) and 46% of the WHO Interim Target-1 (35 μg m−3), indicating the hazardous effect of ammonium nitrate aerosols on pedestrians [56]. Considering that nitrate chemistry is highly nonlinear, this cannot be resolved and may lead to uncertainty in regional models due to their coarser resolution.
We investigated the sensitivity of nitrate aerosol production to NOx emission. Figure 5a shows the average nitrate concentration in the street canyon (i.e., below 20 m) by following vehicular NOx emission changes to investigate the sensitivity of nitrate aerosol production to the vehicular NOx emission rate. Surprisingly, the nitrate concentration did not show a clear relationship with the NOx emission rate. Nevertheless, the change in nitrate concentrations was at most 2% compared to the standard simulation, and the average nitrate concentration was highest in the CNTL and lowest in the NOx × 0.25 simulations, indicating the nonlinearity of the nitrate aerosol production to the NOx emission rate. These results contradict the conventional belief that high NOx emissions from vehicles can cause nitrate aerosol air quality problems.
Figure 5b,d display the average HNO3, O3, and NO2 concentrations, respectively, in the street canyon according to the sensitivity simulations. The HNO3 concentration in the street canyon shows changes similar to those of nitrate aerosol, indicating that the changes in nitrate aerosol in the sensitivity simulations are closely related to the changes in HNO3 (Figure 5b). The O3 concentration decreases as the NOx emissions increase because of NOx titration (Figure 5d). Note that O3 formation falls under a VOC-limited regime in the street canyon due to vehicular emissions. A low concentration of O3 prevents the conversion of NO2 to HNO3 through either photochemical production during the daytime due to inhibited OH production and heterogeneous nitrate production at night. The NO2 (the precursor gas of HNO3), concentration in the street canyon is proportional to the NOx emissions because it affects the direct NO2 emissions from vehicles and the reduction in photodissociation of NO2 under low O3 concentrations (Figure 5c). High NO2 creates suitable conditions for HNO3 formation, compensating for the effect of decreased O3 on HNO3. Thus, HNO3 and nitrate aerosols have no clear relationship with NOx emissions and only undergo small changes. These results imply that NOx emission controls cannot improve PM2.5 levels in urban street conditions.
In addition, we estimated the sensitivity of nitrate aerosol production to VOC emissions. Figure 6a shows the average concentration of nitrate aerosol in the street canyon following vehicular VOC emission changes; nitrate concentrations are proportional to VOC emissions. The average nitrate concentration in the VOC × 0.25 simulation was 8% lower than that of the CNTL simulation, indicating the higher sensitivity of VOC emissions to nitrate aerosols compared with that of NOx emissions. The nitrate aerosols in VOC × 0 only showed a 12% difference with those of the CNTL simulation, which implies the large impact of the boundary condition on nitrate formation. The changes in HNO3 concentration follow the changes in nitrate concentration, implying that the former is caused by the latter (Figure 6b). Reducing VOC emissions drives a decrease in both NO2 and O3 concentrations, creating unfavorable conditions for HNO3 production, in contrast to the effect of NOx emissions (Figure 6c,d). These results are consistent with a previous box modeling study, which suggests that increases in VOC emissions induce nitrate production via O3 increases under a VOC-limited regime for O3 production [57]. Considering that megacities are generally under a VOC-limited regime [58,59], VOC emission control can improve both O3 control and PM2.5 control in urban street canyons.
Finally, we investigated the sensitivity of NH3 emissions to nitrate production. Figure 7a shows the average concentration of nitrate aerosols in the street canyon following vehicular NH3 emission changes. The concentration of nitrate aerosol was considerably influenced by the NH3 emission changes; the nitrate concentration in the NH3 × 4 simulation was 42% higher than that in the standard simulation, and the nitrate concentration in NH3 × 0.25 was 85% of that in the standard simulation. These results indicate that the sensitivity of NH3 emissions to nitration is much higher than that of NOx and slightly higher than that of the VOC emissions. The HNO3 concentrations are inversely proportional to NH3 emissions, indicating that higher NH3 emissions induce a higher conversion rate of HNO3 to nitrate aerosol (Figure 7b). These results suggest that the production of ammonium nitrate is reduced by the low concentration of NH3 under an NH3-limited regime for nitrate production. Studies based on both modeling and observed campaigns have reported that nitrate formation occurs under an NH3-limited regime in East Asian megacities, including SMR [21,60]. The nitrate aerosols in the NH3 × 0 simulation were 19% lower than those with the CNTL simulation, indicating that ammonium and NH3 concentrations from the boundary also have an important role in nitrate formation in the urban street canyon. These results indicate that the control of NH3 emissions might be the most effective way to degrade PM2.5 problems where vehicular emissions are dominant in winter. The regulation of vehicle emissions is mostly focused on the control of NOx emissions; considering the present findings, we should instead focus on controlling VOC and NH3.
Though we used the coupled CFD–chemistry model to investigate the sensitivity of nitrate aerosols from vehicular emissions under complex geometry, our simulation still has limitations. Sea-salt aerosol significantly impacts the formation of nitrate aerosols via heterogeneous reactions when interacting with trace gases on the surface of sea-salt aerosol [61]. This process drives the efficient production of nitrates under an NH3-limited environment. This model does not account for the effect of sea-salt aerosol on nitrate aerosol production. Therefore, the simulation might underestimate the nitrate formation of heterogeneous chemistry. Moreover, we only considered the effect of vehicular emissions; NH3 and VOCs emissions from heating or biogenic emissions might affect the sensitivity of nitrate formation in the street canyon. The absence of these emissions in the model domain might create uncertainty in the nitrate aerosol calculation in this simulation.

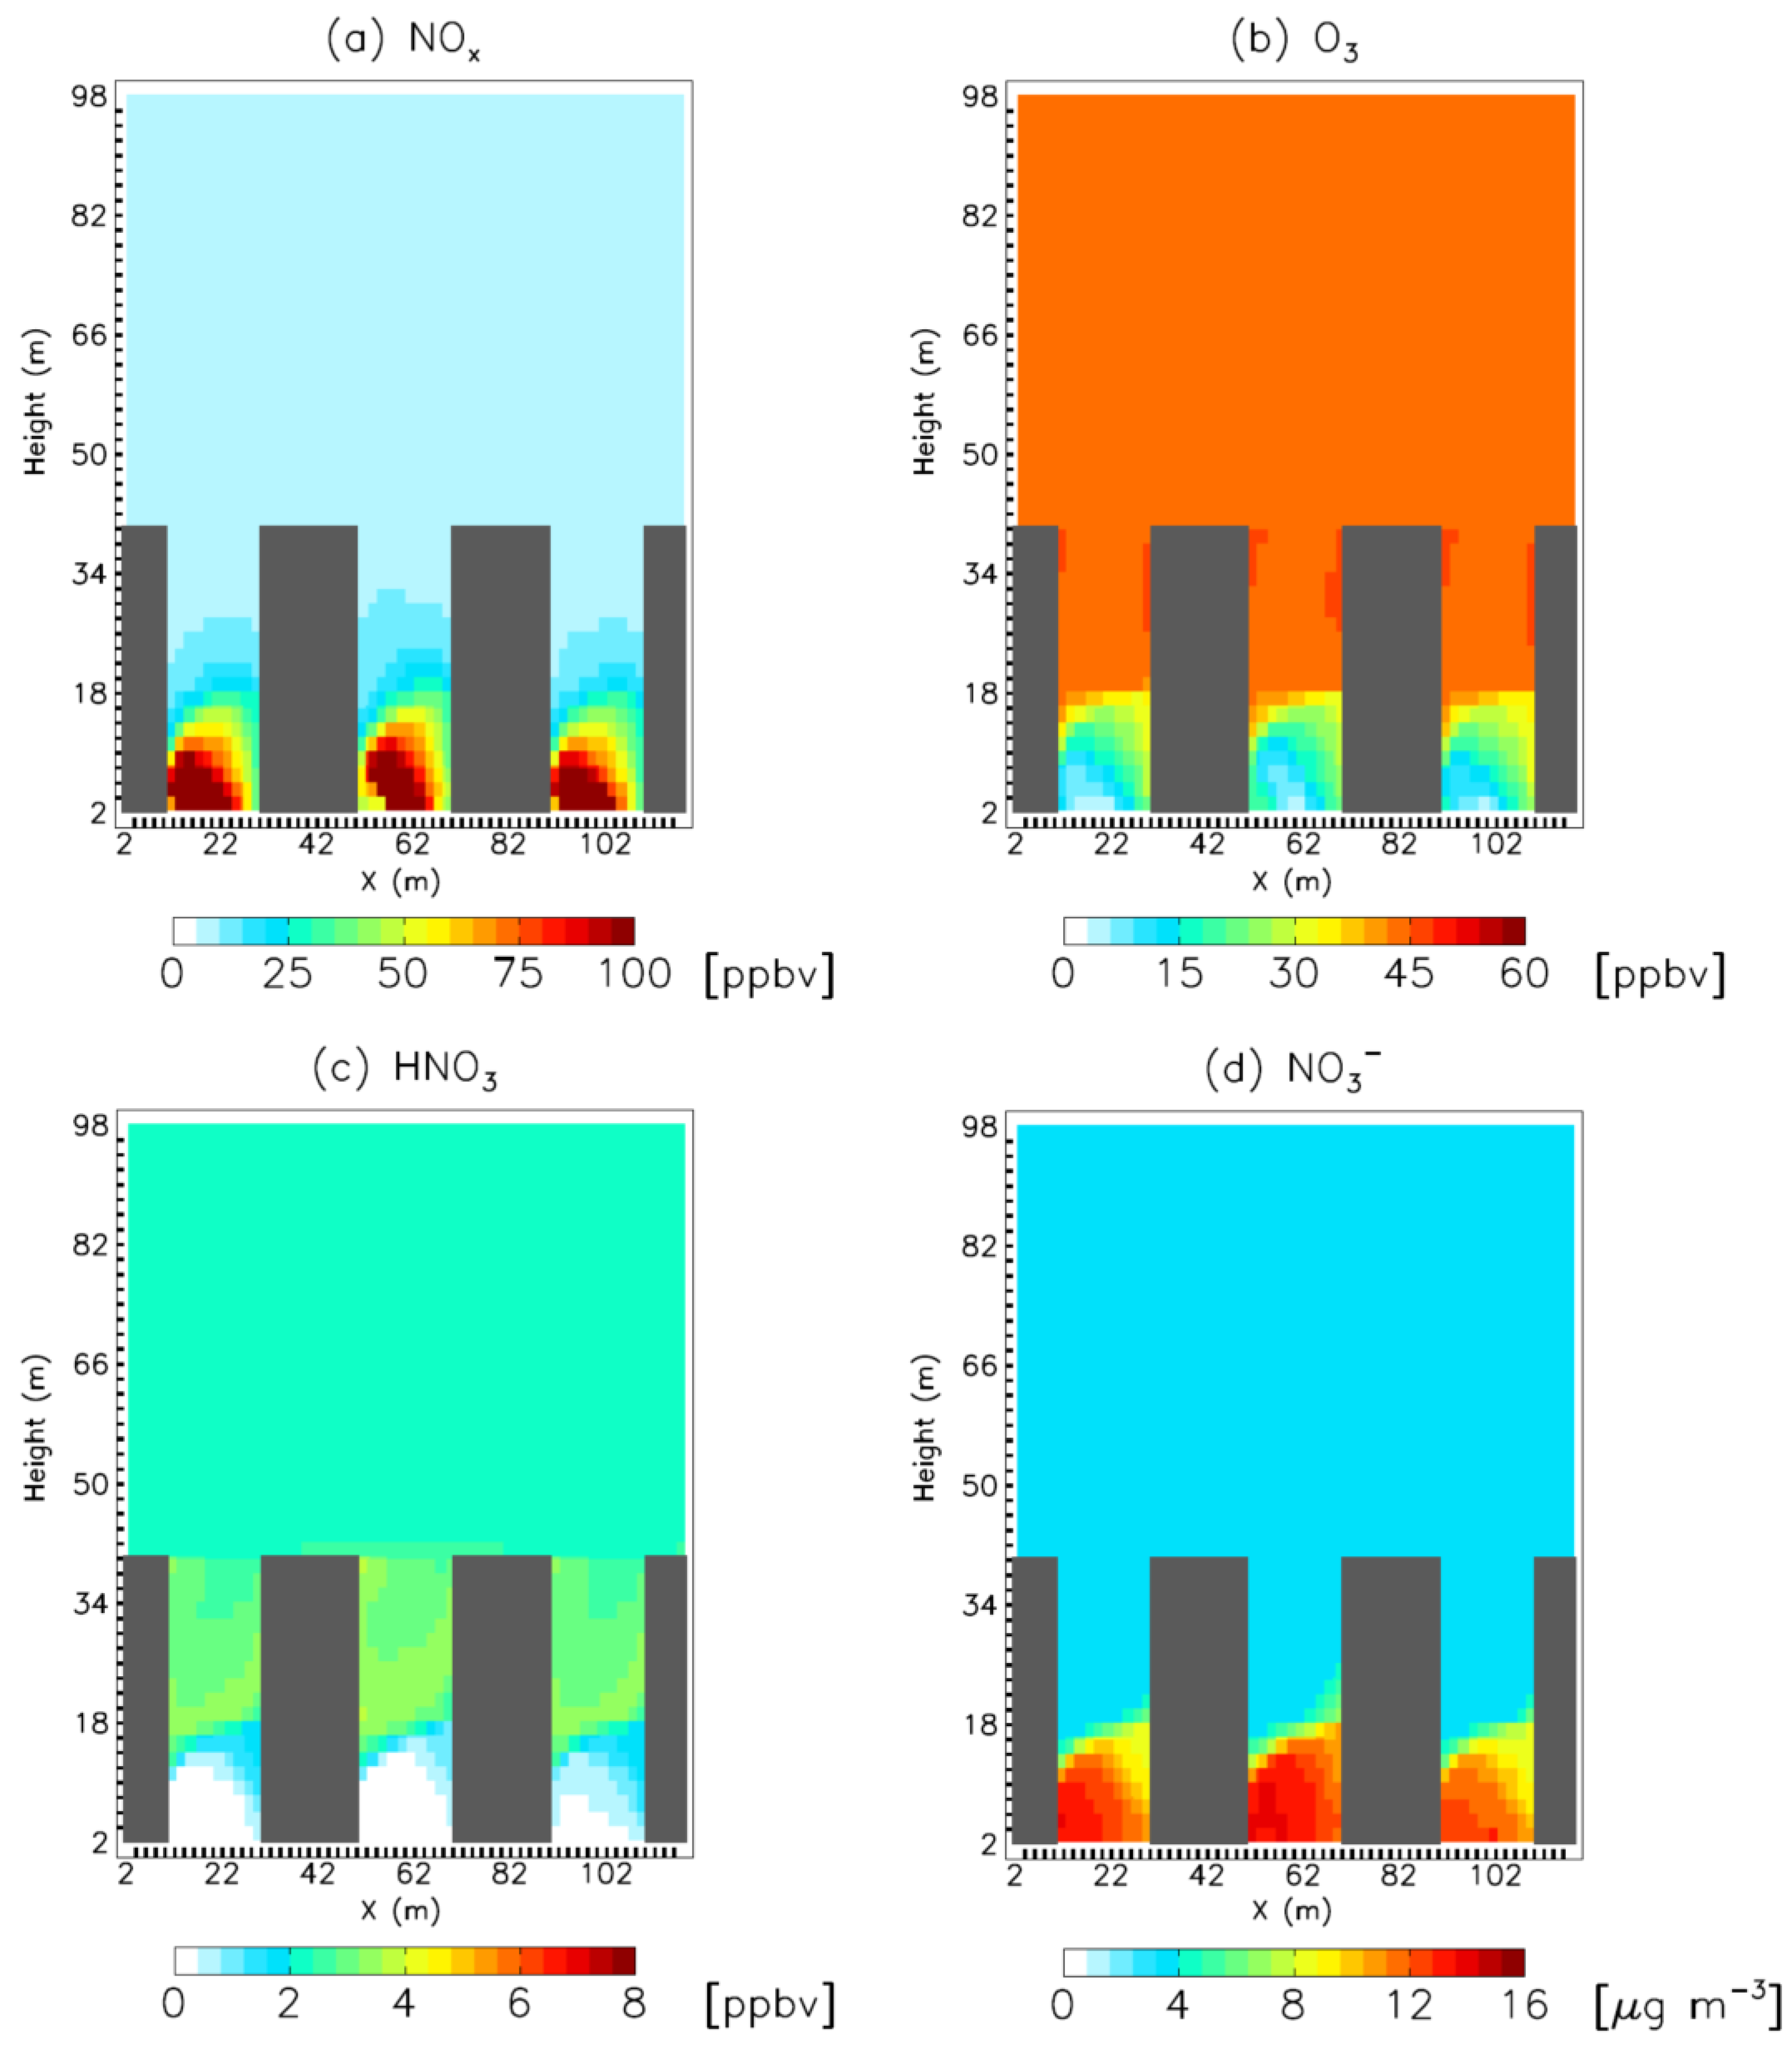
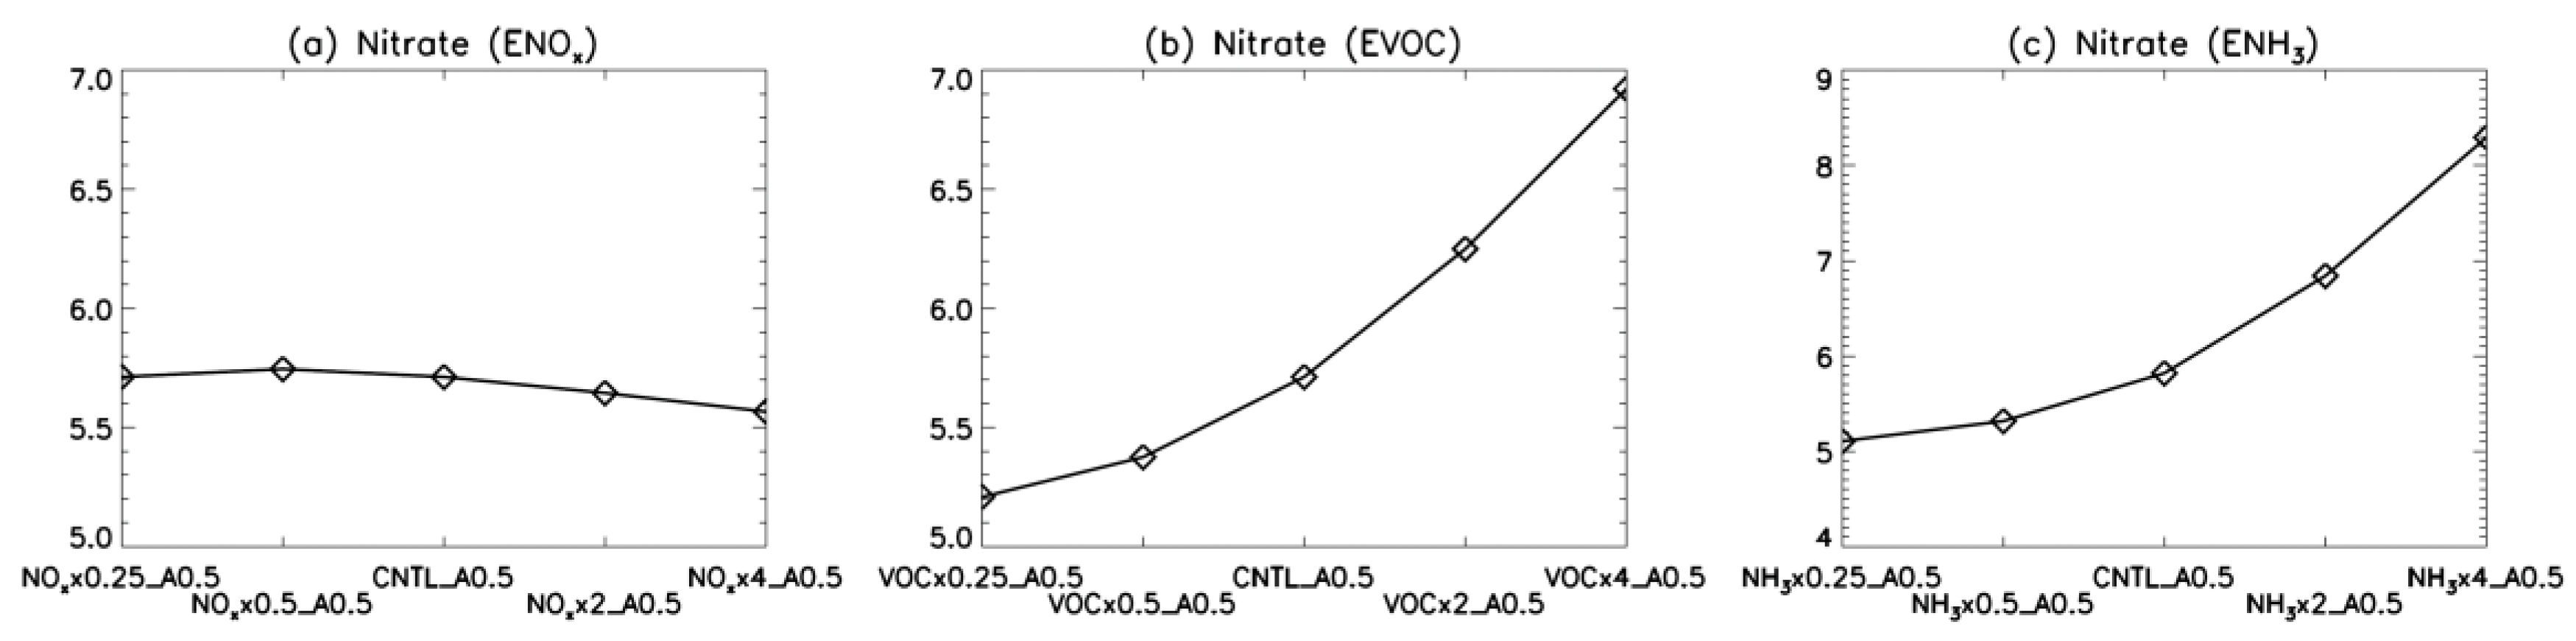
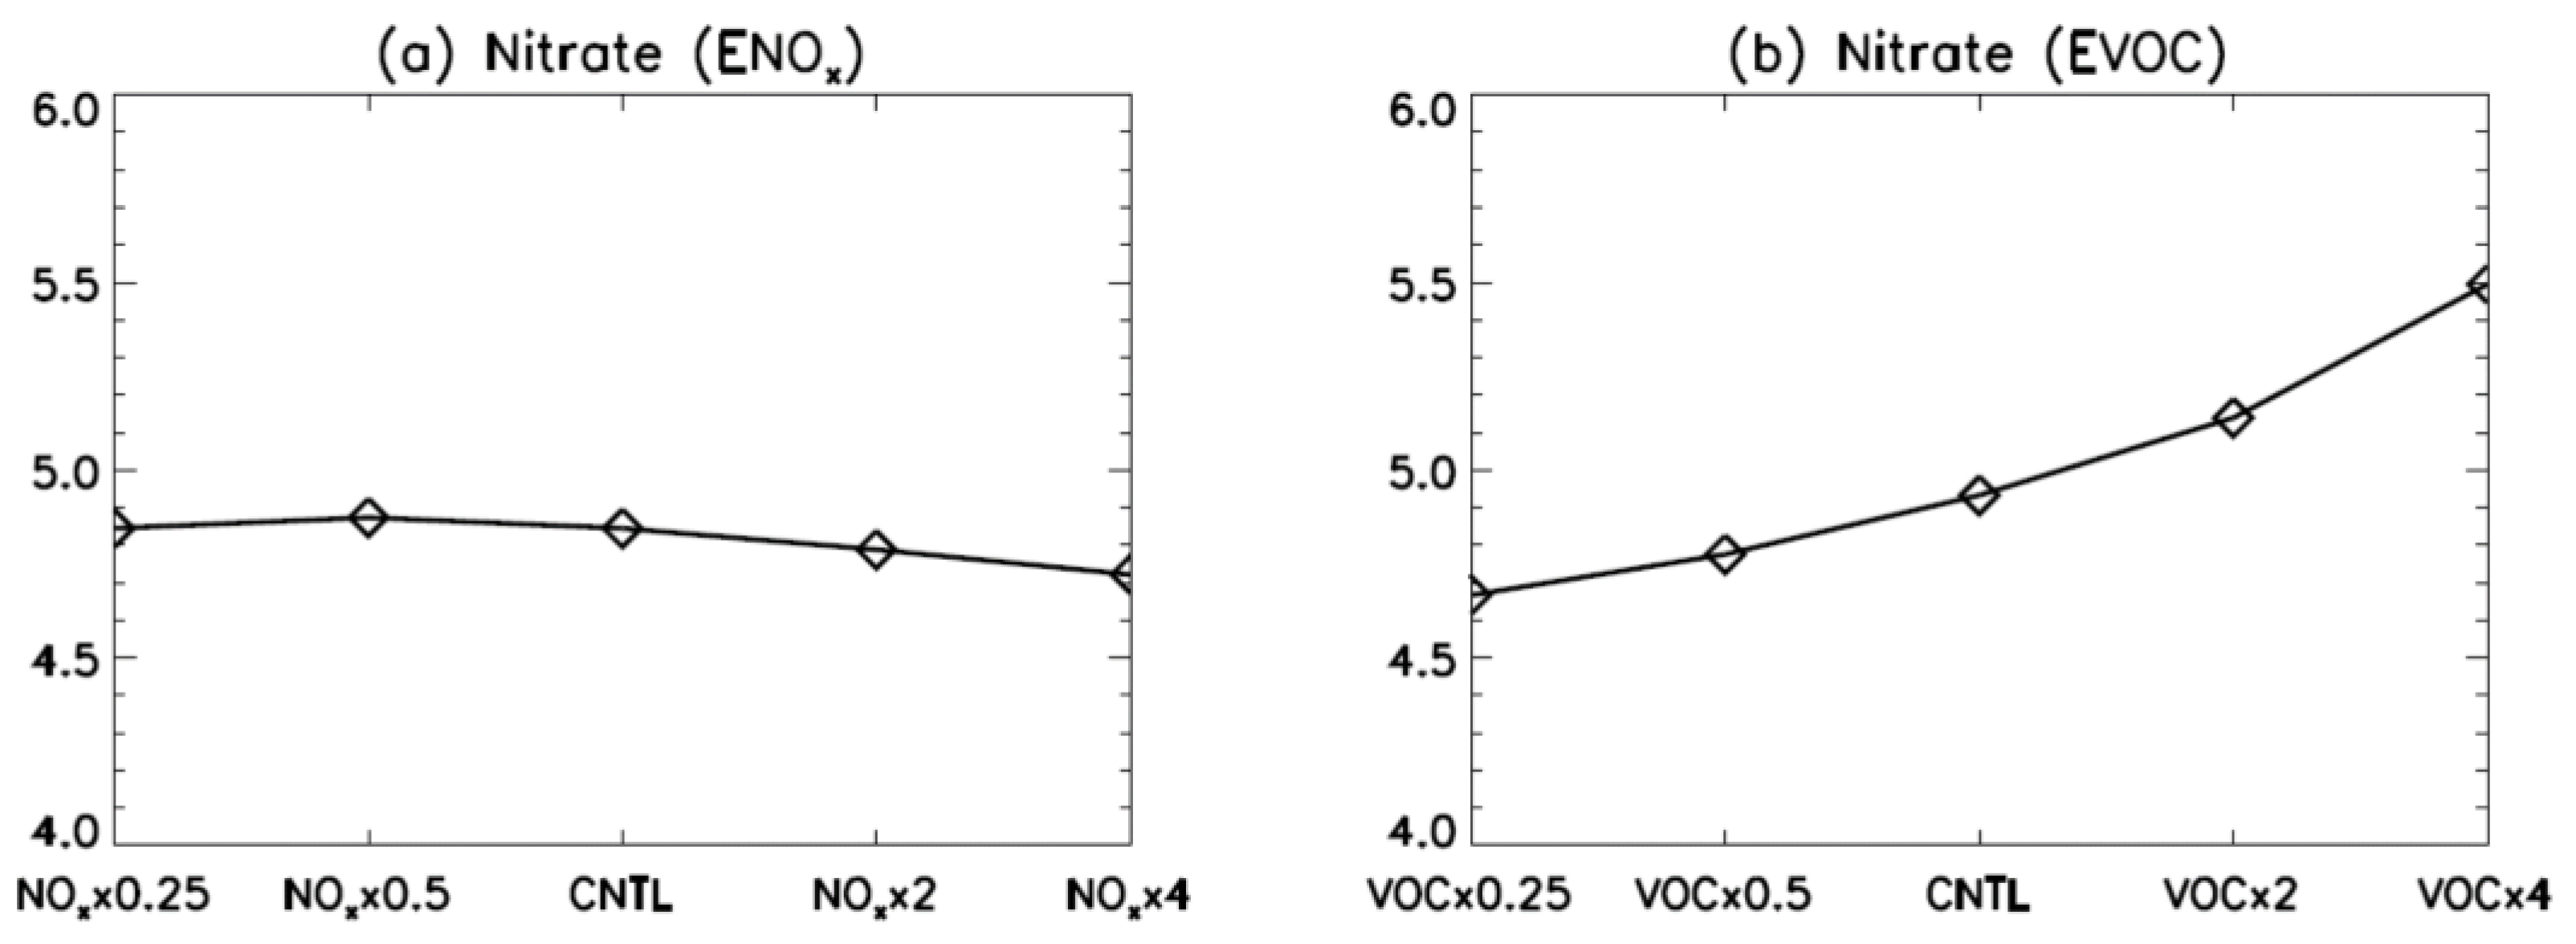
4. Model Sensitivity to Geometry and Speciation of VOC Emissions

We examined the sensitivity of the model to the canyon geometry by conducting sensitivity model simulations in which we changed the street canyon aspect ratios (the ratio of building height to street width) of the street canyon to 0.5 and 2.0. The conditions of the sensitivity simulations were identical to those of the CTNL simulation except that the height of the buildings, 10 m and 40 m, respectively, indicating canyon aspect ratios of 0.5 and 2.0 (Figure 8). We named the sensitivity simulations for different aspect ratios “species name” × “multiplying factor” _A ”aspect ratio” (e.g., CNTL_A2.0 and NOx × 2_A0.5). Figure 9 and Figure 10 indicate the meridionally averaged NOx, O3, HNO3, and nitrate aerosol concentrations in the CNTL_A0.5 and CNTL_A 2.0 simulations. The nitrate aerosol and their precursors showed similar distributions as those of the CNTL simulations despite the difference in their aspect ratios. The NOx concentration was highest at the surface and is an order of magnitude higher than that outside the canyon, indicating the trapping of vehicular emissions due to the strong canyon vortex in the street canyon (Figure 9a and Figure 10a). The spatial distribution of NOx indicates that concentrated vehicular emissions drive the NOx titration of the O3 concentration at the surface under a low VOC emissions condition in both cases (Figure 9b and Figure 10b). The HNO3 concentrations also show similar distribution to those of the CTNL simulation, indicating the suppressing of the production of OH and HNO3 (Figure 9c and Figure 10c). Figure 9d and Figure 10d show the nitrate concentrations in the street canyon for different canyon aspect ratios. The averaged nitrate concentrations in the street canyon (<10 m and <40 m, respectively) show 5.7 and 6.2 μg m−3 in the CNTL_A0.5 and CNTL_A 2.0 simulations, respectively, which are 9%, and 19% higher than those of the CTNL simulation. These differences are mainly due to the complex canyon vortex driving for the building geometry [27]. Despite the dispersion patterns differing according to canyon geometry, the mechanism of nitrate aerosol formation was consistent with that of CNTL, suggesting high nitrate formation from vehicular emissions in the street canyon.
We tested the NOx, VOC, and NH3 emission sensitivity to nitration formation for different canyon aspect ratios (0.5 and 2.0). Figure 11 and Figure 12 show the averaged nitrate concentration in the street canyons (<10 m and <40 m, respectively) by following the vehicular NOx, VOC, and NH3 emission changes for the different canyon aspect ratios of 0.5 and 2.0, respectively. The sensitivity of the nitrate formation following NOx, VOC, and NH3 emission changes is also similar to those for the canyon aspect ratio of unity. The nitrate concentration changes show no clear relationship with the NOx emission rate in either case, which is related to the nitrate precursor changes, particularly in the daytime as we mentioned (not shown). The maximum concentrations occurred in NOx × 0.5_A0.5 and NOx × 0.5_A2.0, which differed slightly with the simulations for the canyon aspect ratio of unity. Nevertheless, the difference in the nitrate concentrations between the simulations was only 2%. The sensitivity of nitrate formation following VOC and NH3 emissions also follows consistent results with those for the aspect ratio of unity. Enhanced (reduced) VOC emissions drive an increase (decrease) in the nitrate aerosol concentration affecting the O3 concentration under a VOC limited regime for O3 production. The nitrate concentration in the street canyon is proportional to the vehicular NH3 emission, indicating that NH3 limits the condition of nitrate formation in both cases. These results indicate that the sensitivity of nitrate formation following emission changes in the street canyon is consistent, regardless of the building aspect ratio, due to concentrated emissions from vehicles and the canyon vortex.
The VOC speciation of vehicular emissions might change the model sensitivity on nitrate formation by affecting the ozone and OH production, considering all mechanisms are explained under a VOC limited regime for O3 production. Therefore, we checked the sensitivity of VOC speciation of emissions on nitrate aerosol formation using the different VOC chemical speciation used by Kim et al. (2006) [62]. Table 5 summarizes the emission rates and the ratio of speciated VOC with the method of Kim et al. (2006). Figure 13 indicates the averaged nitrate concentration in the street canyon (i.e., below 20 m) by following vehicular NOx, VOC, and NH3 emission changes with the VOC speciation of Kim et al. (2006). Similar to other sensitivity simulations, NOx emission changes did not affect the nitrate formation (due to the conflicting effects of NO2 and O3) even though we changed the VOC speciation (Figure 13a). The sensitivity of VOC concentration to nitrate formation also shows a similar relationship to that with EMEP/EEA speciation. However, the sensitivity was slightly lower than the nitrate concentration in CNTL, showing only a 6% difference between VOC × 0.25 and CNTL (Figure 13b). These results show that the reduction of vehicular VOC emission is a more effective way to regulate nitrate problems in urban streets than NOx emissions under different VOC speciations.

5. Conclusions

Nitrate contributions to PM2.5 mass have increased in polluted urban areas, with an increasing number of severe haze events in East Asia. This study investigates the favorable conditions for the production of nitrate aerosols in urban streets using a coupled CFD–chemistry model. It was found that the nitrate concentrations in street canyons are higher than those outside the canyons due to the high HNO3 concentrations from vehicular NOx in these canyons. However, the spatial pattern of nitrate aerosols in street canyons differs from that of HNO3 due to NH3, thus indicating that ammonium nitrate formation occurs under NH3-limited conditions in street canyons.
Sensitivity simulations indicate that nitrate concentration does not show a clear relationship with the NOx emission rate, with nitrate changes of only 2% across among 16 time differences in NOx emissions. The HNO3 concentration in street canyons changes in a similar manner to that of nitrate aerosols, indicating that the changes in nitrate aerosols in the sensitivity simulations are closely related to HNO3 changes. An increase in the NOx emissions induces a decrease in O3 and an increase in NO2 under a VOC-limited regime for O3 production. These changes in O3 and NO2 have a conflicting effect on the HNO3 production in urban streets. Therefore, HNO3 and nitrate aerosols have no linear relationship with NOx emissions and only undergo small changes. The sensitivity simulations were conducted by varying the vehicular VOC emissions to investigate their effect on nitrate production. The results show that nitrate concentrations are proportional to VOC emissions. Nitrate was decreased by 9% in the VOC × 0.25 simulation, indicating a relatively high sensitivity compared to that of NOx. Decreased VOC emissions drive a decrease in both NO2 and O3 concentrations, creating unfavorable conditions for HNO3 production, unlike the effect of changes in NOx emissions. The nitrate aerosol concentration is considerably influenced by NH3 emissions, which show a higher sensitivity to nitrate production than do NOx and VOC emissions in urban streets. The nitrate concentration is proportional to NH3 emissions with the additional production of ammonium nitrate under an NH3-limited regime for nitrate production. This research implies that, where vehicular emissions are dominant in winter, the control of vehicular VOC and NH3 emissions might be a more effective way to degrade PM2.5 problems than controlling NOx.
We checked the model sensitivity by changing the model’s building geometry and VOC speciation. The sensitivity of nitrate formation by following emissions changes acts in a similar direction as CNTL simulation despite changing the building geometry and speciation of VOC emissions. The sensitivity simulations revealed that our results about the sensitivity of nitrate production to emission changes are robust.

Funding

This work was funded by the 2017 Research Fund of Myongji University.

Acknowledgments

This work was supported by the 2017 Research Fund of Myongji University.

Conflicts of Interest

The authors declare no conflict of interest.

References

  1. Huang, R.-J.; Zhang, Y.; Bozzetti, C.; Ho, K.-F.; Cao, J.-J.; Han, Y.; Daellenbach, K.R.; Slowik, J.G.; Platt, S.M.; Canonaco, F. High secondary aerosol contribution to particulate pollution during haze events in China. Nature 2014, 514, 218. [Google Scholar] [PubMed]
  2. Liu, X.; Sun, K.; Qu, Y.; Hu, M.; Sun, Y.; Zhang, F.; Zhang, Y. Secondary formation of sulfate and nitrate during a haze episode in megacity Beijing, China. Aerosol Air Qual. Res. 2015, 15, 2246–2257. [Google Scholar] [CrossRef]
  3. Pan, Y.; Wang, Y.; Zhang, J.; Liu, Z.; Wang, L.; Tian, S.; Tang, G.; Gao, W.; Ji, D.; Song, T. Redefining the importance of nitrate during haze pollution to help optimize an emission control strategy. Atmos. Environ. 2016, 141, 197–202. [Google Scholar] [CrossRef]
  4. Tan, J.; Duan, J.; He, K.; Ma, Y.; Duan, F.; Chen, Y.; Fu, J. Chemical characteristics of PM2.5 during a typical haze episode in Guangzhou. J. Environ. Sci. 2009, 21, 774–781. [Google Scholar]
  5. Wang, H.-J.; Chen, H.-P. Understanding the recent trend of haze pollution in eastern China: Roles of climate change. Atmos. Chem. Phys. 2016, 16, 4205–4211. [Google Scholar] [CrossRef]
  6. Han, S.H.; Kim, Y.P. Long-term Trends of the Concentrations of Mass and Chemical Composition in PM 2.5 over Seoul. J. Korean Soc. Atmos. Environ. 2015, 31, 143–156. [Google Scholar] [CrossRef]
  7. Guo, H.; Ding, A.J.; So, K.L.; Ayoko, G.; Li, Y.S.; Hung, W.T. Receptor modeling of source apportionment of Hong Kong aerosols and the implication of urban and regional contribution. Atmos. Environ. 2009, 43, 1159–1169. [Google Scholar] [CrossRef]
  8. Liu, T.; Wang, X.; Hu, Q.; Deng, W.; Zhang, Y.; Ding, X.; Fu, X.; Bernard, F.; Zhang, Z.; Lü, S. Formation of secondary aerosols from gasoline vehicle exhaust when mixing with SO2. Atmos. Chem. Phys. 2016, 16, 675–689. [Google Scholar] [CrossRef]
  9. Nowak, J.B.; Neuman, J.A.; Bahreini, R.; Middlebrook, A.M.; Holloway, J.S.; McKeen, S.A.; Parrish, D.D.; Ryerson, T.B.; Trainer, M. Ammonia sources in the California South Coast Air Basin and their impact on ammonium nitrate formation. Geophys. Res. Lett. 2012, 39. [Google Scholar] [CrossRef]
  10. Durant, J.L.; Ash, C.A.; Wood, E.C.; Herndon, S.C.; Jayne, J.T.; Knighton, W.B.; Canagaratna, M.R.; Trull, J.B.; Brugge, D.; Zamore, W. Short-term variation in near-highway air pollutant gradients on a winter morning. Atmos. Chem. Phys. 2010, 10, 5599. [Google Scholar] [CrossRef] [PubMed]
  11. Hagler, G.S.W.; Baldauf, R.W.; Thoma, E.D.; Long, T.R.; Snow, R.F.; Kinsey, J.S.; Oudejans, L.; Gullett, B.K. Ultrafine particles near a major roadway in Raleigh, North Carolina: Downwind attenuation and correlation with traffic-related pollutants. Atmos. Environ. 2009, 43, 1229–1234. [Google Scholar] [CrossRef]
  12. Hu, S.; Fruin, S.; Kozawa, K.; Mara, S.; Paulson, S.E.; Winer, A.M. A wide area of air pollutant impact downwind of a freeway during pre-sunrise hours. Atmos. Environ. 2009, 43, 2541–2549. [Google Scholar] [CrossRef]
  13. Xie, S.; Zhang, Y.; Qi, L.; Tang, X. Spatial distribution of traffic-related pollutant concentrations in street canyons. Atmos. Environ. 2003, 37, 3213–3224. [Google Scholar] [CrossRef]
  14. Myhre, G.; Grini, A.; Metzger, S. Modelling of nitrate and ammonium-containing aerosols in presence of sea salt. Atmos. Chem. Phys. 2006, 6, 4809–4821. [Google Scholar] [CrossRef] [Green Version]
  15. Riemer, N.; Vogel, H.; Vogel, B.; Schell, B.; Ackermann, I.; Kessler, C.; Hass, H. Impact of the heterogeneous hydrolysis of N2O5 on chemistry and nitrate aerosol formation in the lower troposphere under photosmog conditions. J. Geophys. Res. Atmos. 2003, 108. [Google Scholar]
  16. Schaap, M.; Cuvelier, C.; Hendriks, C.; Bessagnet, B.; Baldasano, J.M.; Colette, A.; Thunis, P.; Karam, D.; Fagerli, H.; Graff, A. Performance of European chemistry transport models as function of horizontal resolution. Atmos. Environ. 2015, 112, 90–105. [Google Scholar] [CrossRef] [Green Version]
  17. Tewari, M.; Kusaka, H.; Chen, F.; Coirier, W.J.; Kim, S.; Wyszogrodzki, A.A.; Warner, T.T. Impact of coupling a microscale computational fluid dynamics model with a mesoscale model on urban scale contaminant transport and dispersion. Atmos. Res. 2010, 96, 656–664. [Google Scholar] [CrossRef]
  18. Wehner, M.F.; Reed, K.A.; Li, F.; Bacmeister, J.; Chen, C.-T.; Paciorek, C.; Gleckler, P.J.; Sperber, K.R.; Collins, W.D.; Gettelman, A. The effect of horizontal resolution on simulation quality in the Community Atmospheric Model, CAM5.1. J. Adv. Model. Earth Syst. 2014, 6, 980–997. [Google Scholar] [CrossRef] [Green Version]
  19. Prasad, R.; Bella, V.R. A review on diesel soot emission, its effect and control. Bull. Chem. React. Eng. Catal. 2011, 5, 69–86. [Google Scholar] [CrossRef]
  20. Zhang, Q.; He, K.; Huo, H. Policy: Cleaning China’s air. Nature 2012, 484, 161. [Google Scholar]
  21. Link, M.F.; Kim, J.; Park, G.; Lee, T.; Park, T.; Babar, Z.B.; Sung, K.; Kim, P.; Kang, S.; Kim, J.S. Elevated production of NH4NO3 from the photochemical processing of vehicle exhaust: Implications for air quality in the Seoul Metropolitan Region. Atmos. Environ. 2017, 156, 95–101. [Google Scholar] [CrossRef]
  22. Pathak, R.K.; Wu, W.S.; Wang, T. Summertime PM 2.5 ionic species in four major cities of China: Nitrate formation in an ammonia-deficient atmosphere. Atmos. Chem. Phys. 2009, 9, 1711–1722. [Google Scholar] [CrossRef]
  23. Wen, L.; Chen, J.; Yang, L.; Wang, X.; Xu, C.; Sui, X.; Yao, L.; Zhu, Y.; Zhang, J.; Zhu, T. Enhanced formation of fine particulate nitrate at a rural site on the North China Plain in summer: The important roles of ammonia and ozone. Atmos. Environ. 2015, 101, 294–302. [Google Scholar] [CrossRef]
  24. Pun, B.K.; Seigneur, C. Sensitivity of particulate matter nitrate formation to precursor emissions in the California San Joaquin Valley. Environ. Sci. Technol. 2001, 35, 2979–2987. [Google Scholar] [CrossRef]
  25. Kim, M.J.; Park, R.J.; Kim, J.-J. Urban air quality modeling with full O3–NOx–VOC chemistry: Implications for O3 and PM air quality in a street canyon. Atmos. Environ. 2012, 47, 330–340. [Google Scholar] [CrossRef]
  26. Kim, J.-J.; Baik, J.-J. A numerical study of the effects of ambient wind direction on flow and dispersion in urban street canyons using the RNG k–ε turbulence model. Atmos. Environ. 2004, 38, 3039–3048. [Google Scholar] [CrossRef]
  27. Park, S.-J.; Kim, J.-J.; Kim, M.J.; Park, R.J.; Cheong, H.-B. Characteristics of flow and reactive pollutant dispersion in urban street canyons. Atmos. Environ. 2015, 108, 20–31. [Google Scholar] [CrossRef]
  28. Kim, M.J.; Park, R.J.; Kim, J.-J.; Park, S.H.; Chang, L.-S.; Lee, D.-G.; Choi, J.-Y. A computational fluid dynamics simulation of reactive fine particulate matter in street canyons. Atmos. Environ. 2019, 209, 54–66. [Google Scholar] [CrossRef]
  29. Bey, I.; Jacob, D.J.; Yantosca, R.M.; Logan, J.A.; Field, B.D.; Fiore, A.M.; Li, Q.; Liu, H.Y.; Mickley, L.J.; Schultz, M.G. Global modeling of tropospheric chemistry with assimilated meteorology: Model description and evaluation. J. Geophys. Res. Atmos. 2001, 106, 23073–23095. [Google Scholar] [CrossRef] [Green Version]
  30. Wang, Y.; Zhang, Q.; Jiang, J.; Zhou, W.; Wang, B.; He, K.; Duan, F.; Zhang, Q.; Philip, S.; Xie, Y. Enhanced sulfate formation during China’s severe winter haze episode in January 2013 missing from current models. J. Geophys. Res. Atmos. 2014, 119, 10–425. [Google Scholar] [CrossRef]
  31. Yang, Y.; Liao, H.; Lou, S. Increase in winter haze over eastern China in recent decades: Roles of variations in meteorological parameters and anthropogenic emissions. J. Geophys. Res. Atmos. 2016, 121, 13050–13065. [Google Scholar] [CrossRef]
  32. Neu, J.L.; Prather, M.J.; Penner, J.E. Global atmospheric chemistry: Integrating over fractional cloud cover. J. Geophys. Res. Atmos. 2007, 112. [Google Scholar] [CrossRef] [Green Version]
  33. Wild, O.; Zhu, X.; Prather, M.J. Fast-J: Accurate simulation of in-and below-cloud photolysis in tropospheric chemical models. J. Atmos. Chem. 2000, 37, 245–282. [Google Scholar] [CrossRef]
  34. Park, R.J.; Jacob, D.J.; Field, B.D.; Yantosca, R.M.; Chin, M. Natural and transboundary pollution influences on sulfate-nitrate-ammonium aerosols in the United States: Implications for policy. J. Geophys. Res. Atmos. 2004, 109. [Google Scholar] [CrossRef] [Green Version]
  35. Park, R.J.; Jacob, D.J.; Chin, M.; Martin, R.V. Sources of carbonaceous aerosols over the United States and implications for natural visibility. J. Geophys. Res. Atmos. 2003, 108. [Google Scholar] [CrossRef] [Green Version]
  36. Fountoukis, C.; Nenes, A. ISORROPIA II: A computationally efficient thermodynamic equilibrium model for K+–Ca2+–Mg2+–NH4+–Na+–SO42–NO3–Cl–H2O aerosols. Atmos. Chem. Phys. 2007, 7, 4639–4659. [Google Scholar] [CrossRef]
  37. Nenes, A.; Pandis, S.N.; Pilinis, C. ISORROPIA: A new thermodynamic equilibrium model for multiphase multicomponent inorganic aerosols. Aquat. Geochem. 1998, 4, 123–152. [Google Scholar] [CrossRef]
  38. Jacob, D.J. Heterogeneous chemistry and tropospheric ozone. Atmos. Environ. 2000, 34, 2131–2159. [Google Scholar] [CrossRef]
  39. Zhang, L.; Jacob, D.J.; Knipping, E.M.; Kumar, N.; Munger, J.W.; Carouge, C.C.; Van Donkelaar, A.; Wang, Y.X.; Chen, D. Nitrogen deposition to the United States: Distribution, sources, and processes. Atmos. Chem. Phys. 2012, 12, 4539–4554. [Google Scholar] [CrossRef]
  40. Walker, J.M.; Philip, S.; Martin, R.V.; Seinfeld, J.H. Simulation of nitrate, sulfate, and ammonium aerosols over the United States. Atmos. Chem. Phys. 2012, 12, 11213–11227. [Google Scholar] [CrossRef] [Green Version]
  41. Cooke, W.F.; Liousse, C.; Cachier, H.; Feichter, J. Construction of a 1 × 1 fossil fuel emission data set for carbonaceous aerosol and implementation and radiative impact in the ECHAM4 model. J. Geophys. Res. Atmos. 1999, 104, 22137–22162. [Google Scholar] [CrossRef]
  42. Wesely, M.L. Parameterization of surface resistances to gaseous dry deposition in regional-scale numerical models. Atmos. Environ. (1967) 1989, 23, 1293–1304. [Google Scholar] [CrossRef]
  43. Lee, D.-G.; Lee, Y.-M.; Jang, K.-W.; Yoo, C.; Kang, K.-H.; Lee, J.-H.; Jung, S.-W.; Park, J.-M.; Lee, S.-B.; Han, J.-S. Korean national emissions inventory system and 2007 air pollutant emissions. Asian J. Atmos. Environ. 2011, 5, 278–291. [Google Scholar] [CrossRef]
  44. Carslaw, D.C.; Beevers, S.D. Estimations of road vehicle primary NO2 exhaust emission fractions using monitoring data in London. Atmos. Environ. 2005, 39, 167–177. [Google Scholar] [CrossRef]
  45. Amon, B.; Hutchings, N.; Dämmgen, U.; Webb, J. EMEP/EEA Air Pollutant Emission Inventory Guidebook—2016; European Environment Agency: Copenhagen, Denmark, 2016. [Google Scholar]
  46. Heo, J.-B.; Hopke, P.K.; Yi, S.-M. Source apportionment of PM 2.5 in Seoul, Korea. Atmos. Chem. Phys. 2009, 9, 4957–4971. [Google Scholar] [CrossRef]
  47. Shin, H.J.; Roh, S.A.; Kim, J.C.; Lee, S.J.; Kim, Y.P. Temporal variation of volatile organic compounds and their major emission sources in Seoul, Korea. Environ. Sci. Pollut. Res. 2013, 20, 8717–8728. [Google Scholar] [CrossRef]
  48. Shon, Z.-H.; Kim, K.-H.; Song, S.-K.; Jung, K.; Kim, N.-J.; Lee, J.-B. Relationship between water-soluble ions in PM2.5 and their precursor gases in Seoul megacity. Atmos. Environ. 2012, 59, 540–550. [Google Scholar] [CrossRef]
  49. Kim, Y.; Guldmann, J.-M. Impact of traffic flows and wind directions on air pollution concentrations in Seoul, Korea. Atmos. Environ. 2011, 45, 2803–2810. [Google Scholar] [CrossRef]
  50. Inness, A.; Baier, F.; Benedetti, A.; Bouarar, I.; Chabrillat, S.; Clark, H.; Clerbaux, C.; Coheur, P.; Engelen, R.J.; Errera, Q. The MACC reanalysis: An 8 yr data set of atmospheric composition. Atmos. Chem. Phys. 2013, 13, 4073–4109. [Google Scholar] [CrossRef]
  51. Huang, M.; Carmichael, G.R.; Pierce, R.B.; Jo, D.S.; Park, R.J.; Flemming, J.; Emmons, L.K.; Bowman, K.W.; Henze, D.K.; Davila, Y. Impact of intercontinental pollution transport on North American ozone air pollution: An HTAP phase 2 multi-model study. Atmos. Chem. Phys. 2017, 17, 5721–5750. [Google Scholar] [CrossRef]
  52. Kim, J.-J.; Baik, J.-J. Effects of street-bottom and building-roof heating on flow in three-dimensional street canyons. Adv. Atmos. Sci. 2010, 27, 513–527. [Google Scholar] [CrossRef]
  53. Baker, J.; Walker, H.L.; Cai, X. A study of the dispersion and transport of reactive pollutants in and above street canyons—A large eddy simulation. Atmos. Environ. 2004, 38, 6883–6892. [Google Scholar] [CrossRef]
  54. Yubero, E.; Galindo, N.; Nicolás, J.F.; Crespo, J.; Calzolai, G.; Lucarelli, F. Temporal variations of PM1 major components in an urban street canyon. Environ. Sci. Pollut. Res. 2015, 22, 13328–13335. [Google Scholar] [CrossRef] [PubMed]
  55. Lu, Z.; Streets, D.G.; Zhang, Q.; Wang, S.; Carmichael, G.R.; Cheng, Y.F.; Wei, C.; Chin, M.; Diehl, T.; Tan, Q. Sulfur dioxide emissions in China and sulfur trends in East Asia since 2000. Atmos. Chem. Phys. 2010, 10, 6311–6331. [Google Scholar] [CrossRef] [Green Version]
  56. WHO. Review of Evidence on Health Aspects of Air Pollution–REVIHAAP Project. Available online: https://scholar.google.com/scholar_lookup?title=Review%20of%20evidence%20on%20health%20aspects%20of%20air%20pollution%20%E2%80%94%20REVIHAAP%20project%20technical%20report&publication_year=2013&author=WHOhttps://scholar.google.co.kr (accessed on 2 February 2019).
  57. Nguyen, K.; Dabdub, D. NOx and VOC control and its effects on the formation of aerosols. Aerosol Sci. Technol. 2002, 36, 560–572. [Google Scholar] [CrossRef]
  58. Jin, X.; Fiore, A.M.; Murray, L.T.; Valin, L.C.; Lamsal, L.N.; Duncan, B.; Folkert Boersma, K.; De Smedt, I.; Abad, G.G.; Chance, K. Evaluating a Space-Based Indicator of Surface Ozone-NOx-VOC Sensitivity Over Midlatitude Source Regions and Application to Decadal Trends. J. Geophys. Res. Atmos. 2017, 122. [Google Scholar]
  59. Li, K.; Jacob, D.J.; Liao, H.; Shen, L.; Zhang, Q.; Bates, K.H. Anthropogenic drivers of 2013–2017 trends in summer surface ozone in China. Proc. Natl. Acad. Sci. USA 2019, 116, 422–427. [Google Scholar] [CrossRef]
  60. Chang, W.; Zhan, J.; Zhang, Y.; Li, Z.; Xing, J.; Li, J. Emission-driven changes in anthropogenic aerosol concentrations in China during 1970–2010 and its implications for PM2.5 control policy. Atmos. Res. 2018, 212, 106–119. [Google Scholar] [CrossRef]
  61. Chen, Y.; Cheng, Y.; Ma, N.; Wolke, R.; Nordmann, S.; Schüttauf, S.; Ran, L.; Wehner, B.; Birmili, W.; Gon, H.A. Sea salt emission, transport and influence on size-segregated nitrate simulation: A case study in northwestern Europe by WRF-Chem. Atmos. Chem. Phys. 2016, 16, 12081–12097. [Google Scholar] [CrossRef]
  62. Kim, M.-S.; Kim, J.H.; Park, H.-S.; Sun, Y.S.; Kim, H.-S.; Choi, K.H.; Yi, J. Emission inventory of VOCs from mobile sources in a metropolitan region. Korean J. Chem. Eng. 2006, 23, 919–924. [Google Scholar] [CrossRef]
Figure 1. Schematic diagram of the coupled computational fluid dynamics (CFD)–chemistry simulation domain for the control run (CNTL) simulation.
Atmosphere 10 00212 g001
Figure 2. Comparisons of nitrate concentrations in the spring, summer, autumn, and winter cases between this work and the previous results of Yubero et al. (2015) (see Figure 1 in Yubero et al.). The values are averaged for the analysis period at the sample station. The black solid line is the observed concentrations and the red dashed line is the simulated concentrations. The error bars indicate the standard deviations of the observed nitrate aerosol in each season.
Atmosphere 10 00212 g002
Figure 3. Distributions of the daily average concentrations of (a) NOx, (b) HNO3, (c) O3, and (d) NH3 (ppbv) in the CNTL simulation.
Atmosphere 10 00212 g003
Figure 4. Distribution of the daily average concentrations of (a) nitrate and (b) ammonium (µg m−3) in the CNTL simulation.
Atmosphere 10 00212 g004
Figure 5. Average (a) nitrate, (b) HNO3, (c) NO2, and (d) O3 concentrations in the street canyon (i.e., below 20 m) following a change in the emission rate of vehicular NOx.
Atmosphere 10 00212 g005
Figure 6. Average (a) nitrate, (b) HNO3, (c) NO2, and (d) O3 concentrations in the street canyon (i.e., below 20 m) following changes in the emission rate of vehicular VOC.
Atmosphere 10 00212 g006
Figure 7. Average (a) nitrate and (b) HNO3 concentrations in the street canyon (i.e., below 20 m) following a change in the emission rate of vehicular NH3.
Atmosphere 10 00212 g007
Figure 8. Schematic diagrams of the coupled sensitivity simulation domain for the canyon aspect ratios (a) 0.5 and (b) 2.0.
Atmosphere 10 00212 g008
Figure 9. Distribution of the daily average concentrations of (a) NOx, (b) HNO3, (c) O3 (ppbv), and (d) nitrate aerosol (µg m−3) in the CNTL_A0.5 simulation.
Atmosphere 10 00212 g009
Figure 10. Distribution of the daily average concentrations of (a) NOx, (b) HNO3, (c) O3 (ppbv), and (d) nitrate aerosol (µg m−3) in the CNTL_A2.0 simulation.
Atmosphere 10 00212 g010
Figure 11. The average nitrate concentration in the street canyon following changes in the emission rate of vehicular (a) NOx, (b) VOC, and (c) NH3 for the 0.5 canyon aspect ratio; units are µg m−3.
Atmosphere 10 00212 g011
Figure 12. The same as Figure 11 but for the 2.0 canyon aspect ratio; units are µg m−3.
Atmosphere 10 00212 g012
Figure 13. Average nitrate concentration in the street canyon following changes in the emission rate of vehicular (a) NOx and (b) VOC with the speciation method of VOC emission used by Kim et al. (2006); units are µg m−3.
Atmosphere 10 00212 g013
Table 1. Emission estimates from vehicles used in the coupled CFD–chemistry model simulations for the CNTL simulation. The text discusses details about the species emission estimates.
[g km−1]CONOxVOCNH3
PC (diesel)0.0100.0410.0060.002
PC (gasoline)0.0850.0040.0020.023
PC (gas)0.1040.0020.0010.001
LDV (diesel)0.0870.0630.0090.002
LDV (gas)0.1630.0260.0020.002
HDV (diesel)0.5430.9590.1040.002
HDV (gas)0.4570.0450.0090.003
Bus (diesel)1.8500.6130.1500.002
Bus (gas)1.7360.3460.1910.000
Table 2. Ratios of vehicles following size and fuel type used in the CNTL simulation obtained from the Traffic Monitoring System.
[%]Passenger CarsLight-Duty VehiclesHeavy-Duty VehiclesBus
Diesel20.617.67.32.2
Gasoline43.3---
Gas8.30.90.30.4
Total72.218.57.62.6
Table 3. Emission rates per vehicle and ratios of speciated volatile organic compound (VOC) following the method developed by EMEP/EEA (2016).
Tracer NameFormulaEmission Rate [mg km−1] Ratio [%]
ALK4≥C4 alkanes3.6024.0
ISOPCH2 = C(CH3)CH = CH2--
ACETCH3C(O)CH30.442.9
MEKRC(O)R0.181.2
ALD2CH3CHO0.986.5
RCHOCH3CH2CHO1.8912.6
MVKCH2 = CHC(=O)CH3--
MACRCH2 = C(CH3)CHO--
PRPE≥C3 alkenes2.5817.2
C3H8C3H80.020.1
CH2OHCHO1.8012.0
C2H6C2H60.050.3
Unspeciated--23.2
Table 4. Diurnal variations of the observed hourly surface temperature and relative humidity used in this model.
Hour010203040506070809101112
Temperature [K]−3.1−3.4−3.6−4.0−4.4−4.6−4.8−5.1−4.5−2.7−0.80.6
Relative Humidity [%]37.738.337.836.837.436.937.537.632.226.421.317.9
Hour131415161718192021222324
Temperature [K]1.42.22.72.61.60.3−0.5−1.2−1.7−2.1−2.4−2.8
Relative Humidity [%]16.514.413.714.018.021.626.030.232.634.534.735.8
Table 5. Emission rates per vehicle and ratios of speciated VOC obtained by following the method developed by Kim et al. (2006).
Tracer NameFormulaEmission Rate [mg km−1] Ratio [%]
ALK4≥C4 alkanes6.0340.2
ISOPCH2 = C(CH3)CH = CH2--
ACETCH3C(O)CH30.151.0
MEKRC(O)R0.00.0
ALD2CH3CHO0.080.5
RCHOCH3CH2CHO0.080.5
MVKCH2 = CHC(=O)CH3--
MACRCH2 = C(CH3)CHO--
PRPE≥C3 alkenes2.1014.0
C3H8C3H80.151.0
CH2OHCHO0.171.1
C2H6C2H60.271.8
Unspeciated--39.9

