Article

One-Year Characterization and Reactivity of Isoprene and Its Impact on Surface Ozone Formation at A Suburban Site in Guangzhou, China

Institute of Tropical and Marine Meteorology, China Meteorological Administration (CMA), 510000 Guangzhou, China
*
Author to whom correspondence should be addressed.
Atmosphere 2019, 10(4), 201; https://doi.org/10.3390/atmos10040201
Submission received: 22 March 2019 / Revised: 11 April 2019 / Accepted: 12 April 2019 / Published: 15 April 2019
(This article belongs to the Section Air Quality)

Abstract

:
Isoprene has a potentially large effect on ozone (O3) formation in the subtropical, highly polluted city of Guangzhou. Online measurements of isoprene in Guangzhou city are scarce; thus, isoprene levels were monitored for one year at the Guangzhou Panyu Atmospheric Composition Station (GPACS), a suburban site in Guangzhou, using an online gas chromatography-flame ionization detector (GC–FID) system to investigate the characterization and reactivity of isoprene and its effect on the O3 peak profile in different seasons. The results showed that the daily average mixing ratios of isoprene at GPACS were 0.40, 2.20, 1.40, and 0.13 mixing ratio by volume (ppbv) in spring, summer, autumn, and winter, respectively. These values were considerably higher than the mixing ratios of isoprene in the numerous other subtropical and temperate cities around the world. Furthermore, isoprene ranked first with regard to O3 formation potential (OFP) and propylene-equivalent mixing ratio among 56 measured non–methane hydrocarbons (NMHCs). The ratios of isoprene to cis-2-butene, an exhaust tracer, were determined to estimate the fractions of biogenic and anthropogenic emissions. The results revealed a much greater contribution from biogenic than anthropogenic factors during the daytime in all four seasons. In addition, night-time isoprene emissions were mostly associated with vehicles in winter, and the residual isoprene that remained after photochemical loss during the daytime also persisted into the night. The high levels of isoprene in summer and autumn may cause the strong and broad peaks of the O3 profile because of its association with the most favorable meteorological conditions (e.g., high temperature and intense solar radiation) and the highest OH mixing ratio, which could affect human health by exposing people to a high O3 mixing ratio for prolonged periods. The lower mixing ratios of isoprene resulted in a weak and sharp peak in the O3 profile in both spring and winter. The high level of isoprene in the subtropical zone could accentuate its large impact on atmospheric oxidant capacity and air quality in Guangzhou city.

HIGHLIGHTS
  • The characterization and reactivity of isoprene at a subtropical suburban site in Guangzhou were investigated.
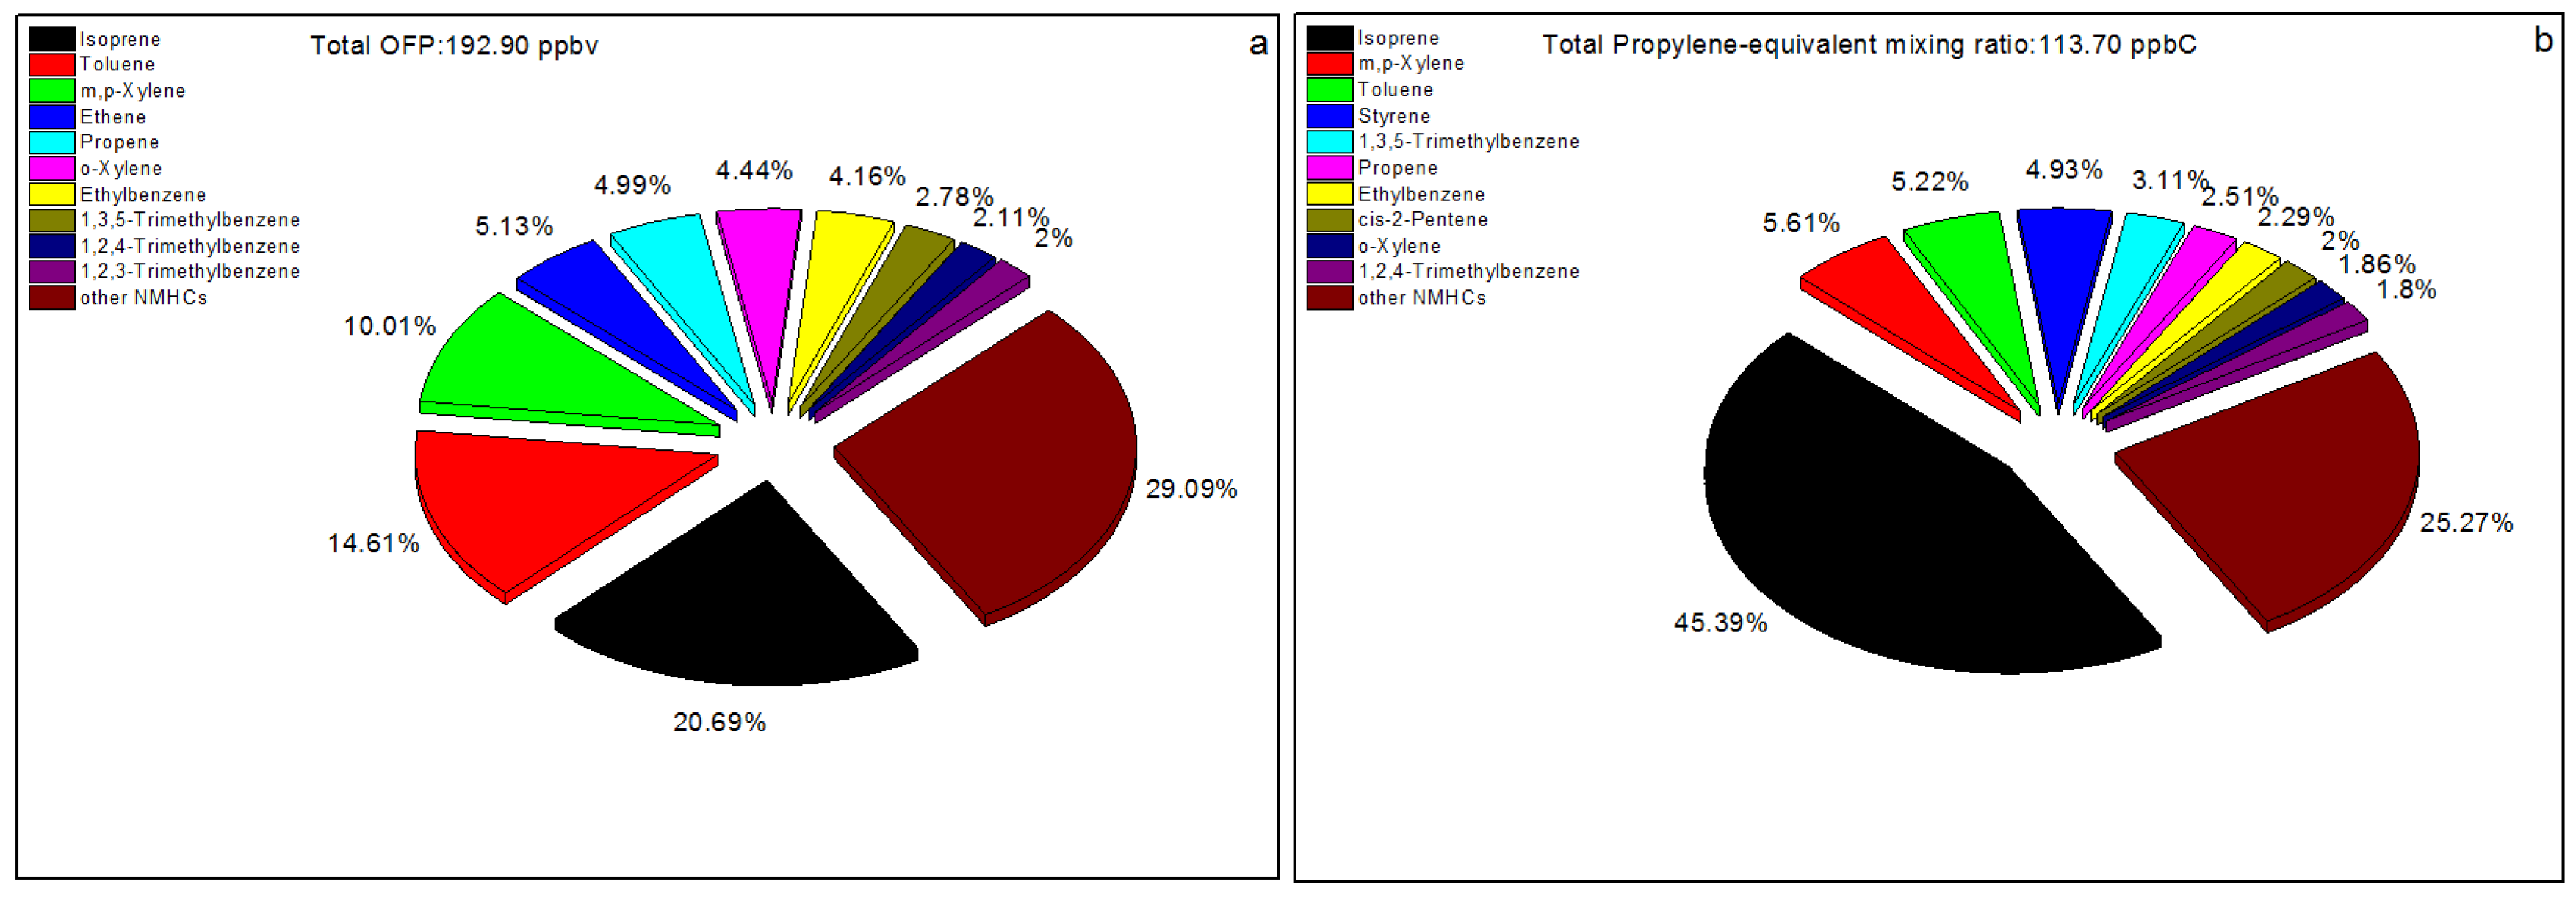
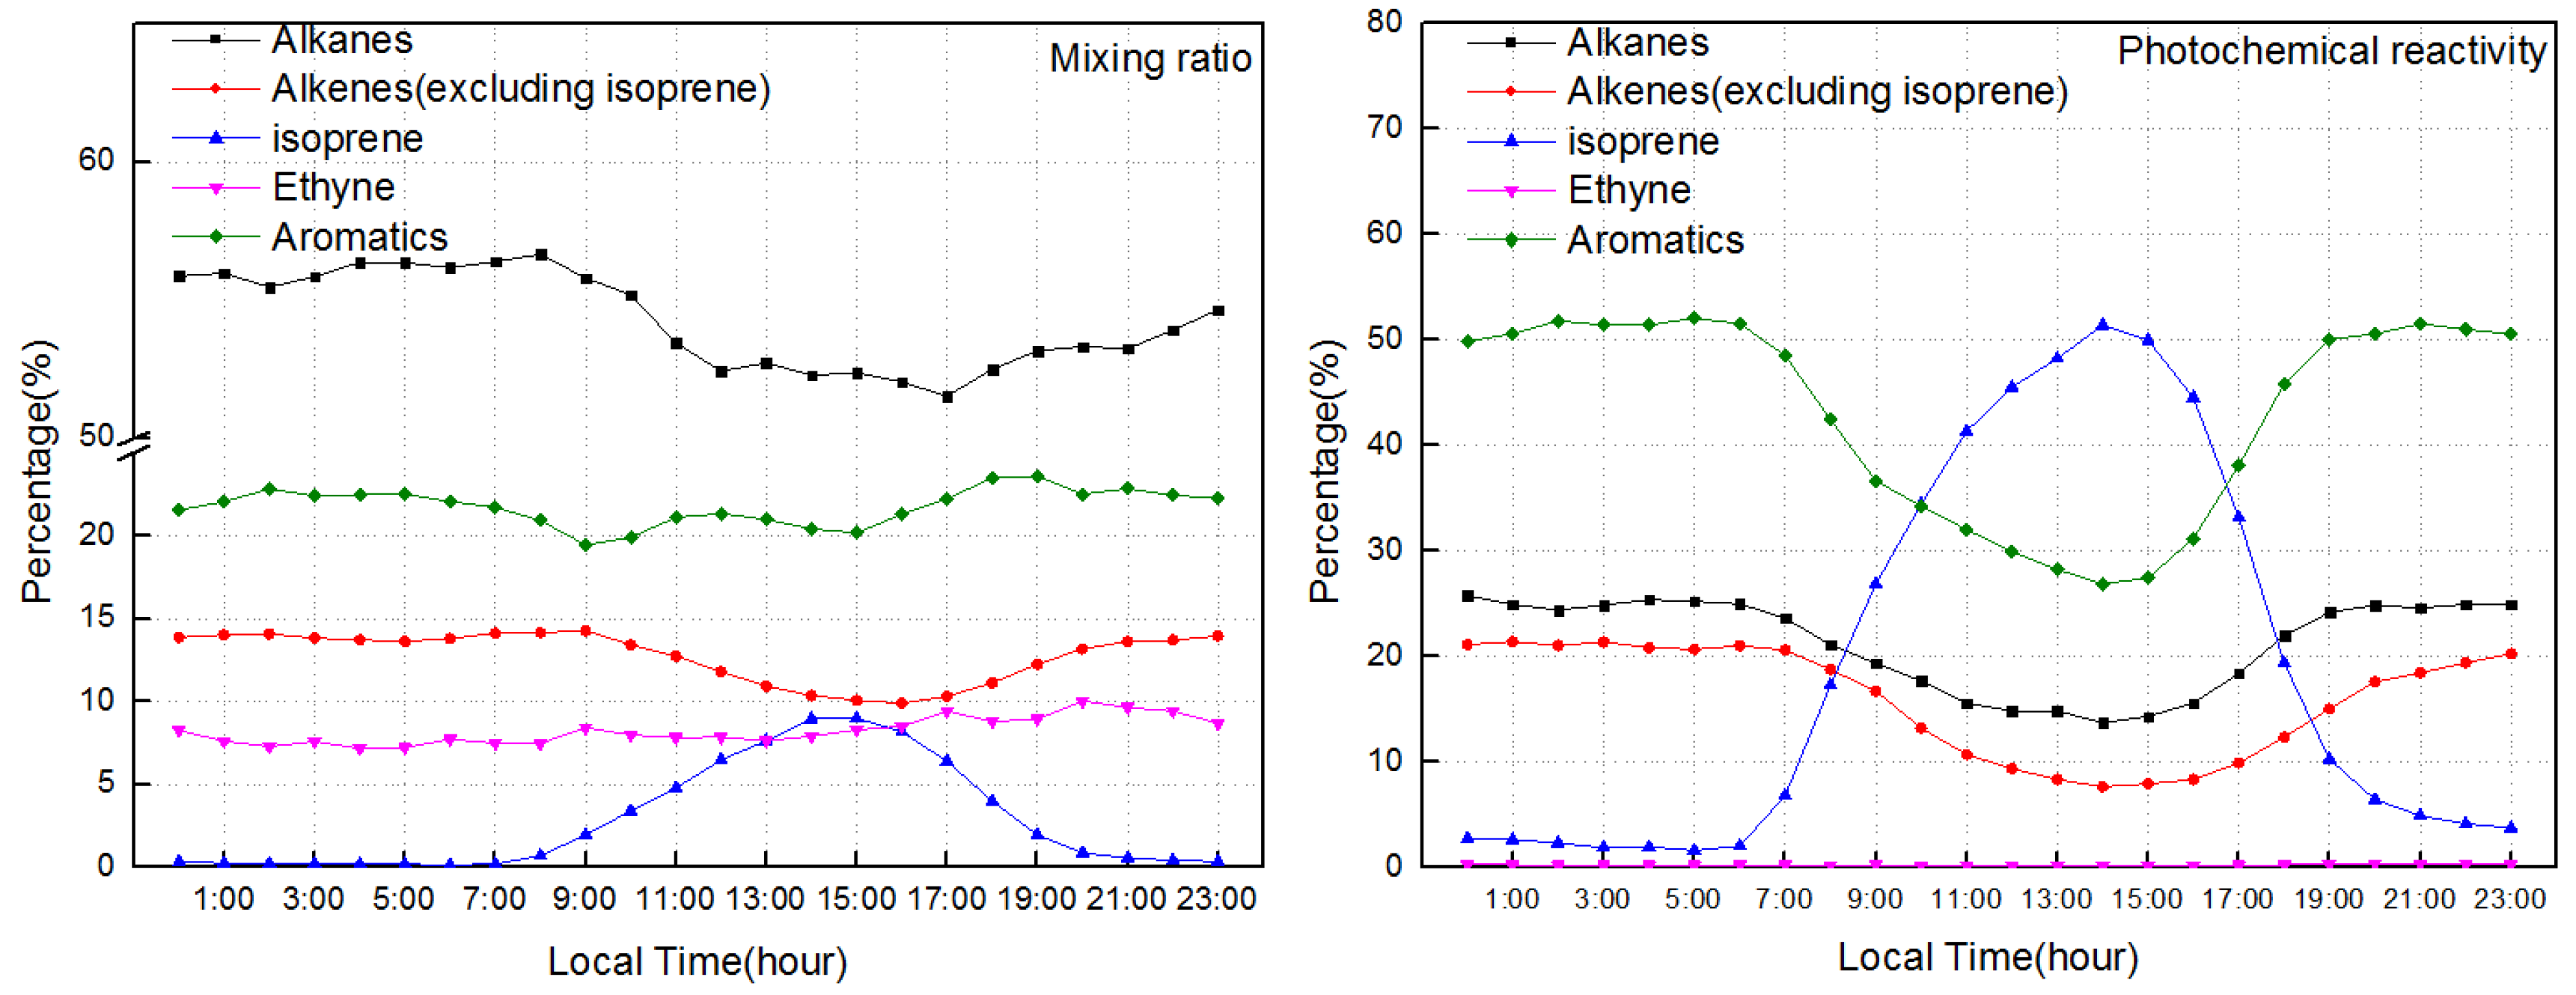
  • Isoprene ranked first for OFP and propylene-equivalent mixing ratio during the O3 formation period.
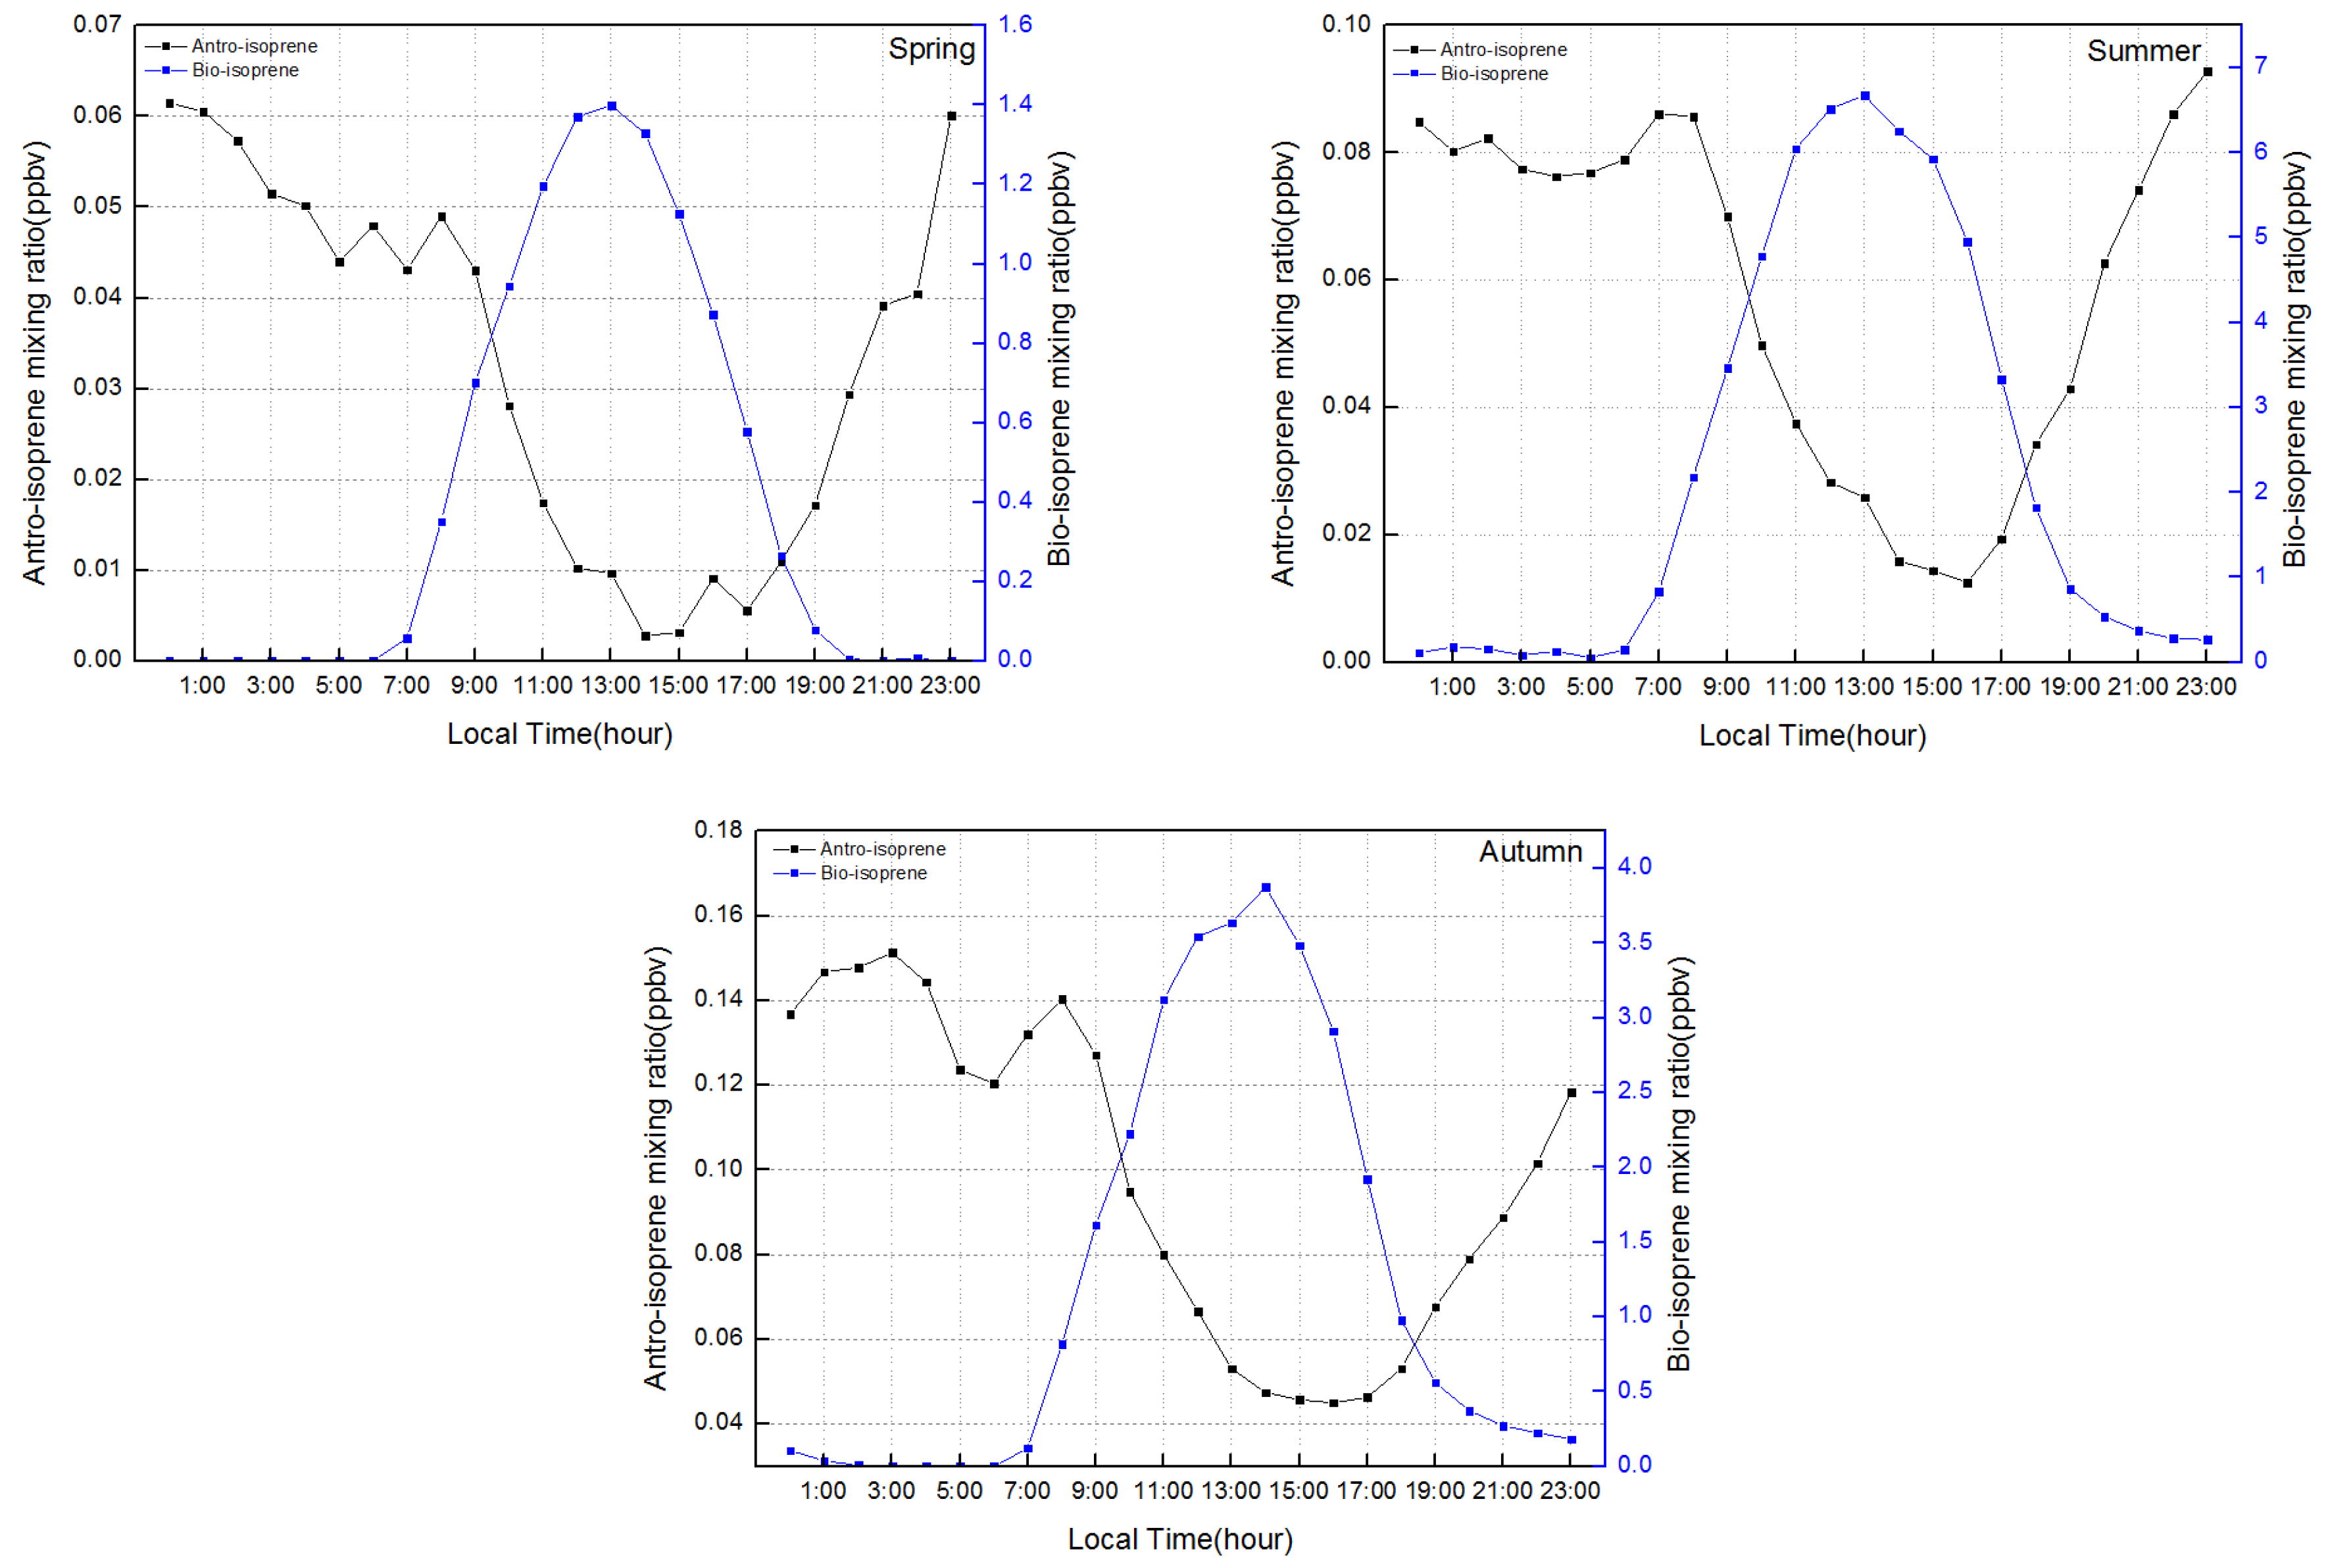
  • Daytime biogenic isoprene emissions dominated over anthropogenic isoprene emissions in all four seasons.
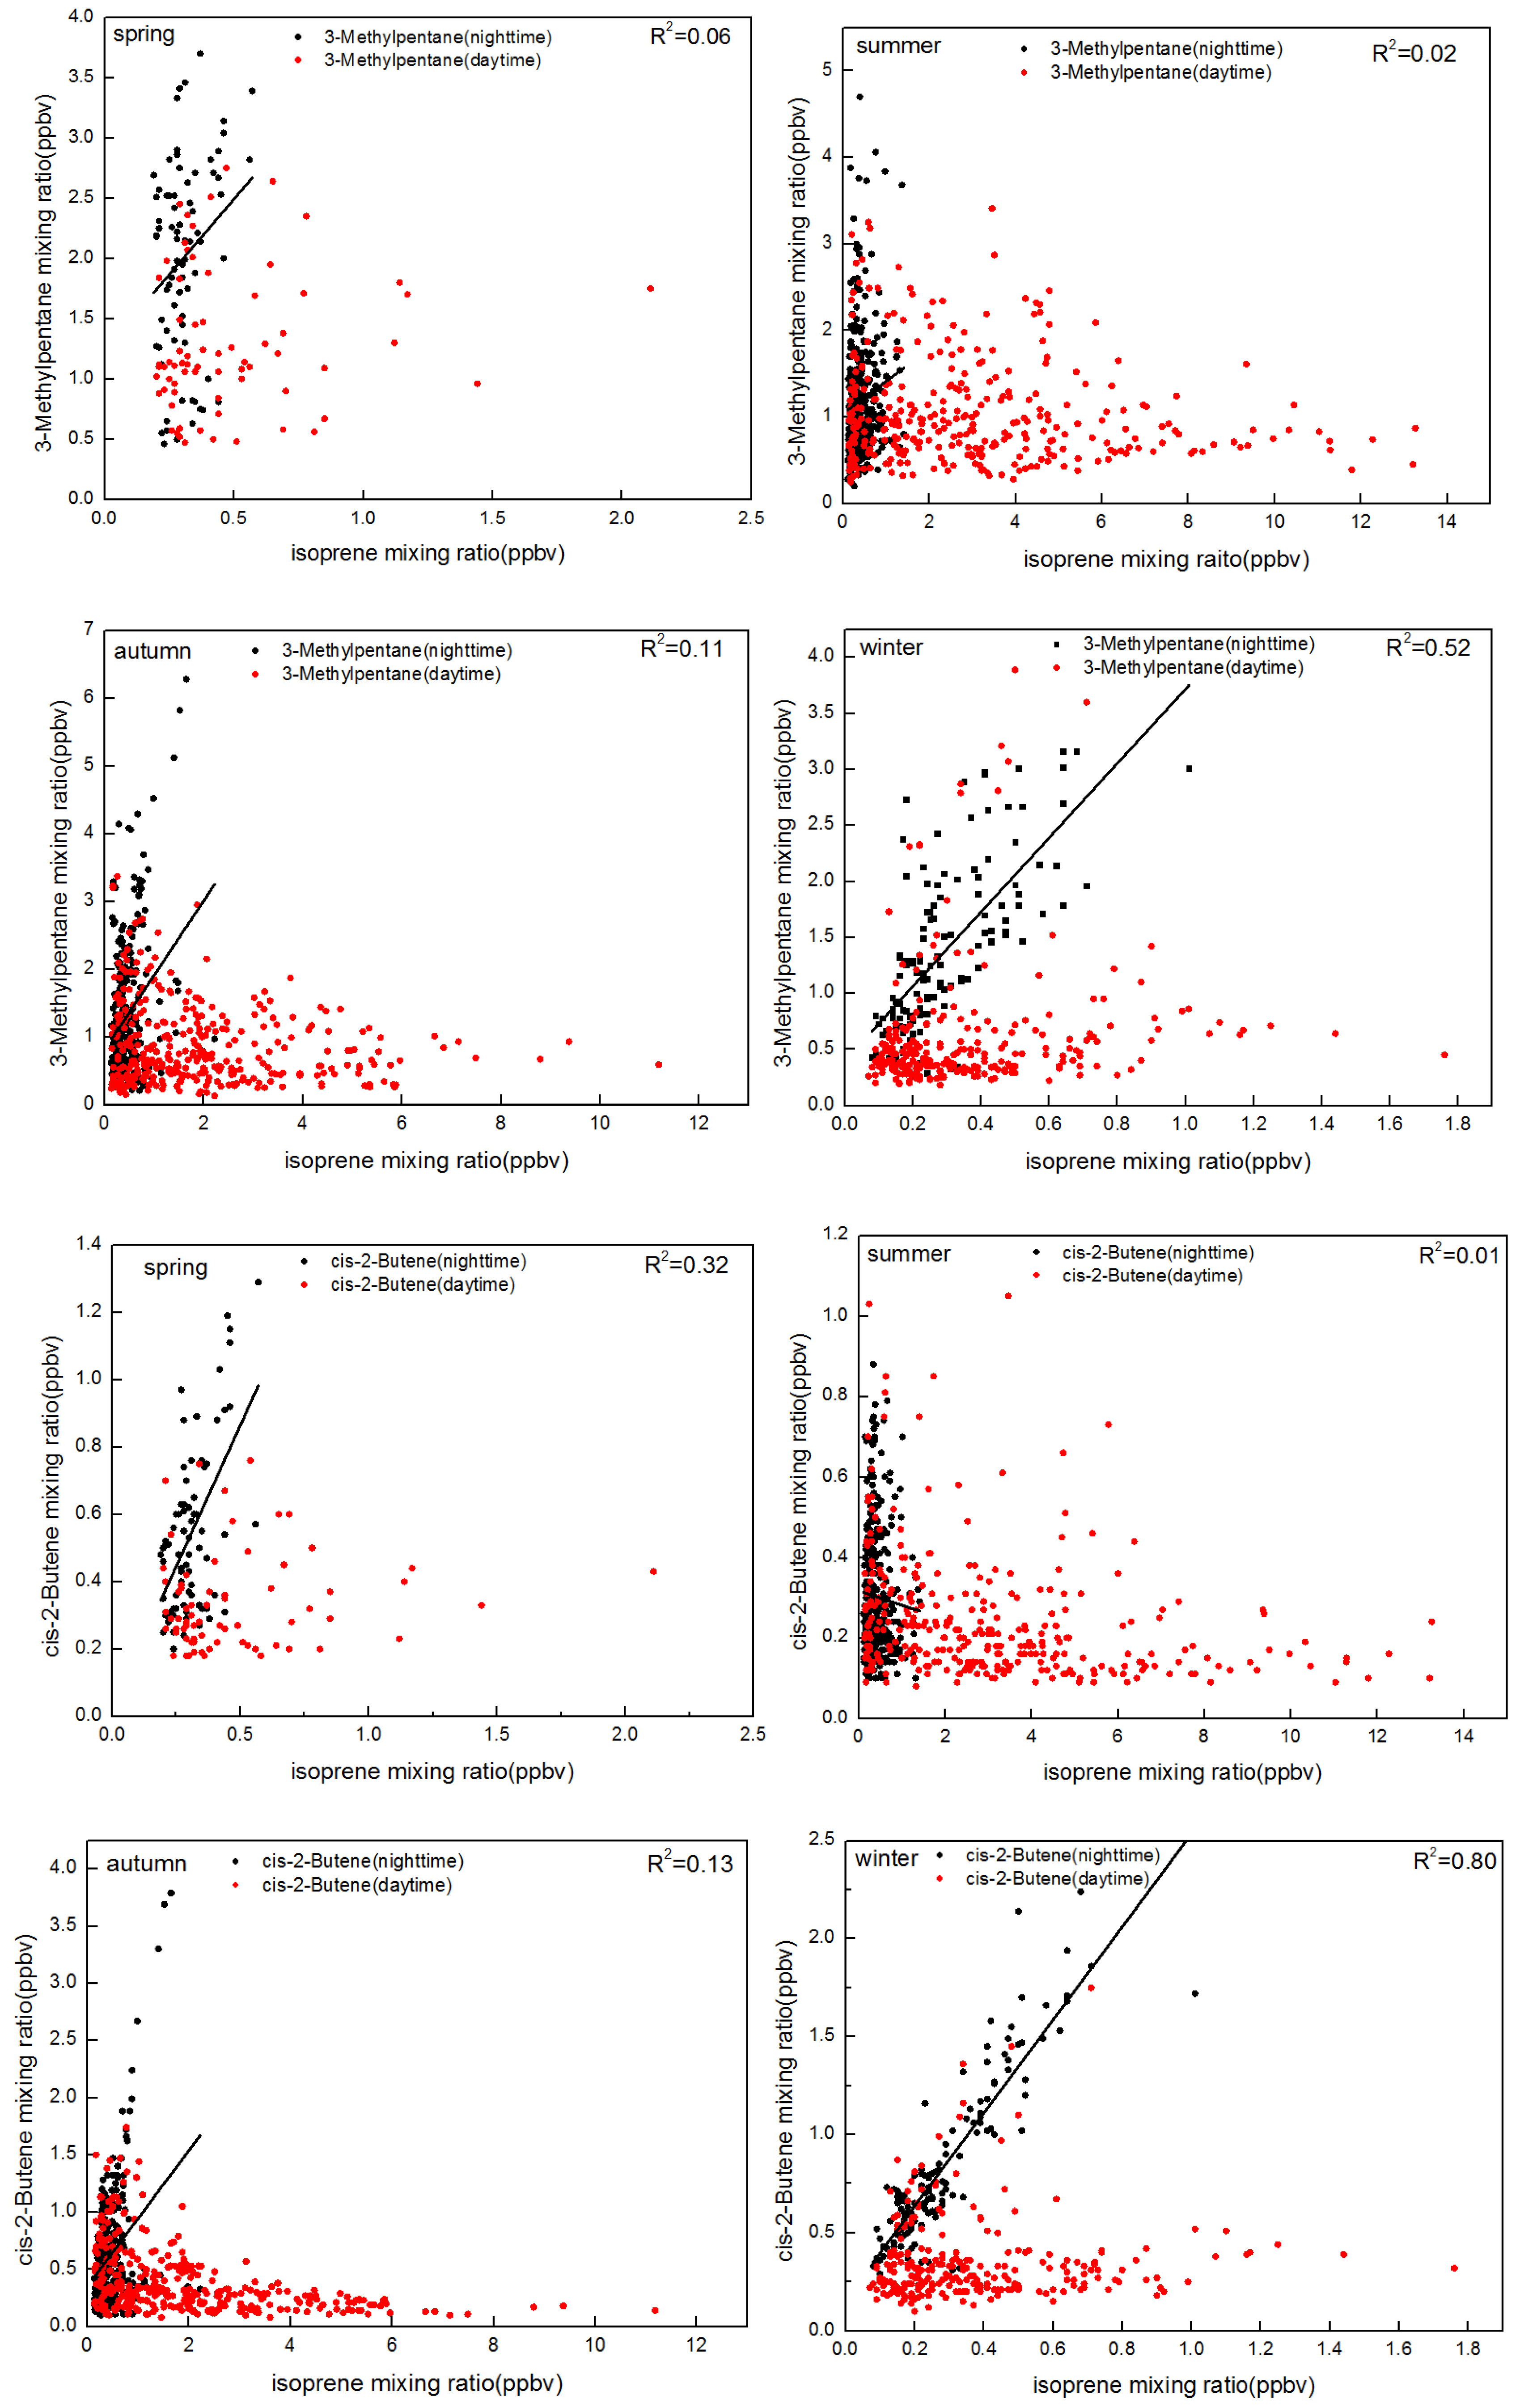
  • Vehicular emissions contributed approximately 71.6%, 30.5%, and 33.1% of night-time isoprene emissions in spring, summer, and autumn, respectively.
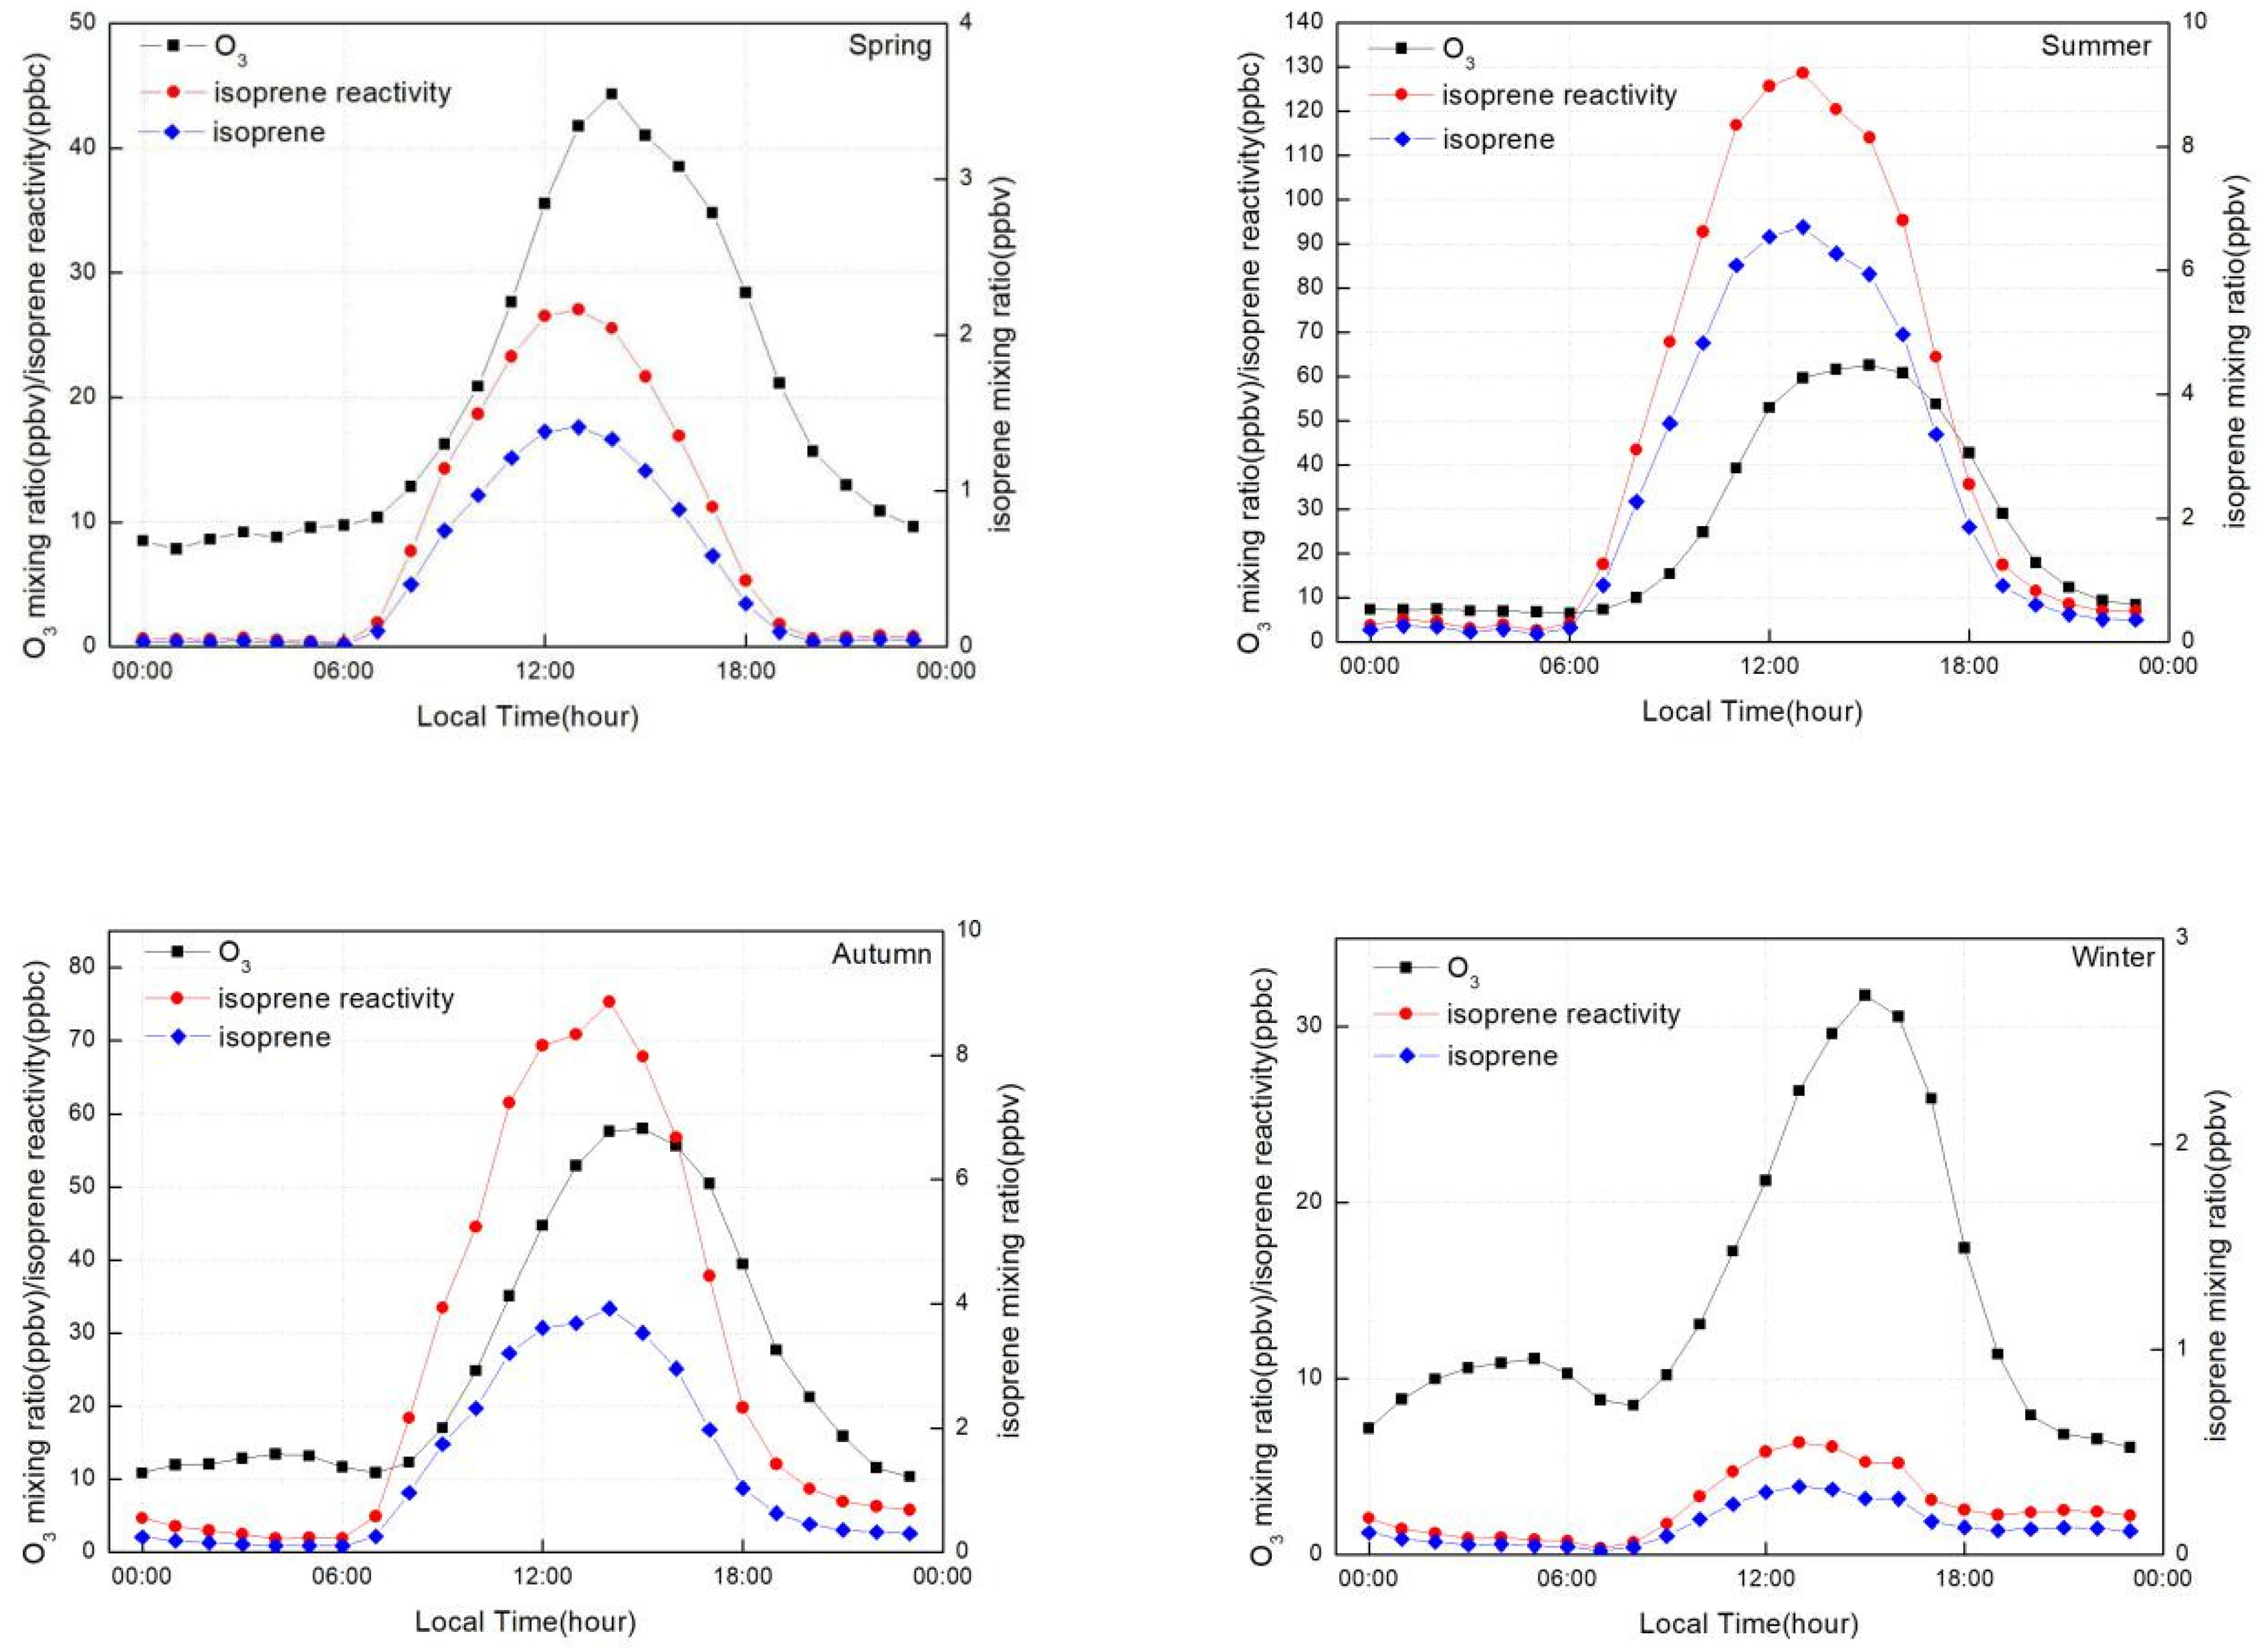
  • The high (low) levels of isoprene could shape the strong (weak) and broad (sharp) peaks in the O3 profile.

1. Introduction

As a consequence of rapid economic development and urbanization, high-mixing ratio ozone (O3) events occur frequently in Guangzhou, one of the most polluted megacities in China [1,2,3]. The Guangzhou Panyu Atmospheric Composition Station (GPACS) defines O3 exceedance as a daily maximum eight-hour average O3 mixing ratio of greater than 80 mixing ratio by volume (ppbv) that lasts for more than four hours [4]. Guangzhou City experienced 174 O3 exceedance days from 2010 to 2016 [3].
A series of strategies intended to improve air quality have been implemented in the PRD (Pearl River Delta) region. For example, the 12th Five-Year Plan (2011–2015) included a national campaign aimed at reducing NOx and SO2 emissions by 10% and 8%, respectively, based on 2010 emission levels. The joint governments of Guangdong Province and Hong Kong endorsed “The PRD Air Pollutant Emission Reduction Plan up to 2020”, which specifies that by 2020, emissions of SO2, NOx, and volatile organic compounds (VOCs) within mainland PRD should be reduced by 20–35%, 20–40%, and 15–25%, respectively, compared with those in 2010 [5,6]. The air pollution control measures successfully reduced the mixing ratios of O3 precursors (i.e., VOCs and NOx) in PRD. However, O3 was not mitigated in Guangzhou as expected [7]. A primary reason for this inconsistency was the reduced NO–O3 titration, which was a result of the reduction in NOx emissions. Wang et al. [8] also suggested that the regional sources and weather conditions significantly influenced and contributed to O3 levels. Another significant reason that cannot be ignored is the presence of biogenic VOCs (e.g., isoprene), as these were not the targets of the control measures. Some prior studies noted that a reduction in anthropogenic VOC emissions as an O3 reduction strategy would only lead to a slight decrease in O3 mixing ratio if biogenic VOCs were present in the atmosphere [9,10].
Isoprene has drawn attention because it has both a high reactivity and high O3-formation potential and, therefore, can contribute to quick and efficient O3 formation [11]. In contrast to the anthropogenic emissions, maximum isoprene emissions are reached around midday due to the high temperature and intense solar radiation, and therefore, occur during the time of day with the most favorable photochemical conditions [12]. As opposed to most other precursors of O3, which are almost exclusively from anthropogenic sources, a significant fraction of isoprene is biogenic in origin. In terms of global isoprene emission estimations, approximately 90% of the isoprene released into the atmosphere is produced by terrestrial plants [13]. Nevertheless, isoprene has both biogenic and anthropogenic sources in urban areas [14,15]. Accordingly, a previous study in a temperate urban area reported isoprene’s relatively strong anthropogenic contribution in winter [16].
Only a few measurements of the isoprene mixing ratio have been conducted in China’s megacities [4,17] and most of them used off-line measurement; little long-term continuous observational data is available for isoprene, which only serves to limit our understanding of its characteristics and its effect on O3 production in Guangzhou. In addition, as Guangzhou is located in a subtropical zone with high temperatures and high light flux, it provides ideal conditions for biogenic isoprene emissions, and high isoprene levels have a large effect on O3 formation. In crafting control strategies for the key precursors of O3 in Guangzhou, the investigation of isoprene is essential.
This study aims to provide a clearer understanding of the characteristics, sources, and role of isoprene in Guangzhou based on observational data taken over the period of one year, which could specifically help with developing new O3 control measures to improve the city’s air quality. In the present paper, we document general information about the sampling site and the data collection procedure (Section 2), as well as the overall characteristics of NMHCs (non–methane hydrocarbons) and their relative potential for O3 formation (Section 3.1). Biogenic and anthropogenic effects on isoprene are also presented, (Section 3.2) and finally, the effect of isoprene on the O3 peak profile is discussed (Section 3.3).

2. Methodology

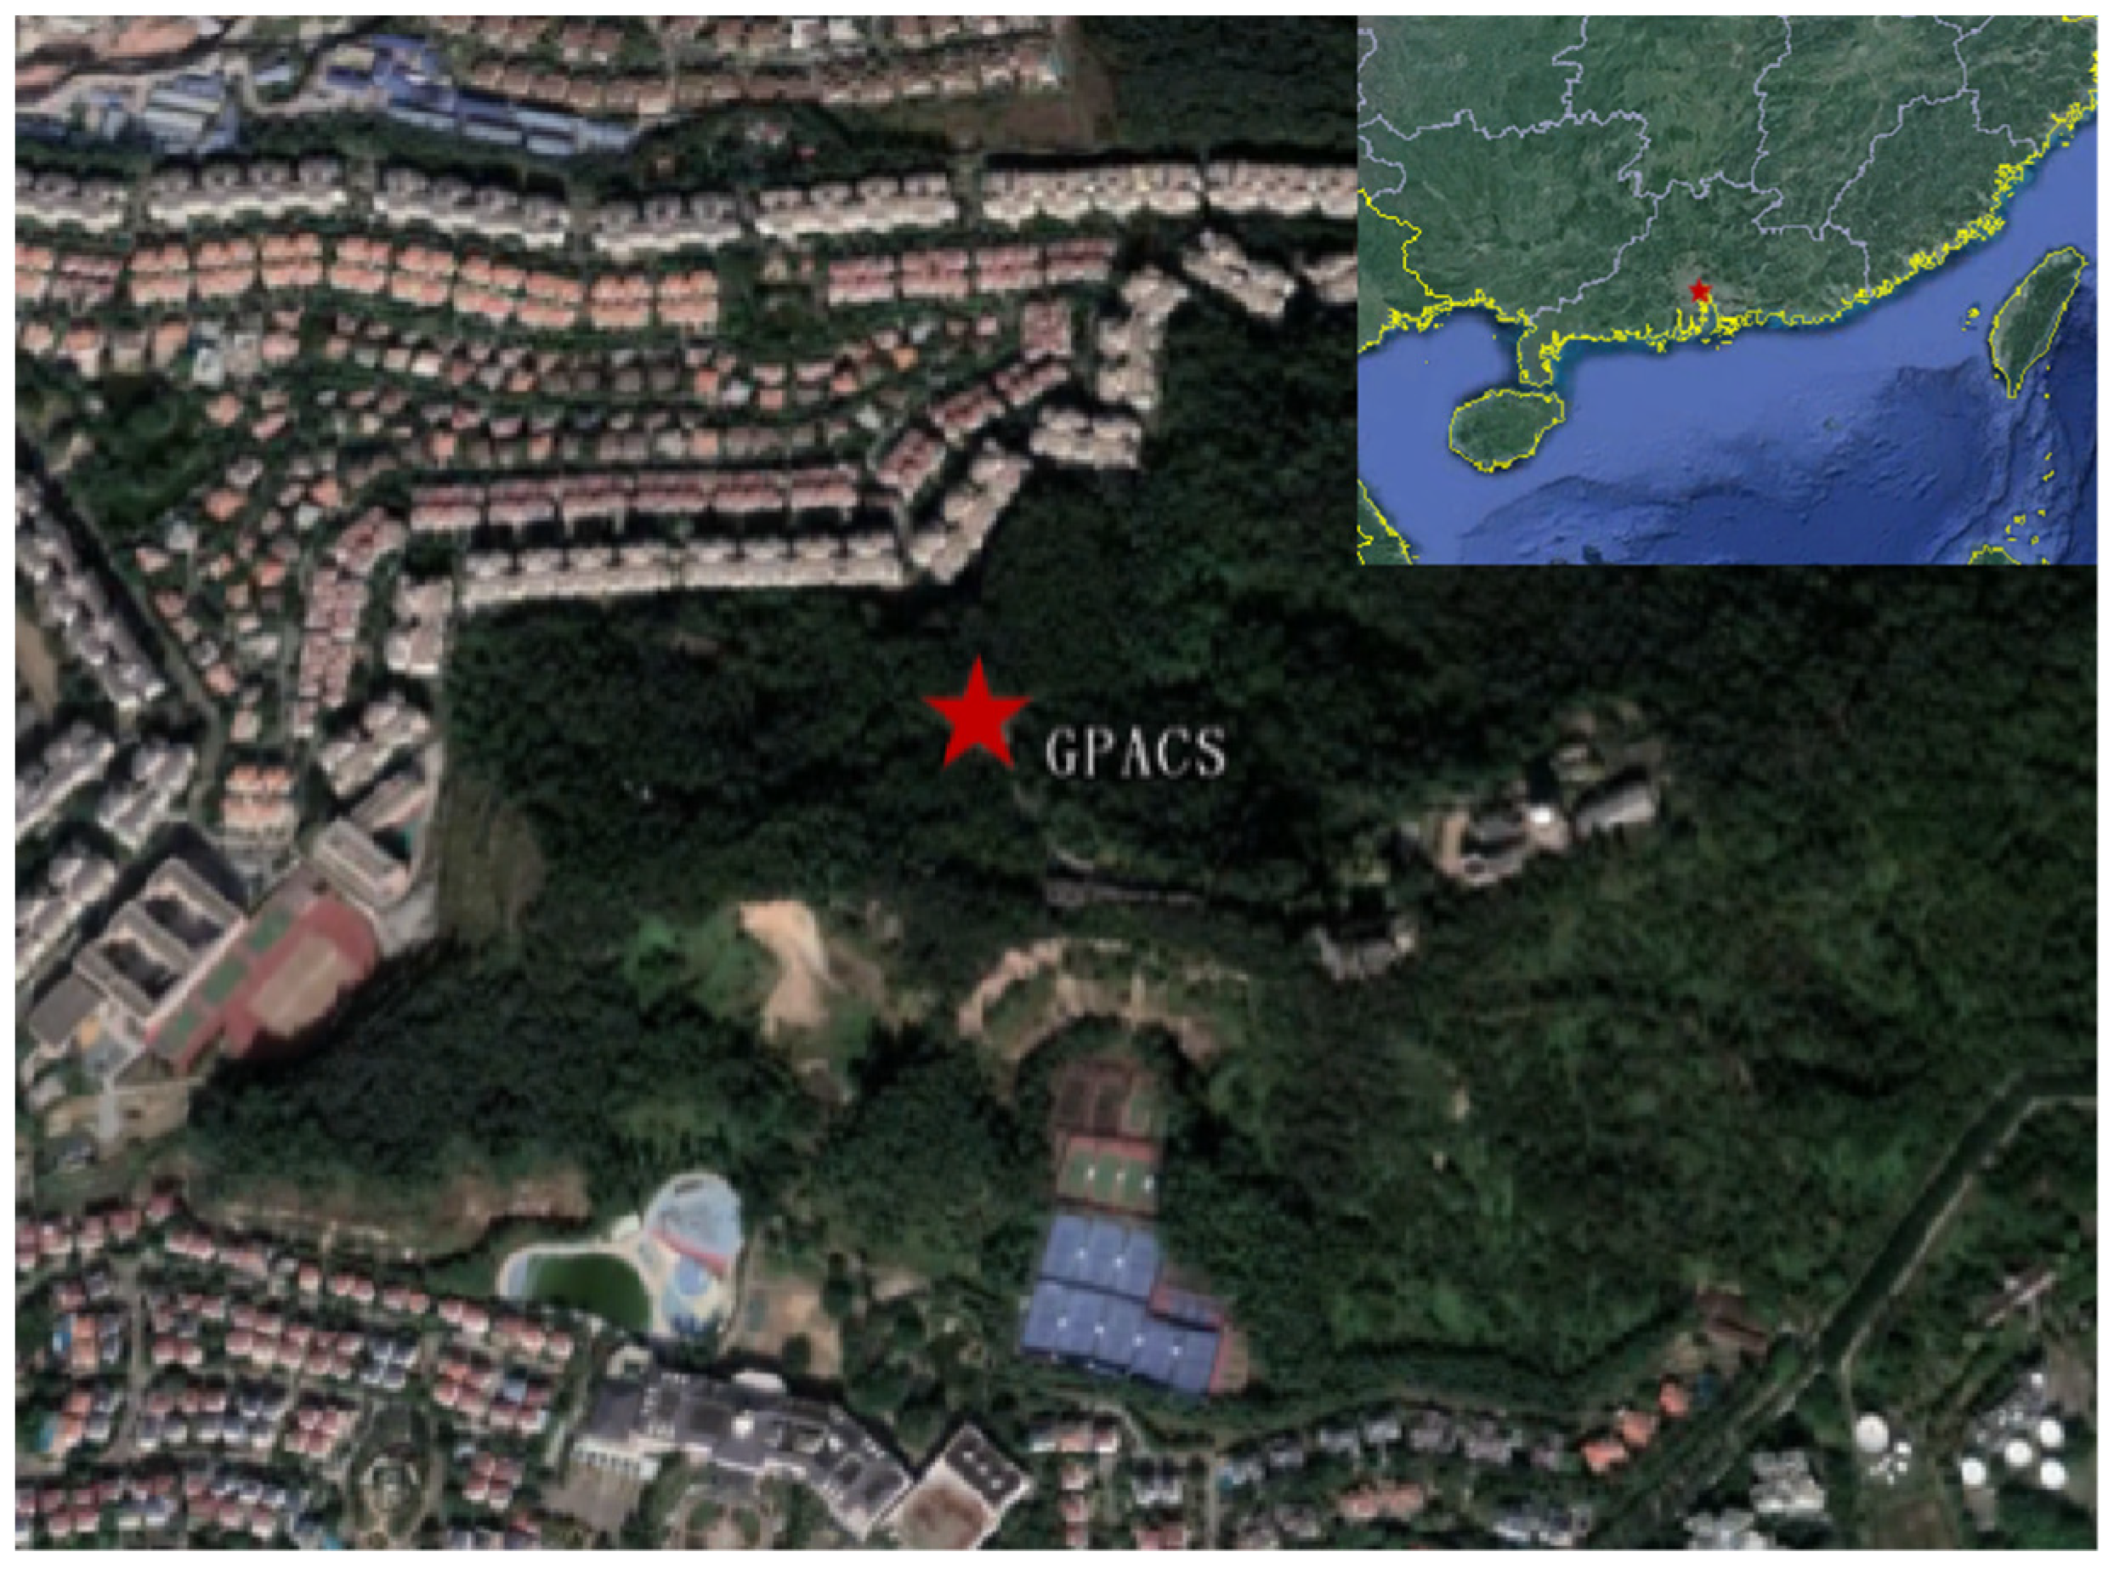
2.1. Site Description

From June 2011 to May 2012, NMHCs and O3 were measured simultaneously at the Guangzhou Panyu Atmospheric Composition Station (GPACS) operated by the Institute of Tropical and Marine Meteorology (ITMM) of China Meteorological Administration (CMA). The GPACS site (23°00′ N, 113°21′ E, 141 m) is within the boundary layer [18], which is located at the center of the PRD on the hilltop of Dazhengang, Nancun Town, Panyu District, Guangzhou, China (Figure 1). It is about 120 m above the city with surrounding trees and no significant industrial pollution sources nearby [3,19,20,21]. At the measurement site, the average temperature ranged from 14.2 °C in winter to 29.4 °C in summer, while the solar radiation ranged from 206.8 w/m2 in winter to 415.1 w/m2 in summer (Table 1). The relatively high temperature and high levels of solar radiation in this subtropical suburban site make it a good location to assess the importance of isoprene with regard to atmospheric photochemical pollution.

2.2. Instrumentation

Using a traditional offline sampling method, it is difficult to meet the requirements of isoprene detection due to the high atmospheric chemical reactivity of isoprene. In this study, isoprene was continuously monitored using the GC5000 analysis system coupled with flame ionization detectors (AMA, Germany). This system includes a low boiling point NMHC analyzer (GC5000VOC) for C2–C6 NMHC species and a high boiling point NMHC analyzer (GC5000BTX) for C6–C12 NMHC species. Isoprene was measured using the low boiling point NMHC analyzer, where air samples were enriched through a two-stage trap, and then thermally desorbed when the temperature increased to 200 °C, followed by separation with two-dimensional chromatography. The chromatographic columns consisted of an Al2O3/Na2SO4 PLOT column (60 m × 0.32 mm inner diameter × 5 μm thickness) and a CARBOWAX™ back-flushing column (30 m × 0.32 mm inner diameter × 0.25 μm thickness). The back-flushing column was first used to remove the moisture component and high-boiling NMHC species. Then, the PLOT column was followed to separate the low-boiling NMHC species. Quality assurance (QA)/quality control (QC) of online NMHCs measurements was performed. Zero and span gas checks (using Photochemical Assessment Monitoring Stations (PAMS) calibration gases including isoprene) were conducted monthly throughout the observation period. Five-level calibration curves were used to quantify the isoprene level during online monitoring. The correlation coefficient and detection limits of isoprene were 0.998 and 0.07 ppbv (Parts Per Billion by Volume), respectively. The outliers (about 8%), which were identified by the VOC data validation program recommended by US EPA PAMS (United States Environmental Protection Agency Photochemical Assessment Monitoring Stations) [22], were eliminated before data processing to guarantee the validity of the data. It should be noted that missing data (from 20 January 2012 to 20 March 2012) were caused due to instrument malfunction. The instrument and QA/QC have been described in detail elsewhere [20,23]. In addition, O3 was measured with an EC9810B O3 analyzer (Ecotech Co., Australia) based on the UV-absorption method and the Beer–Lambert law. QA/QC was performed every month, including inspection of the instruments, as well as zero, precision, and span checks. The filter was replaced once every two weeks and calibration was carried out every month. The O3 mixing ratio was recorded every five minutes in instrument. For convenience of analysis, the O3 data was processed one h into the study.

2.3. Data Analysis

2.3.1. The Effect of NMHCs on O3 Formation

NMHCs exhibit a wide range of reactivities, and two common and useful scales have been proposed for quick and convenient evaluation of the O3 formation potential (OFP) or the NMHCs relative reactivities. The maximum incremental reactivity (MIR) scale is used to estimate the potential of individual NMHCs to contribute to O3 formation using the mechanism reactivity. The OFP, which represents the maximum ozone mixing ratio generated by this species based on estimated MIR, was calculated by the equation below:
OFP ( j ) = MIR ( j ) × C ( j ) × m ( j ) M
where C(j) represents the actual mixing ratio by volume (ppbv) for species j, M represents the molecular mass of O3, and m(j) represents the relative molecular mass of species j in the NMHCs. The MIR(j) was estimated by selecting the specific MIR value for each of the NMHCs from published studies, which were conducted based on modeled scenarios for Los Angeles in the 1980s [11,24].
The OH-reactivity scale is a means of determining the reactivity of NMHCs with OH radicals using kinetic reactivity. Although the initial reactivity of NMHCs with OH in the OH-reactivity scale does not directly reflect the OFP, it indicates the potential for subsequent product formation after reaction with OH. In order to normalize kOH for NMHCs, in this study, the propylene-equivalent mixing ratio was calculated using the equation below:
Prop-Equiv ( j ) = C ( j ) × k O H ( j ) k O H ( C 3 H 6 )
where j represents a NMHC species, C(j) represents the carbon atom mixing ratio (ppbC) of this species, and kOH(j) and kOH(C3H6) denote the chemical reaction rate constant in the free radical reaction of species j and propylene with OH; kOH(j) was obtained from a study by Atkinson and Aery [25].
In this study, both the MIR scale and the OH-reactivity scale were utilized. The OH reaction rate constants and estimated MIR coefficients, as well as their mixing ratios, for each NMHC species, are shown in Table 2.

2.3.2. Assessment of Biogenic and Anthropogenic Effects on Isoprene

Isoprene has both biogenic and anthropogenic sources [14,15]. Some previous studies that quantified isoprene in vehicle exhaust emissions periods revealed a strong correlation between isoprene and common vehicle exhaust tracers (e.g., 1,3-butadiene and carbon monoxide) in cold seasons [15,16,26]. The results indicated that anthropogenic sources of isoprene are mainly a result of vehicle exhaust emissions, although some studies [27,28] found human exhalation to be another anthropogenic source of isoprene. Thus, characteristic mixing ratios of isoprene and vehicle exhaust tracers can be used to assess the biogenic and anthropogenic effects on isoprene [15]. Cis-2-butene, which was identified by simple regression analyses of the mixing ratios of isoprene and vehicle exhaust tracers and determined to have a p-value of 0.05 from a t-test, was chosen as a tracer for anthropogenic isoprene. The average ratio between the measured isoprene and cis-2-butene mixing ratio at the GPACS in the night-time during winter (when the biogenic emission is negligible) was treated as the characteristic ratio between anthropogenic isoprene and cis-2-butene. Using the ratio calculated for the winter to assess the biogenic and anthropogenic contribution of isoprene in other seasons, the total isoprene was separated as follows:
[isoprene]anthropogenic = x[cis-2-butene]
[isoprene]biogenic = [isoprene]total − [isoprene]anthropogenic
where [isoprene]anthropogenic is the mixing ratio of anthropogenic isoprene, x is the characteristic ratio between cis-butene and isoprene calculated for the winter months, [cis-2-butene] is the mixing ratio of cis-2-butene, [isoprene]biogenic is the mixing ratio of biogenic isoprene, and [isoprene]total is the mixing ratio of total isoprene.

3. Results and Discussion

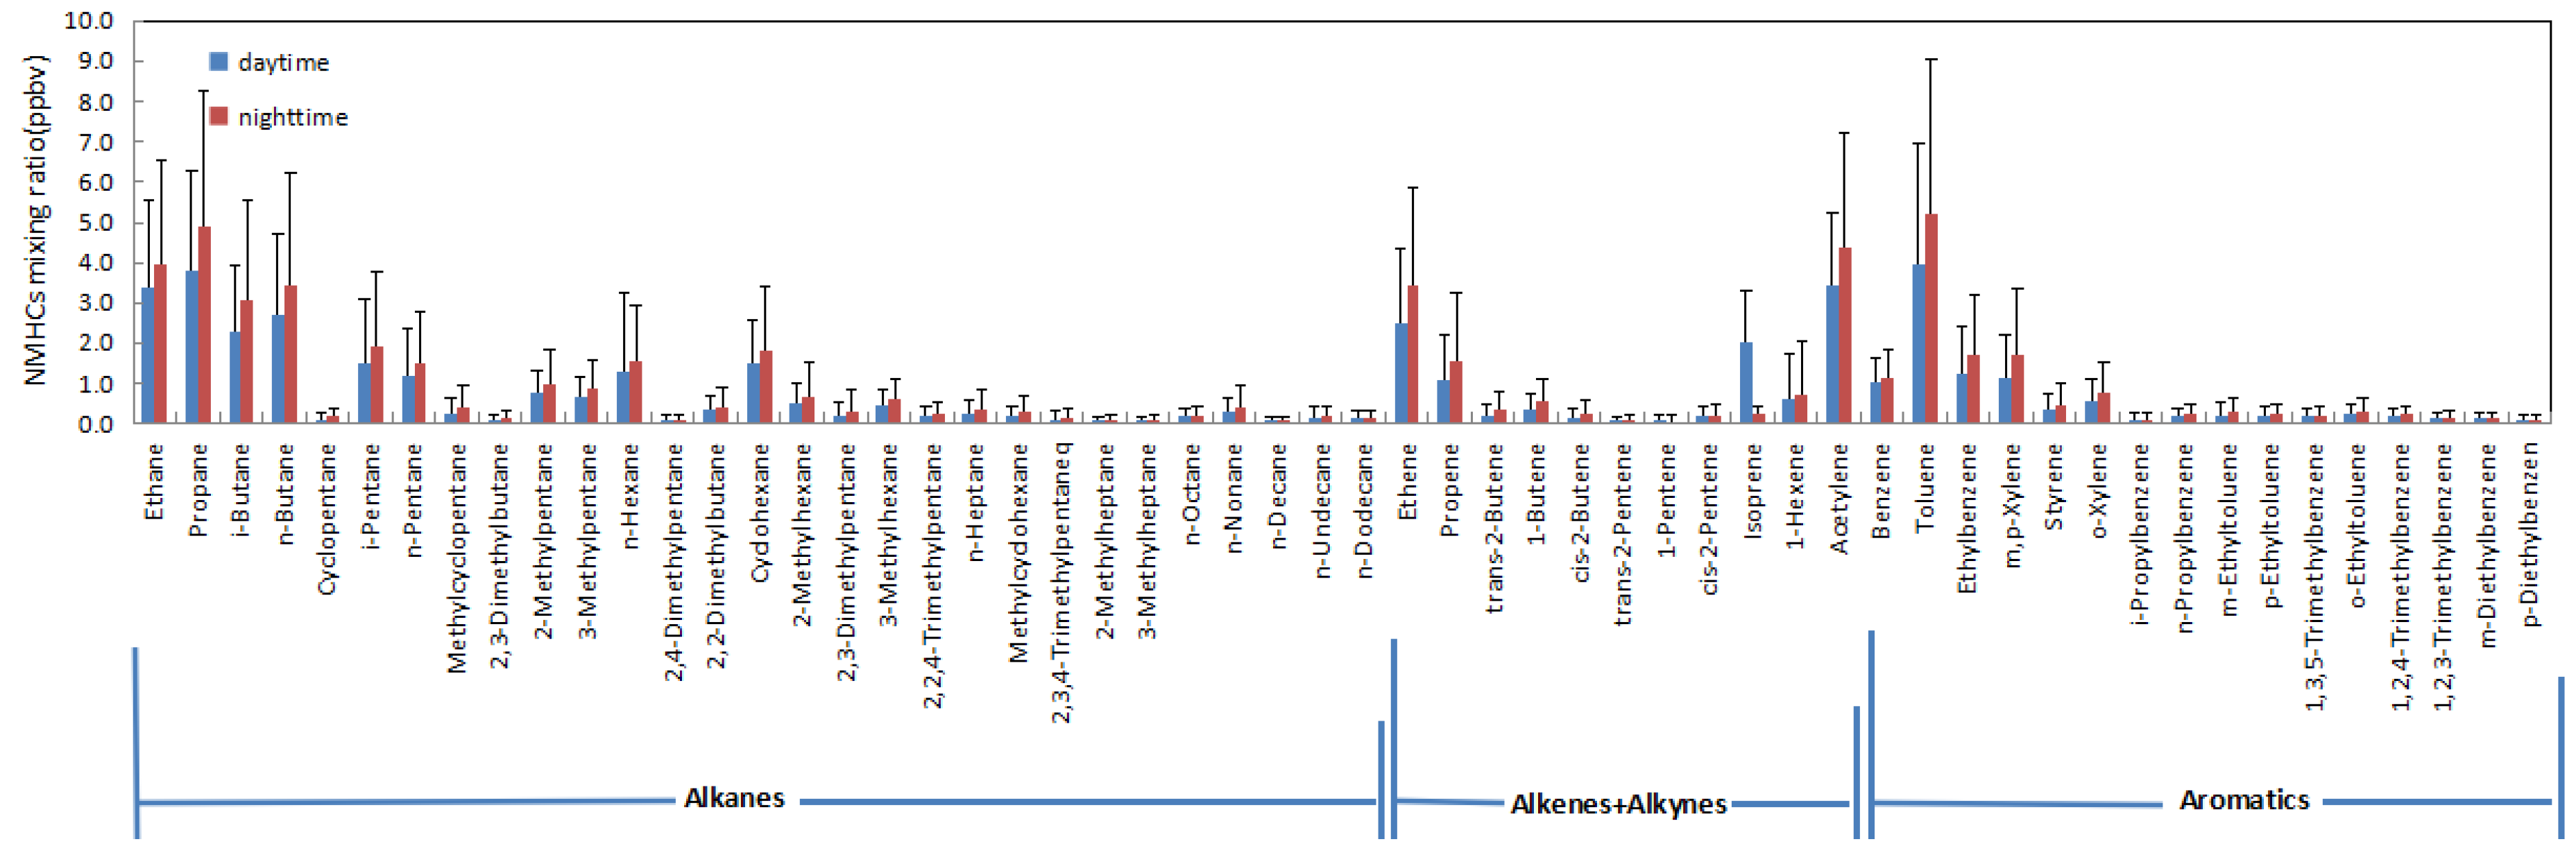
3.1. Overall Characteristics of NMHCs and Their Relative Potential to O3 Formation

Of the 56 measured NMHCs, three categories were identified at GPACS (Guangzhou Panyu Atmospheric Composition Station) from June 2011 to May 2012: alkanes (29 species), alkenes and alkynes (11 species), and aromatics (16 species). Figure 2 shows the day- and night-time average mixing ratios. Among these species, C2–C4 alkanes, ethene, acetylene, and toluene, which originated exclusively from anthropogenic sources, were the most abundant species. C2–C4 alkanes were mainly emitted from the leakage of liquefied petroleum gases (LPG), natural gas (NG), and gasoline evaporation; ethene and ethyne resulted from incomplete combustion, particularly vehicle exhaust emissions; and toluene was generated from biomass and biofuel burning and diesel vehicular emissions [29,30]. The mixing ratios of most NMHCs were slightly higher during the night-time as compared with daytime levels, except for isoprene, which indicates that isoprene had larger daytime emissions (i.e., biogenic sources), as discussed in the next section.
Table 3 shows the isoprene ambient mixing ratios measured at different locations in temperate and subtropical zones. The daily average mixing ratios of isoprene in spring, summer, autumn, and winter were 0.4, 2.2, 1.4, and 0.13 ppbv, respectively. In contrast, the isoprene mixing ratios in subtropical cities were much higher than those in temperate zones (e.g., Beijing and London) because of the higher temperatures and higher levels of solar radiation. The values at GPACS in Guangzhou were even higher than the levels of isoprene in other subtropical cities (e.g., Taiwan and Houston), implying that isoprene may play a more important role in photochemistry in Guangzhou than in many other cities around the world. In order to further assess the importance of isoprene at GPACS, the MIR and OH-reactivity scales (e.g., propylene-equivalent mixing ratio) were used to quickly and conveniently evaluate the O3 formation potential (OFP) or their relative reactivity during photochemical pollution formation. Figure 3 shows the annual mean relative OFP and propylene-equivalent mixing ratios of the 56 NMHCs at GPACS during a photochemical reaction process (10:00–17:00 Local Time (LT)) from June 2011 to May 2012. With regard to the OFP of NMHCs estimated by the MIR scale, isoprene was the top-ranked species, which accounted for 20.69% of the total OFPs among the 56 NMHCs. Toluene ranked second with 14.61% of the total OFPs. Following were m,p-xylene, ethene, propene, o-xylene, and then ethylbenzene, accounting for 10.01%, 5.13%, 4.99%, 4.44%, and 4.16%, respectively. Comparing the results estimated by the MIR and OH-reactivity scales, the 10 species with the largest OFP and propylene-equivalent mixing ratios were nearly the same, although their ranking was different. The species with the highest propylene-equivalent mixing ratio was also isoprene, indicating the significance of isoprene in the O3 formation process at GPACS. The fraction of isoprene with regard to the total propylene-equivalent mixing ratio (which was higher than the sum of the next nine species) was much larger than the fraction of isoprene in the total OFP, because the MIR value of isoprene listed in Table 2 is close to that of other reactive species, while the reaction rate constant of isoprene with OH radicals is much higher than that of other NMHC compounds.

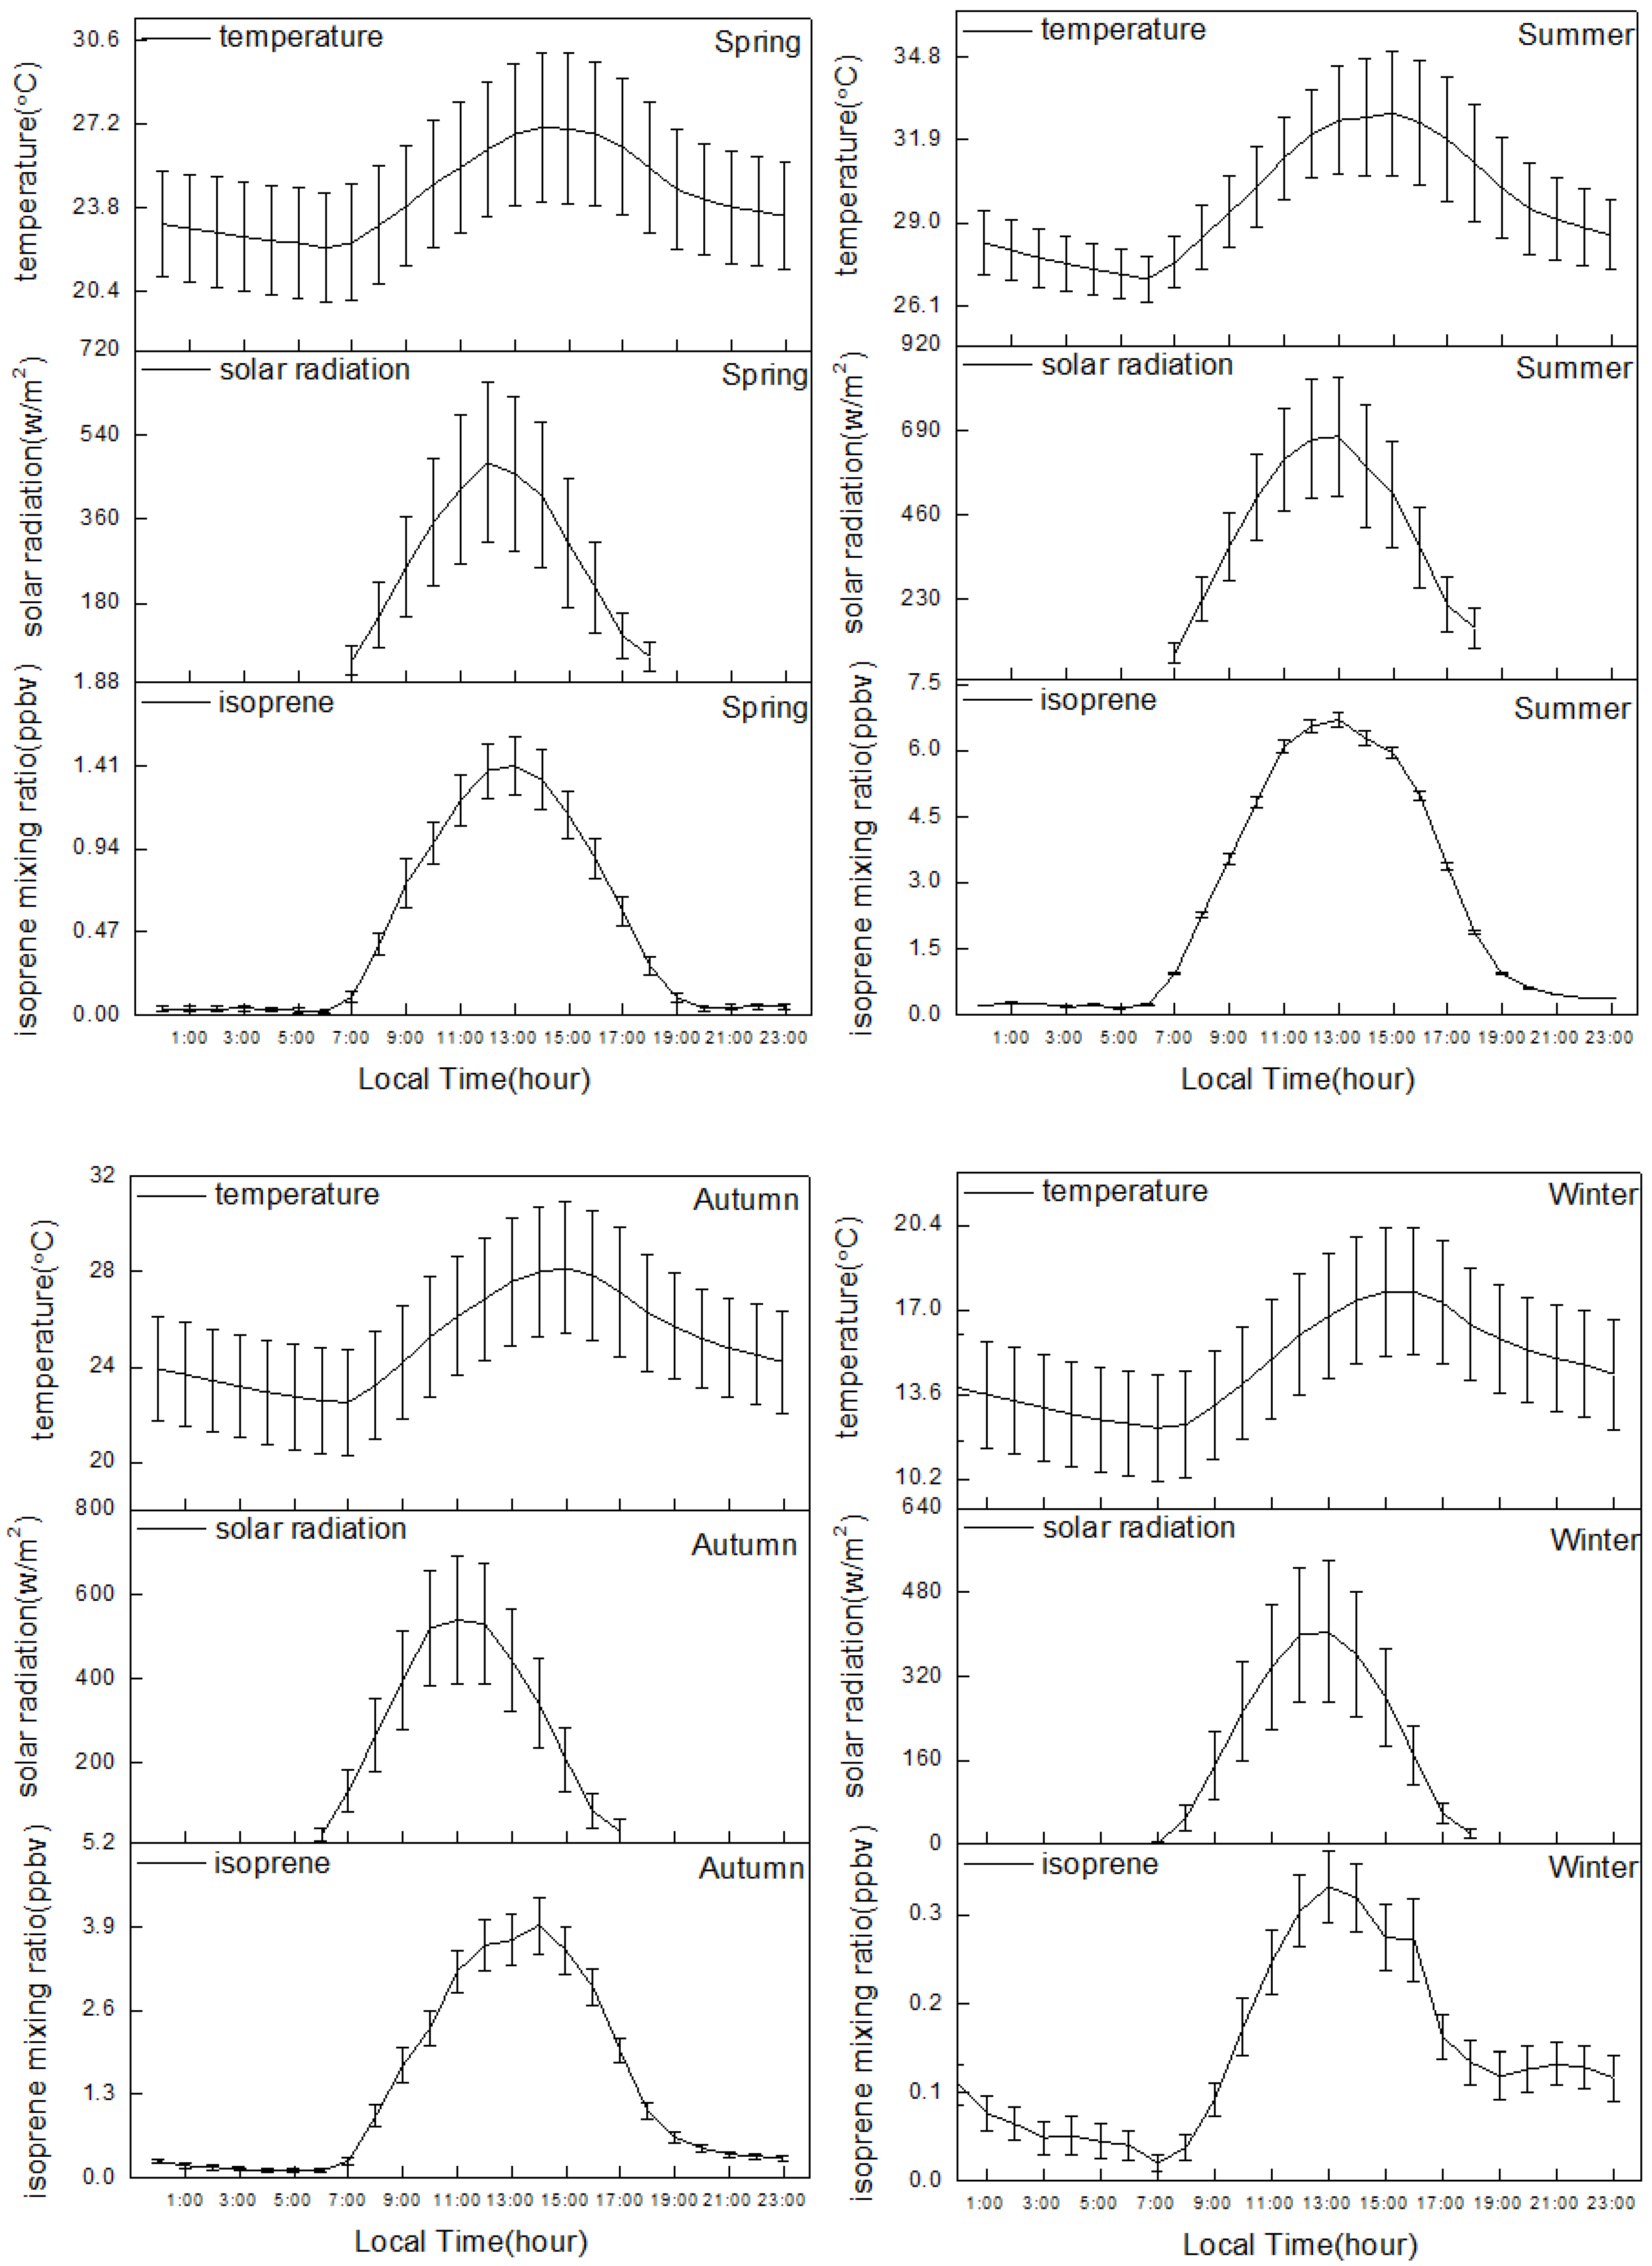
3.2. Biogenic and Anthropogenic Effects on Isoprene

Diurnal variations in the mixing ratios of isoprene, temperature, and solar radiation are shown in Figure 4. The meteorological data showed a similar pattern across all seasons. The temperature varied, with regular diurnal patterns of maximum temperatures at about 15:00 LT and minimum temperatures at about 7:00 LT. The solar radiation showed unimodal variation with the peaks at approximately 12:00 LT. Ambient isoprene showed a coincident diurnal pattern of maximum mixing ratios at 13:00 LT in spring, summer, and autumn, which indicated that its biogenic emissions were closely related to temperature and solar radiation. However, in winter, isoprene was detected at low levels, and a relatively weak peak occurred at night, which indicates that the isoprene mixing ratio is correlated with anthropogenic emissions in the cold season, because its emissions from biogenic sources without illumination were negligible [38]. As previously discussed, isoprene ranked first in terms of propylene-equivalent mixing ratio and OFP, indicating the significant potential of isoprene to influence the O3 formation in Guangzhou. Further investigation of the biogenic and anthropogenic effects on isoprene is essential for O3 pollution control in Guangzhou. In this study, two common vehicular tracers (cis-2-butene and 3-methylpentane) [30] at GPACS were employed for the source apportionment of isoprene. The approach is robust at GPACS, where there are no significant industrial pollution sources nearby and the air is sufficiently homogenous with regard to various sources (e.g., vehicular emissions) near the surface of the ground [3,19,20,21]. Figure 5 shows the mixing ratios of isoprene versus 3-methylpentane and cis-2-butene, respectively, during the day- and night-time across the four seasons. At night-time during winter, isoprene showed a statistically significant correlation (p < 0.05) with cis-2-butene and 3-methylpentane (see black circles), revealing that the weak night-time peak (see Figure 4) was almost exclusively caused by vehicular emissions because isoprene has negligible emissions from biogenic sources without illumination. Compared with 3-methylpentane (R2 = 0.52), cis-2-butene exhibited a better correlation with isoprene (R2 = 0.80) in winter, because cis-2-butene and isoprene have similar chemical properties. In winter, most of the daytime data (red circles) showed a low cis-2-butene/isoprene ratio, which indicated that there were notable emissions of biogenic sources contributing to the daytime isoprene levels. In this study, the average measured cis-2-butene/isoprene ratio (0.35) at GPACS at night-time in winter was treated as the characteristic ratio between anthropogenic isoprene and cis-2-butene and was used to assess the anthropogenic and biogenic contributions to isoprene in other seasons. Figure 6 shows the estimated anthropogenic and biogenic isoprene contributions during spring, summer, and autumn at GPACS. During the daytime, it is estimated that approximately 99.2%, 99.5%, and 97.6% of daytime isoprene was released by biogenic sources during spring, summer, and autumn, respectively. In other words, only 0.8%, 0.5%, and 2.4% of daytime isoprene could be attributed to vehicular emissions, in spring, summer, and autumn, respectively. It should be noted that the chemical removal of NMHCs in the atmosphere is mainly dominated by the reaction with OH radicals [25]; therefore, the difference in the rate constants between isoprene and cis-2-butene could result in an overestimation of the vehicular contribution. However, the overestimation observed in our study results is small, since only a small fraction of the daytime isoprene level was attributed to vehicular emissions. In theory, there are negligible emissions from biogenic sources of isoprene without illumination. The reason that a fraction of biogenic isoprene existed at night is that a small amount of residual isoprene persists into the night-time after the photochemical loss during the daytime, which is also indicated by the fact that some black circles lie below the regression line at night-time during winter in Figure 5.

3.3. Effect of Isoprene on Shaping the O3 Peak Profile

Figure 7 shows the diurnal patterns of isoprene fractional contributions and four categories (alkanes, alkenes (excluding isoprene), aromatics, and ethyne) to the total mixing ratio and total photochemical reactivity (e.g., propylene-equivalent mixing ratio), respectively. Anthropogenic emissions (e.g., alkanes, alkenes, and ethyne emissions) reached their maximum values during rush hour (7:00–9:00 LT) and in the evening (19:00–23:00 LT) because most alkanes, alkenes, and alkynes consist of NMHC species related to vehicular emissions reported in PRD, such as propane, i-butane, n-butane, i-pentane, n-pentane, 3-methylpentane, ethane, propene, and ethyne [3,30,39], while the maximum isoprene emissions were observed around midday when there were high temperatures and strong solar radiation. This is because, as previously discussed, isoprene was mainly emitted from vegetation during the daytime. Although the mixing ratio of isoprene was relatively low compared to those other abundant species (i.e., C2–C4 alkanes, ethene, acetylene, and toluene) during the daytime, it still deserves attention because of its extremely strong photochemical reactivity. In addition, the timing of isoprene emission release is also critical from the perspective of photochemistry. The midday surge of biogenic isoprene had much more efficient production of midday O3, because this isoprene peak occurred when the most favorable meteorological conditions (e.g., high temperature and strong solar radiation) for photochemistry to occur were present, in addition to the presence of the highest OH mixing ratio (which could maximize photochemical reactions) [12]. As a result, isoprene could have a large effect on shaping the peak of the O3 profile (see Figure 8). The high levels of isoprene in summer and autumn could not only result in stronger O3 peaks, but could also maintain these peaks for longer, thus shaping the strong and broad O3 peak profile. In contrast, the lower mixing ratios of isoprene resulted in a weak and sharp O3 peak profile. The high-mixing ratio of O3 is particularly harmful to human health [40], as highlighted by the stringent control measures of anthropogenic pollutant emissions that have been successfully implemented in PRD, which accentuates the significance of isoprene and its great impact on air quality in Guangzhou.

4. Conclusions

Measurements of isoprene levels were conducted at Guangzhou Panyu Atmospheric Composition Station (GPACS) from June 2011 to May 2012, using the online GC-FID (gas chromatography-flame ionization detector) system to investigate the characterization and reactivity of isoprene and its effect on the O3 peak profile in different seasons. The mixing ratios of most anthropogenic NMHCs were slightly higher at night-time when compared with daytime levels at GPACS, except for isoprene, which indicates that isoprene biogenic emissions are greater in the daytime. The daily average mixing ratios of isoprene were 0.40, 2.20, 1.40, and 0.13 ppbv in spring, summer, autumn, and winter, respectively, considerably higher than the mixing ratios of isoprene in most subtropical and temperate cities around the world. Isoprene ranked first in terms of O3 formation potential (OFP) and propylene-equivalent mixing ratio among 56 measured NMHCs during the O3 formation period, which indicates the significant potential of isoprene to influence O3 formation.
The ratios of isoprene to cis-2-butene, an exhaust tracer, were determined to estimate the fractions of biogenic and anthropogenic sources. The results revealed that the biogenic contribution was overwhelmingly greater than the anthropogenic contribution during the daytime in all four seasons. It should be noted that the difference in the rate constants between isoprene and cis-2-butene could result in an overestimation of the vehicular contribution. However, this overestimation would have been small in our study, since only a small fraction of the daytime isoprene was attributed to vehicular emissions. In addition, night-time isoprene emissions were mostly associated with vehicles in winter, which confirms that the weak night-time peak in winter was affected by vehicular emissions. The residual isoprene mixing ratio after daytime photochemical loss persisted into the night-time and also contributed to the night-time isoprene mixing ratio.
The high levels of isoprene in summer and autumn could shape the strong and broad O3 peak profiles in these seasons because of the more favorable meteorological conditions (e.g., high temperature and intense solar radiation), the higher photochemical reactivity, and the higher OH mixing ratio. This could affect human health by exposing people to a high O3 mixing ratio for a prolonged period, while the lower mixing ratios of isoprene resulted in a weak and sharp O3 peak profile in both spring and winter. The high level of isoprene in subtropical zones could accentuate its great impact on atmospheric oxidant capacity and air quality in Guangzhou city.

Author Contributions

This study was conceived and designed by Y.Z. and X.J.D.; The data was analyzed by Y.Z. and F.L.; The paper was written by Y.Z.; The paper was revised and improved by Y.Z., T.D. and C.Q.Y.

Funding

This study was supported by the National Key R&D Program of China (NOs. 2018YFC0213901, 2016YFC0202003), the National Natural Science Foundation of China (NOs. 41775037, 41805131, 41605105), the Science and Technology Innovative Research Team Plan of Guangdong Meteorological Bureau (NO. 201704), and the Science and Technology Research project of Guangdong Meteorological Bureau (NO. GRMC2018M06).

Acknowledgments

The constructive suggestions from the anonymous reviewers are greatly appreciated.

Conflicts of Interest

The authors declare no conflict of interest.

References

  1. Wang, T.; Wei, X.L.; Ding, A.J.; Poon, C.N.; Lam, K.S.; Li, Y.S.; Chan, L.Y.; Anson, M. Increasing surface ozone concentrations in the background atmosphere of Southern China, 1994–2007. Atmos. Chem. Phys. 2009, 9, 6217–6227. [Google Scholar] [CrossRef] [Green Version]
  2. Zheng, J.Y.; Zhong, L.J.; Wang, T.; Louie, P.K.K.; Li, Z.C. Ground-level ozone in the Pearl River Delta region: Analysis of data from a recently established regional air quality monitoring network. Atmos. Environ. 2010, 44, 814–823. [Google Scholar] [CrossRef]
  3. Zou, Y.; Charlesworth, E.; Yin, C.Q.; Yan, X.L.; Deng, X.J.; Li, F. The weekday/weekend ozone differences induced by the emissions change during summer and autumn in Guangzhou, China. Atmos. Environ. 2019, 199, 114–126. [Google Scholar] [CrossRef]
  4. Ran, L.; Zhao, C.S.; Xu, W.Y.; Lu, X.Q.; Han, M.; Lin, W.L.; Yan, P.; Xu, X.B.; Deng, Z.Z.; Ma, N.; et al. VOC reactivity and its effect on ozone production during the HaChi summer campaign. Atmos. Chem. Phys. 2011, 11, 4657–4667. [Google Scholar] [CrossRef] [Green Version]
  5. Zhong, L.J.; Louie, P.K.K.; Zheng, J.Y.; Yuan, Z.B.; Yue, D.L.; Ho, J.W.K.; Lau, A.K.H. Science-policy interplay: Air quality management in the Pearl River Delta region and Hong Kong. Atmos. Environ. 2013, 76, 3–10. [Google Scholar] [CrossRef]
  6. Wang, N.; Lyu, X.P.; Deng, X.J.; Guo, H.; Deng, T.; Li, Y.; Yin, C.Q.; Li, F.; Wang, S.Q. Assessment of regional air quality resulting from emission control in the Pearl River Delta region, southern China. Sci. Total Environ. 2016, 573, 1554–1565. [Google Scholar] [CrossRef]
  7. Li, J.F.; Lu, K.D.; Lv, W.; Li, J.; Zhong, L.J.; Ou, Y.B.; Cheng, D.H.; Huang, X.; Zhang, Y.H. Fast increasing of surface ozone concentrations in Pearl River Delta characterized by a regional air quality monitoring network during 2006–2011. J. Environ. Sci. 2014, 26, 23–26. [Google Scholar] [CrossRef]
  8. Wang, T.; Nie, W.; Gao, J.; Xue, L.K.; Gao, X.M.; Wang, X.F.; Qiu, J.; Poon, C.N.; Meinardi, S.; Blake, D.; et al. Air quality during the 2008 Beijing Olympics: Secondary pollutants and regional impact. Atmos. Chem. Phys. 2010, 10, 7603–7615. [Google Scholar] [CrossRef]
  9. Chameides, W.L.; Lindsay, R.W.; Richardson, J.; Kiang, C.S. The role of biogenic hydrocarbons in urban photochemical smog: Atlanta as a case study. Science. 1988, 241, 1473–1475. [Google Scholar] [CrossRef]
  10. Wagner, P.; Kuttler, W. Biogenic and anthropogenic isoprene in the near-surface urban atmosphere-Acase study in Essen, Germany. Sci. Total Environ. 2014, 475, 104–115. [Google Scholar] [CrossRef]
  11. Carter, W.P.L. Development of ozone reactivity scales for volatile organic compounds. J. Air Waste Manag. Assoc. 1994, 44, 881–899. [Google Scholar] [CrossRef]
  12. Lee, B.S.; Wang, J.L. Concentration variation of isoprene and its implications for peak ozone concentration. Atmos. Environ. 2006, 40, 5486–5495. [Google Scholar] [CrossRef]
  13. Guenther, A.; Karl, T.; Harley, P.; Wiedinmyer, C.; Palmer, P.I.; Geron, C. Estimates of global terrestrial isoprene emissions using MEGAN (Model of Emissions of Gases and Aerosols from Nature). Atmos. Chem. Phys. 2006, 6, 3181–3210. [Google Scholar] [CrossRef] [Green Version]
  14. Borbon, A.; Fontaine, H.; Veillerot, M.; Locoge, N.; Galloo, J.C.; Guillermo, R. An investigation into the traffic-related fraction of isoprene at an urban location. Atmos. Environ. 2001, 35, 3749–3760. [Google Scholar] [CrossRef]
  15. Wang, J.L.; Chew, C.; Chang, C.Y.; Liao, W.C.; Lung, C.S.C.; Chen, W.N.; Lee, P.J.; Lin, P.H.; Chang, C.C. Biogenic isoprene in subtropical urban settings and implications for air quality. Atmos. Environ. 2013, 79, 369–379. [Google Scholar]
  16. Reimann, S.; Pierluigi, C.; Hofer, P. The anthropogenic fraction contribution to isoprene concentrations in a rural atmosphere. Atmos. Environ. 2000, 34, 109–115. [Google Scholar] [CrossRef]
  17. Ran, L.; Zhao, C.; Geng, F.; Tie, X.; Tang, X.; Peng, L.; Zhou, G.; Yu, Q.; Xu, J.; Guenther, A. Ozone photochemical production in urban Shanghai, China: Analysis based on ground level observations. J. Geophys. Res. 2009, 114. [Google Scholar] [CrossRef] [Green Version]
  18. Deng, T.; Wu, D.; Deng, X.J.; Tan, H.B.; Li, F.; Liao, B.T. A vertical sounding of severe haze process in Guangzhou area. Sci. China. Earth Sci. 2014, 57, 2650–2656. [Google Scholar] [CrossRef]
  19. Liu, L.; Tan, H.B.; Fan, S.J.; Cai, M.F.; Xu, H.B.; Lei, F.; Chan, P.W. Influence of aerosol hygroscopicity and mixing state on aerosol optical properties in the Pearl River Delta region, China. Sci. Total Environ. 2018, 627, 1560–1571. [Google Scholar] [CrossRef]
  20. Zou, Y.; Deng, X.J.; Zhu, D.; Gong, D.C.; Wang, H.; Li, F.; Tan, H.B.; Deng, T.; Mai, B.R.; Liu, X.T.; et al. Characteristics of 1 year of observational data of VOCs, NOx and O3 at a suburban site in Guangzhou, China. Atmos. Chem. Phys. 2015, 15, 6625–6636. [Google Scholar] [CrossRef]
  21. Tan, H.B.; Liu, L.; Fan, S.J.; Li, F.; Yin, Y.; Cai, M.F.; Chan, P.W. Aerosol optical properties and mixing state of black carbon in the Pearl River Delta, China. Atmos. Environ. 2016, 131, 196–208. [Google Scholar] [CrossRef]
  22. Main, H.H.; Roberts, P.T.; Hurwitt, S.B. Validation of PAMS VOC Data in the Mid-Atlantic Region. Report Prepared for MARAMA, Baltimore, MD. Sonoma Technology, Inc., Petaluma, 1999, CA STI-998481-1835-FR. Available online: http://www.marama.org/publications_folder/Validation_of_PAMS_Report_feb1999.pdf (accessed on 20 October 2012).
  23. An, J.L.; Zhu, B.; Wang, H.L.; Li, Y.Y.; Lin, X.; Yang, H. Characteristics and source apportionment of VOCs measured in an industrial area of Nanjing, Yangtze River Delta, China. Atmos. Environ. 2014, 97, 206–214. [Google Scholar] [CrossRef]
  24. Dodge, M.C. Combined effects of organic reactivity and NMHC/NOx ratio on photochemical oxidant formation—A modeling study. Atmos. Environ. 1984, 18, 1657–1665. [Google Scholar] [CrossRef]
  25. Atkinson, R.; Arey, J. Atmospheric degradation of volatile organic compounds. Chem. Rev. 2003, 103, 4605–4638. [Google Scholar] [CrossRef]
  26. Chang, C.C.; Shao, M.; Chou, C.C.K.; Liu, S.C.; Wang, J.L.; Lee, K.Z.; Lai, C.H.; Zhu, T.; Lin, P.H. Biogenic isoprene and implications for oxidant levels in Beijing during the 2008 Olympic Games. Atmos. Chem. Phys. Discuss. 2013, 13, 25939–25967. [Google Scholar] [CrossRef]
  27. Kinoyama, M.; Nitta, H.; Watanabe, A.; Ueda, H. Acetone and isoprene concentrations in exhaled breath in healthy subjects. J. Health Sci. 2008, 54, 471–477. [Google Scholar] [CrossRef]
  28. Kushch, I.; Arendacká, B.; Štolc, S.; Mochalski, P.; Filipiak, W.; Schwarz, K.; Schwentner, L.; Schmid, A.; Dzien, A.; Lechleitner, M.; et al. Breath isoprene—aspects of normal physiology related to age, gender and cholesterol profile as determined in a proton transfer reaction mass spectrometry study. Clin. Chem. Lab. Med. 2008, 46, 1011–1018. [Google Scholar] [CrossRef]
  29. Zheng, J.Y.; Shao, M.; Che, W.W.; Zhang, L.J.; Zhong, L.J.; Zhang, Y.H.; Streets, D. Speciated VOC emission inventory and spatial patterns of ozone formation potential in the Pearl River Delta, China. Environ. Sci. Technol. 2009, 43, 8580–8586. [Google Scholar] [CrossRef] [PubMed]
  30. Guo, H.; Cheng, H.R.; Ling, Z.H.; Louie, P.K.K.; Ayoko, G.A. Which emission sources are responsible for the volatile organic compounds in the atmosphere of Pearl River Delta? J. Hazard. Mater. 2011, 188, 116–124. [Google Scholar] [CrossRef]
  31. Legreid, G.; Lööv, J.B.; Staehelin, J.; Hüglin, C.; Hill, M.; Buchmann, B.; Prevot, A.S.H.; Reimann, S. Oxygenated Volatile Organic Compounds (OVOCs) at an urban background site in Zürich (Europe): seasonal variation and source allocation. Atmos. Environ. 2007, 41, 8409–8423. [Google Scholar] [CrossRef]
  32. Hellén, H.; Tykkä, T.; Hakola, H. Importance of monoterpenes and isoprene inurban air in northern Europe. Atmos. Environ. 2012, 59, 59–66. [Google Scholar] [CrossRef]
  33. Lee, J.D.; Lewis, A.C.; Monks, P.S.; Jacob, M.; Hamilton, J.F.; Hopkins, J.R.; Watson, N.M.; Saxton, J.E.; Ennis, C.; Carpenter, L.J.; et al. Ozone photochemistry and elevated isoprene during the UK heatwave of August 2003. Atmos. Environ. 2003, 40, 7598–7613. [Google Scholar] [CrossRef]
  34. Khan, M.A.H.; Schlich, B.L.; Jenkin, M.E.; Shallcross, B.M.A.; Moseley, M.; Waler, C.; Morris, W.C.; Derwent, R.G.; Percival, C.J.; Shallcross, D.E. A two-decade anthropogenic and biogenic isoprene emissions study in a London urban background and a London urban traffic site. Atmosphere 2018, 9, 387. [Google Scholar] [CrossRef]
  35. Li, N.; He, Q.Y.; Greenberg, J.; Guenther, A.; Li, J.Y.; Cao, J.J.; Wang, J.; Liao, H.; Wang, Q.Y.; Zhang, Q. Impacts of biogenic and anthropogenic emissions on summertime ozone formation in the Guangzhou Basin, China. Atmos. Chem. Phys. 2018, 18, 7489–7507. [Google Scholar] [CrossRef]
  36. Tang, J.H.; Chan, L.Y.; Chang, C.C.; Liu, S.; Li, Y.S. Characteristics and sources of non-methane hydrocar-bons in background atmospheres of eastern, southwestern, and southern China. J. Geophys. Res.-Atmos. 2009, 114, D03304. [Google Scholar] [CrossRef]
  37. Park, C.; Schade, G.; Boedeker, I. Characteristics of the flux of isoprene and its oxidation products in an urban area. J. Geophys. Res. 2011, 116, D21303. [Google Scholar] [CrossRef]
  38. Shao, M.; Czapiewski, K.V.; Heiden, A.C.; Kobel, K.; Komenda, M.; Koppmann, R.; Wildt, J. Volatile organic compound emissions from Scots pine: Mechanisms and description by algorithms. J. Geophys. Res. 2001, 106, 20483–20491. [Google Scholar] [CrossRef] [Green Version]
  39. Ling, Z.H.; Guo, H.; Cheng, H.R.; Yu, Y.F. Sources of ambient volatile organic compounds and their contributions to photochemical ozone formation at a site in the Pearl River Delta, southern China. Environ. Pollut. 2011, 159, 2310–2319. [Google Scholar] [CrossRef]
  40. Castellanos, P.; Stehr, J.W.; Dickerson, R.R.; Ehrman, S.H. The sensitivity of modeled ozone to the temporal distribution of point, area, and mobile source emissions in the eastern United States. Atmos. Environ. 2009, 43, 4603–4611. [Google Scholar] [CrossRef]
Figure 1. Observation site at GPACS (Guangzhou Panyu Atmospheric Composition Station) and its surrounding area from Google Maps.
Atmosphere 10 00201 g001
Figure 2. Average day- (7:00–18:00 LT) and night-time (19:00–6:00 LT) average mixing ratios of 56 NMHCs at GPACS (unit: ppbv). Error bars represent standard deviations from June 2011 to May 2012.
Atmosphere 10 00201 g002
Figure 3. Fractional contribution of NMHCs to total OFP (O3 formation potential) (a) and total propylene-equivalent mixing ratio (b) during photochemical reaction process (10:00–17:00 LT) from June 2011 to May 2012 at GPACS.
Atmosphere 10 00201 g003
Figure 4. Diurnal variations of isoprene, solar radiation, and temperature in each season from June 2011 to May 2012 at GPACS.
Atmosphere 10 00201 g004
Figure 5. Mixing ratios of isoprene versus 3-methylpentane and cis-2-butene, respectively in each season from June 2011 to May 2012 at GPACS. Red circles denote the data for the daytime (7:00–18:00 LT), and black circles denote the data for the night-time (19:00–6:00 LT). Black lines represent the regression lines fit to the night-time samples (black circles).
Atmosphere 10 00201 g005
Figure 6. Diurnal patterns of the estimated anthropogenic and biogenic isoprene during spring, summer, and autumn at GPACS.
Atmosphere 10 00201 g006
Figure 7. Diurnal variations of fractional contributions of isoprene and four categories (alkanes, alkenes (excluding isoprene), aromatics, and ethynes) to the total mixing ratio and total photochemical reactivity, respectively, from June 2011 to May 2012 at GPACS.
Atmosphere 10 00201 g007
Figure 8. Diurnal variations of isoprene mixing ratios and its reactivities, as well as O3 mixing ratios in each season from June 2011 to May 2012 at GPACS.
Atmosphere 10 00201 g008
Table 1. The temperature and solar radiation (7:00–18:00 Local Time (LT)) in each season from June 2011 to May 2012 at GPACS.
SeasonMeteorological ElementMinimumMaximumMeanMedian
Spring
(March, April, May)
Temperature (°C)
Solar Radiation (w/m2)
9.4
0.1
35.5
886.5
22.6
271.2
22.9
199.9
Summer
(June, July, August)
Temperature (°C)
Solar Radiation (w/m2)
23.9
4.1
37.1
952.5
29.4
415.1
28.8
381.3
Autumn
(September, October, November)
Temperature (°C)
Solar Radiation (w/m2)
16.2
0.3
35.3
901.0
25.2
294.4
25.2
238.1
Winter
(December, January, February)
Temperature (°C)
Solar Radiation (w/m2)
4.7
0.1
26.9
693.5
14.2
206.8
14.1
135.3
Table 2. The NMHCs’ OH (hydroxyl radicals of non–methane hydrocarbons) reaction rate constants, estimated MIR (maximum incremental reactivity) coefficients, and their hourly mean mixing ratios at GPACS from June 2011 to May 2012.
CompoundkaOH × 1012MIR bMixing Ratio (ppbv) (Parts Per Billion by Volume)
Alkanes
Ethane0.270.253.66
Propane1.150.464.34
i-Butane2.341.182.67
n-Butane2.541.083.07
Cyclopentane5.162.240.15
i-Pentane3.901.361.72
n-Pentane3.941.221.37
Methylcyclopentane5.101.460.32
2,3-Dimethylbutane6.301.070.13
2,2-Dimethylbutane2.320.820.37
2-Methylpentane5.601.400.88
3-Methylpentane5.701.690.75
n-Hexane5.601.141.43
2,4-Dimethylpentane5.701.110.37
Cyclohexane7.491.141.65
2-Methylhexane6.901.090.58
2,3-Dimethylpentane5.101.250.26
3-Methylhexane5.101.500.52
2,2,4-Trimethylpentane3.681.200.22
n-Heptane7.150.970.32
Methylcyclohexane10.41.560.26
2,3,4-Trimethylpentane7.000.970.12
2-Methylheptane8.301.120.08
3-Methylheptane8.600.800.08
n-Octane8.680.680.19
n-Nonane10.200.590.35
n-Decane11.600.520.03
n-Undecane13.200.470.17
n-Dodecane14.200.380.14
Alkenes
Ethene8.507.402.99
Propene26.3011.571.32
trans-2-Butene64.0015.200.28
1-Butene31.409.570.44
cis-2-Butene56.4014.260.22
trans-2-Pentene67.0010.470.03
1-Pentene31.407.070.05
cis-2-Pentene65.0010.280.19
Isoprene101.0010.481.14
1-Hexene0.67
Alkyne
Ethyne0.90.53.90
Aromatics
Benzene1.230.421.09
Toluene5.963.934.59
Ethylbenzene6.962.961.48
m,p-Xylene20.508.541.41
Styrene58.001.660.41
o-Xylene13.607.580.66
i-Propylbenzene6.602.450.10
n-Propylbenzene5.701.960.23
m-Ethyltoluene18.607.390.25
p-Ethyltoluene11.804.390.21
1,3,5-Trimethylbenzene56.7011.750.21
o-Ethyltoluene11.905.540.27
1,2,4-Trimethylbenzene32.508.830.21
1,2,3-Trimethylbenzene32.7011.940.15
m-Diethylbenzene15.007.080.12
p-Diethylbenzene10.004.390.11
Note: a MIR denotes maximum incremental reactivity [11]; b kOH denotes rate constant of NMHCs react with hydroxyl radicals at 298K [25].
Table 3. Isoprene ambient mixing ratios measured at different locations in temperate and subtropical zones.
SiteLocationYearSeasonMean Mixing Ratio or Range (ppbv)Reference
National Taiwan University (Urban Site)Taipei (25° 00′ N/121° 34′ E)2011Summer0.72 (daily)[15]
Hualin Weather Station (Rural Site)Northern Taiwan (24° 53′ N/121° 34′ E)2011Summer0.70 (daily)[15]
Kasernenhof (Urban Background Site)Zurich (47° 22′ N/8° 31′ E)2005Summer0.16 (daily)[31]
Rooftop Site (Urban Site)Essen (51° 27′ N/7° 00′ E)2011Summer0.09 (daily)[10]
SMEARIII (Urban Background Site)Helsinki (60° 12′ N/24° 58′ E)2011Summer0.11 (daily)[32]
Writtle College (Rural Site)Essex (51° 44′ N/0° 25′ E)2003Summer0.13 (daytime)[33]
Eltham (Suburban Background Site)London (51° 27′ N/0° 03′ E)1997–2017Summer0.13 (daily)[34]
Marylebone Road (Urban Site)London (51°27′ N/0°03′ E)1997–2017Summer0.15 (daily)[34]
Six Sites (Rural Sites)Xi an (32° 42′–33° 47′ N/107°44′–109°24′ E) 2011Summer0.1–3.8 (daytime)[35]
Jianfeng Mountain (Remote Site)HainanProvince (18° 40′ N, 108° 49′ E)2004Spring0.55 (daily)[36]
Tengchong Mountain (Remote Site)Yunnan Province (24° 570 N, 98° 29′ E)2004Spring0.08 (daily)[36]
Lin’an Station (Rural Site)Zhejiang Province (30° 30′ N, 119° 75′ E)2004Spring0.40 (daily)[36]
Tengyue Town (Urban Site)Yunnan Province (25° 01′ N, 98° 30′ E)2004Spring0.13 (daily)[36]
Peking University (Urban Site)Beijing (39° 59′ N/116° 18′ E)2008Summer0.45 (daily)[26]
3–4 km North of Downtown HoustonHouston (29° 47′ N/95° 21′ W)2008Summer0.63 (daily)[37]
GPACS (Suburban Site)Guangzhou (23° 00′ N/113° 21′ E)2011Spring0.40 (daily)This study
GPACS (Suburban Site)Guangzhou (23° 00′ N/113° 21′ E)2011Summer2.20 (daily)This study
GPACS (Suburban Site)Guangzhou (23° 00′ N/113° 21′ E)2011Autumn1.40 (daily)This study
GPACS (Suburban Site)Guangzhou (23° 00′ N/113° 21′ E)2011Winter0.13 (daily)This study

