1. Introduction
A low-level jet (LLJ) is a lower-tropospheric wind maximum, as opposed to its counterpart near the top of the troposphere, which is commonly referred to as the jet stream [
1]. While LLJs have been observed globally, the most prominent [
2,
3] and documented LLJs are found over the Great Plains of the central U.S. In the warm seasons, these Great Plains LLJs are responsible for the transport of warm, moist air from the Gulf of Mexico into the central U.S. and for contributing to the formation of thunderstorms and heavy precipitation in the region [
4,
5,
6]. In the cold seasons, LLJs bring cold and dry air from Canada into the Great Plains [
7] that can lead to excessively dry winters and more severe wildfires in the following spring seasons in the southern Great Plains [
8]. In addition to impacts on weather and climate, LLJs over the Great Plains are an important resource for wind energy in the region even though the phenomenon can generate turbulence that affects life span and efficiency of wind turbines [
9].
While processes in the upper atmosphere, such as the jet stream, have been found to contribute to their formation [
10], Great Plains LLJs are driven predominantly by diurnal oscillations in the lower planetary boundary layer; in particular, inertial oscillations due to a decoupling of surface friction from layers aloft, and thermal oscillations over sloping terrain. Consequently, changes in surface conditions are expected to modify the characteristics of LLJs. A number of studies have investigated how surface conditions, such as topography, vegetation, soil type, and soil moisture, might affect the characteristics of LLJs. Zhong et al. [
11] carried out a case study of a widespread LLJ episode over the Great Plains using hourly wind profiler data from 31 stations across the Plains and a high resolution numerical model. Their results suggested that diurnal thermal oscillations over sloping terrain played a secondary role in driving the LLJ case compared to inertial oscillations. Their results also indicated that drier soil tends to increase the amplitude of diurnal jet speed oscillations while wet soil appears to be associated with stronger rising motion downstream of the jet core. A study about the effect of soil moisture on LLJs was carried out by Fast and McCorcle [
12] using a two-dimensional atmospheric model linked with a hydrology model. They found that simulated jet characteristics exhibit a strong sensitivity to small changes in soil moisture content and distribution and, to a lesser extent, to changes in soil type. Parish and Oolman [
13] used the Weather Research and Forecasting Nonhydrostatic Mesoscale Model (WRF-NMM) to examine the importance of topography on LLJ formation and found that heating over sloping terrain leads to stronger background geostrophic flow that contributes to maximum simulated LLJs over the Great Plains through the inertial oscillation mechanism following the decoupling of the frictional layer from the free atmosphere above. Recently, Arcand et al. [
14] employed the WRF model to investigate how irrigation, a common practice in the southern Great Plains, may affect LLJ properties and identified changes in LLJ characteristics over and especially downstream of heavily irrigated regions.
Early climatological studies of LLJs relied exclusively on upper-air sounding data. Regarded as a landmark study of LLJ climatology in the U.S., Bonner [
2] was the first to analyze two-year twice-daily rawinsonde data from 47 upper-air stations across the U.S. with the purpose of documenting geographical and diurnal features of LLJs in the U.S. Bonner’s analysis revealed that LLJs over the U.S. occur most frequently over the south-central Great Plains, and jets in this core region are predominantly from the south in the early morning soundings, although they also occur in other directions, particularly from the north in the afternoon soundings. Whiteman et al. [
15] analyzed two-year rawinsonde data with enhanced temporal resolution of up to eight times per day at a site in north-central Oklahoma in the center of the maximum jet frequency region and identified the presence of a LLJ in 47% and 45% of the warm and cold season soundings, respectively. They also found that jets with southerly wind direction tend to occur in warm seasons and at night, and those with northerly winds, which are typically associated with southward moving cold fronts, occur year-round and at all times of the day. Walters et al. [
16] extended Bonner’s classic LLJ study to include 40-year rawinsonde observations at stations across the U.S. and produced an updated climatology of LLJ frequency, speed, direction, and jet height.
While the aforementioned rawinsonde-based LLJ analyses helped advance our knowledge about this weather phenomenon in the U.S., the conclusions are affected by the temporal and spatial resolution of the upper-air sounding network. Reanalysis datasets that emerged in late 1990s and that span multiple decades with better spatial and temporal resolution than that of sounding network could serve as an alternative for understanding the LLJ climatology. But before reanalysis data can be used for this purpose, the ability of reanalysis wind data to capture LLJ vertical structure as well as spatial and temporal variability needs to be evaluated. Walters et al. [
17] compared LLJ characteristics derived from the North American Regional Reanalysis (NARR; [
18]) with those based on rawinsonde observations at 12 stations for four representative years in the rawinsonde era. They showed that NARR wind data are capable of adequately capturing the observed spatial differences in the jet characteristics among the 12 stations and the diurnal variations between the two sounding times. They also noted that at most stations, the jet speed and height are in good agreement between NARR and the soundings, but NARR slightly underestimates the jet frequency. This favorable comparison between the NARR- and sounding-based jets paved the way for an improved understanding of the LLJ climatology for North America and its costal environments with better spatial and temporal resolution over a much longer time period [
3]. In addition to confirming many of the known features identified in earlier jet climatology studies, the updated LLJ climatology also revealed two additional jet frequency hot spots in central and southern Texas, among other features [
3]. The sounding-based climatology was used to evaluate the performance of a suite of regional climate models in simulating LLJ climatology over the central U.S., where LLJs are an important contributor to the region’s climate [
19].
Because of the role that LLJs play in shaping the climate of a region where LLJs are prevalent, understanding how the characteristics of LLJs may change as land-surface and atmospheric conditions change in the future is essential for future climate projections and climate adaptation for these regions. In one of the early studies of the potential impact of climate change on the Great Plains LLJs, Turner [
20] used an atmospheric boundary layer model forced by conditions similar to those predicted by global climate models to examine how jet characteristics may be altered under a doubled CO
2 scenario. The results revealed a decrease in jet strength with increasing temperature and stratification and decreasing diurnal temperature range and geopotential height gradient. More recently, Tang et al. [
21] assessed future changes in the Great Plains LLJ frequency using an eight-member ensemble of regional climate simulations for the mid-21st century. The models projected an increase in the jet frequency at night in the southern Great Plains in spring and in the central Great Plains in summer, but little to no change for daytime and cool-season jet frequency.
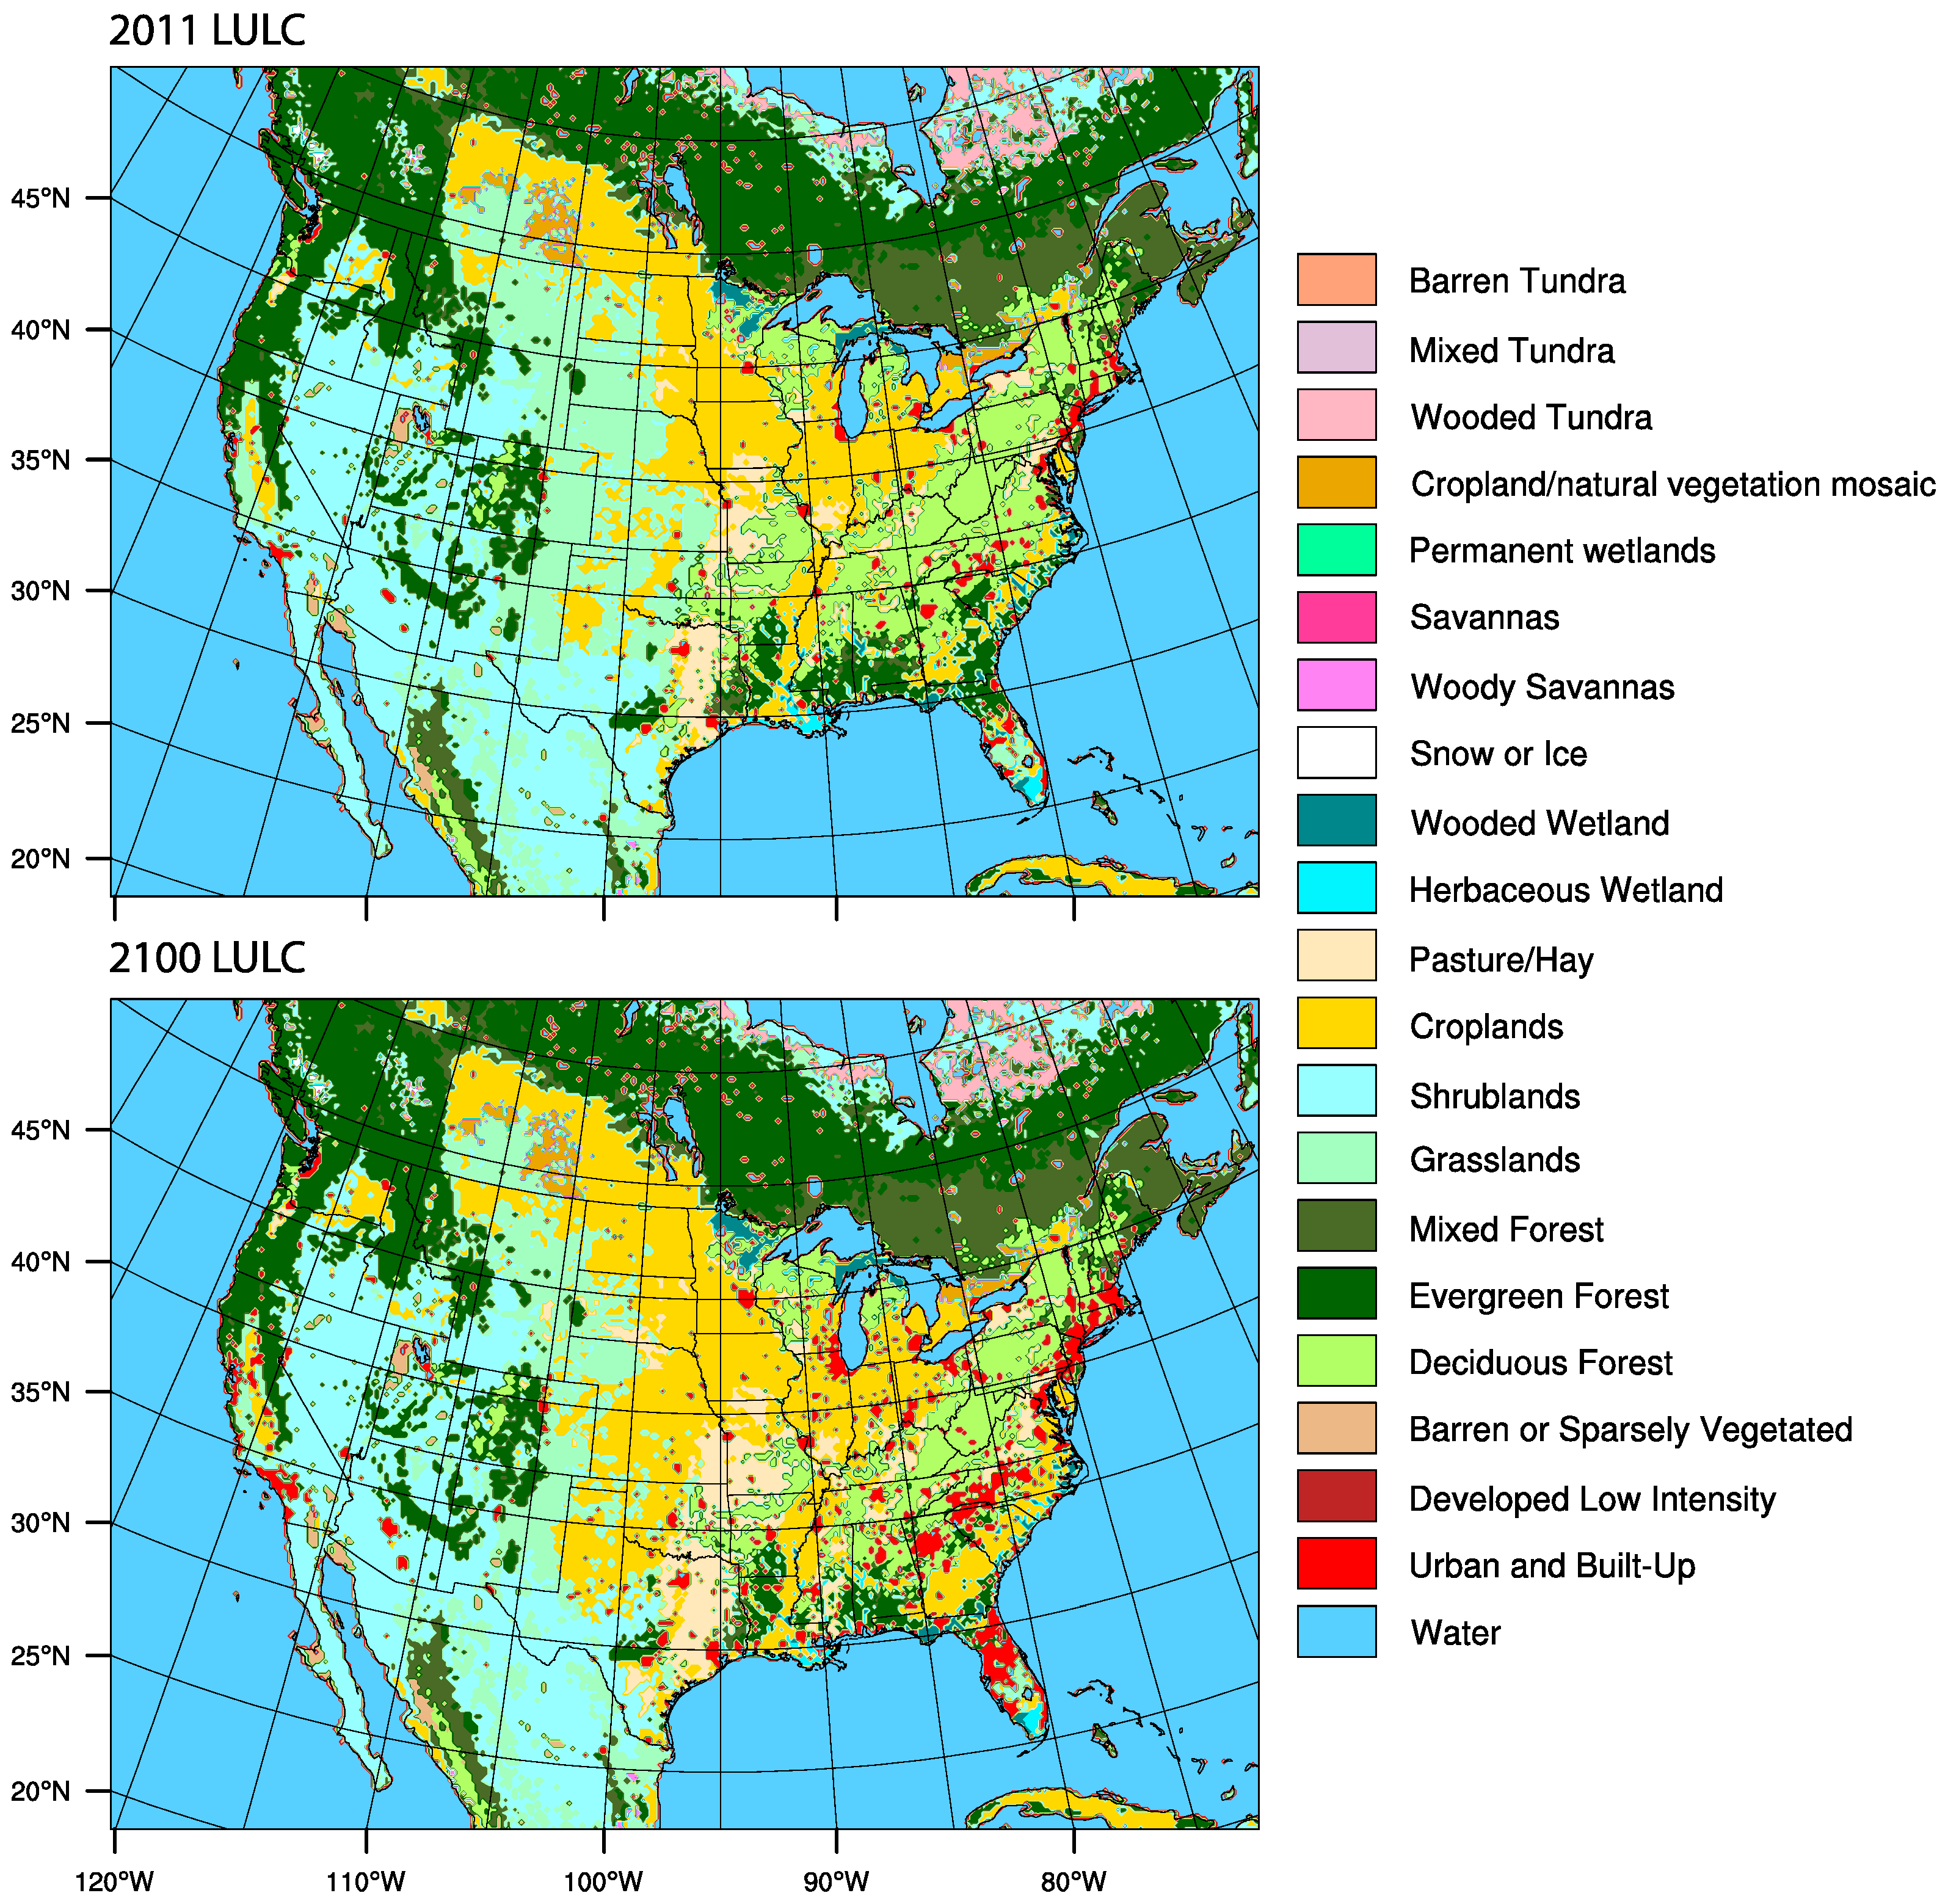
In this study, the potential impact of projected land-use and land-cover (LULC) change on LLJ climatology in the continental U.S. (CONUS) is investigated using regional climate simulations. It has been shown previously that LLJs are sensitive to surface parameters, such as soil moisture, roughness length, albedo, and heat storage, that depend heavily on LULC patterns [
12,
14,
20]. With the ongoing population and economic growth in the U.S., LULC is projected to change and the question is whether and how much the projected changes in LULC will modify or alter LLJ behavior in the U.S., especially over the central U.S. where jets are prevalent and significant changes in LULC are projected.
The rest of the paper is organized as follows. The approach taken to answer the above question, including the LULC data, the numerical model and model configuration, as well as climate simulations, are described in
Section 2. The simulation results are presented in
Section 3. The implication and limitation of the study are discussed in
Section 4, while the paper is concluded in
Section 5.
3. Results
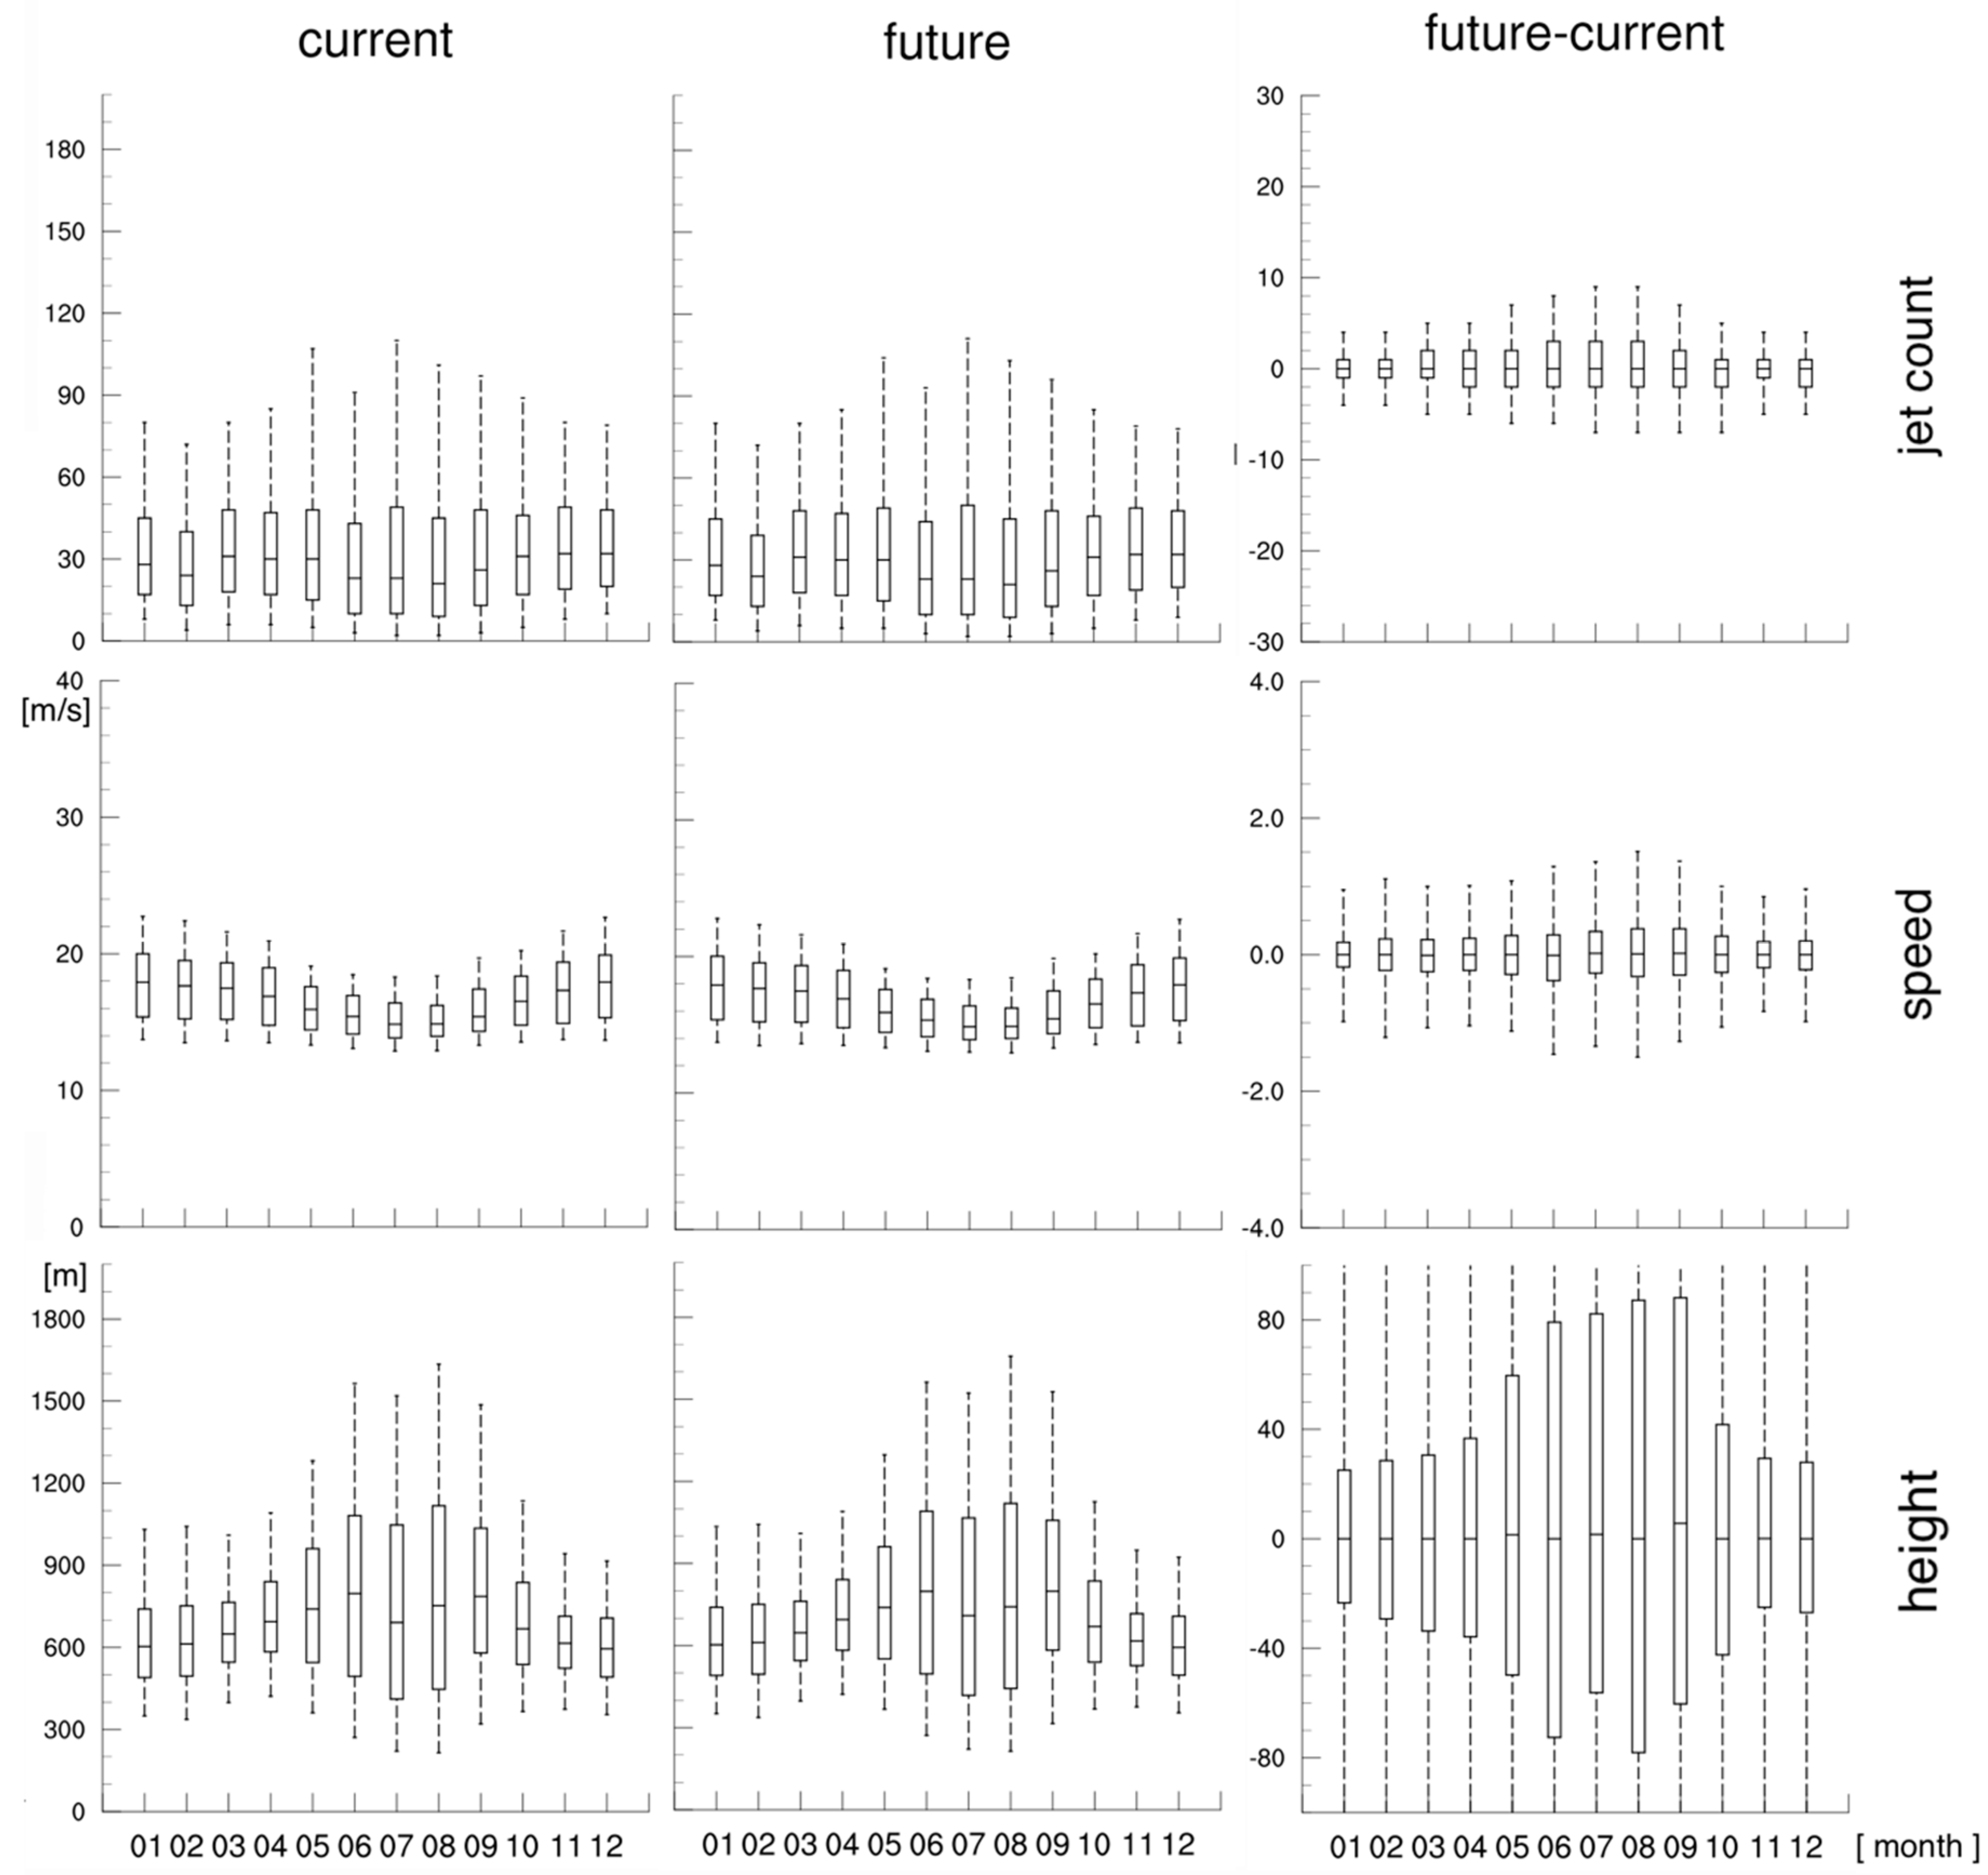
The simulated jet properties, including the number of jet occurrences and the maximum jet wind speeds and heights where the maximum occur, are examined for each month of the year and eight times per day. As indicated by the distribution of jet properties across all grid points in the modeling domain for each month at 00UTC for the current and future LULC and their differences (
Figure 2), all three properties exhibit a strong seasonal variability. A comparison of jet characteristics during different times of the day suggests the existence of a diurnal signature. Thus, the spatial patterns for the months of June (representing summer) and December (representing winter) at 00UTC (representing daytime) and 12UTC (representing nighttime) are presented below to highlight the differences in the response of the simulated LLJ properties to changes in LULC between the warm and cold season and between daytime and nighttime.
3.1. Number of Jet Occurrences
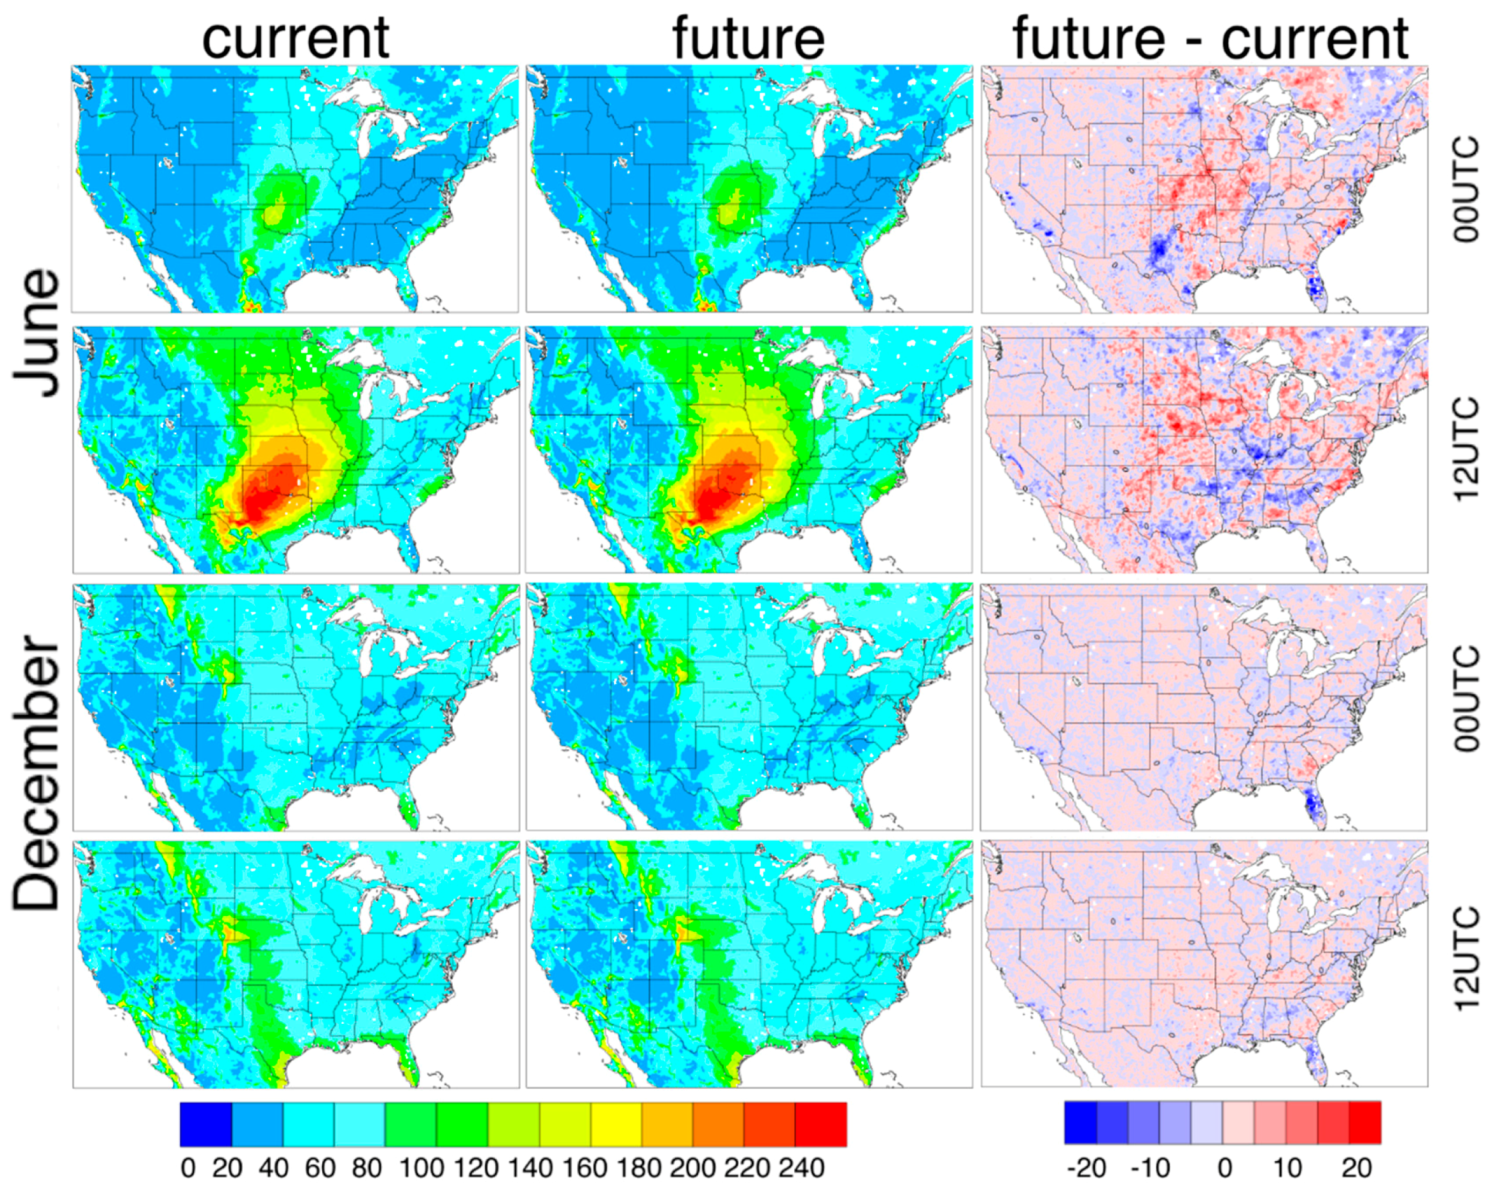
The spatial patterns of LLJ occurrences (
Figure 3) for the current LULC are significantly different between summer and winter and, to a lesser extent, between day and night. For summer, jets occur most frequently over the south-central Great Plains extending from Texas north-northeastward to Nebraska and Iowa. In addition to this core jet region over the Great Plains, higher jet counts are also seen along the South Atlantic coast and in isolated areas of southern California. Although the pattern remains similar between day and night, the nighttime jet number is much higher and the jet core region in the Great Plains is much bigger compared to daytime. These spatial and diurnal patterns are in good agreement with those identified in previous LLJ climatologies [
2,
3,
19], which lend confidence to the WRF model’s ability and the current model configuration’s ability to simulate LLJs. The pattern for winter jets is quite different from summer. While the number is relatively higher in the summer jet core region over the south-central Plains, the highest number of winter jets appears in Montana, Utah, and Colorado near the Rocky Mountains. The number is also relatively high along the Gulf Coast, especially southern Texas and Florida. Similar to summer, the jets are more frequent and widespread at night than day, but the amplitude of diurnal oscillation in winter is much smaller compared to summer.
The projected changes in LULC from current to future result in little difference in the overall spatial and diurnal patterns, but the number of jet occurrences is modified and the degree of the modification depends on the region. There is a clear signal of increased jet occurrences in areas where grassland is replaced by cropland (e.g., the jet core regions in Oklahoma and Kansas of the southern and central Plains) and areas where mixed forest is replaced by cropland (i.e., the southern parts of the South Atlantic states, such as southern Georgia and eastern Carolinas), and a decreased jet occurrence in areas of increased urbanization (e.g., northern Florida and northern parts of the southern Atlantic states, such as western Carolinas as well as in southern and central California). The influence of LULC change on jet occurrences extends beyond the areas where significant LULC changes occur, due possibly to land–atmosphere interactions and the effects of LULC changes on larger-scale atmospheric environments. Overall in summer, larger changes occur over the central and eastern U.S. where jets are more frequent. There is a general increase in jet occurrences in the jet core region over the southern and central Plains and a decrease in the region to the east of it over the Midwest, especially the Ohio River Valley. In winter, larger changes are found in the Southeast, particularly over Florida. It is interesting to note that the differences in jet occurrences between current and future LULC are small in the areas of the Rockies where winter jets are most frequent. This might be due to the fact that these LLJs are most likely downslope wind storms in winter resulting from strong synoptic flows interacting with high mountain barriers. The magnitudes of the changes are considerably larger in summer than in winter, indicating stronger sensitivity of summertime jet occurrences to changes in LULC. This is no surprise considering that LLJs in the summer season are driven predominantly by inertial and thermal oscillations of surface forcing, while jets in winter are typically associated with synoptic weather fronts [
15]. Florida is an exception to this general rule, possibly due to the relatively small seasonality of its climate.
3.2. Maximum Jet Speed
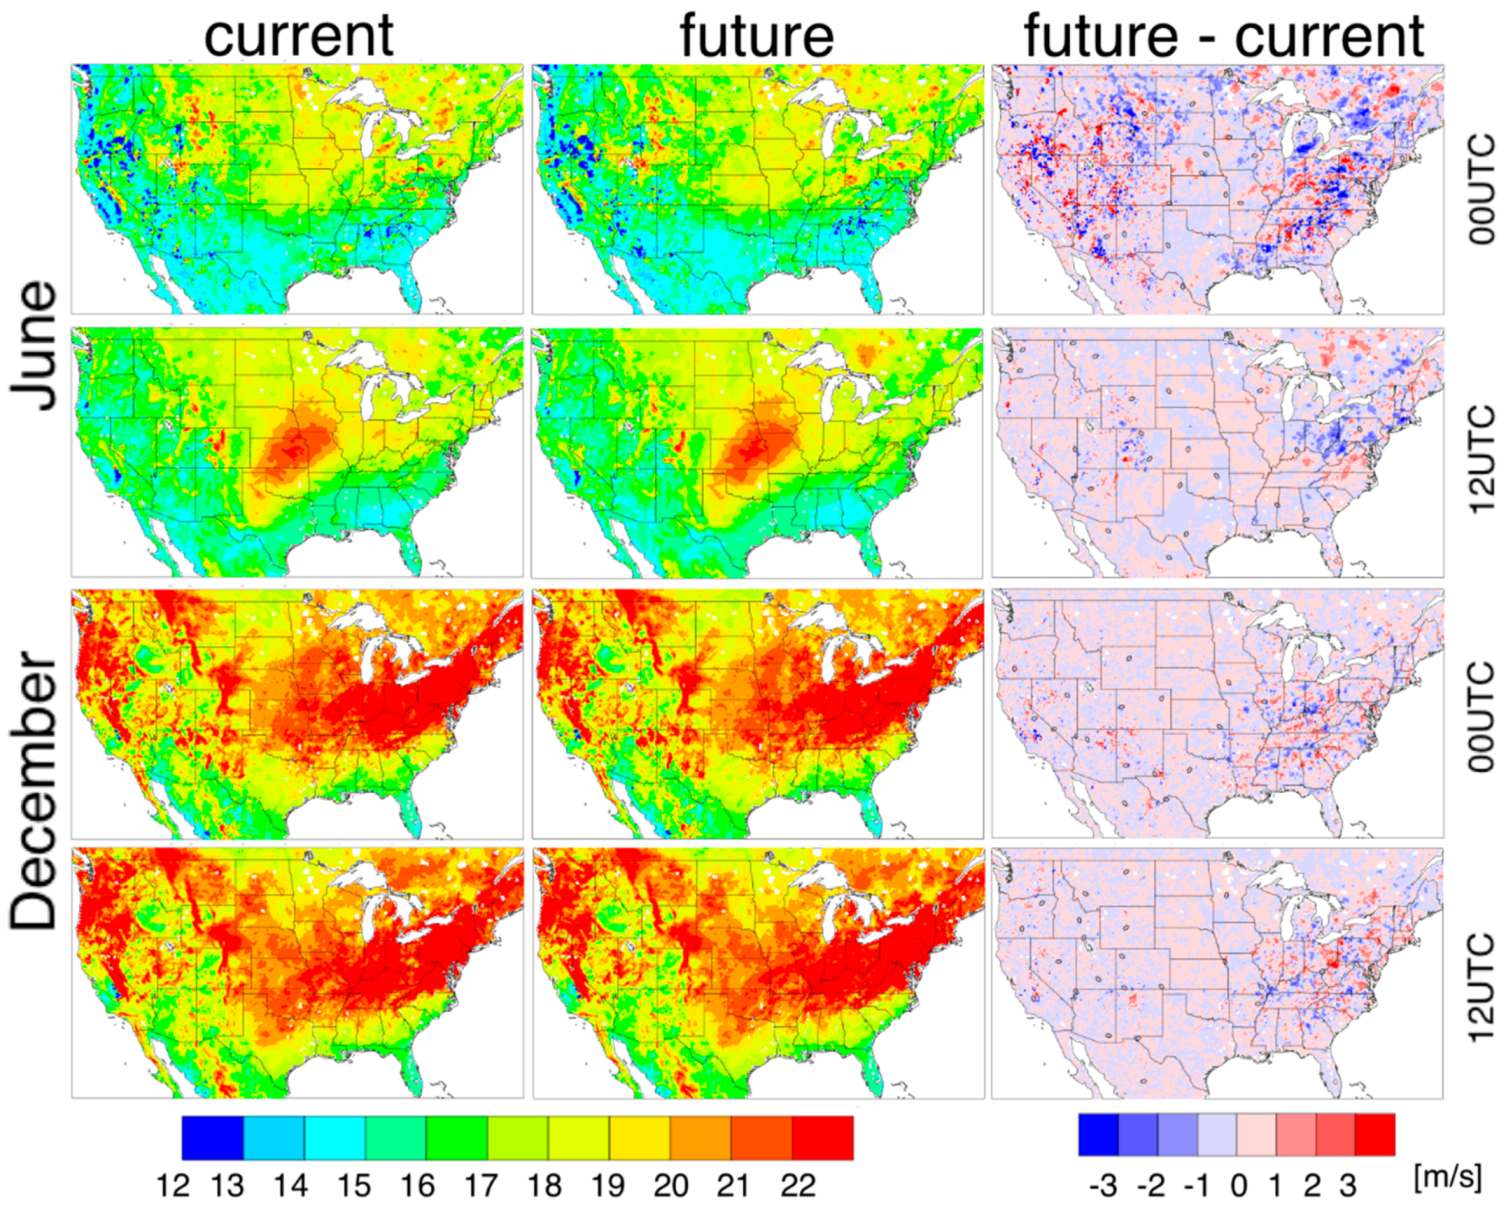
In contrast to the number of jet occurrences, which is higher in summer than in winter, the maximum jet speeds (
Figure 4) are much higher in winter than in summer nearly everywhere except for the jet core area at night where the speeds are comparable between the two seasons. Similar to the jet number, winter-season jet speeds show little diurnal variation in both the spatial distribution and magnitude, but summertime jet speeds exhibit strong seasonal and diurnal variability, with high nocturnal jet speeds limited to the jet core region in the south-central Great Plains but strong daytime jets scattered in small areas of the Rocky Mountains. Regions of stronger wintertime jets extend from the upper South Central and Southeast to the lower Midwest and Northeast, reflecting the paths of wintertime cold fronts [
15]. In the West, stronger jets appear to be associated with the three major mountain ranges: The Cascades, Sierra Nevada and the Rocky Mountains. These spatial distributions and the magnitudes of monthly mean maximum jet speeds are consistent with the NARR-derived [
3] and the multiple model-simulated [
21] LLJ climatologies.
The changes in the maximum jet speed between the current and future LULC simulations show substantially larger spatial and diurnal variability in the summer than in winter. The speed differences in winter jets, both daytime and nocturnal, are generally within ±1 m s−1 over the central and western U.S., increasing to ±3 m s−1 or larger in eastern U.S., especially over upper Southeast and the Ohio River Valley in the lower Midwest, where maximum jet speeds are higher. It is interesting to note that, similar to the number of jet occurrences mentioned above, the areas in proximity to the large mountain ranges in the West where the highest winter jet speeds occur see little change in wind speed between the current and future LULC simulations, further suggesting that LLJs resulting from interactions of large-scale flows and major mountain barriers are not sensitive to the LULC changes. In summer, the speed differences in nocturnal jets also fall within ±1 m s−1 across most of the U.S., except for the Ohio River Valley, parts of the Northeast, and isolated areas in the Intermountain West, where the differences increase to ±2 m s−1 or larger. The speed differences are much larger in daytime summer jets where values of ±3 m s−1 or greater occur across the U.S., except for the Great Plains. In regions with larger changes in wind speed, there is a strong spatial heterogeneity in both the magnitude and direction of change. While there is some indication of reduced jet speed in areas affected by urban expansion, such as those in the Ohio River Valley and upper Southeast, and slightly increased jet speed where cropland replaces grassland in the Great Plains, the relationship is weak, especially for winter-season jets.
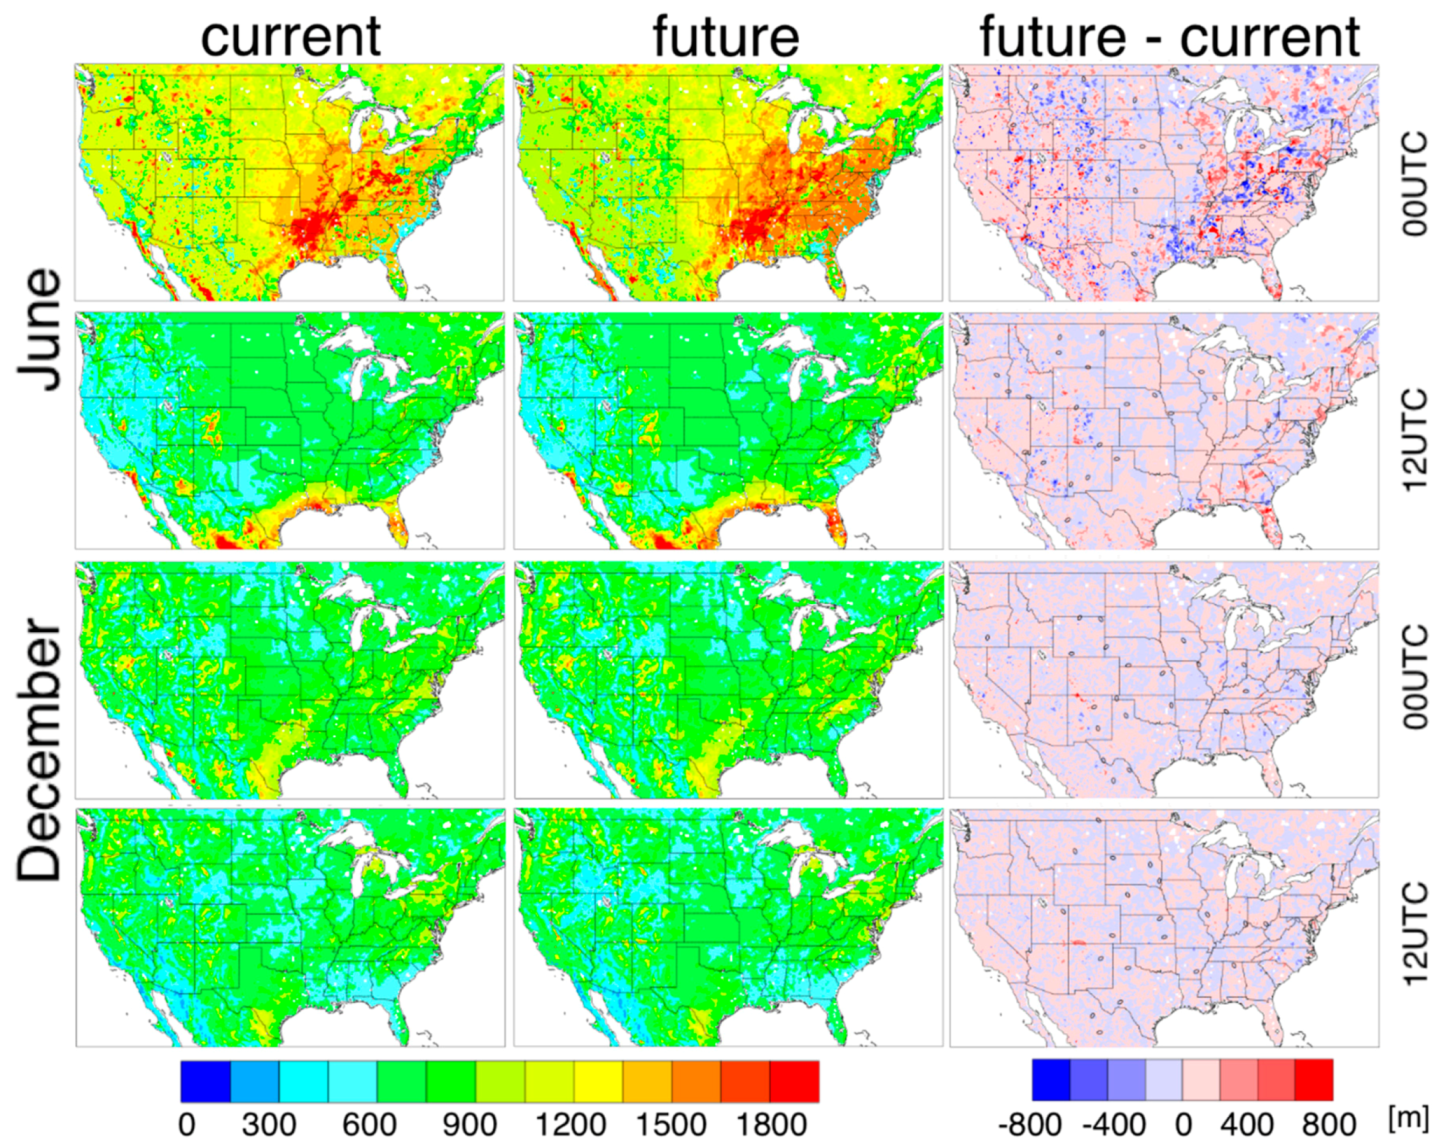
3.3. Elevation of Maximum Jet Speed
Maximum speed of the LLJ, sometimes referred to as a jet nose [
16], can appear at different elevations above the ground level (AGL) (
Figure 5). The maximum jet speeds appear to occur at higher elevations in summer than in winter and during the day than at night. In summer, the daytime jet noses appear higher (>1200 m AGL) across the upper Southeast and lower Midwest and Northeast, while they occur at lower elevations (<600 m AGL) along the Atlantic Coast, parts of Georgia and Florida, and areas in the Intermountain West. The nocturnal summer jets occur generally below 800 m AGL, with the exception of the Gulf Coast, Florida, and a few areas in the West where jet elevation can exceed 1500 m AGL. Winter-season jet heights occur at lower elevations, generally between 500–1000 m AGL, and have smaller spatial and diurnal variability.
The spatial patterns of the elevation differences between the current and future LULC simulations are quite similar to those of speed differences. In winter, the differences in the jet nose heights are small, between ±200 m, for both daytime and nighttime jets. In summer, the differences in the nocturnal jet nose heights also are small over the central U.S., but are slightly larger and more variable in the eastern and western U.S. Large differences of ±600 m are seen for daytime summer jet noses and, similar to the jet speed difference, the magnitudes are larger with greater variation in the eastern and western U.S. and smaller and less variable over the central and northern Plains.
There is no obvious link between jet nose height and LULC change at a given location except for a weak indication of an increase in jet nose height with urban expansion, as reflected in areas of Florida, Georgia, eastern Carolinas, and the Ohio River Valley. Similar to jet speed, the effect on jet height seems stronger in summer than in winter.
4. Discussion
There is some evidence that the conversion of grasslands into croplands in the jet core region over the south-central Great Plains in the future would likely lead to an increase in jet occurrences and a slight increase in maximum speed, while urban expansion would likely reduce jet occurrences and jet speed and increase jet height. The evidence, however, is weak especially for daytime and winter jets that are driven largely by large-scale forcing.
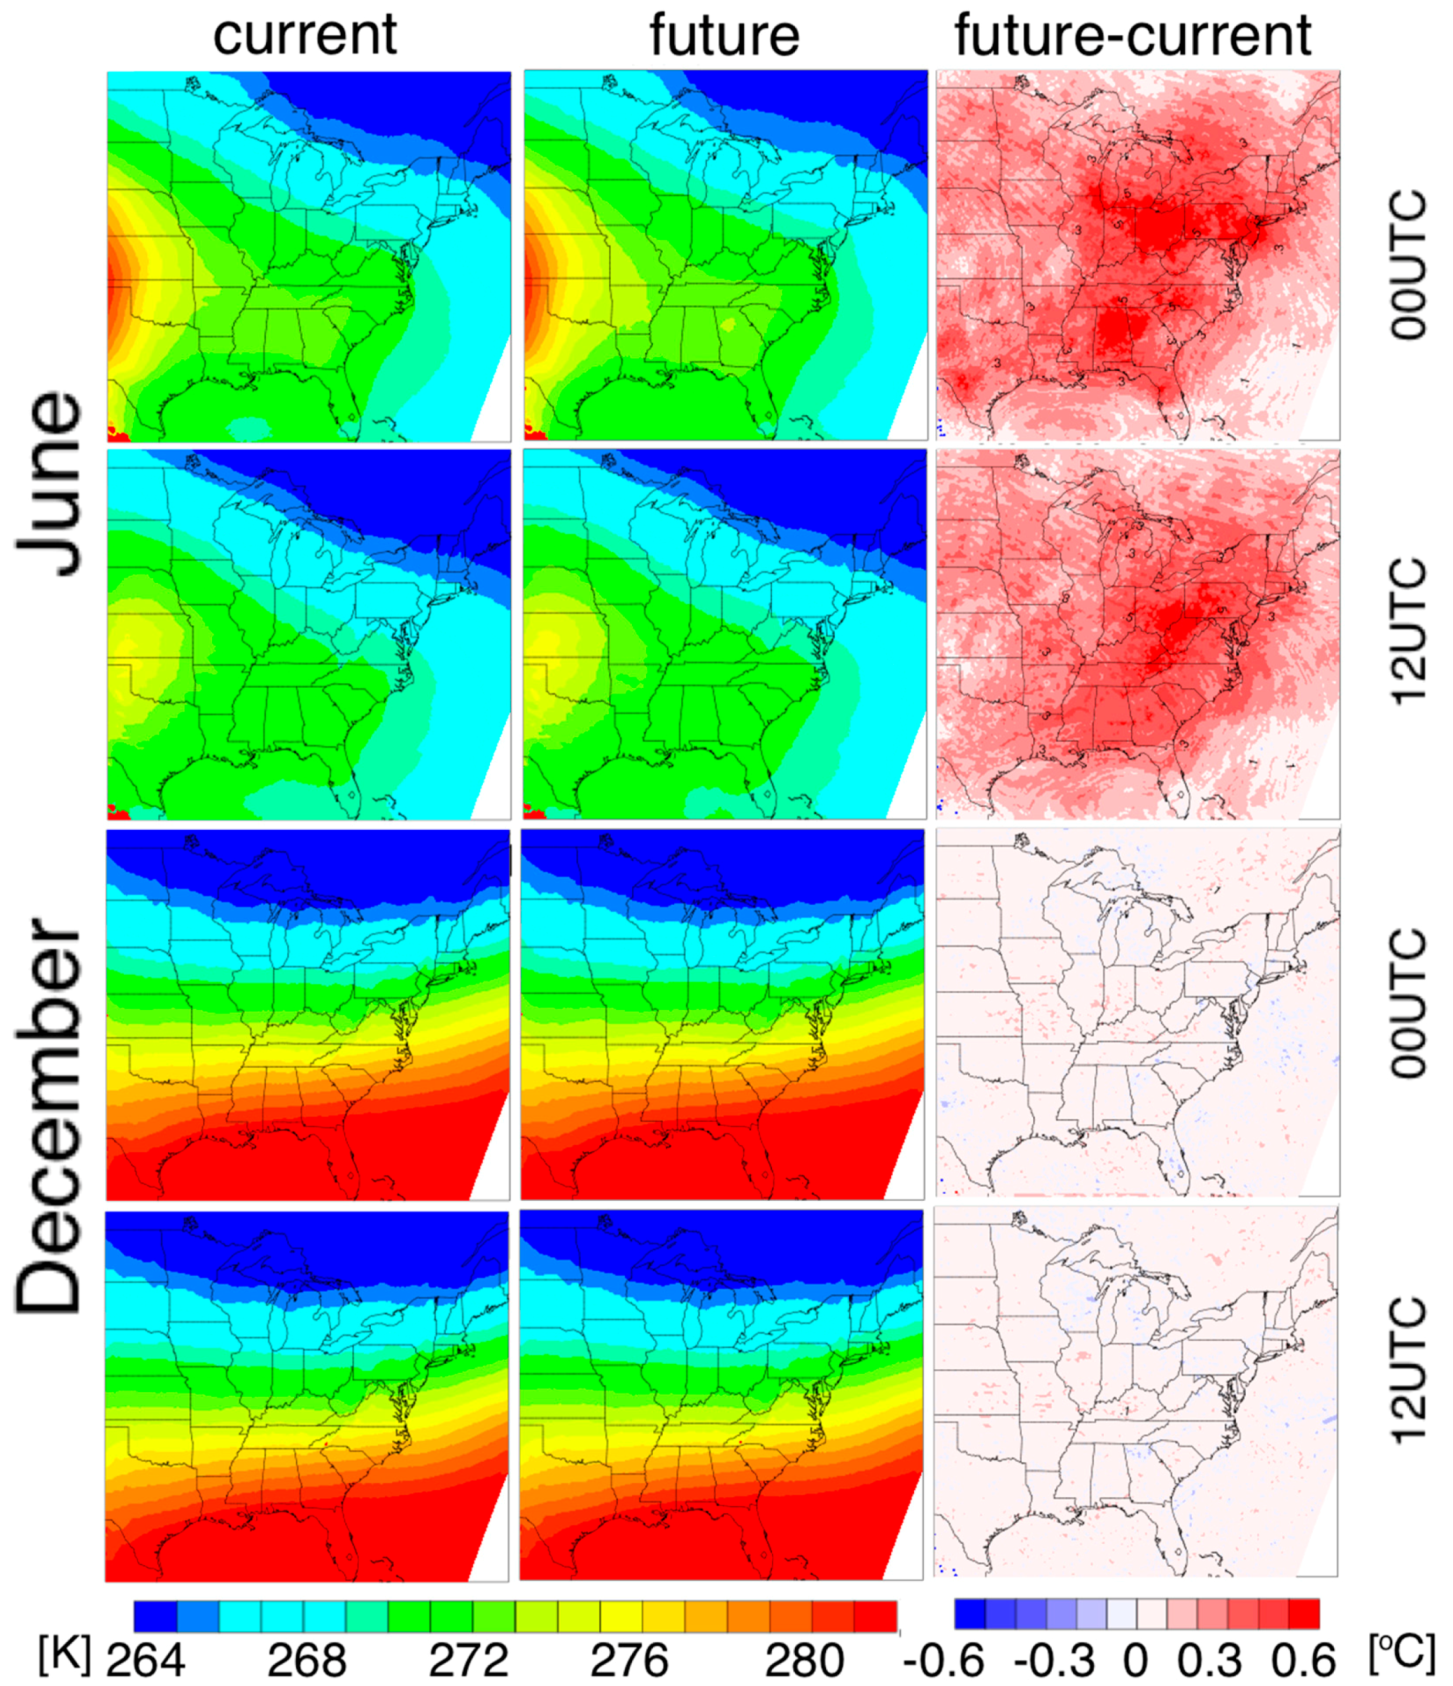
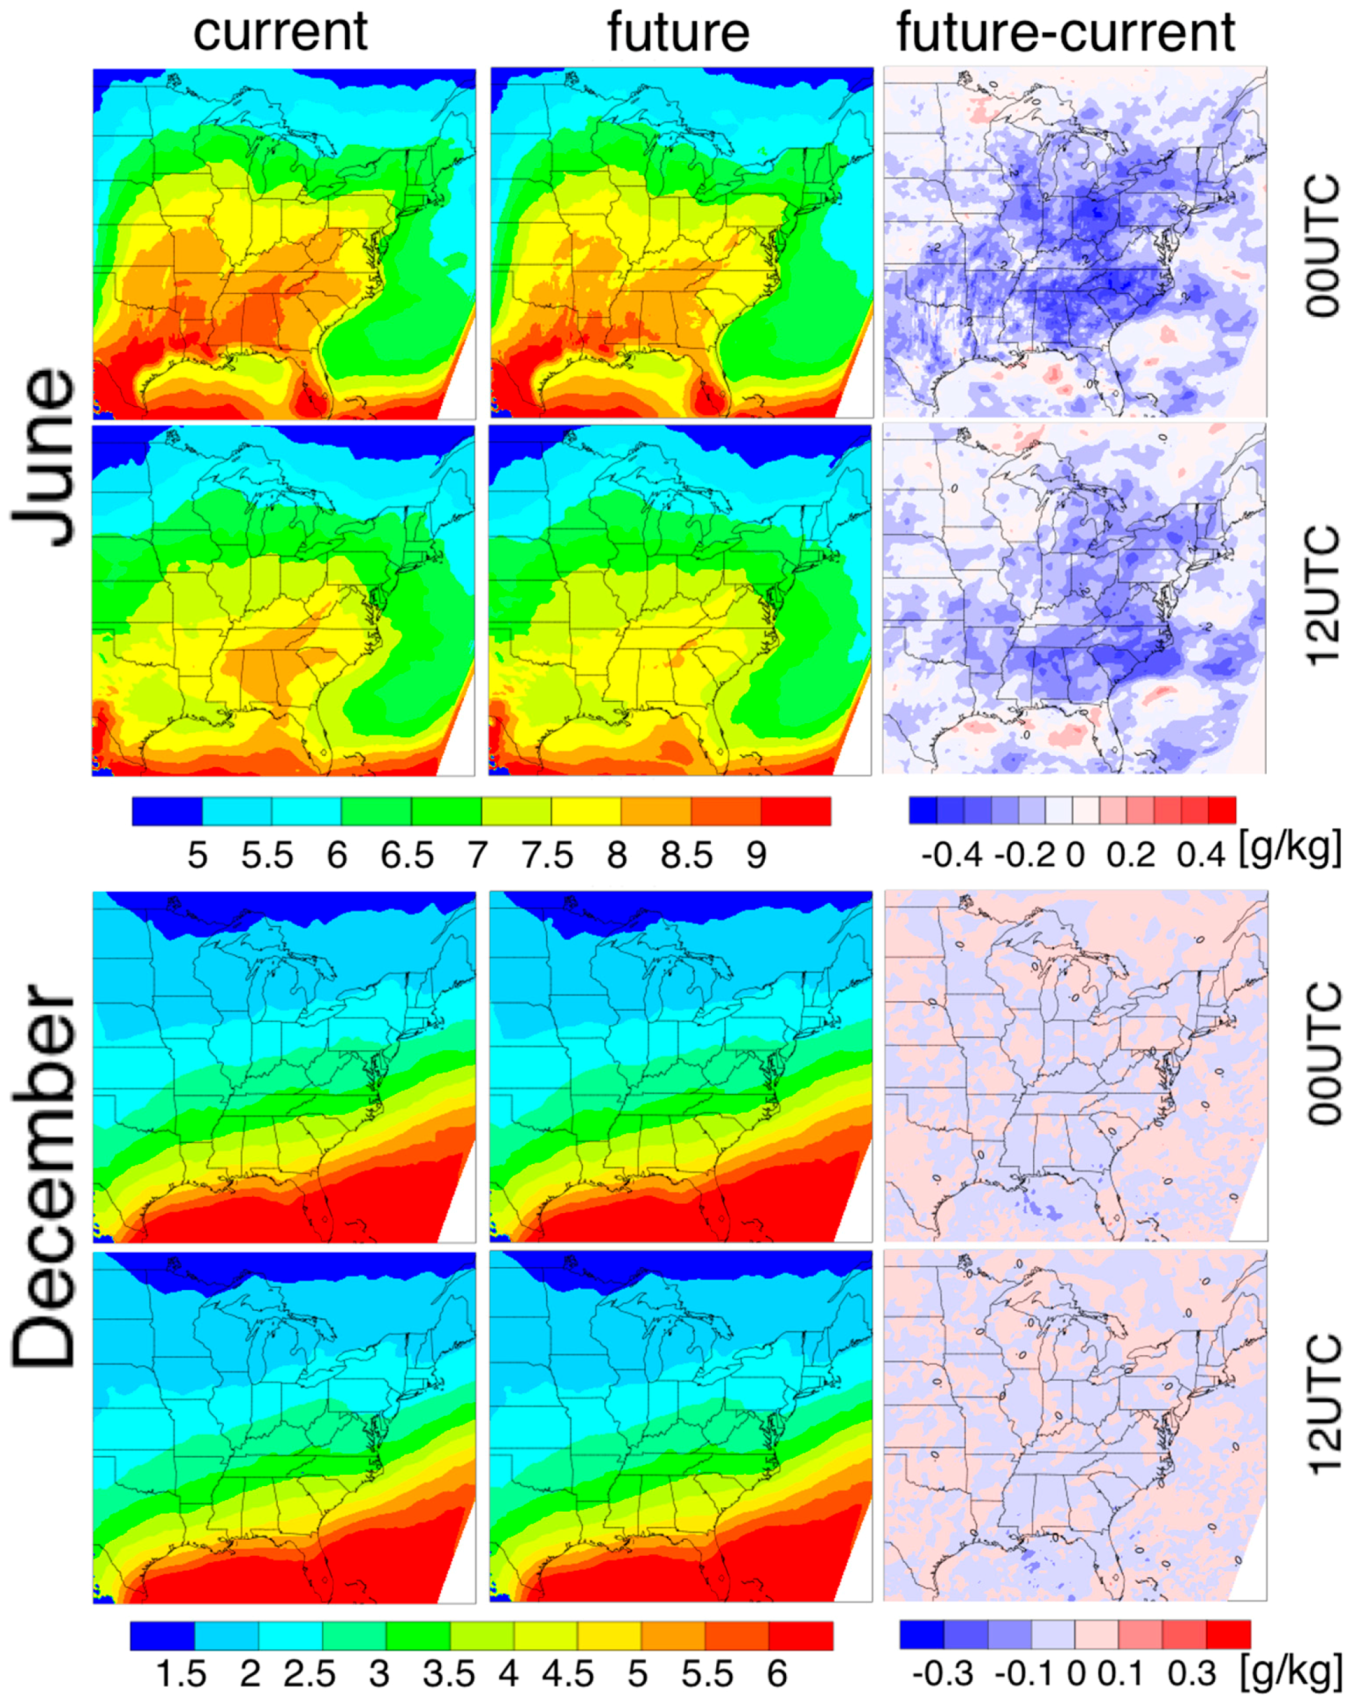
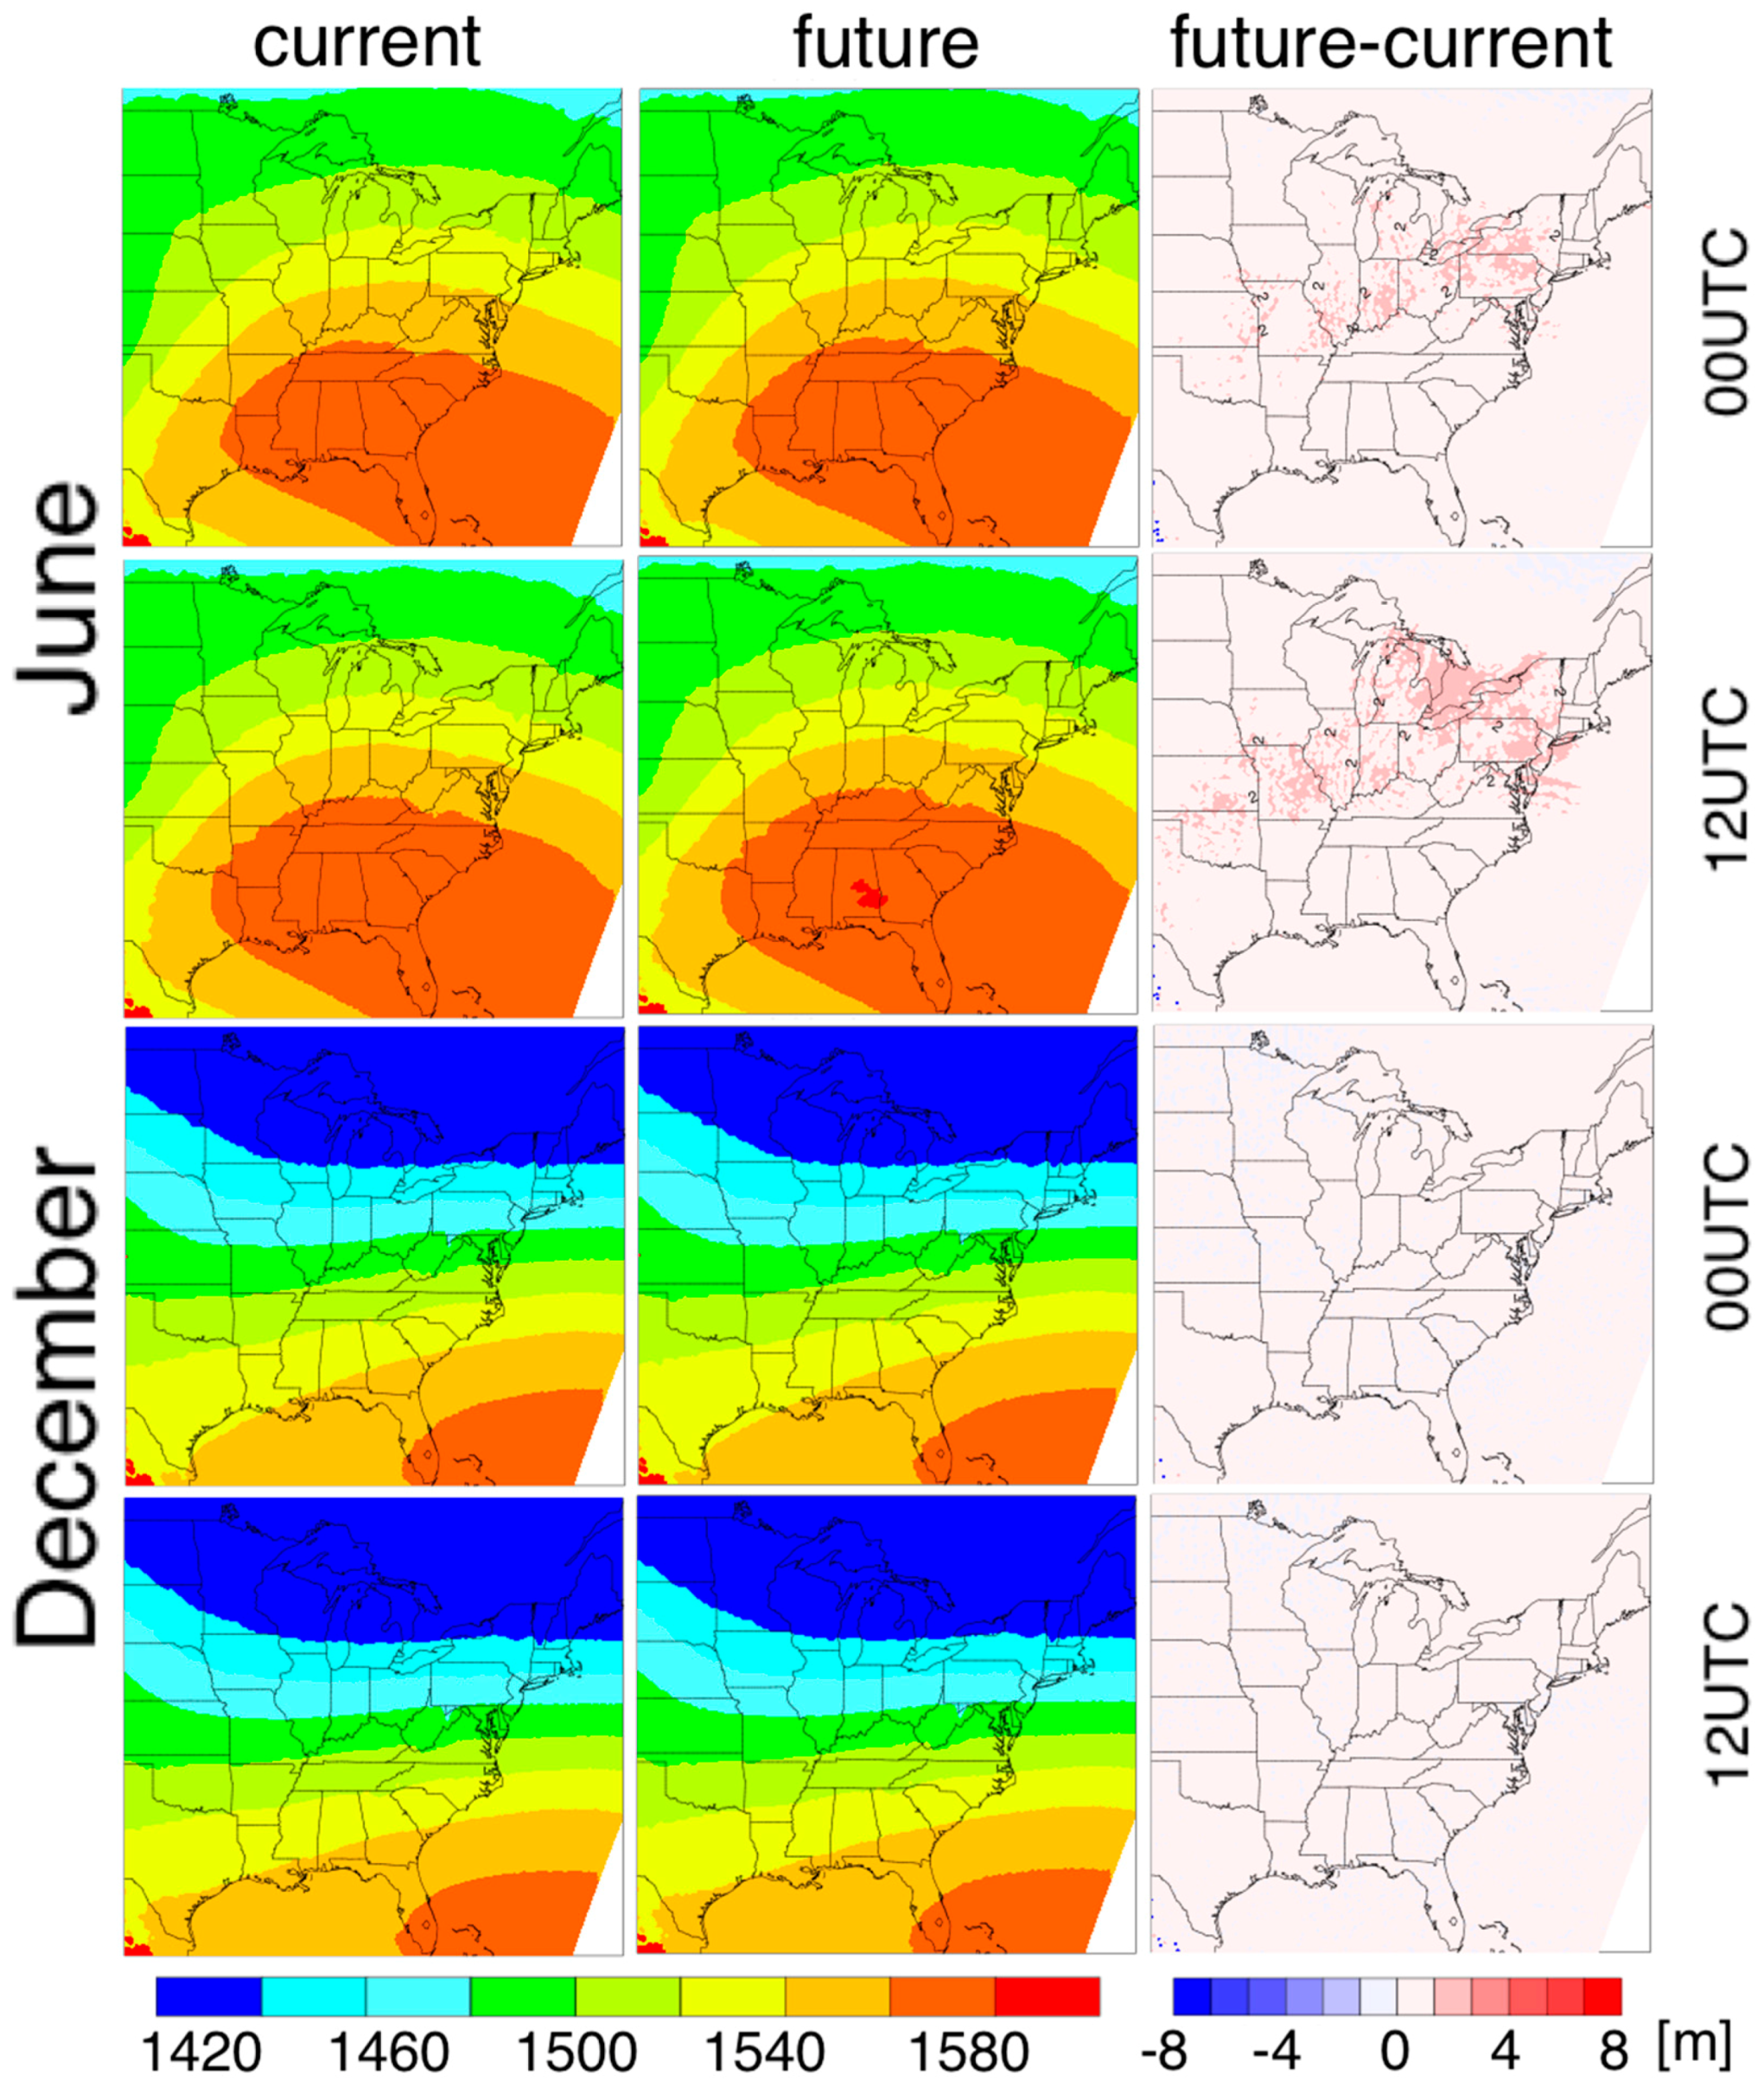
The effects of LULC on large-scale atmospheric environments are illustrated in
Figure 6,
Figure 7 and
Figure 8, which show the 850 hPa temperature, moisture, and geopotential height fields corresponding to the current and future LULC patterns and their differences over the eastern half of the U.S. (terrain elevations over portions of the western U.S. exceed the 850 hPa height levels). As one can see, changes in LULC, which are limited only to certain areas, result in widespread increases in 850 hPa temperatures and geopotential heights and decrease in moisture, although the magnitudes of the differences are small. For all three fields, seasonal variations in the magnitudes of the LULC-induced differences overwhelm the diurnal signal. Larger differences are found in summer than winter and in the Ohio River Valley and upper Southeast, which is generally consistent with the pattern in the LULC-induced changes in jet properties (such as jet occurrence, speed, and height) since warmer temperature increases daytime boundary layer heights and decreases nocturnal inversion, resulting in weaker jets at higher heights.
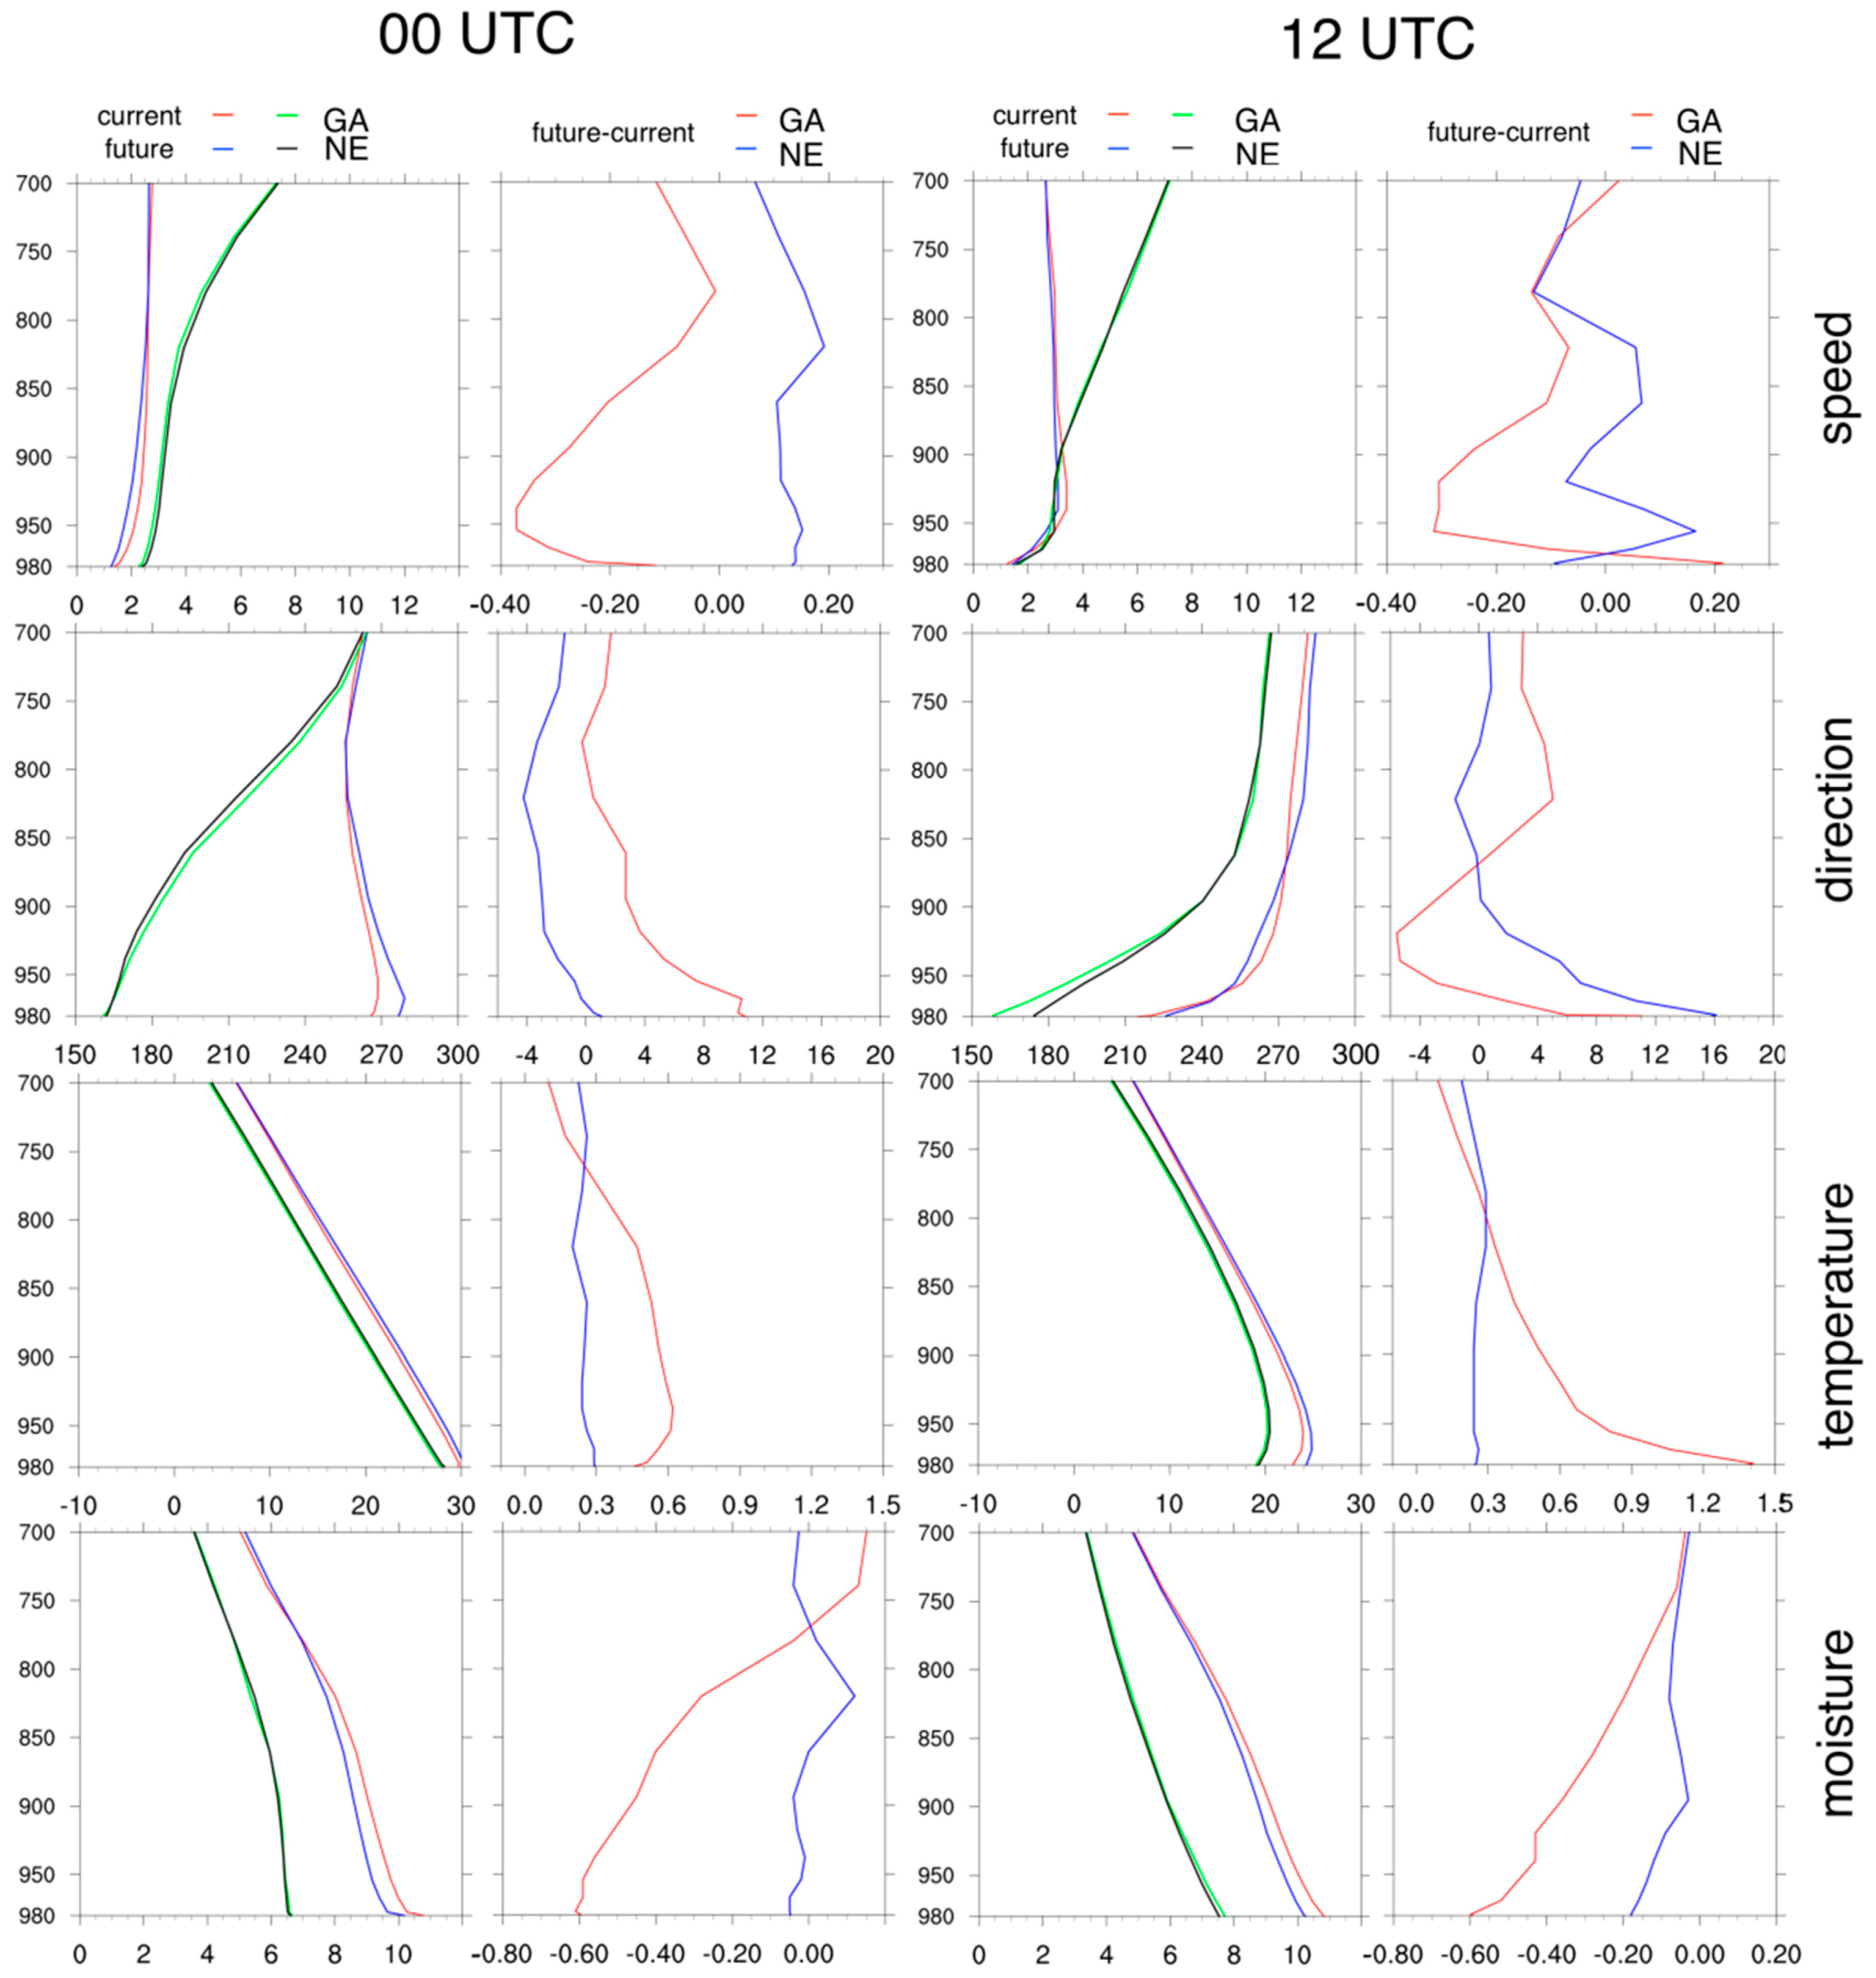
The overall warming and drying effects occur in a deep layer in the lower troposphere, as revealed by the vertical profiles at two locations, one near Atlanta, Georgia where significant urban expansion occurs and another next to North Platte in central Nebraska where cropland replaces grassland (
Figure 9). The profiles, obtained by averaging all profiles for the month of June at 00UTC and 12UTC, represent the influence of LULC on averaged vertical atmospheric structure at these locations. As expected, the LULC-induced changes decrease with height and with maximum values near the surface. For both day and night, the warming and drying effect is considerably stronger at the Georgia site affected by urban expansion than at the Nebraska site influenced by grassland–cropland conversion, which is in agreement with the relative magnitude of changes in jet speed and heights at these locations. There is a general decrease in wind speed at the Georgia site, except for surface wind at night, and a slight increase at the Nebraska site, which is largely consistent with the changes in roughness length due to LUCL changes at the two sites.
While case studies or short-term simulations assuming idealized atmospheric and/or land-surface conditions have proven useful for understanding how LULC changes might affect local or regional atmospheric processes, such as the LLJs [
11,
12,
13], failure to capture the influence of LULC changes on larger-scale atmospheric environments through complex land–atmosphere interactions may lead to inaccurate results (most likely, an overestimation of the local response). Following this argument, a noted limitation of the current study is that the two 10-year climate simulations are driven by the same current climate conditions (2006–2015) derived from NARR. Thus, the results should be interpreted with the understanding that the projected changes in the LLJ properties are due solely to changes in the LULC patterns without considering future changes in climate conditions.
5. Conclusions
In this study, 10-year (2006–2015) regional climate simulations driven by the NARR reanalysis are performed with the current (2011) and future (2100) LULC patterns to assess the sensitivity of LLJ properties, including number of occurrences, maximum wind speeds, and the elevation where the maximum wind speed occurs to projected LULC changes over the CONUS. The simulation results suggest that winter-season jet properties are less sensitive to the LULC change than summertime jets. In summer, the jet core region over the Great Plains where grasslands are projected to be replaced with croplands is likely to see an increase in the number of jet occurrences and the areas affected by urbanization (e.g., northern Florida and northern parts of the southern Atlantic states) are likely to see a decrease in jet occurrences under the same regional climate forcing. In winter, the number of jets in areas of the Rocky Mountains and along the Gulf Coast where LLJs are most frequent will likely remain similar between the current and future LULC conditions. Somewhat larger changes, both increases and decreases in the jet count, are expected over eastern portions of the lower Midwest and upper Southeast where winter jets are less frequent. The state of Florida, where widespread urban expansion is projected in the future, is likely to experience a decrease in the number of jet occurrences in both winter and summer. The reduction is larger for daytime jets than for nocturnal jets.
For both jet maximum speed and the elevation of the maximum, large differences tend to appear in areas of the eastern portion of lower Midwest, particularly the Ohio River Valley, upper Southeast, and the Intermountain West, where jets are less frequent. In areas where jets are more prevalent, such as the Great Plains in summer and the Rockies and Gulf Coast in winter, the differences are small (±1 m s−1, ±200 m). The largest differences and strongest spatial variability for both speed and elevation are seen for summer season daytime jets. Although there is some evidence of weaker, more elevated jets associated with urban expansion, the connection between changes in jet speed and elevation and changes in LULC patterns at a given location is weak. This, together with the strong spatial variability, highlights the complexity of multi-scale land–atmosphere interactions and the need for capturing the influence of LULC on regional and synoptic-scale forcing for LLJs.

 ,
, 