Abstract
The atmospheric teleconnection pattern reflects large-scale variations in the atmospheric wave and jet stream, and has pronounced impacts on climate mean and extremes over various regions. This study compares those patterns that have significant circulation anomalies over the North Pacific–North American–North Atlantic sector, which directly influence surface temperature and temperature extremes over North America. We analyze the pattern associated anomalies of surface temperature and warm and cold extremes over North America, during the northern winter and summer seasons. In particular, we assess the robustness of the regional temperature and temperature extreme anomaly patterns by evaluating the field significance of these anomalies over North America, and quantify the percentages of North American temperature and temperature extreme variances explained by these patterns. The surface temperature anomalies in association with the Pacific–North American pattern (PNA), Tropical–Northern Hemisphere pattern (TNH), North Pacific pattern (NP), North Atlantic Oscillation (NAO), Arctic Oscillation (AO), Western Pacific pattern (WP), circumglobal teleconnection (CGT), and Asian–Bering–North American (ABNA) patterns are similar to those reported in previous studies based on various datasets, indicating the robustness of the results. During winter, the temperature anomaly patterns considered are field significant at the 5% level over North America, except the WP-related one. These pattern associated anomalies explained about 5–15% of the total interannual temperature variance over North America, with relatively high percentages for the ABNA and PNA patterns, and low for the WP pattern. The pattern associated warm and cold extreme anomalies resemble the corresponding surface mean temperature anomaly patterns, with differences mainly in magnitude of the anomalies. Most of the anomalous extreme patterns are field significant at the 5% level, except the WP-related patterns. These extreme anomalies explain about 5–20% of the total interannual variance over North America. During summer, the pattern-related circulation and surface temperature anomalies are weaker than those in winter. Nevertheless, all of the pattern associated temperature anomalies are of field significance at the 5% level over North America, except the PNA-related one, and explain about 5–10% of the interannual variance. In addition, the temperature extreme anomalies, in association with the circulation patterns, are comparable in summer and winter. Over North America, the NP-, WP-, ABNA-, and CGT-associated anomalies of warm extremes are field significant at the 5% level and explain about 5–15% of the interannual variance. Most of the pattern associated cold extreme anomalies are field significant at the 5% level, except the PNA and NAO related anomalies, and also explain about 5–15% of the interannual variance over North America.
1. Introduction
The low frequency (approximately a week or longer) variability of the tropospheric circulation can often be characterized by atmospheric teleconnections [1], which are patterns of variability, consisting of correlated spatial anomalies of the large-scale circulation. Improved observations in the 1980s allowed detailed detection of teleconnections at larger distances throughout the troposphere [2,3,4,5]. Nevertheless, additional patterns have continued to be proposed, due to several reasons [6], including ongoing and larger collection of observational data, analysis of new variables [6,7], and relating teleconnections to specific aspects of global/regional climate variability [8,9]. The teleconnection pattern can be internal to the atmosphere, especially with interactions between transient eddies and the mean atmospheric flow, which are mutually reinforcing, as well as generated by external forces, such as the sea surface temperature fluctuation in the tropical Pacific, through the dispersion of Rossby waves [10,11,12,13,14,15].
The teleconnection pattern reflects large-scale changes in the atmospheric wave and jet stream patterns, and hence, has pronounced influences on temperature, precipitation, and storm tracks over various regions of the globe [15,16,17,18]. In particular, the exchange of mid-high latitude air implies a change in temperature advection, which influences and partially supports surface temperature changes. In this study, we examine and compare those patterns that have significant circulation anomalies over the North Pacific–North American–North Atlantic sector, as listed in the next section, which tend to influence the temperature and temperature extremes over North America.
In the results section, first, the Northern Hemisphere (NH) atmospheric circulation patterns considered will be briefly described. We then analyze and compare the pattern associated surface temperature and temperature extreme anomalies, assess the field significance of these anomalies over North America, and quantify the percentages of North American temperature and temperature extreme variances explained by these patterns. These last two aspects of the pattern influence, in terms of the robustness of the results, have not yet received much attention in previous studies. We analyze the results during the northern winter and summer seasons. However, for the sake of brevity, discussions will be largely confined to the northern winter.
2. Data and Methodology
2.1. Data and Teleconnection Indices
The analysis is based on monthly mean surface air temperature, geopotential, and horizontal winds in the troposphere, obtained from the National Centers for Environmental Prediction/National Center for Atmospheric Research (NCEP/NCAR) reanalysis (NCEP hereafter) [19] on the standard 2.5° × 2.5° grid. The North American surface temperature extremes employed are temperature extreme indices, extracted from the observational extreme dataset HadEX2 [20] with 2.5° × 3.75° (latitude–longitude) grids. The indices we used consist of the warm extremes when daily maximum temperature is greater than its 90th percentile termed TX90p, and the cold extremes at which daily maximum temperature is less than its 10th percentile TX10p. The same applies when daily minimum temperature is greater than its 90th percentile termed TN90p, and the cold extremes at which daily minimum temperature is less than its 10th percentile TN10p. To characterize the seasonality, winter is defined as December to February (DJF) and summer as June to August (JJA). In addition, given the large changes in the global atmospheric observing system in the 1970s [21], such as the introduction of satellite data in 1979, we use the more reliable and recent 36 DJFs and JJAs of surface temperature, geopotential, and winds from 1980 to 2015, and 31 DJFs and JJAs of temperature extremes from 1980 to 2010. Here, years are in reference to the January dates.
The atmospheric circulation pattern indices employed were mainly downloaded from the Climate Prediction Center (CPC) of the National Oceanic and Atmospheric Administration (NOAA) website (http://www.cpc.ncep.noaa.gov/data/indices), including the monthly Pacific–North American pattern (PNA) [3], Tropical–Northern Hemisphere pattern (TNH) [4], Western Pacific pattern (WP) [3], North Atlantic Oscillation (NAO) [22], and Arctic Oscillation (AO) [23] indices. The patterns of PNA, TNH, WP, and NAO are identified by a Rotated Principal Component Analysis (RPCA) of monthly mean standardized 500-hPa height anomalies over the NH, as detailed on the CPC’s website. The AO pattern is defined as the leading Empirical Orthogonal Function (EOF) mode of monthly mean 1000-hPa height anomalies over the northern extratropics. The North Pacific pattern (NP) [24] index was obtained from the Physical Sciences Division (PSD) of the Earth System Research Laboratory (ESRL), NOAA, website (https://www.esrl.noaa.gov/psd/data/climateindices/list/#SOI). The NP index is an area-weighted mean sea level pressure over the region 30–65° N, 160° E–140° W. In addition, we followed Branstator [7] to identify the winter mean circumglobal teleconnection (CGT) index and Ding and Wang [25] to obtain the summer CGT index, calculated using the NCEP reanalysis data. Specifically, we performed an EOF analysis of DJF monthly anomalies of non-divergent meridional winds over the NH and then projected the DJF seasonal mean non-divergent meridional wind anomalies onto the first EOF pattern, which is similar to that shown in [7], to obtain the DJF mean CGT index. For the summer CGT index, we performed an EOF analysis of 2–8 years, filtered JJA mean 200-hPa geopotential anomalies over the NH, and then projected the filtered anomalies onto the negative of the second EOF pattern, which is similar to and matches the sign of Ding and Wang’s pattern [25], to identify the JJA mean CGT index. The extratropical Asian–Bering–North American (ABNA) teleconnection index was calculated following Yu et al. [26], using the NCEP reanalysis data. Specifically, the index was constructed by a linear combination of the three regionally averaged 500-hPa geopotential anomalies over the ABNA centers of action, based on the normalized seasonal mean geopotential field after linearly removing the PNA pattern contribution.
2.2. Analysis Methods
To assess interannual variability, seasonal mean anomalies of the variables of interest are computed by removing the corresponding linear trends and their climatological mean seasonal cycles over the whole period considered. The linear trend of each pattern index is also removed, and the index series is standardized. The relationship between a time series of interest and its associated spatial fields is quantified by regression and correlation (the most widely used is the linear Pearson correlation) analyses. The statistical significance level of the temporal correlation is assessed by a Student’s t-test, assuming one degree of freedom per year. Similar results of significance tests are obtained using the effective sample size, estimated by considering the autocorrelation of the time series of interest [27].
The field significance of North American temperature and temperature extreme anomalies in association with a pattern index is estimated as follows: Within the North American (20–80° N, 170–50° W) land, about 17 EOFs of surface air temperature anomalies are required to represent 95% of the total variance of the seasonal mean temperature anomalies in the 36 DJFs from 1980 to 2015. About 20 EOFs of surface air temperature anomalies are required to represent 95% of the total variance of the seasonal mean temperature anomalies in the 36 JJAs from 1980 to 2015. According to Livezey and Chen [28], a rejection rate of about 20.0% is field significant at the 5% significance level in a field with 17 or more spatial degrees of freedom. Hence, rejection rates of 20.0% or higher very likely indicate field significance at the 5% level for the 36 DJFs/JJAs considered [29,30]. Similarly, about 15–18 EOFs of the temperature extreme indices, considered within the same domain, are required to represent 95% of the total variance of the seasonal mean temperature extreme anomalies in the 31 DJFs/JJAs from 1980 to 2010. The rejection rate of 22.0% (for 15 spatial degrees of freedom) or higher very likely indicates field significance at the 5% level for the 31 years.
The influence of a circulation pattern on North American temperatures is evaluated by calculating the percentages of North American temperature and temperature extreme variances explained by the pattern [26] as follows:
where is the anomaly of variable x (i.e., temperature or temperature extreme) regressed on the standardized pattern index considered, and σx is the temporal standard deviation of x. The angular brackets denote the spatial average over North America. It is worth mentioning that because some of the patterns are inter-correlated and not independent, their contributions to the temperature and temperature extremes cannot be summed.
3. Results
3.1. Variances of North American Surface Temperature and Temperature Extremes
Figure 1 displays the interannual variability of DJF (top row) and JJA (bottom row) mean surface air temperatures (T2m, left) and the temperature extreme indices of warm days TX90p (middle) and cool nights TN10p (right) over North America. North American temperature and temperature extremes feature considerable interannual and interseasonal variability. The DJF mean surface temperature (Figure 1, top left) exhibits high variances over a northwest–southeast belt, extending from Alaska towards the southeastern U.S., with variation centers over the Canadian Prairies, as well as the Canadian Shield. The T2m variance is much weaker in summer (Figure 1, bottom left) than that in winter, with relatively high variances mainly observed over western-central Canada and the middle parts of the U.S.
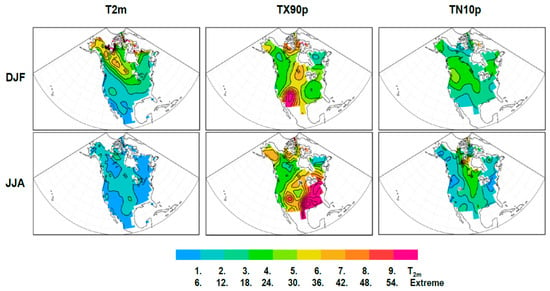
Figure 1.
Interannual variances of North American surface temperature (T2m, left column), warm days (TX90p, middle column), and cold nights (TN10p, right column) in December–January–February (DJF, top row) and June–July–August (JJA, bottom row). Contour intervals are 1.0 °C2 for T2m and 6.0%2 for temperature extremes.
By contrast, the variances of the North American temperature extremes are comparable in the winter and summer seasons. The warm days TX90p exhibits high variances, mainly over the Colorado Plateau and the Great Basin, the Great Lakes, most of the Canadian Arctic Archipelago, and Alaska in the two seasons. Additionally, high variances are also observed in the southeastern U.S. in summer (Figure 1, middle column). The DJF mean cold nights TN10p reveals high variances over the western-central parts of south Canada and the northern U.S., whereas the high variance is mainly observed in the middle parts of the North American continent, with the variant center over north Canada, for the JJA mean TN10p (Figure 1, right column). Overall, the variance patterns of the warm and cold extremes are different to that of the surface mean temperature.
The variance of warm nights TN90p bears resemblance to the corresponding TX90p, especially in the northern parts of the continent, as does the variance of cold days TX10p compared to the TN10p (not shown). Hence, we focus on the warm days and cold nights in the following analysis.
3.2. Winter Temperature Anomalies in Association with the Circulation Patterns
3.2.1. NH Circulation Patterns
Figure 2 presents the DJF mean geopotential anomalies at 500 hPa (Φ500) over the northern extratropics (poleward of 15° N), regressed on the circulation pattern indices. The anomalous circulation shown in the figure reflects the Φ500 anomalies associated with the positive phase of each pattern. Table 1 lists the temporal correlations among the pattern indices.
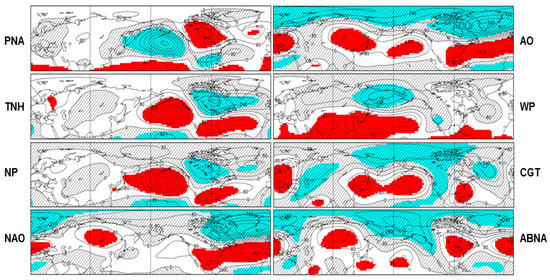
Figure 2.
DJF mean anomalies of Northern Hemisphere extratropical Φ500 (contours, interval 80 m2s−2, poleward of 15° N), regressed on the atmospheric pattern indices. The positive and negative geopotential anomalies, significantly correlated with the pattern index at the 5% level, are red- and cyan-shaded, respectively. Negative anomalies are also cross-hatched.

Table 1.
Correlation coefficients among the atmospheric pattern indices, as detailed in the text, over the 36 years. Numbers in bold indicate correlations significant at the 5% level, determined by a Student’s t-test, assuming one degree of freedom per year. Numbers above and below the diagonal are the results of the 36 DJFs and 36 JJAs, respectively. Correlations between the Tropical–Northern Hemisphere pattern (TNH) and other pattern indices are marked as “n/a” in JJA, since the TNH is not considered in summer.
As described and extensively investigated in previous studies (e.g., [3,5,15] and references therein), the PNA pattern is one of the most prominent atmospheric teleconnections in the wintertime northern extratropics and is characterized by a wave train, arcing from the Hawaiian Islands, through the North Pacific and Canada, towards the southeastern U.S. (Figure 2). The TNH consists of the circulation anomalies over the Gulf of Alaska and from the Gulf of Mexico northeastward, across the western North Atlantic, and anomalies of opposite sign throughout central-eastern Canada. In general, the TNH has North American anomalies mostly opposite to those of the PNA pattern. The NP pattern is defined to measure interannual to decadal variations in the atmospheric circulation over the North Pacific [24], and is dominated by Φ500 anomalies over the Aleutian low. These three patterns share many similarities of geopotential anomalies over the North Pacific–North American sector. Hence, the corresponding pattern indices are closely correlated, significant at the 5% level (Table 1).
The NAO pattern is the dominant mode of atmospheric variability over the North Atlantic (e.g., [22] and references therein), which features a north–south dipole of Φ500 anomalies with one center located over Greenland and the other center of opposite sign spanning the mid-latitudes of the North Atlantic (Figure 2). The AO pattern is the dominant mode of atmospheric variability over the northern extratropics [23], and features a more general north–south dipole between the polar regions and the middle latitudes. However, the amplitude of the AO is the highest over the Atlantic sector, and thus, the two pattern indices are highly correlated (Table 1).
The WP pattern is a primary mode of atmospheric variability over the North Pacific [3,5] and consists of a north–south dipole of Φ500 anomalies, with one center located over the Kamchatka Peninsula and another broad center of opposite sign over southeastern Asia and the western subtropical North Pacific (Figure 2). The CGT is a circumglobal waveguide pattern and has a roughly zonal wavenumber-5 feature, meridionally confined to the vicinity of the northern jets [7]. The CGT associated Φ500 anomalies feature zonal asymmetries with centers of action over southern Europe, the Arabian Sea, the Korean Peninsula–Japan, north of Hawaii, and north of the Gulf of Mexico (Figure 2). The ABNA is an extratropical circulation anomaly pattern, constructed by excluding the PNA pattern contribution on the circulation and proposed to help understand the North American temperature variability [8]. The pattern consists of a zonally elongated wave train, originating from North Asia and flowing downstream across the Bering Sea and Strait towards North America. The ABNA shares some similarities of Φ500 anomalies with the AO pattern over the mid-high latitudes, with the WP over the Kamchatka Peninsula, and with the CGT mainly over the polar regions. Hence, the corresponding pattern indices are correlated (Table 1).
The PNA index is also significantly correlated with the CGT and AO indices, significant at the 5% level, whereas the CGT index is correlated with the NP, AO, and WP indices (Table 1). These relationships are also evident in the Φ500 anomalies, regressed on the corresponding pattern indices, with similarities over various regions (Figure 2).
The patterns considered here reveal circulation anomalies over the North Pacific–North American–North Atlantic sector, and hence influence the temperature and temperature extremes over North America.
3.2.2. Surface Air Temperature
Figure 3 displays the DJF mean surface temperature T2m anomalies in association with the positive phase of the circulation patterns. The percentages of the North American (20–80° N, 170–50° W) land (as shown in Figure 3), in which the T2m anomalies are significantly different from zero at the 5% significance level, are listed in Table 2. In addition, Table 3 presents the percentages of North American T2m variance explained by these patterns.
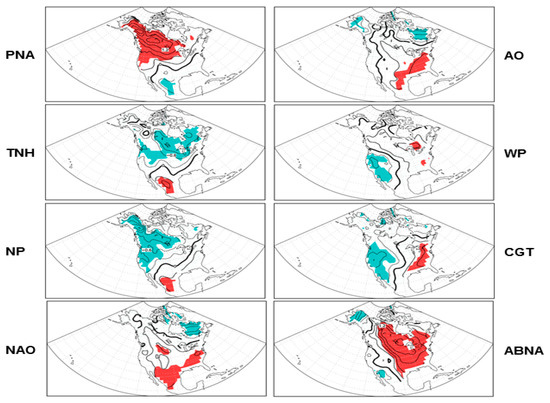
Figure 3.
DJF mean T2m anomalies (contours, interval 0.3 °C), regressed on the pattern indices. The positive and negative anomalies, significantly correlated with the pattern index at the 5% level, are red- and cyan-shaded, respectively. The zero line is in bold.

Table 2.
Percentages of the North American (20–80° N, 170–50° W) land in which the field anomalies are significantly different from zero at the 5% level for the surface temperature and temperature extreme anomalies, in association with the teleconnection indices. Numbers outside and inside parentheses are the results in DJF and JJA, respectively.

Table 3.
Percentages of North American T2m variance and temperature extreme variances explained by the teleconnections considered. Numbers outside and inside parentheses are the results in DJF and JJA, respectively.
As shown in Figure 3, the positive phase of the PNA pattern is associated with above average temperatures over Canada, Alaska, and the northern U.S., with pronounced anomalies above 1.2 °C over the Canadian Prairies and the Yukon Territory, accompanied by relatively weak below average temperatures in Mexico and the southern U.S. The TNH pattern features below average temperatures over most of Canada and the northern U.S., with pronounced anomalies below −0.9 °C over the Canadian Shield that is situated westward compared to the PNA associated anomaly center, as well as above average temperatures over Mexico and the southern U.S. The PNA and TNH associated T2m anomalies are similar to those reported in previous studies based on various datasets (e.g., [5,31,32,33]), indicating the robustness of the results. The NP associated temperature anomalies bear resemblance to those related to the PNA pattern, but of opposite sign and with pronounced anomalies below −0.9 °C over the Canadian Prairies and the Yukon Territory. The T2m anomalies associated with the NAO and AO patterns are broadly similar, with above average temperatures mostly in the central-eastern parts of the U.S. and below average temperatures mainly in northeastern Canada, consistent with previous studies (e.g., [2,34,35,36]). The WP pattern features above average temperatures over most of Canada and the central-eastern U.S., as well as below average temperatures over the western U.S. The CGT pattern is dominated by below average temperatures in the western parts of the continent and above average temperatures in the eastern parts, except northeastern Canada. The ABNA pattern is associated with above average temperatures over the central-eastern parts of North America, with pronounced warm anomalies above 1.2 °C over the Great Plains and Great Lakes, accompanied by cold anomalies over Alaska and the west coast of North America, in agreement with the result based on the last 65 winters [37].
In association with the atmospheric circulation patterns, more than 27.5% of the grids within the analysis domain exhibit the T2m anomalies significantly different from zero at the 5% level, with the exception of the WP pattern (Table 2). The ratio is higher than the rejection rate (20%) of the field significance at the 5% level for the 36 winters, as demonstrated in Section 2. This suggests that all the T2m anomaly patterns considered are field significant, except the WP associated one. In addition, most prominent temperature anomalies related to these circulation patterns are situated over high temperature variance areas (Figure 1, top left), in particular, for those associated with the PNA, TNH, NP, and ABNA patterns. Hence, the ABNA and PNA patterns explain about 15.0% of the interannual T2m variance over North America, and the NP, TNH, AO, and NAO explain about 10.0% of the variance (Table 3), based on Equation (1). The percentage explained by the CGT is 7.2%. By contrast, the WP pattern only explains 3.6% of the T2m variance over North America, since the pattern associated T2m anomalies are relatively weak and away from the dominant temperature variation center.
3.2.3. Temperature Extremes
Figure 4 shows the anomalies of the warm extreme TX90p, in association with the positive phase of the circulation patterns; and Figure 5 shows the corresponding anomalies of the cold extreme TN10p. For the TX90p anomalies (Figure 4), the positive phase of the PNA pattern is associated with increased TX90p over western Canada, Alaska, and the northwestern U.S., accompanied by a TX90p decrease over the central-eastern U.S. The TNH features a TX90p decrease over most of Canada and the northwestern U.S., as well as an increase over the central-eastern U.S. The NP associated TX90p anomalies resemble those related to the PNA, but of opposite sign, with pronounced decrease over western Canada and increase over the southeastern U.S. The TX90p anomalies associated with the NAO and AO patterns are generally similar, with increased warm days mainly in southern Canada and most of the U.S. and decreased warm days in northern Canada for both patterns and along the west coast of North America for the AO pattern. The WP pattern features decreased TX90p over the western parts of the continent, the central U.S., and northeastern Canada, accompanied by increased TX90p over central Canada, the Great Lakes, and the southeastern U.S. The CGT pattern is dominated by decreased TX90p in the western parts of the continent and northeastern Canada, with pronounced anomalies over the Colorado Plateau and Great Basin, and increased TX90p in the eastern parts of the U.S. The ABNA pattern is associated with increased warm days over the central-eastern parts of North America, accompanied by decreased TX90p, mainly along the western coast of the continent. In general, the anomalous TX90p patterns bear some resemblance to the corresponding mean surface temperature anomaly patterns (cf. Figure 4 with Figure 3). The spatial correlations between the TX90p and T2m anomalies related to each pattern are high, ranging from about 0.70 (for the TNH) to 0.90 (for the ABNA). This implies that the two anomaly patterns have about 50–80% spatial variance in common over the North American land.
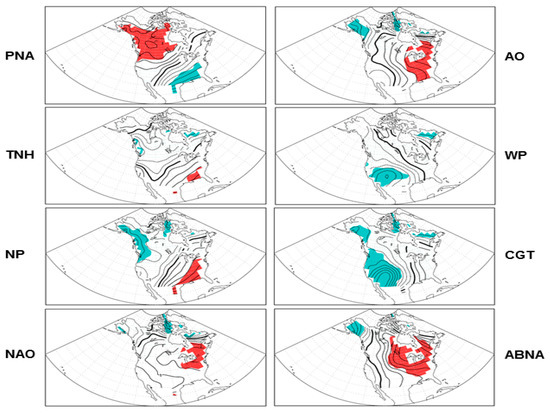
Figure 4.
As in Figure 3, but for anomalies of percentages of warm days (TX90p) with contour interval 0.5%.
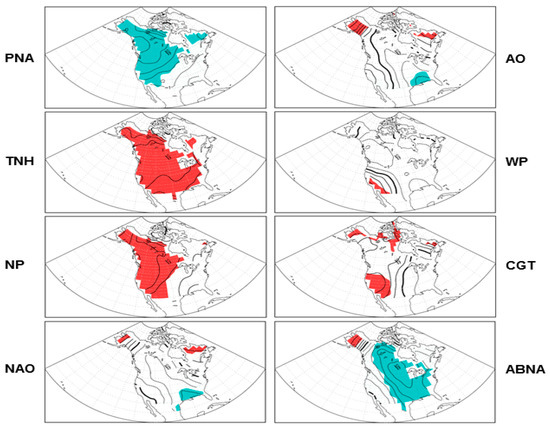
Figure 5.
As in Figure 3, but for anomalies of percentages of cold nights (TN10p) with contour interval 0.5%.
In association with these circulation patterns, more than 25.0% of the grids within the analysis domain show the TX90p anomalies significantly different from zero at the 5% level, with the exception of the TNH and WP patterns (Table 2). The ratio is higher than the rejection rate (22.0%) of the field significance at the 5% level for the 31 winters, suggesting that all the anomaly patterns, except the TNH and WP associated patterns, are field significant. In addition, the pattern associated TX90p anomalies explained about 5–10% of total interannual warm extreme variance over North America, with relatively high percentages for the PNA, CGT, and ABNA patterns, and low for the TNH and WP patterns (Table 3).
The anomalies of the warm nights TN90p in association with the circulation patterns (not shown) are broadly similar to those of the corresponding TX90p anomalies, with differences mainly in the amplitude. The spatial correlations between the TN90p and TX90p anomalies related to each pattern over the North American land are high, ranging from 0.76 (for the TNH) to 0.97 (for the ABNA). In addition, all the TN90p anomaly patterns, except those associated with the WP, are field significant at the 5% level over North America (Table 2). Note that the TNH related TN90p percentage of grids that are significantly different from zero is 34.3%, with pronounced negative anomalies over Canada and the northern U.S., higher than that of the TNH related TX90p counterpart (8.9%). The percentages of the interannual TN90p variance explained by these patterns are also comparable to those of the TX90p, except for a higher one from the TNH pattern.
For the anomalies of cold nights TN10p (Figure 5), the positive phase of the PNA pattern is associated with decreased TN10p over the whole continent, with pronounced anomalies over western Canada. Both the TNH and NP patterns are associated with increased cold extremes over North America, with pronounced anomalies over southern Canada and the northern U.S. for the TNH and over western Canada and the northwestern U.S. for the NP. These three anomaly patterns are field significant over North America at the 5% level (Table 2). By contrast, the NAO, AO, and WP associated TN10p anomalies are dominated by decreased values over the central-eastern parts of North America, accompanied by increased values along the west coast for the AO, and over the southwestern U.S. and Alaska for the NAO and WP patterns. These three anomaly patterns are not field significant at the 5% level. The CGT pattern is dominated by increased TN10p in the western parts of North America and northeastern Canada, and decreased TN10p in the eastern parts of the U.S. The ABNA pattern is associated with decreased cold nights over the central-eastern parts of North America, accompanied by increased cold nights mainly over Alaska. The CGT and ABNA associated TN10p anomaly patterns are field significant at the 5% level. In addition, the anomalous TN10p patterns also resemble the corresponding mean surface temperature patterns, but with opposite sign (cf. Figure 5 with Figure 3). The spatial correlations between the TN10p and T2m anomalies in association with each pattern range from about −0.70 (for the TNH) to −0.93 (for the ABNA). The PNA, TNH, NP, and ABNA associated TN10p anomalies explain about 15–20% of the total interannual variance over North America. The percentages for the NAO, AO, WP, and CGT are about 4–7% (Table 3). In addition, broadly similar results are obtained in the pattern-related cold days TX10p anomalies, compared to the corresponding TN10p counterparts, including the TX10p anomaly patterns (not shown), the field significant feature over North America (Table 2), and the percentages of explained interannual variance (Table 3).
3.3. Summer Temperature Anomalies in Association with the Circulation Patterns
3.3.1. NH Circulation Patterns
The JJA mean Φ500 anomalies in association with the circulation pattern indices are presented in Figure 6. The temporal correlations among the summertime pattern indices are listed below the diagonal in Table 1. It is noted that the TNH pattern is mainly observed during the DJF months [38] and is thus not considered in summer.
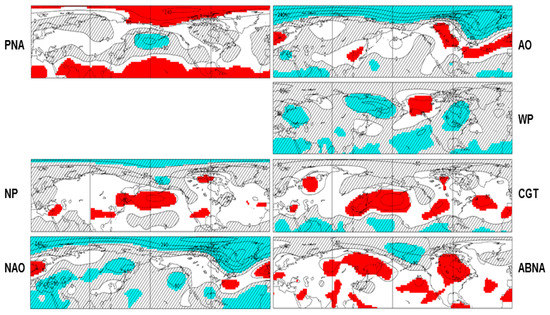
Figure 6.
As in Figure 2, but for the JJA mean Φ500 anomalies.
During the northern summer, most of the dominant action centers of the Φ500 anomalies in association with the DJF circulation patterns are still observed (cf. Figure 6 with Figure 2). However, the pattern-related Φ500 anomalies are generally weaker in JJA than those in DJF (e.g., 15). For the NP, NAO, AO, WP, CGT, and ABNA patterns, the Φ500 anomalies over the dominant centers of action in JJA are only about 1/3–1/2 times the amplitude of those in the corresponding anomalies in DJF. Meanwhile, the main centers of action of the PNA pattern seen in DJF are not clear in JJA. The JJA mean Φ500 anomalies related to the WP pattern are mainly negative over the subtropical Pacific, opposite to those in DJF. In addition, it is noted that the Φ500 anomalies in association with all the patterns, except the ABNA, are quite different over North America between JJA and DJF. In particular, pronounced changes from DJF to JJA can be seen over the western-central parts of North America for the NP, the Great Plain and the Great Lakes for AO and NAO, and most parts of North America for the WP and CGT patterns. However, the Φ500 anomalies in association with the ABNA pattern are broadly similar in JJA and DJF, with differences mainly in amplitude of the anomalies and some changes in the subtropical regions.
Compared to those in DJF, the temporal correlations among the pattern indices are broadly similar and generally weaker in JJA, except for the slightly stronger correlations between the AO and the CGT and between the ABNA and the NP. The most varied relationship in JJA and DJF appears in the correlation between the ABNA and the WP pattern (Table 1), due to the difference of the anomalous circulation discussed above.
3.3.2. Surface Air Temperature
In association with the circulation anomalies in summer, the North American surface temperature anomalies (Figure 7) are also weaker and generally different compared to those in DJF. In particular, the PNA associated T2m anomalies are rather weak in JJA. The NP pattern is now associated with warm anomalies over most of the continent, especially the above average temperatures over north Canada and the southwestern U.S. The AO and NAO patterns feature above average temperatures over western-central Canada and the western U.S. The WP pattern is dominated by below-average temperatures over central Canada. The CGT pattern is associated with above average temperatures over the western parts of North America. However, the ABNA associated temperature anomalies in JJA broadly resemble those in DJF, but weaker in amplitude.
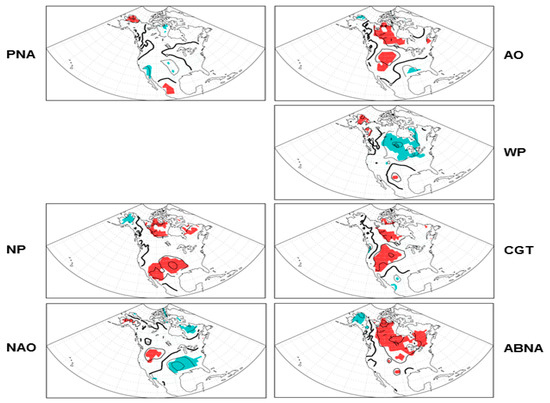
Figure 7.
As in Figure 3, but for the JJA mean T2m anomalies.
All of these pattern associated T2m anomalies over North America are field significant at the 5% level, except the PNA related one (Table 2). Nevertheless, the ABNA, NP, and AO pattern associated temperature anomalies show relatively high percentages of the grids that are significantly different from zero; whereas the NAO, WP, and CGT associated anomalies are marginally field significant at the 5% level. These patterns explain about 7.0–10.0% of the interannual T2m variance in JJA, except the PNA pattern, which explains only 3.8 of the T2m variance (Table 3).
3.3.3. Temperature Extremes
The amplitude of the temperature extreme anomalies in association with the circulation patterns in JJA is comparable to that of the corresponding circulation patterns in DJF (cf. Figure 8 and Figure 9 with Figure 4 and Figure 5). Moreover, like those seen in DJF, the TX90p and TN90p anomalies in association with the circulation patterns in summer are also similar, with the spatial correlations between the corresponding anomalies related to each pattern ranging from 0.74 (for the PNA) to 0.91 (for the AO). In addition, the TX90p and TN90p anomaly patterns bear resemblance to the corresponding T2m anomaly patterns in summer, with the correlations between either TX90p or TN90p, and T2m anomalies related to each pattern index ranging from about 0.65 (for the PNA) to 0.85 (for the ABNA). Likewise, the anomalous TN10p and TX10p patterns are also similar and both resemble the corresponding surface temperature anomaly patterns, but with opposite sign.
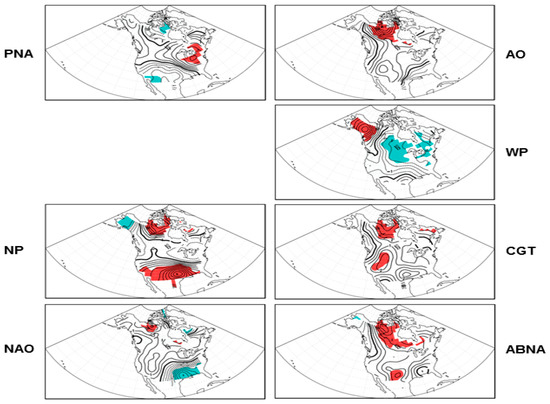
Figure 8.
As in Figure 3, but for the JJA mean TX90p anomalies with contour interval 0.5%.
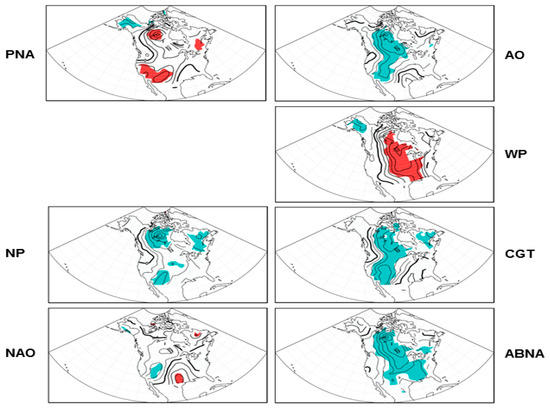
Figure 9.
As in Figure 3, but for the JJA mean TN10p anomalies with contour interval 0.5%.
In terms of the field significance over North America, the NP, WP, and ABNA associated anomalies of warm days and warm nights in summer are field significant at the 5% level. The CGT associated anomalies are marginally field significant at the 5% level, while the others are field non-significant (Table 2). These patterns explain about 5.0–10.0% of the interannual warm extreme variance in JJA (Table 3). By contrast, most of the pattern associated cold extreme anomalies are field significant at the 5% level over North America, except the NAO associated TX10p and TN10p anomalies and the PNA associated TX10p anomalies. These field significant patterns explain about 8.5–13.5% of the interannual cold extreme variance in JJA. The explained percentages are relatively low, about 4.0–6.5%, for the PNA and NAO patterns (Table 2 and Table 3).
4. Conclusions and Discussion
The exchange of mid-high latitude air implies a change in temperature advection, which influences and partially supports surface temperature changes. This analysis compares the North American surface temperature and temperature extreme anomalies in association with the Northern Hemisphere atmospheric circulation patterns, based on the observational extreme dataset HadEX2 and the NCEP reanalysis data. The patterns we considered exhibit circulation anomalies over the North Pacific–North American–North Atlantic sector, and hence, influence the temperature and temperature extremes over North America.
During winter, the PNA, TNH, and NP associated surface temperatures are dominated by anomalies over the northern portions of North America. The NAO and AO patterns feature T2m anomalies mainly in the central-eastern parts of the U.S and anomalies of opposite sign in northeastern Canada. The WP pattern is associated with T2m anomalies over most of Canada and the central-eastern U.S., and anomalies of opposite sign in the western U.S. The CGT pattern features opposite anomalies in the western and eastern parts of the North American continent. The ABNA pattern is dominated by T2m anomalies over the central-eastern parts of North America. All of these T2m anomaly patterns are field significant over North America at the 5% level, except the WP related one. In addition, the ABNA and PNA patterns each explain about 15.0% of the interannual T2m variance over North America, and the NP, TNH, AO, and NAO each explain about 10.0% of the variance. The percentages explained by the CGT and WP are relatively low, 7.2% and 3.6%, respectively.
The anomalies of warm extreme TX90p and TN90p in association with the circulation patterns bear resemblance to the corresponding T2m anomaly patterns, with differences mainly in the magnitude of the anomalies. All of the anomalous extreme patterns are field significant at the 5% level, except for the WP associated ones for both TX90p and TN90p and the TNH related one for TX90p. In addition, the pattern associated anomalies explained about 5–15% of the total interannual warm extreme variance over North America, with relatively high percentages for the PNA, CGT, and ABNA patterns, and low percentages for the WP pattern. Likewise, the circulation pattern associated cold extremes TX10p and TN10p anomalies resemble the corresponding T2m patterns, but with opposite sign. All of the anomalous cold extreme patterns are field significant, except the WP and NAO associated patterns for both TX10p and TN10p and the AO related one for TN10p. The PNA, TNH, NP and ABNA associated cold extreme anomalies explain about 15–20% of the total interannual variance over North America. The percentages for the NAO, AO, WP, and CGT are about 4–7%.
During summer, the pattern-related circulation anomalies are generally weaker than those in winter. In particular, the PNA pattern is not well defined and the TNH is not considered in summer. Moreover, the circulation anomalies in association with all the patterns, except the ABNA, are rather different over North America in summer and winter. Hence, in association with the circulation anomalies, the North American surface temperature anomalies are also weaker and differently distributed in summer than in winter. Nevertheless, all of the pattern associated T2m anomalies are of field significance at the 5% level over North America, except for the PNA related one. These patterns explain about 7–10% of the interannual T2m variance in summer, except the PNA pattern, which explains only 3.8% of the temperature variance.
The temperature extreme anomalies in association with the circulation patterns are comparable in summer and winter. In addition, like those seen in winter, the pattern associated warm and cold extreme anomalies in summer resemble the corresponding surface mean temperature anomaly patterns. Over North America, the NP, WP, ABNA, and CGT associated anomalies of warm extremes are field significant at the 5% level, while the others are field non-significant. These patterns explain about 5–15% of the interannual warm extreme variance. By contrast, most of the pattern associated cold extreme anomalies are field significant at the 5% level over North America, except the NAO associated TX10p and TN10p anomalies and the PNA associated TX10p anomalies. These field significant patterns explain about 8–14% of the interannual cold extreme variance. The explained percentages are relatively low, about 4–7%, for the PNA and NAO patterns.
This study is based on the NCEP reanalysis and the observational HadEX2 extreme indices. The teleconnection pattern associated temperature anomalies shown here are similar to those reported in previous studies using various datasets, indicating the robustness of the results. Nevertheless, it would be of benefit to further consider other reanalysis products, such as the ERA-Interim and 20CR re-analyses [39,40], and station-based temperature products, such as Berkeley Earth Surface Temperature (http://berkeleyearth.org). The additional analysis would increase confidence in the results, particularly the robustness of the regional temperature and temperature extreme anomaly patterns. Meanwhile, some of the patterns considered are inter-correlated, thus their contributions to the temperature and temperature extremes cannot be added up. It remains to ascertain the joint and independent contributions of each pattern to temperature and temperature extreme variances, using advanced analysis techniques, such as the hierarchal partitioning method [41]. In addition, it is noted that northern hemisphere teleconnection patterns have also been linked to climate anomalies beyond North America, such as the temperature and precipitation anomalies in Europe and Asia, e.g., [42,43,44,45,46]. Yet the field significance of the pattern associated climate anomalies over many regions/continents remains to be explored. Furthermore, the physical relationship between atmospheric circulation and surface temperature, including processes such as temperature advection and the heating associated variations of vertical motion and clouds (e.g., [47,48]), merits further investigation.
Author Contributions
All authors contributed to the interpretation of the results. B.Y. designed and carried out the analysis, and wrote the manuscript. H.L. and N.S. helped with the analysis and improving the manuscript.
Funding
This research received no external funding.
Acknowledgments
We thank the anonymous reviewers for their constructive suggestions and comments, which helped to improve the study. We thank the editors for kindly taking care of the manuscript. We are indebted to Tommy Jang for helping in the data processing and to Megan Kirchmeier-Young for the internal review and helpful comments on an early version of the manuscript. Data used in this analysis are described in Section 2.
Conflicts of Interest
The authors declare no conflict of interest.
References
- Wallace, J.M.; Blackmon, M.L. Observations of low-frequency atmospheric variability. In Large-Scale Dynamical Processes in the Atmosphere; Hoskins, B.J., Pearce, R.P., Eds.; Academic Press: New York, NY, USA, 1983; pp. 55–94. [Google Scholar]
- Van Loon, H.; Rogers, J.C. The Seesaw in Winter Temperatures between Greenland and Northern Europe. Part I: General Description. Mon. Weather Rev. 1978, 106, 296–310. [Google Scholar] [CrossRef]
- Wallace, J.M.; Gutzler, D.S. Teleconnections in the geopotential height field during the Northern Hemisphere Winter. Mon. Weather Rev. 1981, 109, 784–812. [Google Scholar] [CrossRef]
- Mo, K.C.; Livezey, R.E. Tropical-extratropical geopotential height teleconnections during the Northern Hemisphere winter. Mon. Weather Rev. 1986, 114, 2488–2515. [Google Scholar] [CrossRef]
- Barnston, A.G.; Livezey, R.E. Classification, seasonality and persistence of low-frequency atmospheric circulation patterns. Mon. Weather Rev. 1987, 115, 1083–1126. [Google Scholar] [CrossRef]
- Teng, H.; Branstator, G. A zonal wavenumber 3 pattern of Northern Hemisphere wintertime planetary wave variability at high latitudes. J. Clim. 2012, 25, 6756–6769. [Google Scholar] [CrossRef]
- Branstator, G. Circumglobal teleconnections, the jet stream waveguide, and the North Atlantic Oscillation. J. Clim. 2002, 15, 1893–1910. [Google Scholar] [CrossRef]
- Yu, B.; Lin, H.; Wu, Z.; Merryfield, W. Relationship between North American winter temperature and large-scale atmospheric circulation anomalies and its decadal variation. Environ. Res. Lett. 2016, 11, 074001. [Google Scholar] [CrossRef]
- Zhu, Z.; Li, T. A new paradigm for continental U.S. summer rainfall variability: Asia-North America teleconnection. J. Clim. 2016, 29, 7313–7327. [Google Scholar] [CrossRef]
- Simmons, A.J.; Wallace, J.M.; Branstator, G. Barotropic Wave Propagation and Instability, and Atmospheric Teleconnection Patterns. J. Atmos. Sci. 1983, 40, 1363–1392. [Google Scholar] [CrossRef]
- Horel, J.D.; Wallace, J.M. Planetary-scale atmospheric phenomena associated with the Southern Oscillation. Mon. Weather Rev. 1981, 109, 813–829. [Google Scholar] [CrossRef]
- Hoskins, B.J.; Karoly, D.J. The steady linear response of a spherical atmosphere to thermal and orographic forcing. J. Atmos. Sci. 1981, 38, 1179–1196. [Google Scholar] [CrossRef]
- Lau, N.-C. Variability of the observed midlatitude storm tracks in relation to the low-frequency changes in the circulation pattern. J. Atmos. Sci. 1988, 45, 2718–2743. [Google Scholar] [CrossRef]
- Branstator, G. Organization of storm track anomalies by recurring low-frequency circulation anomalies. J. Atmos. Sci. 1995, 52, 207–226. [Google Scholar] [CrossRef]
- Trenberth, K.E.; Branstator, G.W.; Karoly, D.; Kumar, A.; Lau, N.C.; Ropelewski, C. Progress during TOGA in understanding and modeling global teleconnections associated with tropical sea surface temperatures. J. Geophys. Res. 1998, 103, 14291–14324. [Google Scholar] [CrossRef]
- Liu, Z.; Alexander, M. Atmospheric bridge, oceanic tunnel, and global climatic teleconnections. Rev. Geophys. 2007, 45, RG2005. [Google Scholar] [CrossRef]
- Black, J.; Johnson, N.C.; Baxter, S.; Feldstein, S.B.; Harnos, D.S.; L’Heureux, M.L. The Predictors and Forecast Skill of Northern Hemisphere Teleconnection Patterns for Lead Times of 3–4 Weeks. Mon. Weather Rev. 2017, 145, 2855–2877. [Google Scholar] [CrossRef]
- Stan, C.; Straus, D.M.; Frederiksen, J.S.; Lin, H.; Maloney, E.D.; Schumacher, C. Review of tropical-extratropical teleconnections on intraseasonal time scales. Rev. Geophys. 2017, 55, 902–937. [Google Scholar] [CrossRef]
- Kistler, R.; Kalnay, E.; Collins, W.; Saha, S.; White, G.; Woollen, J.; Chelliah, M.; Ebisuzaki, W.; Kanamitsu, M.; Kousky, V.; et al. The NCEP-NCAR 50-year reanalysis: Monthly means CD-ROM and documentation. Bull. Am. Meteorol. Soc. 2001, 82, 247–268. [Google Scholar] [CrossRef]
- Donat, M.G.; Alexander, L.V.; Yang, H.; Durre, I.; Vose, R.; Dunn, R.J.H.; Willett, K.M.; Aguilar, E.; Brunet, M.; Caesar, J.; et al. Updated analyses of temperature and precipitation extreme indices since the beginning of the twentieth century: The HadEX2 dataset. J. Geophys. Res. Atmos. 2013, 118, 2098–2118. [Google Scholar] [CrossRef]
- Bengtsson, L.; Hagemann, S.; Hodges, K.I. Can climate trends be calculated from reanalysis data? J. Geophys. Res. 2004, 109, D11111. [Google Scholar] [CrossRef]
- Hurrell, J.W.; Kushnir, Y.; Visbeck, M.; Ottersen, G. An Overview of the North Atlantic Oscillation. In The North Atlantic Oscillation: Climate Significance and Environmental Impact; Geophysical Monograph Series; American Geophysical Union: Washington, DC, USA, 2003; Volume 134, pp. 1–35. [Google Scholar]
- Thompson, D.W.J.; Wallace, J.M. The Arctic Oscillation signature in wintertime geopotential height and temperature fields. Geophys. Res. Lett. 1998, 25, 1297–1300. [Google Scholar] [CrossRef]
- Trenberth, K.E.; Hurrell, J.W. Decadal atmosphere-ocean variations in the Pacific. Clim. Dyn. 1994, 9, 303–319. [Google Scholar] [CrossRef]
- Ding, Q.H.; Wang, B. Circumglobal teleconnection in the Northern Hemisphere summer. J. Clim. 2005, 18, 3483–3505. [Google Scholar] [CrossRef]
- Yu, B.; Lin, H.; Wu, Z.; Merryfield, W. The Asian-Bering-North American teleconnection: Seasonality, maintenance, and climate impact on North America. Clim. Dyn. 2017, 50, 2023–2028. [Google Scholar] [CrossRef]
- Bretherton, C.S.; Widmann, M.; Dymnikov, V.P.; Wallace, J.M.; Bladé, I. The effective number of spatial degrees of freedom of a time-varying field. J. Clim. 1999, 12, 1990–2009. [Google Scholar] [CrossRef]
- Livezey, R.E.; Chen, W.Y. Statistical field significance and its determination by Monte Carlo techniques. Mon. Weather Rev. 1983, 111, 46–59. [Google Scholar] [CrossRef]
- Zwiers, F.W.; Wang, X.L.; Sheng, J. Effects of specifying bottom boundary conditions in an ensemble of atmospheric GCM simulations. J. Geophys. Res. 2000, 105, 7295–7315. [Google Scholar] [CrossRef]
- Yu, B.; Zwiers, F. The impact of combined ENSO and PDO on the PNA climate: A 1000-year climate modeling study. Clim. Dyn. 2007, 29, 837–851. [Google Scholar] [CrossRef]
- Higgins, R.W.; Leetmaa, A.; Kousky, V.E. Relationships between Climate Variability and Winter Temperature Extremes in the United States. J. Clim. 2002, 15, 1555–1572. [Google Scholar] [CrossRef]
- Yu, B.; Shabbar, A.; Zwiers, F. The enhanced PNA-like climate response to Pacific interannual and decadal variability. J. Clim. 2007, 20, 5285–5300. [Google Scholar] [CrossRef]
- Kanno, Y.; Walsh, J.E.; Iwasaki, T. Interannual variability of the North American cold air stream and associated synoptic circulations. J. Clim. 2017, 30, 9575–9590. [Google Scholar] [CrossRef]
- Hurrell, J.W. Influence of Variations in Extratropical Wintertime Teleconnections on Northern Hemisphere Temperatures. Geophys. Res. Lett. 1996, 23, 665–668. [Google Scholar] [CrossRef]
- Thompson, D.W.J.; Wallace, J.M. Regional climate impacts of the Northern Hemisphere annular mode. Science 2001, 293, 85–89. [Google Scholar] [CrossRef]
- Marshall, J.; Kushnir, Y.; Battisti, D.; Chang, P.; Czaja, A.; Dickson, R.; Hurrell, J.; McCartney, M.; Saravanan, R.; Visbeck, M. North Atlantic climate variability: Phenomena, impacts and mechanisms. Int. J. Climatol. 2001, 21, 1863–1898. [Google Scholar] [CrossRef]
- Yu, B.; Lin, H. Coherent changes of wintertime surface air temperatures over North Asia and North America. Sci. Rep. 2018, 8, 5384. [Google Scholar] [CrossRef] [PubMed]
- Barnston, A.G.; Livezey, R.E.; Halpert, S. Modulation of Southern Oscillation–Northern Hemisphere mid-winter climate relationships by the QBO. J. Clim. 1991, 4, 203–217. [Google Scholar] [CrossRef]
- Uppala, S.M.; Kållberg, P.W.; Simmons, A.J.; Andrae, U.; Bechtold, V.D.C.; Fiorino, M.; Gibson, J.K.; Haseler, J.; Hernandez, A.; Kelly, G.A.; et al. The ERA-40 re-analysis. Q. J. R. Meteorol. Soc. 2005, 131, 2961–3012. [Google Scholar] [CrossRef]
- Compo, G.P.; Whitaker, J.S.; Sardeshmukh, P.D.; Matsui, N.; Allan, R.J.; Yin, X.; Gleason, B.E.; Vose, R.S.; Rutledge, G.; Bessemoulin, P.; et al. The Twentieth Century Reanalysis project. Q. J. R. Meteorol. Soc. 2011, 137, 1–28. [Google Scholar] [CrossRef]
- Chevan, A.; Sutherland, M. Hierarchical Partitioning. Am. Stat. 1991, 45, 90–96. [Google Scholar]
- Park, T.W.; Ho, C.H.; Yang, S. Relationship between the Arctic oscillation and cold surges over East Asia. J. Clim. 2011, 24, 68–83. [Google Scholar] [CrossRef]
- Zhao, P.; Zhu, Y.N.; Zhang, R.H. An Asian-Pacific teleconnection in summer tropospheric temperature and associated Asian climate variability. Clim. Dyn. 2007, 29, 293–303. [Google Scholar] [CrossRef]
- Rust, H.W.; Richling, A.; Bissolli, P.; Ulbrich, U. Linking Teleconnection Patterns to European Temperature-A Multiple Linear Regression Model. Meteorol. Z. 2015, 24, 411–423. [Google Scholar] [CrossRef]
- Ptak, M.; Tomczyk, A.M.; Wrzesiński, D. Effect of teleconnection on water temperature in Polish lakes. Atmosphere 2018, 9, 66. [Google Scholar] [CrossRef]
- Ionita, M. The Impact of the East Atlantic/Western Russia Pattern on the Hydroclimatology of Europe from Mid-Winter to Late Spring. Climate 2014, 2, 296–309. [Google Scholar] [CrossRef]
- Zhang, T.; Hoerling, M.P.; Perlwitz, J.; Sun, D.Z.; Murray, D. Physics of U.S. Surface Temperature Response to ENSO. J. Clim. 2011, 24, 4874–4887. [Google Scholar] [CrossRef]
- Yu, B.; Lin, H. Modification of the winter Pacific-North American patter related North American climate anomalies by the Asian-Bering-North American teleconnection. Clim. Dyn. 2018. [Google Scholar] [CrossRef]
© 2019 by the authors. Licensee MDPI, Basel, Switzerland. This article is an open access article distributed under the terms and conditions of the Creative Commons Attribution (CC BY) license (http://creativecommons.org/licenses/by/4.0/).