Abstract
The influence of the heights of low-level jets (LLJs) on the rotor power and aerodynamic loads of a horizontal axis wind turbine were investigated using the fatigue, aerodynamics, structures, and turbulence code. The LLJ and shear inflow wind fields were generated using an existing wind speed spectral model. We found that the rotor power predicted by the average wind speed of the hub height is higher than the actual power in relatively weak and shallow LLJ inflow conditions, especially when the LLJ height is located inside the rotor-swept area. In terms of aerodynamic loads, when the LLJ height is located inside the rotor-swept area, the root mean square (RMS) rotor thrust coefficient and torque coefficient increase, while the RMS rotor unbalanced aerodynamic load coefficients, including lateral force, longitudinal force, tilt moment, and yaw moment, decreased. This means that the presence of both positive and negative wind shear in the rotor-swept area not only increases the rotor power but also reduces the unbalanced aerodynamic loads, which is beneficial to the operation of wind turbine. Power spectrum analysis shows no obvious difference in the power spectrum characteristics of the rotor torque and thrust in LLJ inflow conditions with different heights.
1. Introduction
Low-level jets (LLJs), frequently defined as wind speed maxima occurring within the lowest several hundred meters above the ground [1], are important factors to consider for wind energy, due to the increased kinetic energy available within the rotor-swept area, and for the increased potential for aerodynamic loads due to the corresponding increases in wind speed and direction variability occurring during LLJs. The structural characteristics of the LLJ can be described by the LLJ speed maximum, LLJ height, and shape of the LLJ wind-speed profile [2]. The LLJ height is the position of the wind-speed maximum from the ground. Observations in specific areas show that nocturnal wind-speed profiles in about 20% of nights are identified with LLJ characteristics [3].
For wind-energy use, when LLJs occur in the rotor-swept area, strong wind speeds at the LLJ height and intense wind shears can significantly modify the inflow conditions of large-scale horizontal axis wind turbines (HAWTs). Studies have reported that the turbulence is significantly stronger and well-developed during the occurrence of LLJs [4]. With the development of low-wind-speed turbines, the diameter of the rotor and the height of the tower have gradually increased, so the impacts of LLJs on large-scale HAWTs will be more pronounced. In 2003, the U.S. Department of Energy (DOE), National Renewable Energy Laboratory (NREL), and General Electric Wind Energy developed the Lamar Low-Level Jet Program (LLLJP) to understand the turbulence structure and shear of LLJs and their impacts on current large-scale HAWTs [5]. Previous studies showed that wind turbines are bound to be affected by LLJs, based on the typical rated wind speeds and hub heights for onshore wind turbines [6]. Further studies indicated that the presence of LLJs has a noticeable impact at heights as low as 40 m above the ground, so the performance of wind turbines is directly affected by LLJs [7]. The changes in inflow conditions can affect the output power of the wind farm. According to Wilczak et al. [8], the capacity factor of the tested wind farm increases by more than 60% when LLJs occur. Therefore, the appearance of LLJs is conducive to the use of wind energy, but also has an impact on the operation of wind turbines. Studies show that the dominant frequencies present in the power spectra of the LLJ inflow are observed in frequencies related to the dynamic loads of the wind turbines, which intensifies the fatigue load [7]. Therefore, LLJs have serious impacts on the life expectancy of wind turbines.
The above studies confirm that LLJs impact large-scale HAWTs. However, the effects of LLJ structural characteristics—such as the LLJ speed maximum, LLJ height, and shape of the LLJ wind-speed profile—on the aerodynamic characteristics of the wind turbine have not been thoroughly studied. Among these LLJ structural characteristics, the LLJ height has an increasingly serious impact with the increase in turbine size. Compared with the wind shear inflow condition with a standard power law profile, both positive and negative shears occur in LLJ inflow conditions. Studies show that the LLJ height decreases with an increase in atmospheric stability [9,10]. The change in LLJ height causes the peak of the LLJ velocity profile to be inside or outside the rotor-swept area, resulting in a transition from positive wind shear below the peak to a negative one above. The effect of the transition of wind shear on wind turbines has not been thoroughly studied.
We studied the influence of the wind shear change caused by the change of LLJ height on rotor power and aerodynamic loads of large-scale HAWTs. Meanwhile, the results in LLJ inflow conditions were compared with those in wind shear inflow conditions in which only positive wind shears occur. The paper is organized as follows: Section 2 presents the simulation of different inflow wind fields, including LLJ and shear inflow conditions, using an existing wind speed spectral model. Section 3 introduces the wind turbine model and fatigue, aerodynamics, structures, and turbulence (FAST) code. Section 4 describes the validation of the calculation model and method in FAST code. Section 5 introduces the case. Section 6 discusses the results of rotor power and aerodynamic loads exerted on the rotor. Section 7 presents the major conclusions of this study. Results from this study can provide guidance for rotor power forecasting and clarify the aerodynamic loads of HAWTs in LLJ inflow conditions at different LLJ heights.
2. Inflow Wind Fields
The rotor power and aerodynamic loads in wind shear inflow conditions with a standard power law profile are used to compare the results in LLJ inflow conditions. Therefore, both the LLJ inflow wind fields and wind shear inflow wind fields should be established. In general, there are two methods to obtain LLJ wind data. One method is direct measurement during the LLJ events. The real turbulence structure of LLJ can be obtained by direct measurement with LiDAR (light detection and ranging) and wind profiler [2,3,11]. However, field measurement requires expensive measuring equipment and a long measurement period. The second method is simulation by a numerical model, such as the Weather Research and Forecasting (WRF) model and Great Plains Low-Level Jet (GP_LLJ) spectral model. Compared with the first method, this method is economical. Research indicates that the WRF model can forecast some basic characteristics of LLJs and provide the probability of improving the accuracy of wind resource assessment and short-term wind energy forecasts; however, the LLJ heights predicted by the WRF model are often higher than observed [12]. The WRF model has uncertainty when simulating the inflow condition of wind turbines [13]. The GP_LLJ spectral model is summarized from the high-frequency data of the real atmospheric boundary layer based on the LLLJP [14]. The purpose of the LLLJP is to develop an understanding of the influence of LLJ on HAWT [5]. The LLJ inflow condition of wind turbine can be established by the GP_LLJ spectral model.
Considering the difficulty of measuring LLJs and the authenticity of LLJ wind data, the LLJ inflow wind fields with different heights were established in this paper, based on the GP_LLJ spectral model. The wind shear inflow wind fields were established by the power law profile and International Electrotechnical Commission (IEC) Von Karman isotropic spectral model.
2.1. GP_LLJ Spectral Model
The GP_LLJ spectral model, which was developed by the researchers at the NREL based on the LLLJP in Southeastern Colorado, USA, is a statistical model summarized from the results of direct measurements. In the LLLJP, the inflow parameters were obtained from a tower with a height of 120 m and from an acoustic wind profiler (sonic detection and ranging, SODAR). Air temperatures at different heights were measured with four-wire platinum resistance temperature detectors mounted on the tower. Wind speed and direction were acquired with the cup anemometers and highly damped direction vanes mounted on the tower. SODAR can provide measurements of wind speed and direction from 20 to 500 m above the ground. The spectra and spatial coherence parameters defined in the GP_LLJ spectral model were based on the time-series data with a frequency of 20 Hz. Considering the limitations and errors of the measurements, the measured valid data were used to summarize the GP_LLJ spectral model.
Downward transport of turbulence kinetic energy has been observed during LLJ conditions [15], and most studies have shown that LLJs occur under stable atmospheric conditions [16,17]. Therefore, the required LLJ wind fields were established by giving different input parameters for the GP_LLJ spectral model under stable conditions. According to the measurement results in LLLJP, the expression of the GP_LLJ spectral model under stable conditions is defined in Equation (1) [14,18,19,20]. The LLJ wind profile is derived from LLLJP 10-minute SODAR measurements [14].
where k is the direction of the velocity component, f represents the cyclic frequency, represents the mean wind speed at height H above the ground, u* is the friction velocity, Nk is the number of the spectral peaks, S1,k and S2,k are the two scale parameters, Pi,k and Fi,k represent the scaling factors which are a function of the atmospheric stability and friction velocity, and the value of the Nk, S1,k, and S2,k are assigned as follows:
where ΦM and ΦE are non-dimensional profiles, and defined in Equation (4) as
where Ri represents the gradient Richardson number, which is an input parameter for establishing the LLJ inflow condition. The wind turbine is subjected to the greatest fatigue damage when 0 ≤ Ri < 0.05 [21]. Therefore, the value of Ri was set to 0.02 in this paper.
2.2. IEC Von Karman Isotropic Spectral Model
In shear inflow conditions, the power law profile is used to describe the change of wind speed with height, as shown in Equation (5).
where (H) is the average wind speed at height H, is the average wind speed at the hub height, and α represents the wind shear exponent, which is related to the atmospheric stability and surface roughness. The approximate value of α is in the range 0.11–0.4 [22].
The Von Karman isotropic spectral model is used to represent the turbulence on the time scale. The velocity spectra for three-component wind are as follows:
where k = v and k = w represent the transverse wind component and vertical wind component, respectively; represents the average hub-height wind speed; and σ and L are the standard deviation and integral length scale of turbulence, respectively. According to the IEC 61400-1 standard, L is defined by Equation (8):
where Λ = 0.7 min (30, Hhub) is the turbulence scale parameter.
σ is defined by the turbulence intensity(δ), and the turbulence intensity is 10%.
2.3. Simulation of Fluctuating Wind Fields
The GP_LLJ spectral model and IEC Von Karman isotropic spectral model define the spectra of velocity components in the frequency domain. The velocity components in the frequency domain were converted into the time-series wind speed components using the inverse fast Fourier transform code coupled in the TurbSim simulator (NREL, Colorado, USA) [14]. The time-series three-dimensional (3D) velocity field was established at 1681 points (41 × 41) in a two-dimensional (2D) vertical rectangular grid. TurbSim uses Taylor’s frozen turbulence hypothesis to translate wind components defined in 2D planes into three spatial dimensions.
The rotor power and aerodynamic loads were investigated in relatively shallow LLJ inflow conditions. According to the GP_LLJ spectral model and values of the parameters in Table 1, five kinds of time-series LLJ inflow fluctuating wind fields were established. The average LLJ heights of the fluctuating wind fields were 87, 119, 150, 181, and 213 m, which correspond to the different positions in the rotor-swept area. The LLJ speed maximum of all wind fields was 11.4 m/s. The variations in the time-averaged horizontal wind speed and direction with the height above the ground are shown in Figure 1. The average profiles of the wind speeds and directions have an obvious gradient. The error bars in Figure 1 show that wind speeds and directions change considerably with time. The phenomenon indicates the strong fluctuation characteristics of the wind speeds and directions in LLJ wind fields. Compared with the heights at which the rotor is located, the gradient of the wind speeds and directions near the ground increases due to the influence of the surface roughness.

Table 1.
The values of the main parameters in the GP_LLJ spectral model. GP_LLJ: Great Plains Low-Level Jet (LLJ).
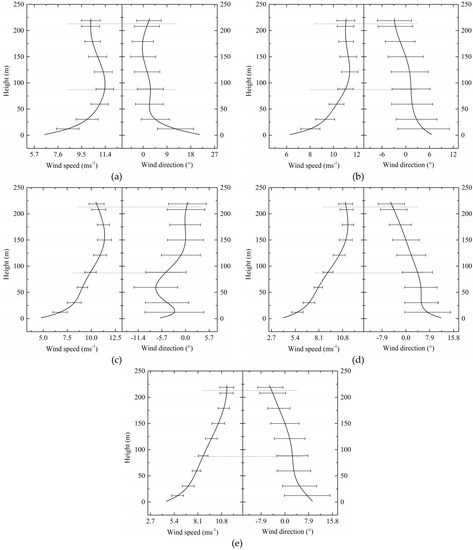
Figure 1.
The variations in the simulated time-averaged (200 s) horizontal wind speed (left) and wind direction (right) with low-level jet (LLJ) height above the ground of (a) 87 m, (b) 119 m, (c) 150 m, (d) 181 m, and (e) 213 m. The error bars represent standard deviation of the mean. The horizontal dotted lines above and below represent the height of the top-tip and bottom-tip of the rotor, respectively.
According to the IEC Von Karman isotropic spectral model and values of the parameters in Table 2, three kinds of time-series shear inflow fluctuating wind fields were established. The hub-height wind speed was 11.4 m/s, and the wind shear exponent α was 0.1, 0.2, and 0.3. The variations in the time-averaged wind speed with height above the ground are shown in Figure 2.

Table 2.
The values of the main parameters in IEC Von Karman isotropic spectral model.
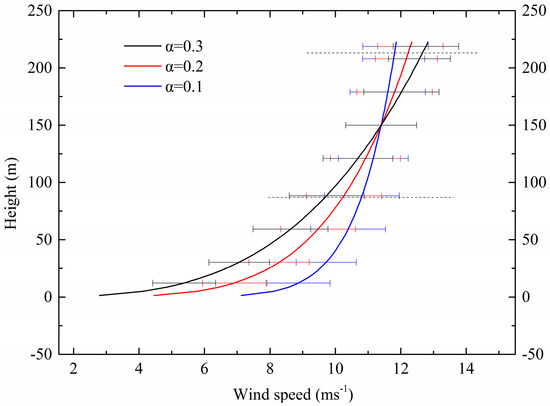
Figure 2.
The variations in the simulated time-averaged (200 s) wind speed with height above the ground in shear inflow conditions with wind shear exponent α of 0.1, 0.2, and 0.3. The error bars represent standard deviation of the mean. The horizontal dotted lines above and below represent the height of the top-tip and bottom-tip of the rotor, respectively.
The simulated LLJ fluctuating wind field with an LLJ height of 150 m and shear fluctuating wind field with the wind shear exponent of 0.2 were taken as an example to verify the accuracy of simulating the inflow fluctuating wind fields. Figure 3 shows the time-series of the fluctuating wind speed of hub height in the LLJ inflow condition and shear inflow condition. Figure 4 compares the target spectra and simulation spectra of the fluctuating wind speed shown in Figure 3. The target spectrum was calculated from the wind speed spectral model defined above, and the simulation spectrum was obtained from the simulated time history of the fluctuating velocity using FFT. As shown in Figure 4, the simulation spectrum is slightly higher than the target spectrum in low-frequency regions (f < 0.01 Hz) in the LLJ inflow condition. At the other frequency regions in the LLJ and shear inflow condition, the simulation spectrum is in good agreement with the target spectrum. In summary, the fluctuating characteristics of the established wind fields are in accordance with the theoretical results.
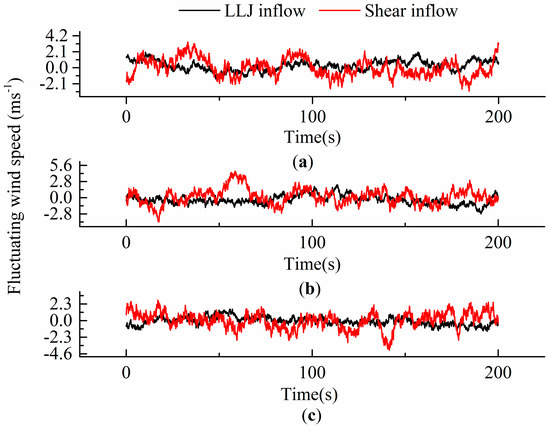
Figure 3.
Simulated time-series of the fluctuating wind speed of hub height in the representative LLJ inflow condition and shear inflow condition: (a) streamwise, (b) transverse, and (c) vertical components.
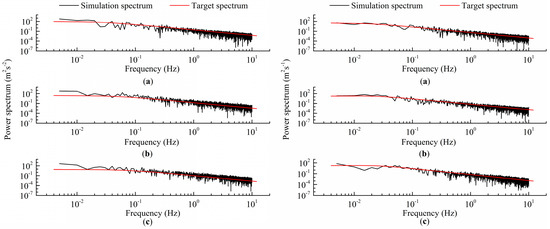
Figure 4.
Comparison between the simulation spectrum and target spectrum of the fluctuating wind speed of hub height in LLJ inflow condition (left) and in shear inflow condition (right): (a) streamwise, (b) transverse, and (c) vertical components. The target spectrum was calculated from the wind speed spectral model, and the simulation spectrum was obtained from the simulated fluctuating wind speed.
3. Wind Turbine Model and FAST
The wind turbine used in this study is the NREL 5 MW reference turbine. It is a three-blade upwind variable-speed, variable-blade pitch-to-feather-controlled turbine. Since the main loads of the wind turbine are caused by the rotor, only the rotor was taken as the object. We assumed that the installation height (hub height) of the wind turbine was 150 m. The parameters of the rotor are shown in Table 3. The specific parameters of the wind turbine can be found in Jonkman et al. [23].

Table 3.
Parameters of the rotor. The data in the table are from Jonkman et al. [23].
In this study, the wind turbine model consists of an actuator line coupled with the FAST open-source code developed by the NREL. FAST can model the response of both two-blade and three-blade conventional HAWTs [24]. Within FAST, each blade is represented by a set of discrete elements along the blade. FAST uses the aerodynamic input properties of the airfoils at blade element to compute aerodynamic loads. The Leishman and Beddoes model [25] is employed to capture the dynamic stall characteristic. The blade aerodynamic loads are computed by integrating the distributed loads along the analysis nodes of the blade. The rotor power and aerodynamic loads of the wind turbine were obtained by FAST, which can output quantitative results under different inflow conditions.
4. Validation of Calculation Model and Method in FAST
To verify the accuracy of the calculation method and aerodynamic model of the wind turbine in FAST, under the uniform inflow conditions at different wind speeds, the power curve obtained with the FAST code was compared with the theoretical power curve in Jonkman et al. [23]. Table 4 shows the pitch angles of the blades at different wind speeds. The results of comparing the power are shown in Figure 5. The calculated results in FAST are in good agreement with the theoretical values at low wind speeds (below the rated wind speed). When the inflow wind speed is greater than the rated wind speed, the error tends to increase, and the maximum relative error is 8.3% at the wind speed of 25 m/s. One contributor to the increasing error with higher wind speeds is the limitation of the actuator line model based on blade element momentum (BEM) theory, which is insufficient to predict the three-dimensional flow behavior at the blade surface. However, the wind-speed maximum of the LLJ in this study is the rated wind speed. The relative error in power prediction was 0.19% at the rated wind speed. Therefore, the calculation method and aerodynamic model of the wind turbine used in this paper are reasonably accurate. The calculation results can be used as the basis for analysis.

Table 4.
Blade pitch angles at different wind speeds.
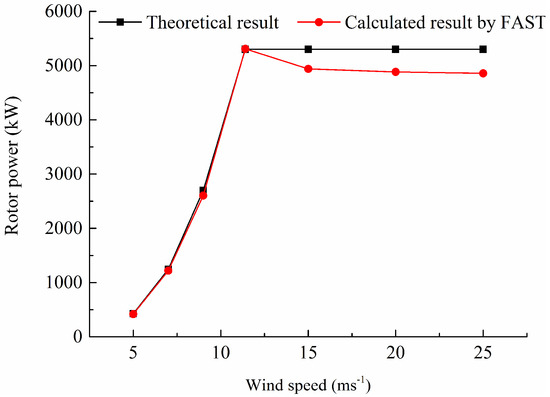
Figure 5.
Rotor power at different wind speeds. FAST: fatigue, aerodynamics, structures, and turbulence.
5. Case Introduction
In the LLJ inflow condition, the simulated LLJ wind fields with heights of 87, 119, 150, 181, and 213 m correspond to the position of rotor bottom-tip, the middle of the lower half of the rotor, the hub height, the middle of the upper half of the rotor, and the rotor top-tip, respectively. To quantify the proportion of the positive and negative wind shears in the rotor plane, the relative position of the LLJ height and the hub height of the turbine is defined by a dimensionless parameter ξ, and the expression is defined as follows:
where Zhub represents the hub height, ZLLJ represents the height of LLJ, and R is the radius of the rotor. From the bottom-tip to top-tip of the rotor, the values of ξ were 1, 0.5, 0, –0.5, and –1. The relative positions of the LLJ height and hub height of the wind turbine are shown in Figure 6.
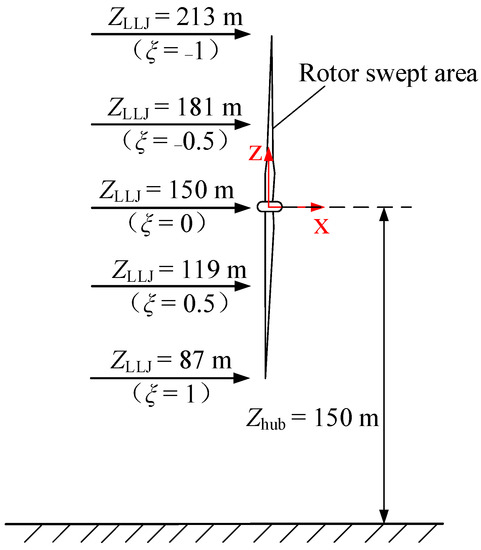
Figure 6.
Schematic of the relative positions of the LLJ height and hub height. The arrows indicate the positions of the LLJ height.
For simplicity, the yaw angles were 0 degrees under all inflow conditions.
6. Results and Discussion
6.1. Rotor Power
The testing of wind turbine power performance is an important part of wind-energy utilization. According to the IEC 61400-12-1 standard, version 2005, the rotor power can be calculated only by the hub-height wind speed. However, the variation in the wind speed and direction shear have been reported to influence the power performance of large-scale HAWTs [26]. In LLJ and shear inflow conditions, the root mean square (RMS) actual rotor power obtained from FAST was compared with the RMS predicted rotor power, which was calculated by the average hub-height wind speed, as shown in Equation (11). The comparison results are shown in Figure 7, which shows that the RMS-predicted rotor power is higher than the actual power in the LLJ inflow condition, whereas it is less than the actual power in the shear inflow condition. The relative error of the rotor power prediction in the LLJ inflow condition is higher than in the shear inflow condition, especially when the LLJ height is located inside the rotor-swept area. Compared with the actual rotor power, the maximum relative error of the predicted rotor power was 20.2% when ξ = 0. The difference between the actual power and predicted power is caused by the gradient of the wind speed and direction. Therefore, in LLJ inflow conditions with different LLJ heights, the power predicted based only on the average hub-height wind speed is inaccurate.
where A is the rotor-swept area, ρ is the air density, is the average hub-height wind speed, Cp is the rotor power coefficient, and λ represents the tip speed ratio, which is defined as the ratio between the tangential speed of the tip of the blade and the inflow wind speed of the hub height.
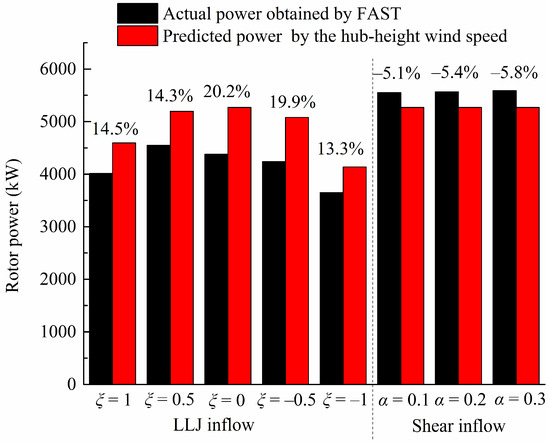
Figure 7.
Comparison between actual results and predicted results of the rotor power under different inflow conditions. The actual result was obtained using FAST, and the predicted result was calculated using Equation (11). The value indicates the relative error of the rotor power prediction.
The LLJ height affects the rotor power. As shown in Figure 7, when the LLJ speed maximum is constant and the LLJ height increases from the bottom-tip to the top-tip of the rotor, the RMS actual rotor power first increases and then decreases, and reaches a maximum at the LLJ height of 119 m (ξ = 0.5). At the condition of ξ = 0.5, the RMS actual rotor power increased by 13.3% and 24.5%, respectively, compared with the situation where the LLJ height is located at the bottom-tip (ξ = 1) and the top-tip (ξ = −1) of the rotor. The structural characteristics of the LLJ can provide explanations for this change: the strong wind speeds at LLJ height cause the increase in wind energy, which results in an increase in rotor power when the LLJ heights are located inside the rotor-swept area. Figure 1 shows that when the LLJ height is 119 m (ξ = 0.5), the gradient of the average wind speed profile is the smallest in the rotor-swept area, and the wind speed is close to the LLJ speed maximum. The wind direction is approximately zero. Therefore, when the LLJ height is located on the lower half plane of the rotor (ξ = 0.5), the RMS of actual rotor power is at a maximum.
6.2. Aerodynamic Loads
Wind shears can cause significant fluctuation in the aerodynamic loads of the rotor [27]. Clarifying the effect of the wind shears in LLJ inflow conditions on aerodynamic loads of the rotor is the basis for studying fatigue loads exerted on the wind turbine. Under LLJ and shear inflow conditions, the RMS rotor aerodynamic force coefficient and RMS rotor aerodynamic moment coefficient are defined as follows:
where Fi and Mi represent the rotor aerodynamic forces and aerodynamic moments, respectively, which are subjected in the i (i = x, y, z) direction, and obtained from FAST; A is the rotor-swept area; ρ is the air density; V is the rated wind speed of wind turbine for NREL 5 MW reference turbine, V = 11.4 m/s; and N is the number of data collected. The schematic of the reference coordinate system and aerodynamic loads are shown in Figure 8.
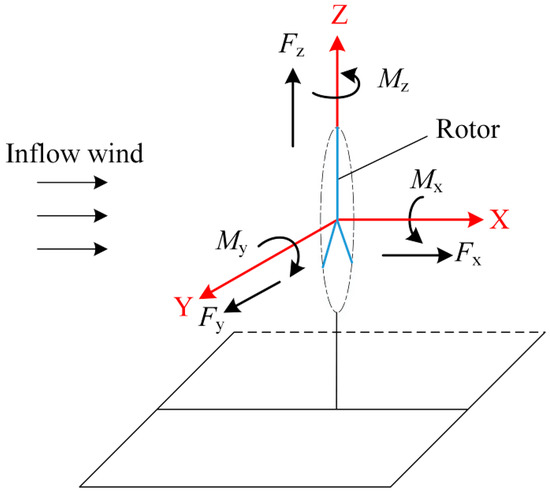
Figure 8.
Schematic of the reference coordinate system and aerodynamic loads.
Figure 9 shows the variations in the RMS coefficient of the force and moment in three directions (x, y, and z directions) in the LLJ and shear inflow conditions. In the axial direction (along the x-axis), Figure 9 shows that the RMS rotor thrust coefficient () and torque coefficient () in the LLJ inflow condition are lower than the results of the shear inflow condition. In the LLJ inflow condition, the RMS rotor thrust coefficient and torque coefficient first increase and then decrease with the increase in LLJ height. When the LLJ height is located inside the rotor-swept area, the RMS coefficient of thrust and torque increased, and reached a maximum at the inflow condition of ξ = 0.5. Compared with the situation where the LLJ height is located at the bottom-tip (ξ = 1) and top-tip (ξ = −1) of the rotor, the RMS thrust coefficient respectively increased by 6.25% and 11.7% at the inflow condition of ξ = 0.5, and the RMS torque coefficient respectively increased by 13.3% and 24.5% at the inflow condition of ξ = 0.5. This occurred because the center of the LLJ was located inside the rotor-swept area, and the angle between the average wind direction and the axis of the rotor was small at the condition of ξ = 0.5. As a result, the energy of the inflow wind increased.
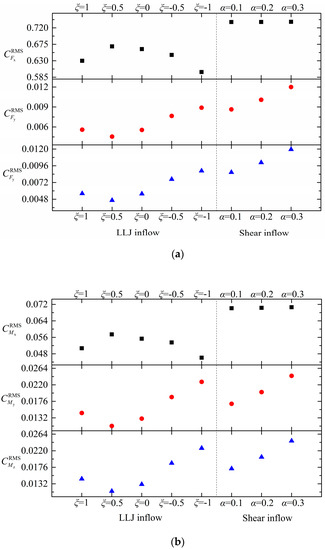
Figure 9.
The RMS rotor (a) force coefficient and (b) moment coefficient under different inflow conditions.
In the other directions (y and z directions), the rotor aerodynamic forces and moments were mainly caused by unbalanced forces exerted on the blades. Figure 9 demonstrates that the RMS coefficient of the lateral force (Fy), longitudinal force (Fz), tilt moment (My), and yaw moment (Mz) first decreases and then increases with the increase in LLJ height. When the LLJ height is located inside the rotor-swept area, although there are both positive and negative shears, the unbalanced aerodynamic loads exerted on the rotor are reduced compared with the inflow condition where only positive wind shear exists. This means that in relatively weak and shallow LLJ inflow conditions, the presence of both positive and negative wind shear in the rotor-swept area has no negative impact on the unbalanced aerodynamic loads exerted on the rotor. The RMS coefficients of the unbalanced aerodynamic loads of the rotor reach a minimum under the condition of ξ = 0.5. When the LLJ height increases from the bottom-tip (ξ = 1) to top-tip (ξ = −1) of the rotor, the RMS coefficients of the lateral force, longitudinal force, tilt moment, and yaw moment increased by 59%, 58%, 57.2%, and 56.2%, respectively. Figure 1 shows that when the LLJ height is located at a height of 119 m, the distribution of the average wind speed is nearly uniform across the rotor-swept area, resulting in a reduction in the unbalanced rotor aerodynamic forces and moments. With increasing LLJ height, the non-uniformity of the wind speed and direction distributed across the rotor plane increased. As a result, the unbalanced rotor aerodynamic forces and moments increased.
To explain the distribution of the rotor aerodynamic loads under different inflow conditions, the axial force and tangential force at different span-wise locations of the blade were compared. Figure 10 shows the arithmetic mean value of the axial force and tangential force at different span-wise locations of the blade (r/R = 17%, 43%, 70%, and 93%) in different inflow conditions. Figure 10 demonstrates that the axial force and tangential force, distributed span-wise along the blade in the shear inflow condition, are higher than in the LLJ inflow condition. This is the reason why the RMS rotor thrust coefficient and torque coefficient in the LLJ inflow condition are less than the results of shear inflow condition. Compared with the conditions where the LLJ height is located at the tip-height (ξ = 1 and ξ = −1), the axial force and tangential force at different span-wise locations obviously increased for conditions where the LLJ height is inside the rotor-swept area (ξ = −0.5, ξ = 0.5, and ξ = 0). Further studies showed that the average angle of attack at different span-wise locations has the same distribution trend as observed in Figure 11. The result shows that when the LLJ height is located at the tip-height (ξ = 1 and ξ = −1), the angle of attack is smaller than when the LLJ height is inside the rotor-swept area (ξ = −0.5, ξ = 0.5, and ξ = 0), resulting in the reduction in the axial force and tangential force.
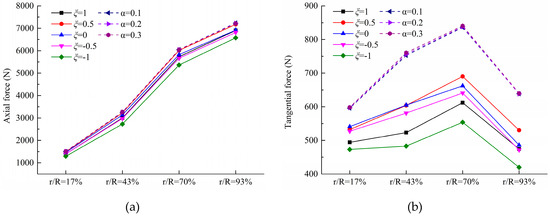
Figure 10.
(a) Axial and (b) tangential force at different span-wise locations of the blade (r/R = 17%, 43%, 70%, and 93%) under different inflow conditions.
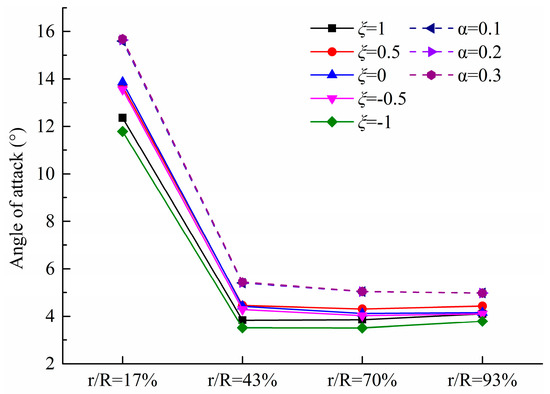
Figure 11.
Angle of attack at different span-wise locations of the blade (r/R = 17%, 43%, 70%, and 93%) under different inflow conditions.
6.3. Spectrum Analysis
To study the fluctuation characteristics of the relatively important aerodynamic loads, including rotor torque and thrust, the power spectrum characteristics were compared. Figure 12 shows the power spectrum characteristics of the rotor torque and thrust in LLJ and shear inflow conditions. The results show that there was no obvious difference in the power spectrum characteristics of the rotor torque and thrust in LLJ inflow conditions at different LLJ heights. The curves of the power spectrum in LLJ and shear inflow condition have distinct peaks, and the energy of the peak decreases with the increase in frequency. In this study, the rotational speed of the rotor was 12.1 rpm, and so the blade passing frequency was f = 0.605 Hz, which is three times the rotational frequency for a three-blade rotor. Further analysis showed that a concentration of energy was observed at the frequencies of 0.605, 1.215, 1.81, and 2.425 Hz, which correspond to the integral multiples of the passing frequency of the blade. This finding is in agreement with the previous studies reported by Churchfield et al. [28].
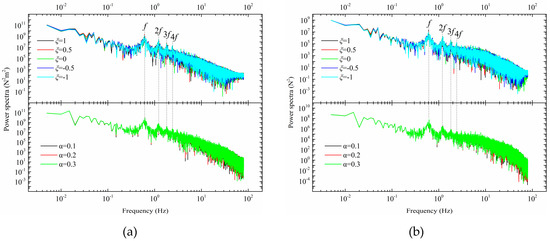
Figure 12.
Power spectrum characteristic curve of rotor thrust coefficient and torque coefficient in LLJ and shear inflow condition: (a) torque and (b) thrust.
7. Conclusions
In this paper, the rotor power and aerodynamic loads of the NREL 5MW wind turbine were studied in LLJ and typical shear inflow conditions characterized by a power law relationship. The LLJ inflow wind fields were established from the GP_LLJ model, which was based upon data from the LLLJP in Southeastern Colorado, USA. The shear inflow wind fields were obtained from the power law profile and IEC Von Karman isotropic spectral model. The rotor power and aerodynamic loads were collected using the FAST open-source code. The following conclusions were drawn from this study.
In relatively weak and shallow LLJ inflow conditions, when the LLJ height is located in the rotor-swept area, the RMS rotor power predicted by the average wind speed of the hub height is higher than the actual power computed using an actuator line mode in the LLJ inflow condition, whereas it is less than the actual power in the shear inflow condition. The relative error of the rotor power prediction in the LLJ inflow condition is higher than in the shear inflow condition, especially when the LLJ height is located inside the rotor-swept area. The maximum relative error of the predicted rotor power is 20.2%. Therefore, in LLJ inflow conditions with different LLJ heights, the power predicted only based on the average hub-height wind speed is inaccurate. Wind speeds and directions at different heights should be considered in the power prediction.
For the relatively weak and shallow LLJ inflows investigated herein, the presence of both positive and negative wind shears within the rotor-swept area not only increases the rotor power but also reduces the unbalanced aerodynamic loads exerted on the rotor, including lateral force, longitudinal force, tilt moment, and yaw moment. That is to say, not all LLJs lead to enhanced unbalanced aerodynamic loads. Power spectrum analysis showed there is no obvious difference in power spectrum characteristics of the rotor torque and thrust in LLJ inflow wind fields with different heights.
This study was only performed in relatively shallow and weak LLJ conditions, and the significant stress loading events were not investigated. Future studies should focus on deeper and stronger LLJ inflow conditions. In addition, the influence of other LLJ structural characteristics, such as LLJ speed maximum and turbulence distribution, on the aerodynamic characteristics of HAWT will be investigated.
Author Contributions
Methodology, X.Z. and C.Y.; Writing—Original Draft preparation, X.Z. and S.L.; Writing—Review and Editing, C.Y.
Funding
This research was funded by the National Basic Research Program of China (No. 2014CB046201).
Acknowledgments
The authors would like to acknowledge and thank the National Basic Research Program of China (No. 2014CB046201); the people who provided many good suggestions for this paper.
Conflicts of Interest
The authors declare no conflict of interest.
References
- Emeis, S. Wind speed and shear associated with low-level jets over Northern Germany. Meteorol. Z. 2014, 23, 295–304. [Google Scholar] [CrossRef]
- Shu, Z.R.; Li, Q.S.; He, Y.C.; Chan, P.W. Investigation of low-level jet characteristics based on wind profiler observations. J. Wind Eng. Ind. Aerodyn. 2018, 174, 369–381. [Google Scholar] [CrossRef]
- Baas, P.; Bosveld, F.C.; Klein Baltink, H.; Holtslag, A.A.M. A climatology of nocturnal low-level jets at Cabauw. J. Appl. Meteorol. Clim. 2009, 48, 1627–1642. [Google Scholar] [CrossRef]
- Ferro Duarte, H.; Leclerc, M.Y.; Zhang, G.; Durden, D.; Kurzeja, R.; Parker, M.; Werth, D. Impact of Nocturnal Low-Level Jets on Near-Surface Turbulence Kinetic Energy. Bound. Layer Meteorol. 2015, 156, 349–370. [Google Scholar] [CrossRef]
- Kelley, N.; Shirazi, M.; Jager, D.; Wilde, S.; Patton, E.G.; Sullivan, P. Lamar Low-Level Jet Project Interim Report; Technical Report. NREL/TP-500-34593; National Renewable Energy Laboratory: Golden, CO, USA, 2004.
- Lampert, A.; Bernalte Jimenez, B.; Gross, G.; Wulff, D.; Kenull, T. One-year observations of the wind distribution and low-level jet occurrence at Braunschweig, North German Plain. Wind Energy 2015, 19, 1807–1817. [Google Scholar] [CrossRef]
- Gutierrez, W.; Araya, G.; Kiliyanpilakkil, V.P.; Ruiz-Columbie, A.; Tutkun, M.; Castillo, L. Structural impact assessment of low level jets over wind turbines. J. Renew. Sustain. Energy 2016, 8, 23308. [Google Scholar] [CrossRef]
- Wilczak, J.; Finley, C.; Freedman, J.; Cline, J.; Bianco, L.; Olson, J.; Djalalova, I.; Sheridan, L.; Ahlstrom, M.; Manobianco, J.; et al. The wind forecast improvement project (WFIP): A public-private partnership addressing wind energy forecast needs. Bull. Am. Meteorol. Soc. 2015, 96, 1699–1718. [Google Scholar] [CrossRef]
- Banta, R.M.; Pichugina, Y.L.; Brewer, W.A. Turbulent Velocity-Variance Profiles in the Stable Boundary Layer Generated by a Nocturnal Low-Level Jet. J. Atmos. Sci. 2006, 63, 2700–2719. [Google Scholar] [CrossRef]
- Debnath, M.C. Influence of Atmospheric Boundary Layer on Turbulence in Wind Turbine Wake. Ph.D. Thesis, University of Texas, San Antonio, TX, USA, 2014. [Google Scholar]
- Banta, R.M. Stable-boundary-layer regimes from the perspective of the low-level jet. Acta Geophys. 2008, 56, 58–87. [Google Scholar] [CrossRef]
- Storm, B.; Dudhia, J.; Basu, S.; Swift, A.; Giammanco, I. Evaluation of the weather research and forecasting model on forecasting low-level jets: Implications for wind energy. Wind Energy 2009, 12, 81–90. [Google Scholar] [CrossRef]
- Wharton, S.; Simpson, M.; Osuna, J.; Newman, J.; Miller, W. Role of Surface Energy Exchange for Simulating Wind Turbine Inflow: A Case Study in the Southern Great Plains, USA. Atmosphere 2015, 6, 21–49. [Google Scholar] [CrossRef]
- Jonkman, B.J.; Buhl, M.L., Jr. TurbSim User’s Guide; Technical Report. NREL/TP-500-39797; National Renewable Energy Laboratory: Golden, CO, USA, 2006.
- Lundquist, J.K.; Mirocha, J.D. Interaction of nocturnal low-level jets with urban geometries as seen in Joint Urban 2003 data. J. Appl. Meteorol. Clim. 2008, 47, 44–58. [Google Scholar] [CrossRef]
- Chaudhari, A.; Agafonova, O.; Hellsten, A.; Sorvari, J. Numerical Study of the Impact of Atmospheric Stratification on a Wind-Turbine Performance. J. Phys. Conf. Ser. 2017, 854, 12007. [Google Scholar] [CrossRef]
- Helmis, C.; Sgouros, G.; Wang, Q. On the Vertical Structure and Spectral Characteristics of the Marine Low-Level Jet. Atmos. Res. 2015, 152, 74–81. [Google Scholar] [CrossRef]
- Højstrup, J. Velocity Spectra in the Unstable Planetary Boundary Layer. J. Atm. Sci. 1982, 39, 2239–2248. [Google Scholar] [CrossRef]
- Olesen, H.; Larsen, S.; Højstrup, J. Modeling velocity spectra in the lower part of the planetary boundary layer. Bound.-Layer Meteorol. 1984, 29, 285–312. [Google Scholar] [CrossRef]
- NWTC Information Portal (TurbSim). Last Modified 14 June 2016. Available online: https://nwtc.nrel.gov/TurbSim (accessed on 31 January 2019).
- Kelley, N.D. Turbulence-Turbine Interaction: The Basis for the Development of the TurbSim Stochastic Simulator; Technical Report. NREL/TP-5000-52353; National Renewable Energy Laboratory: Golden, CO, USA, 2011.
- Emeis, S. Wind Energy Meteorology, 2nd ed.; Springer: New York, NY, USA, 2013; p. 34. ISBN 978-3-642-30523-8. [Google Scholar]
- Jonkman, J.; Butterfield, S.; Musial, W.; Scott, G. Definition of a 5-MW Reference Wind Turbine for Offshore System Development; Technical Report. NREL/TP-500-38060; National Renewable Energy Laboratory: Golden, CO, USA, 2009.
- Jonkman, J.; Buhl, M.L.J. FAST User’s Guide; Technical Report. NREL/EL-500-38230; National Renewable Energy Laboratory: Golden, CO, USA, 2005.
- Leishman, J.G.; Beddoes, T.S. A Semi-Empirical Model for Dynamic Stall. J. Am. Helicopter Soc. 1989, 34, 3–17. [Google Scholar] [CrossRef]
- Choukulkar, A.; Pichugina, Y.; Clack, C.; Calhoun, R.; Banta, R.; Brewer, A.; Hardesty, M. A new formulation for rotor equivalent wind speed for wind resource assessment and wind power forecasting. Wind Energy 2016, 19, 1439–1452. [Google Scholar] [CrossRef]
- Zhou, N.; Chen, J.; Adams, D.E.; Fleeter, S. Influence of inflow conditions on turbine loading and wake structures predicted by large eddy simulations using exact geometry. Wind Energy 2015, 19, 803–824. [Google Scholar] [CrossRef]
- Churchfield, M.; Lee, S.; Michalakes, J.; Moriarty, P.J. A numerical study of the effects of atmospheric and wake turbulence on wind turbine dynamics. J. Turbul. 2012, 13, 1–32. [Google Scholar] [CrossRef]
© 2019 by the authors. Licensee MDPI, Basel, Switzerland. This article is an open access article distributed under the terms and conditions of the Creative Commons Attribution (CC BY) license (http://creativecommons.org/licenses/by/4.0/).