Article

Comparison of Two Automatic Identification Algorithms for Cyclones Affecting the Changjiang River–Huaihe River Valleys

Key Laboratory of Meteorological Disaster, Ministry of Education/Joint International Research Laboratory of Climate and Environment Change/Collaborative Innovation Center on Forecast and Evaluation of Meteorological Disasters, Nanjing University of Information Science and Technology, Nanjing 210044, China
*
Author to whom correspondence should be addressed.
Atmosphere 2019, 10(3), 115; https://doi.org/10.3390/atmos10030115
Submission received: 13 February 2019 / Revised: 25 February 2019 / Accepted: 26 February 2019 / Published: 3 March 2019
(This article belongs to the Section Meteorology)

Abstract

:
In this study, two commonly used automated methods of detecting cyclones in the lower troposphere were compared with respect to various features of cyclone activity. The first method is based on the neighbor cyclone center point (NCP), while the second method is the cyclone area algorithm (CAA), which relies on the detection of the outermost enclosed contour to identify the horizontal structure of a cyclone. We obtained climatologies of cyclones that affected the Changjiang River–Huaihe River Valleys (CHV) of China (derived from ERA-Interim data for 1979–2015) and compared their structures. We found that the distribution of the track and the cyclogenesis locations of influential cyclones (ICs) showed a consistent spatial pattern between the NCP and CAA. However, there were still notable differences between the statistical features of cyclone activity derived by the NCP and CAA: (1) Only <46% of cyclones shared the same cyclone center between these two schemes. (2) ICs derived from the CAA typically had longer lifetimes and travel distances, with stronger central intensities than those from the NCP. (3) The track of ICs by the CAA with high resolution was consistent with that of ICs by the low-resolution CAA as well as the low-resolution NCP. However, compared to other methods, the high-resolution NCP presented large deviations during the early cyclone stage. The involvement of open systems in the NCP resulted in weaker cyclone intensities and increased uncertainty in cyclone tracking. On the other hand, more cyclones with stronger intensities and longer lifetimes coming from the midlatitudes were detected using the CAA. In addition, the short-lifetime ICs (<18 h) found using the CAA were active (39%) in the CHV, and were typically excluded by the NCP. These ICs had comparable center intensity and showed a good correlation with the occurrence of simultaneous rainfall events.

1. Introduction

Extratropical cyclones play a fundamental role in transporting meridional heat and energy and are a contributor of air mass redistribution, as well as playing a dominant role in global circulation. Moreover, extratropical cyclones and their associated frontal systems can cause apparent or intense weather phenomena, such as extreme temperature events, heavy rainfall, severe storms and storm surges, which can substantially affect the social economy and people’s lives [1,2,3,4,5,6,7].
There has been a remarkable renewal of interest in extratropical cyclone activity in recent years under the effects of global climate change [8,9,10,11,12,13,14,15]. Quantification of the long-term activity of cyclones is typically based upon a range of characteristics including cyclone track counts and cyclone center frequencies, as well as cyclogenesis frequency, lifetime, intensity, travel speed and size. In the early days, researchers manually identified and analyzed the activity characteristics of cyclones based on weather maps. However, the recognition efficiency of this method is relatively low and more or less subjective. With the development of computer technology, automatic objective identification methods began to appear in the 1990s and were developed in the subsequent decades [8,9,10,11,16,17].
Two kinds of automatic objective identification methods are popular. A tracking algorithm based on a neighbor center point (NCP) in two successive time steps is widely applied because of its simplicity and efficiency [18]. The 1D features of cyclones, such as location, track and intensity, can be efficiently derived using the NCP. However, the horizontal structure and other 2D features of cyclones cannot be directly obtained using this scheme. Therefore, in recent years, another scheme, the cyclone area algorithm (CAA), has been proposed to identify the cyclone regime [9,11,17,19,20]. This feature facilitates an explicit study of the 2D characteristics of cyclones. In addition, the cyclone area algorithm can filter out open systems because of the strict outmost contour line and may reduce the uncertainty of cyclone recognition introduced by the inclusion of open systems [21].
Due to the various criteria of different algorithms, diagnostics are also valuable when comparing cyclone activity across different datasets [22,23] or across different tracking algorithms using a given reference dataset [18]. Therefore, 15 international research groups have recently participated in an inter-comparison project (Inter-comparison of Mid-Latitude Storm Diagnostics—IMILAST) to assess the level of uncertainty in different methods, including both the NCP scheme and the CAA [18]. They used 15 methods for the automatic identification of cyclones to analyze the similarities and differences in the characteristics of the cyclones revealed by different algorithms, thus assessing the applicability of the various algorithms [18,24,25,26]. However, due to the relatively ambiguous structure of extratropical cyclones, the uncertainty of cyclone detection and tracking, especially for small-scale systems or in the early stages of cyclones, is still a challenging issue [18,27,28,29].
The Changjiang River–Huaihe River Valley (CHV) area is located in a densely populated area of China, with intensive industrial and agricultural production. Extratropical cyclones are active in the CHV, especially in the spring, because the CHV lies near the eastern side of the lee slope of the Tibetan Plateau [30]. Both the East Asian subtropical jet and the East Asian polar-front jet play important roles in the cyclone activity in the boreal spring [31,32]. Moreover, these cyclones are usually accompanied by regional severe rainfall events [33].
Due to the diversity of the terrain and in particular, the combined effects of the abovementioned two jet streams, cyclones affecting the CHV region are highly diverse, including large-scale cyclones from northern China, low vortices propagating from southwestern China and locally generated cyclones in spring [33]. These cyclones, which have different dynamic structures, may increase the uncertainty of automatic identification among different methods. In this study, we will address the following questions: Do the NCP and the CAA produce significantly different results for the CHV? If so, which scheme is preferred for cyclone identification in the CHV? This inter-comparison can shed light on the different physical perspectives that can be obtained by using different cyclone identification approaches.

2. Data and Method

2.1. Data

The data used in this study are springtime (March, April and May) six-hourly reanalysis from the ERA-Interim dataset from 1979 to 2015 [34]. With reference to [18], we used 1.5° × 1.5° sea level pressure (SLP) to identify cyclones in the CHV and filtered out short-lifetime cyclone tracks (<18 h).

2.2. Methods of Cyclone Identification

In this study, we adopted two automated algorithms for cyclone identification, which are introduced in detail in this section.
(1) Neighbor center point (NCP)
With reference to [16], the NCP in this study uses the location of central points with low values as the center point of a candidate cyclone. That is, when the SLP at a certain point is lower than the heights of its neighboring eight grids and the minimum SLP gradient value is higher than Gmini (0.15 hPa (100 km) −1), the point is marked as the center of a cyclone. If the center point of cyclone is located in the CHV, we consider that the cyclone affects the CHV. Furthermore, two points with a horizontal distance of less than dmax (600 km) are considered to be the same cyclone.
If the distance between the center points of the sub-cyclones in two consecutive time steps is not greater than Dmax (600 km), these two cyclones are connected by the same cyclone trajectory.
(2) Cyclone area algorithm (CAA)
This algorithm refers to the modified automatic cyclone identification algorithm in [21], which starts from the center point of the cyclone and searches outward to the outermost closed contour horizontally (contour interval: 2 Pa, maximum area: 3.14 × 10⁶ km2, which has an equivalent circular “radius” of 1000 km). Then, the areas enclosed by the contours are identified as the domains of cyclones (the cyclone regime). Unlike the NCP, which uses the cyclone center, for this algorithm, the cyclone is considered to affect the CHV once the grid points of the cyclone regime are determined to fall in the CHV.
If two cyclones share common feature areas in two consecutive time steps, then these two cyclones are connected by the same cyclone trajectory. To avoid missing fast-moving cyclones without common feature areas, similarly to the NCP, the nearest neighbor approach is applied to cyclone centers, with the enclosed contours imposing thresholds on the maximum displacement distance at Dmax (600 km) within 6 h.
In both the NCP and CAA, if the cyclone affects the CHV for at least one time step during the cyclone lifetime, we call it an influential cyclone (IC).

3. Characteristics of ICs by Two Algorithms

3.1. IC Tracks

We used two automatic algorithms to obtain the number and tracks of ICs in the spring. As shown in Figure 1, the tracks of ICs with a ≥18 h lifetime showed good agreement between the two algorithms. In general, there were three paths calculated by both algorithms (Figure 1). The first major path with the highest frequency (36.54% in CAA, 29.5% in NCP) was southwest–northeast, from the CHV to Japan, steered by the subtropical westerly jet from the southeast part of China (Figure 2). This path agreed well with the path proposed by [35] using historical weather maps from the National Meteorological Center of China Meteorological Administration according to the definition of a traditional CHV cyclone. We found that many ICs were generated in the CHV or originated from the southwest of the CHV and then moved northeastward/eastward to Japan. The other two paths were from northwest to southeast and eastward, guided by the East Asian polar jet. Most cyclones in the latter two paths were midlatitude cyclones with larger scales than those from the first path.
Because of the difference in judgment regarding ICs between the two algorithms, there were more cyclones coming from the northern area (NW and NE) in CAA. The frequencies of the latter two paths were greater than 20% in CAA but were lower than 8.3% in NCP. The reason for this is that once the grid points of the cyclone regime fall in the CHV, the cyclone is marked as an IC in the CAA; whereas the center points of ICs must fall in the CHV in the NCP.

3.2. Cyclogenesis and Cyclolysis of ICs

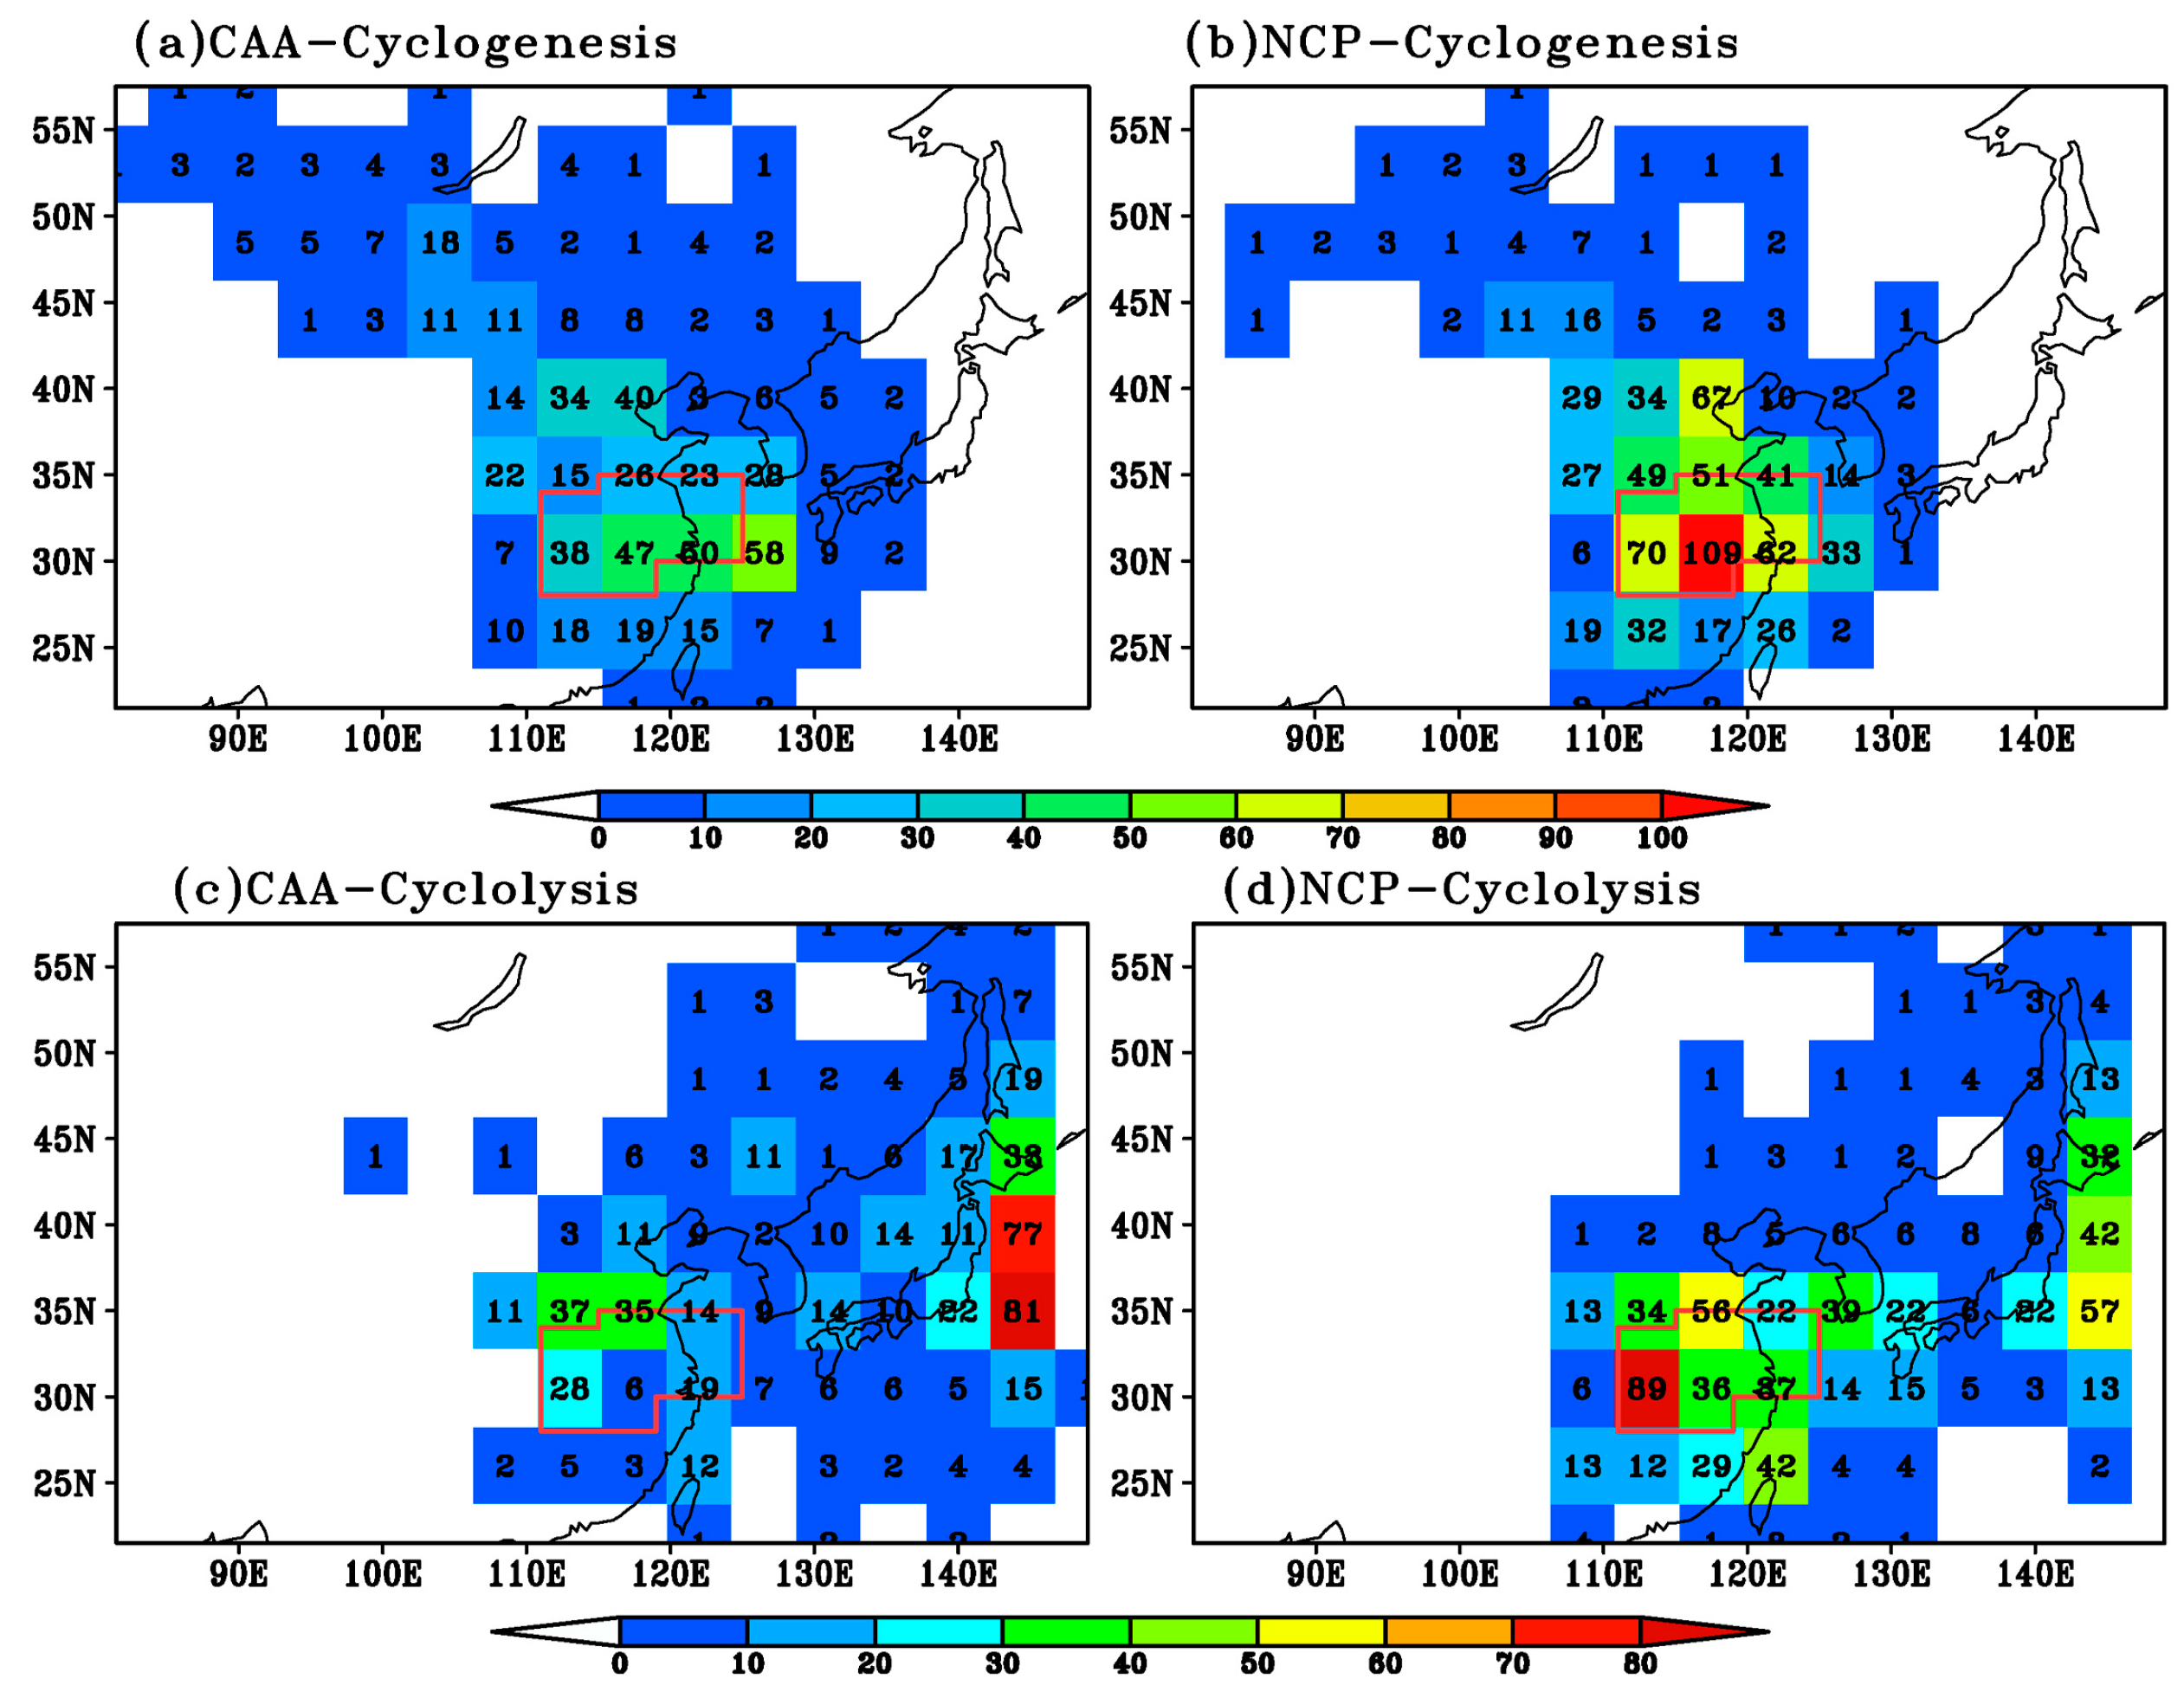
Regarding the spatial distribution of the points of cyclogenesis, the two methods were in good agreement, while there were apparent differences in the cyclolysis of the ICs (Figure 3). The source of cyclones is widespread and stretches northwest–southeast. The source of these tracks includes the CHV and its surroundings, the West Siberian Plain, the Inner Mongolian Plateau and the East Sea. The distribution of the cyclolysis of ICs were mainly from the CHV to the east to Japan. However, the area with the highest frequency of cyclolysis in the NCP (CAA) was located in the CHV (east to Japan and probably extending further). The distribution of the highest frequency of cyclolysis indicates that there were more ICs detected in the CAA moving to the east to Japan continuously after moving out of the CHV. We speculate that this feature is related to the longer lifetimes of ICs detected by the CAA; this is analyzed in detail below.

4. Comparison of IC Climatology Using the Two Algorithms

4.1. Climatological IC Frequencies

Despite the general agreements in the spatial distribution of the tracks and the cyclogenesis locations of the ICs, there are some differences in IC climatology between the two schemes. As shown in Table 1, comparable numbers of ICs were detected by the CAA (5776) and the NCP (6070). However, only 2666 cyclones shared the same cyclone center between these two schemes. These cyclones accounted for 46% of the total number in the CAA and 44% in the NCP. In this sense, there is substantial inconsistency in the climatological IC frequencies between the two schemes. This inconsistency is due to the following three reasons. First, the CAA requires a closed contour line at the outer margin of the ICs to potentially filter out open low systems that are possibly associated with a low-level trough. In this study, 2193 ICs detected in NCP did not have apparent closed contours, which contributed to a higher frequency of ICs compared to the CAA. The second reason for more ICs being identified by the NCP is that the CAA considers a multicenter system that shares the same outermost closed contours as one system. However, in the NCP, once these inside center points reached a certain distance from each other (here ≥600 km), they were divided into multiple systems. We found that there were 1211 double-counted ICs in the NCP. On the other hand, the ICs were marked by the CAA once the cyclone regimes affected the CHV, in contrast to the NCP, where their center points needed to be located in the CHV to be marked as an IC. We found that 2958 (51%) center points of ICs did not fall into the CHV using the CAA. The above three aspects resulted in a comparable frequency between the two schemes, although a large portion of ICs were non-center-overlapped.

4.2. Lifetime, Travel Distance and Intensity

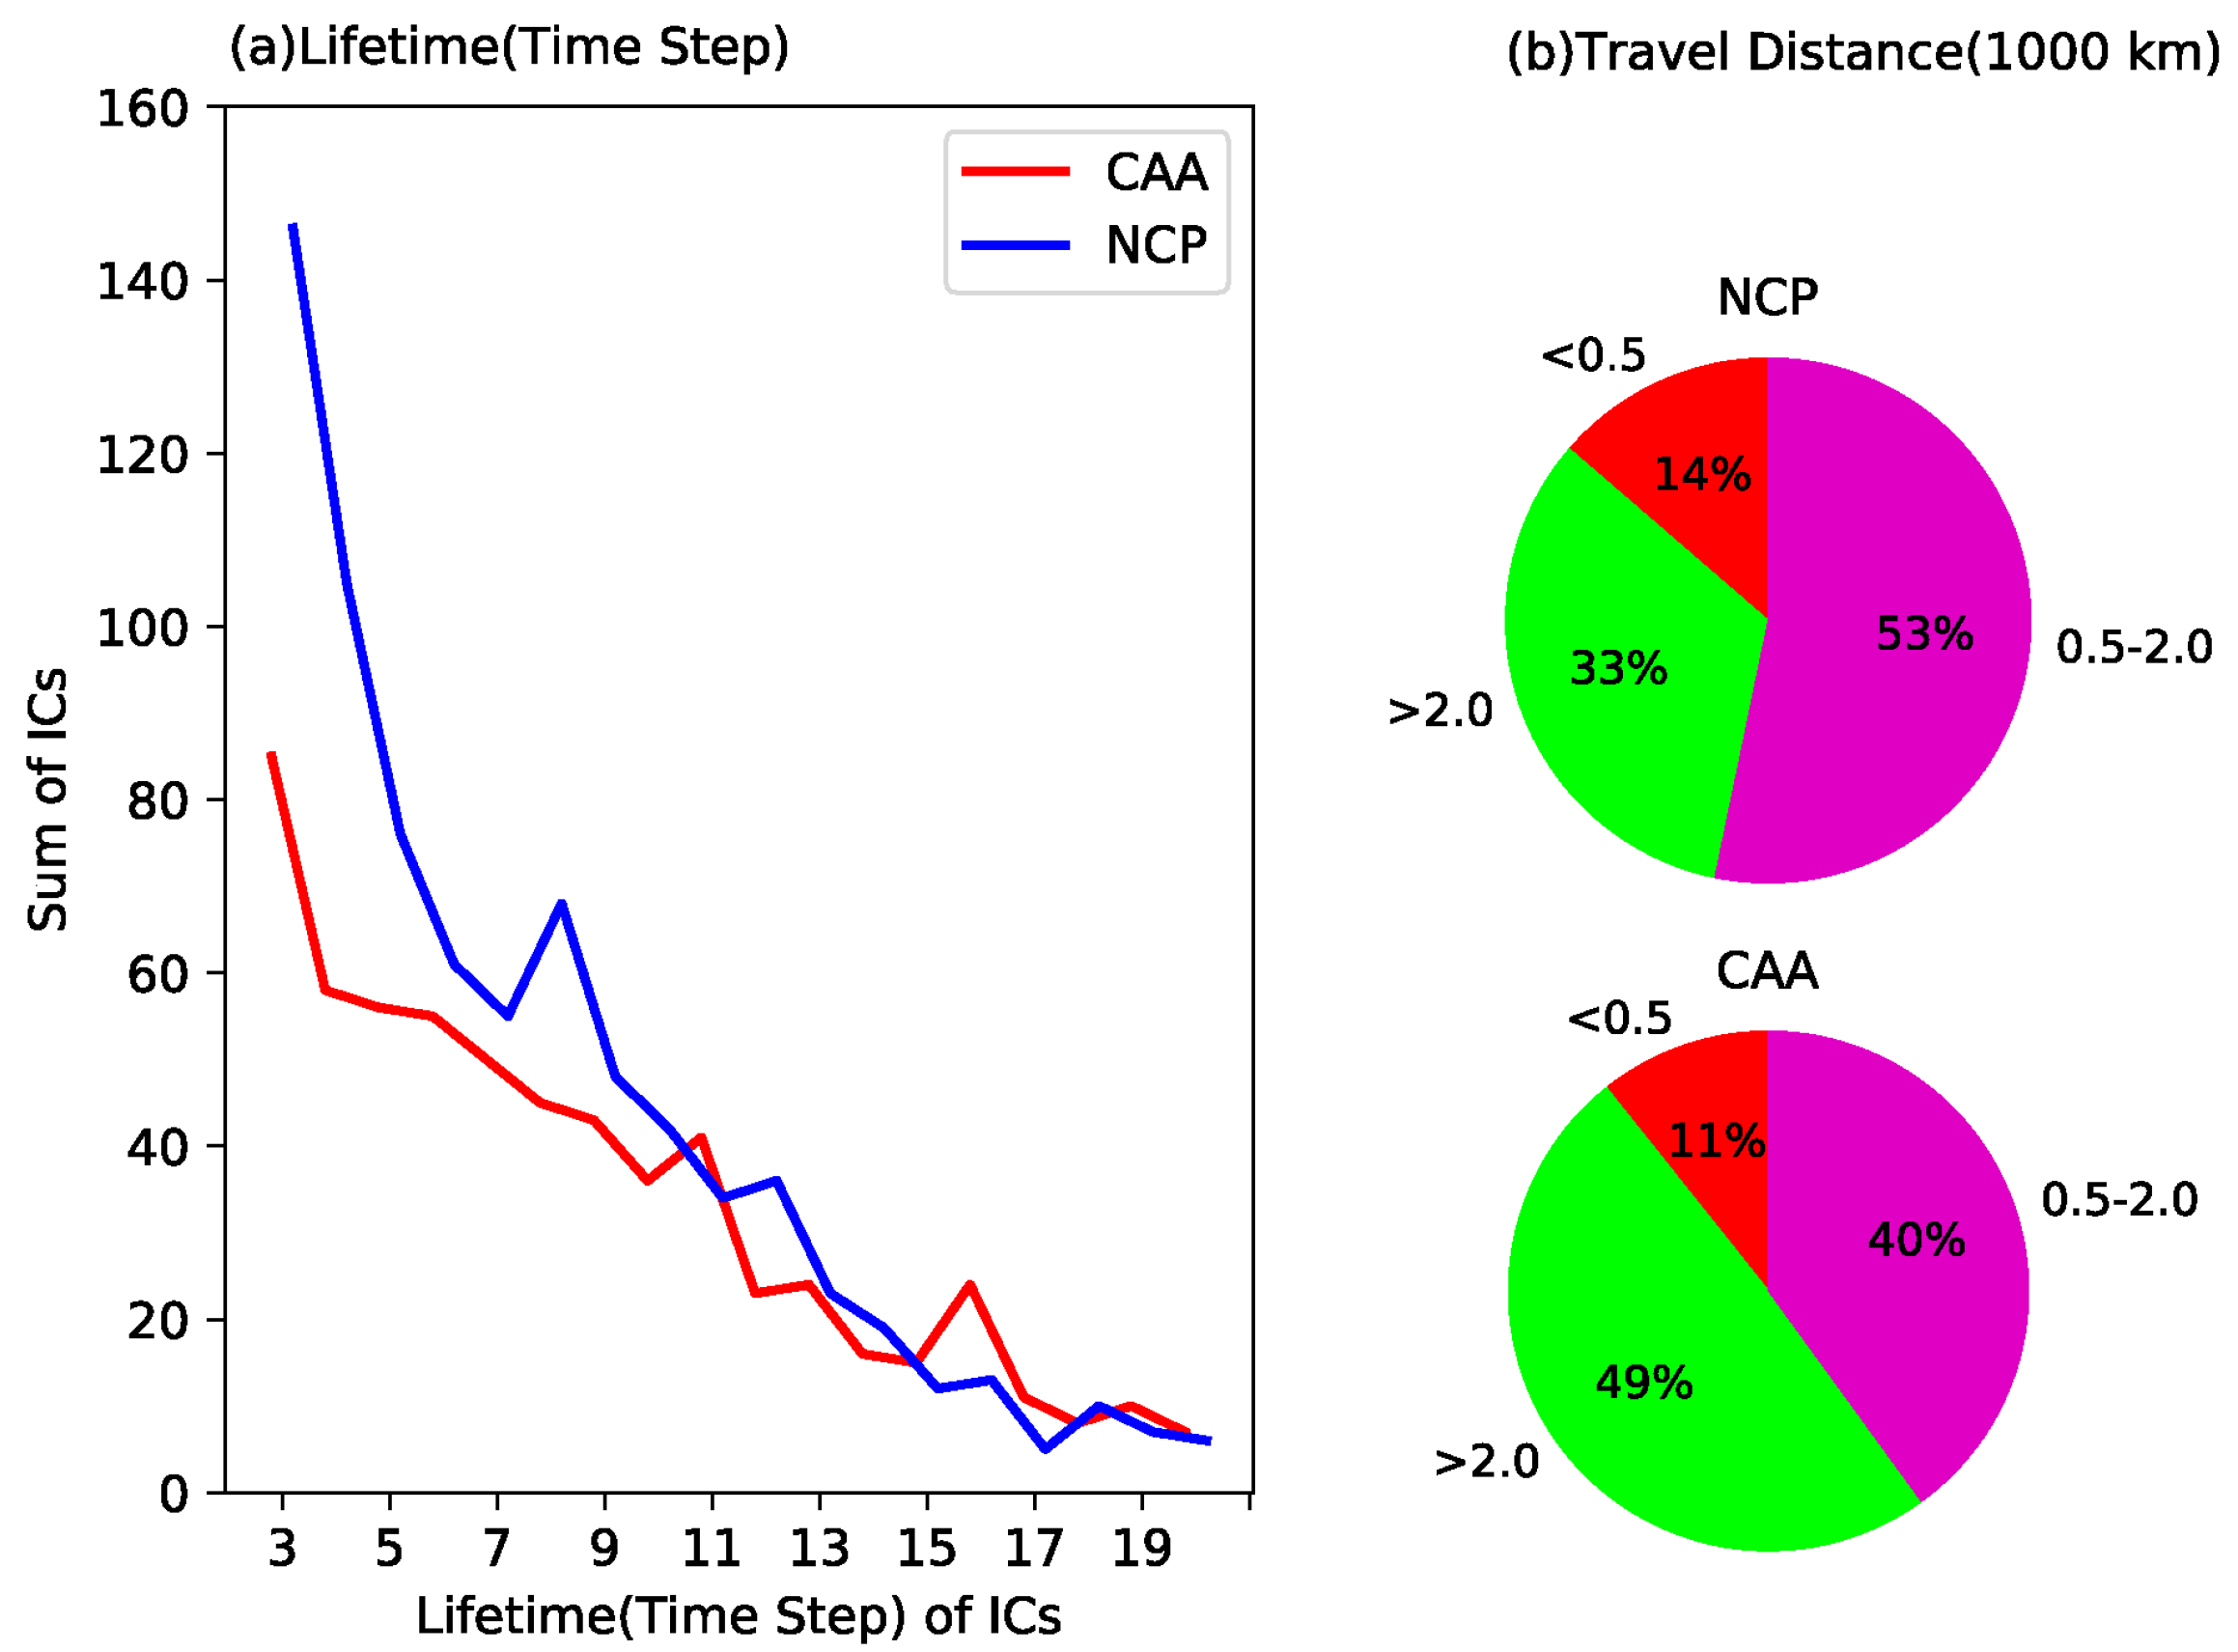
The average lifetime of ICs was 54.5 h under the CAA, which was slightly longer than under the NCP (46.5 h). According to the statistics, the CAA and NCP found that 98% and 96% of the ICs had lifetimes of less than 120 h, respectively. We present the lifetimes of the ICs (≤120 h) in Figure 4a. The ICs with lifetimes of <54 h in these two schemes are distinct from each other. When the lifetime was between 3 and 8 time steps (18–48 h), the number of ICs under the CAA was notably smaller than under the NCP. This result indicates that the NCP detected more short-lifetime ICs than the CAA. The IC travel distances show that the ICs also had longer travel distances under the CAA than the NCP (Figure 4b). In particular, the proportion of ICs with a travel distance of >2000 km was 49% under the CAA, which is notably larger than 33% under the NCP. The longer travel distance under the CAA also explains its further spatial distribution of cyclonelysis compared to the NCP, as shown in Figure 3. Therefore, compared to the NCP, the CAA detected more ICs with longer lifetimes and travel distances. As mentioned above, the ratio of ICs from the northern region (NW and NE) determined using the CAA was higher than that determined using the NCP (Table 2), and these ICs showed longer lifetimes (passing a 0.01 significance t-test). These cyclones generally had stronger intensities and longer lifetimes due to a higher baroclinic instability embedded in the midlatitude westerly zone.
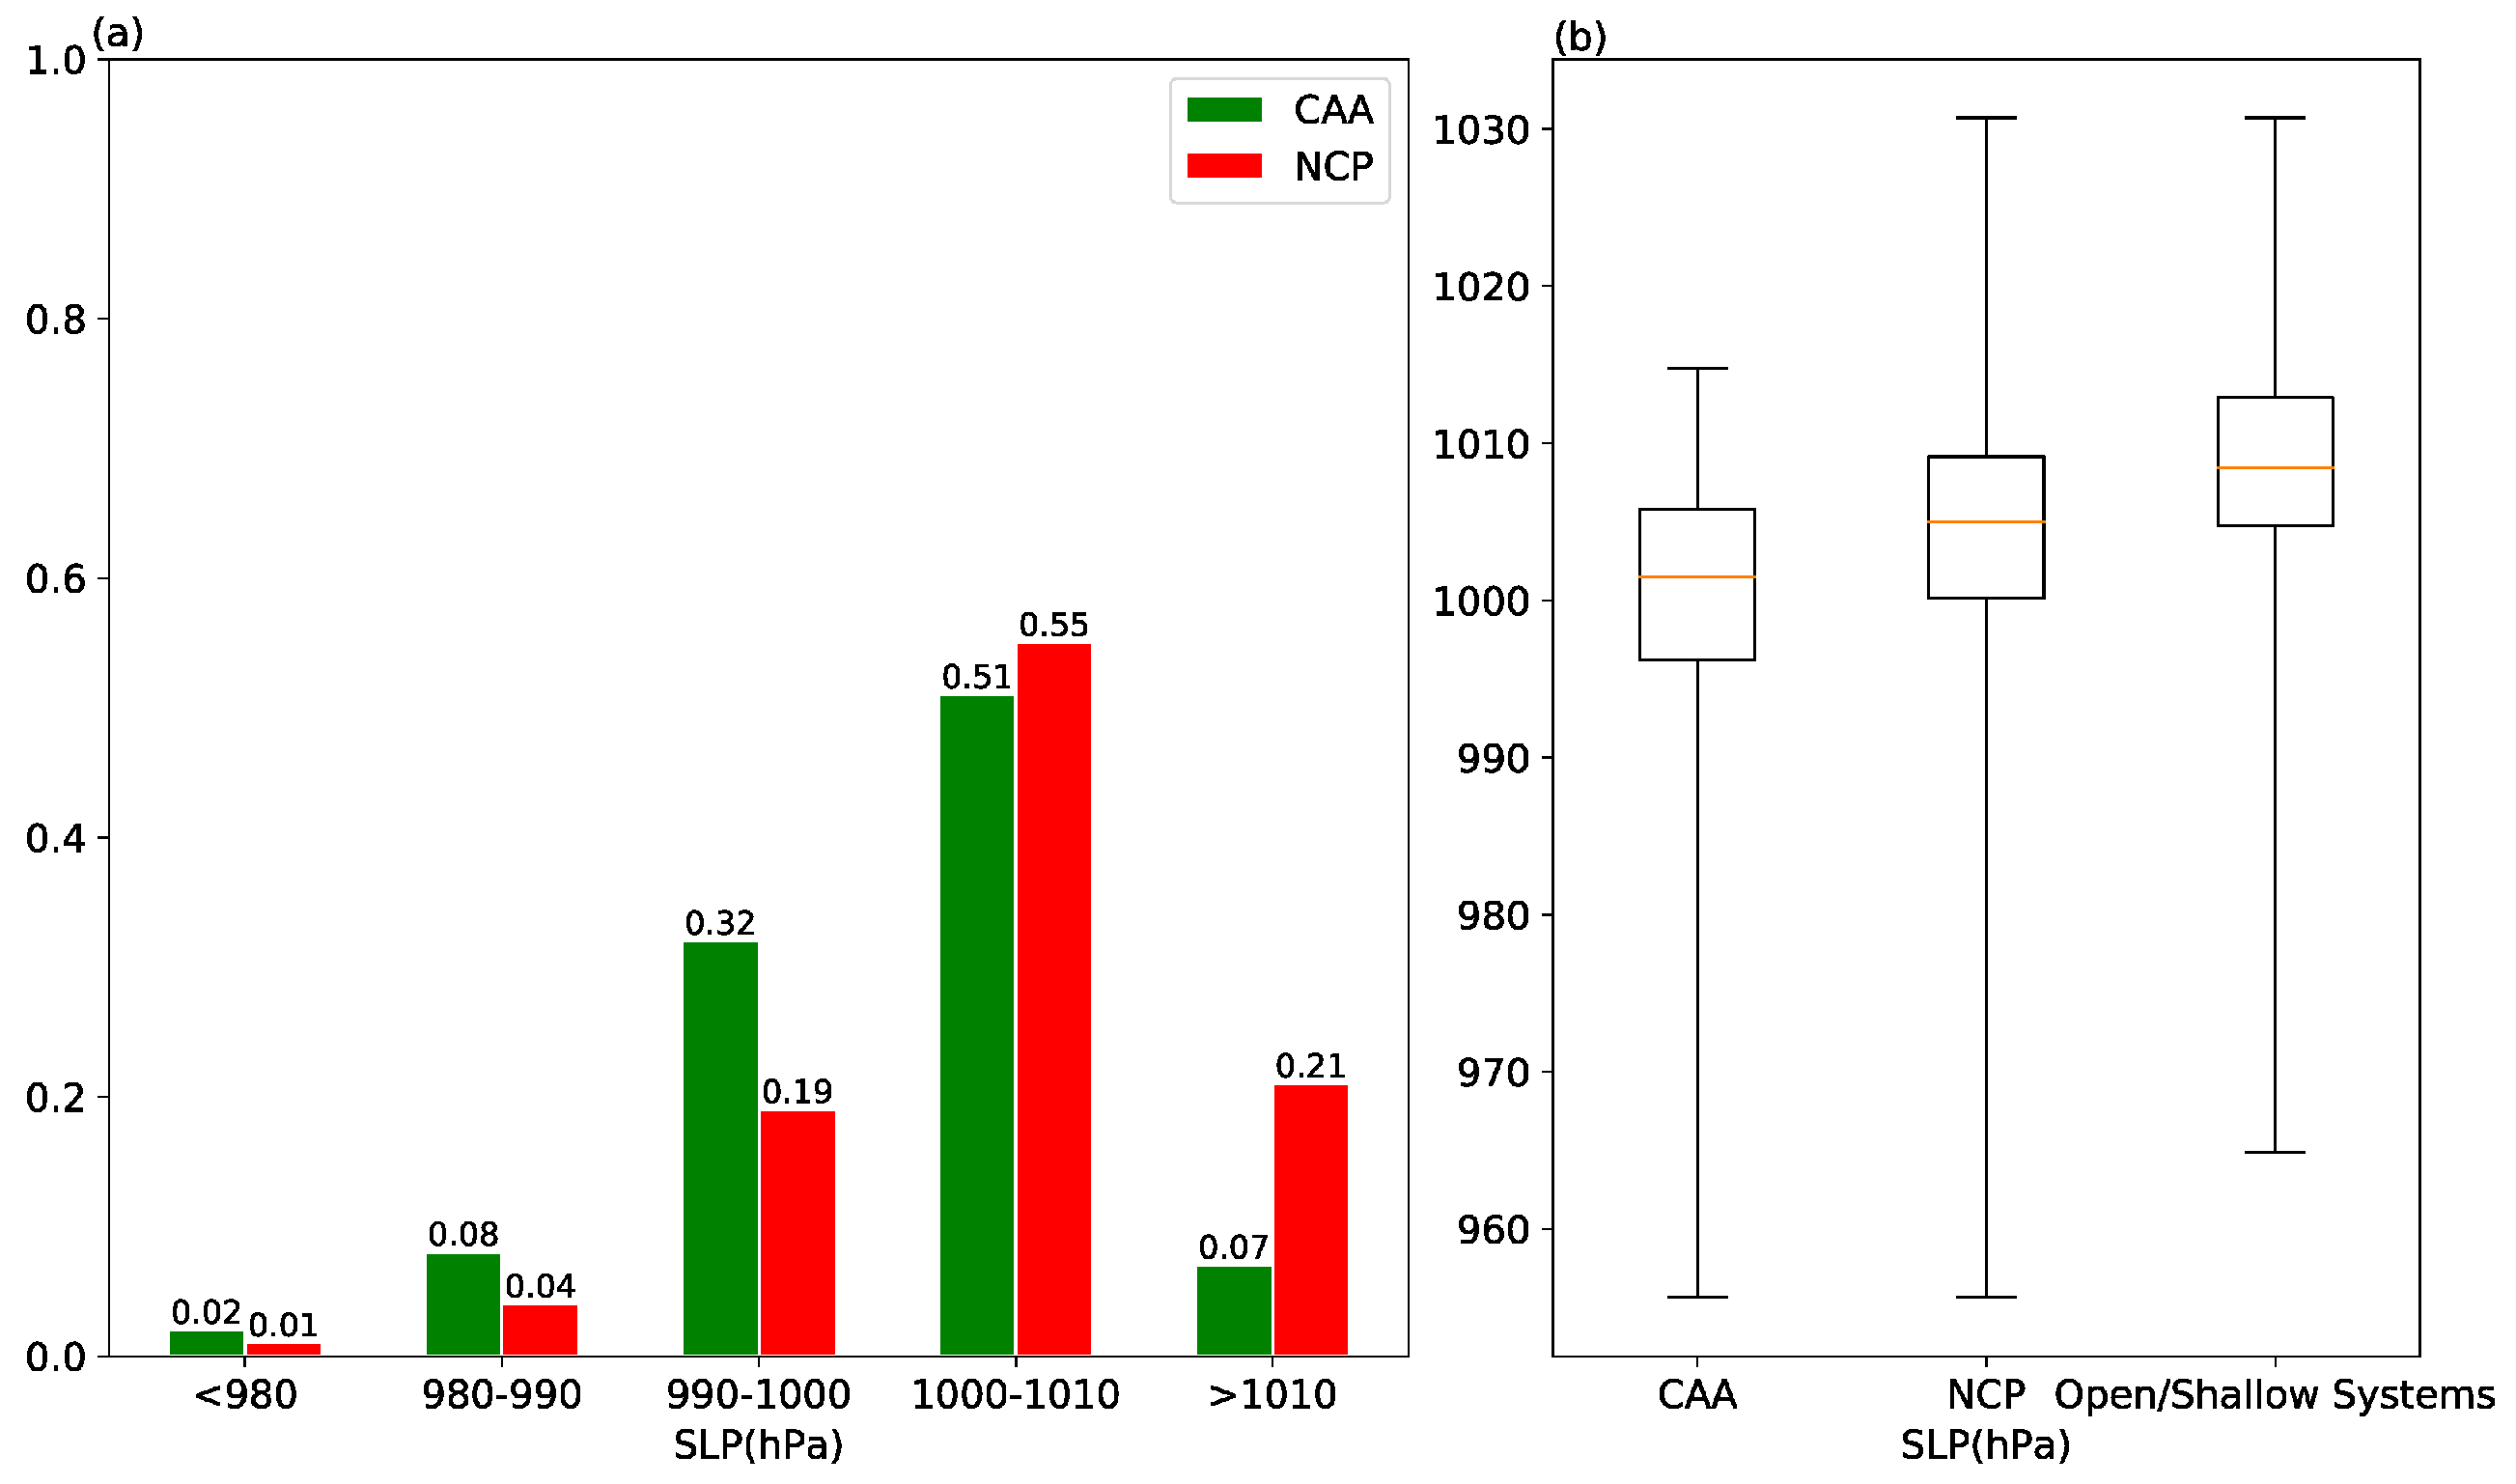
The probability distribution function of the intensity described by the cyclone center SLP also showed conspicuous diversity between the two schemes (Figure 5). A larger portion of intense ICs (center SLP ≤ 1000 hPa) was detected by the CAA compared to the NCP. In contrast, more shallow cyclones (>1010 hPa) were identified with the NCP (21%) than with the CAA (7%) (Figure 5a). As shown in Figure 5b, the 1/4, median and 3/4 critical values of the center-SLP under the CAA were 996.21 hPa, 1001.50 hPa, and 1005.82 hPa, respectively, which is lower than those from the NCP (1000.13 hPa, 1004.98 hPa, 1009.14 hPa, respectively). This suggests that ICs found using the CAA were stronger on average. We noticed that 39% of ICs found using the NCP were open systems without a closed contour. These open systems derived using the NCP were remarkably weaker than the closed systems detected by the CAA (Figure 5b). In particular, most of the ICs (18 h ≤ lifetime ≤ 48 h) found using the NCP were associated with open systems (Table 3), which are strictly excluded by the CAA. Therefore, the involvement of open systems in the NCP and more midlatitude cyclones in the CAA resulted in a stronger cyclone center-SLP of cyclones identified using the CAA compared to the NCP.

5. Sensitivity of the Two Algorithms to the Dataset Resolution

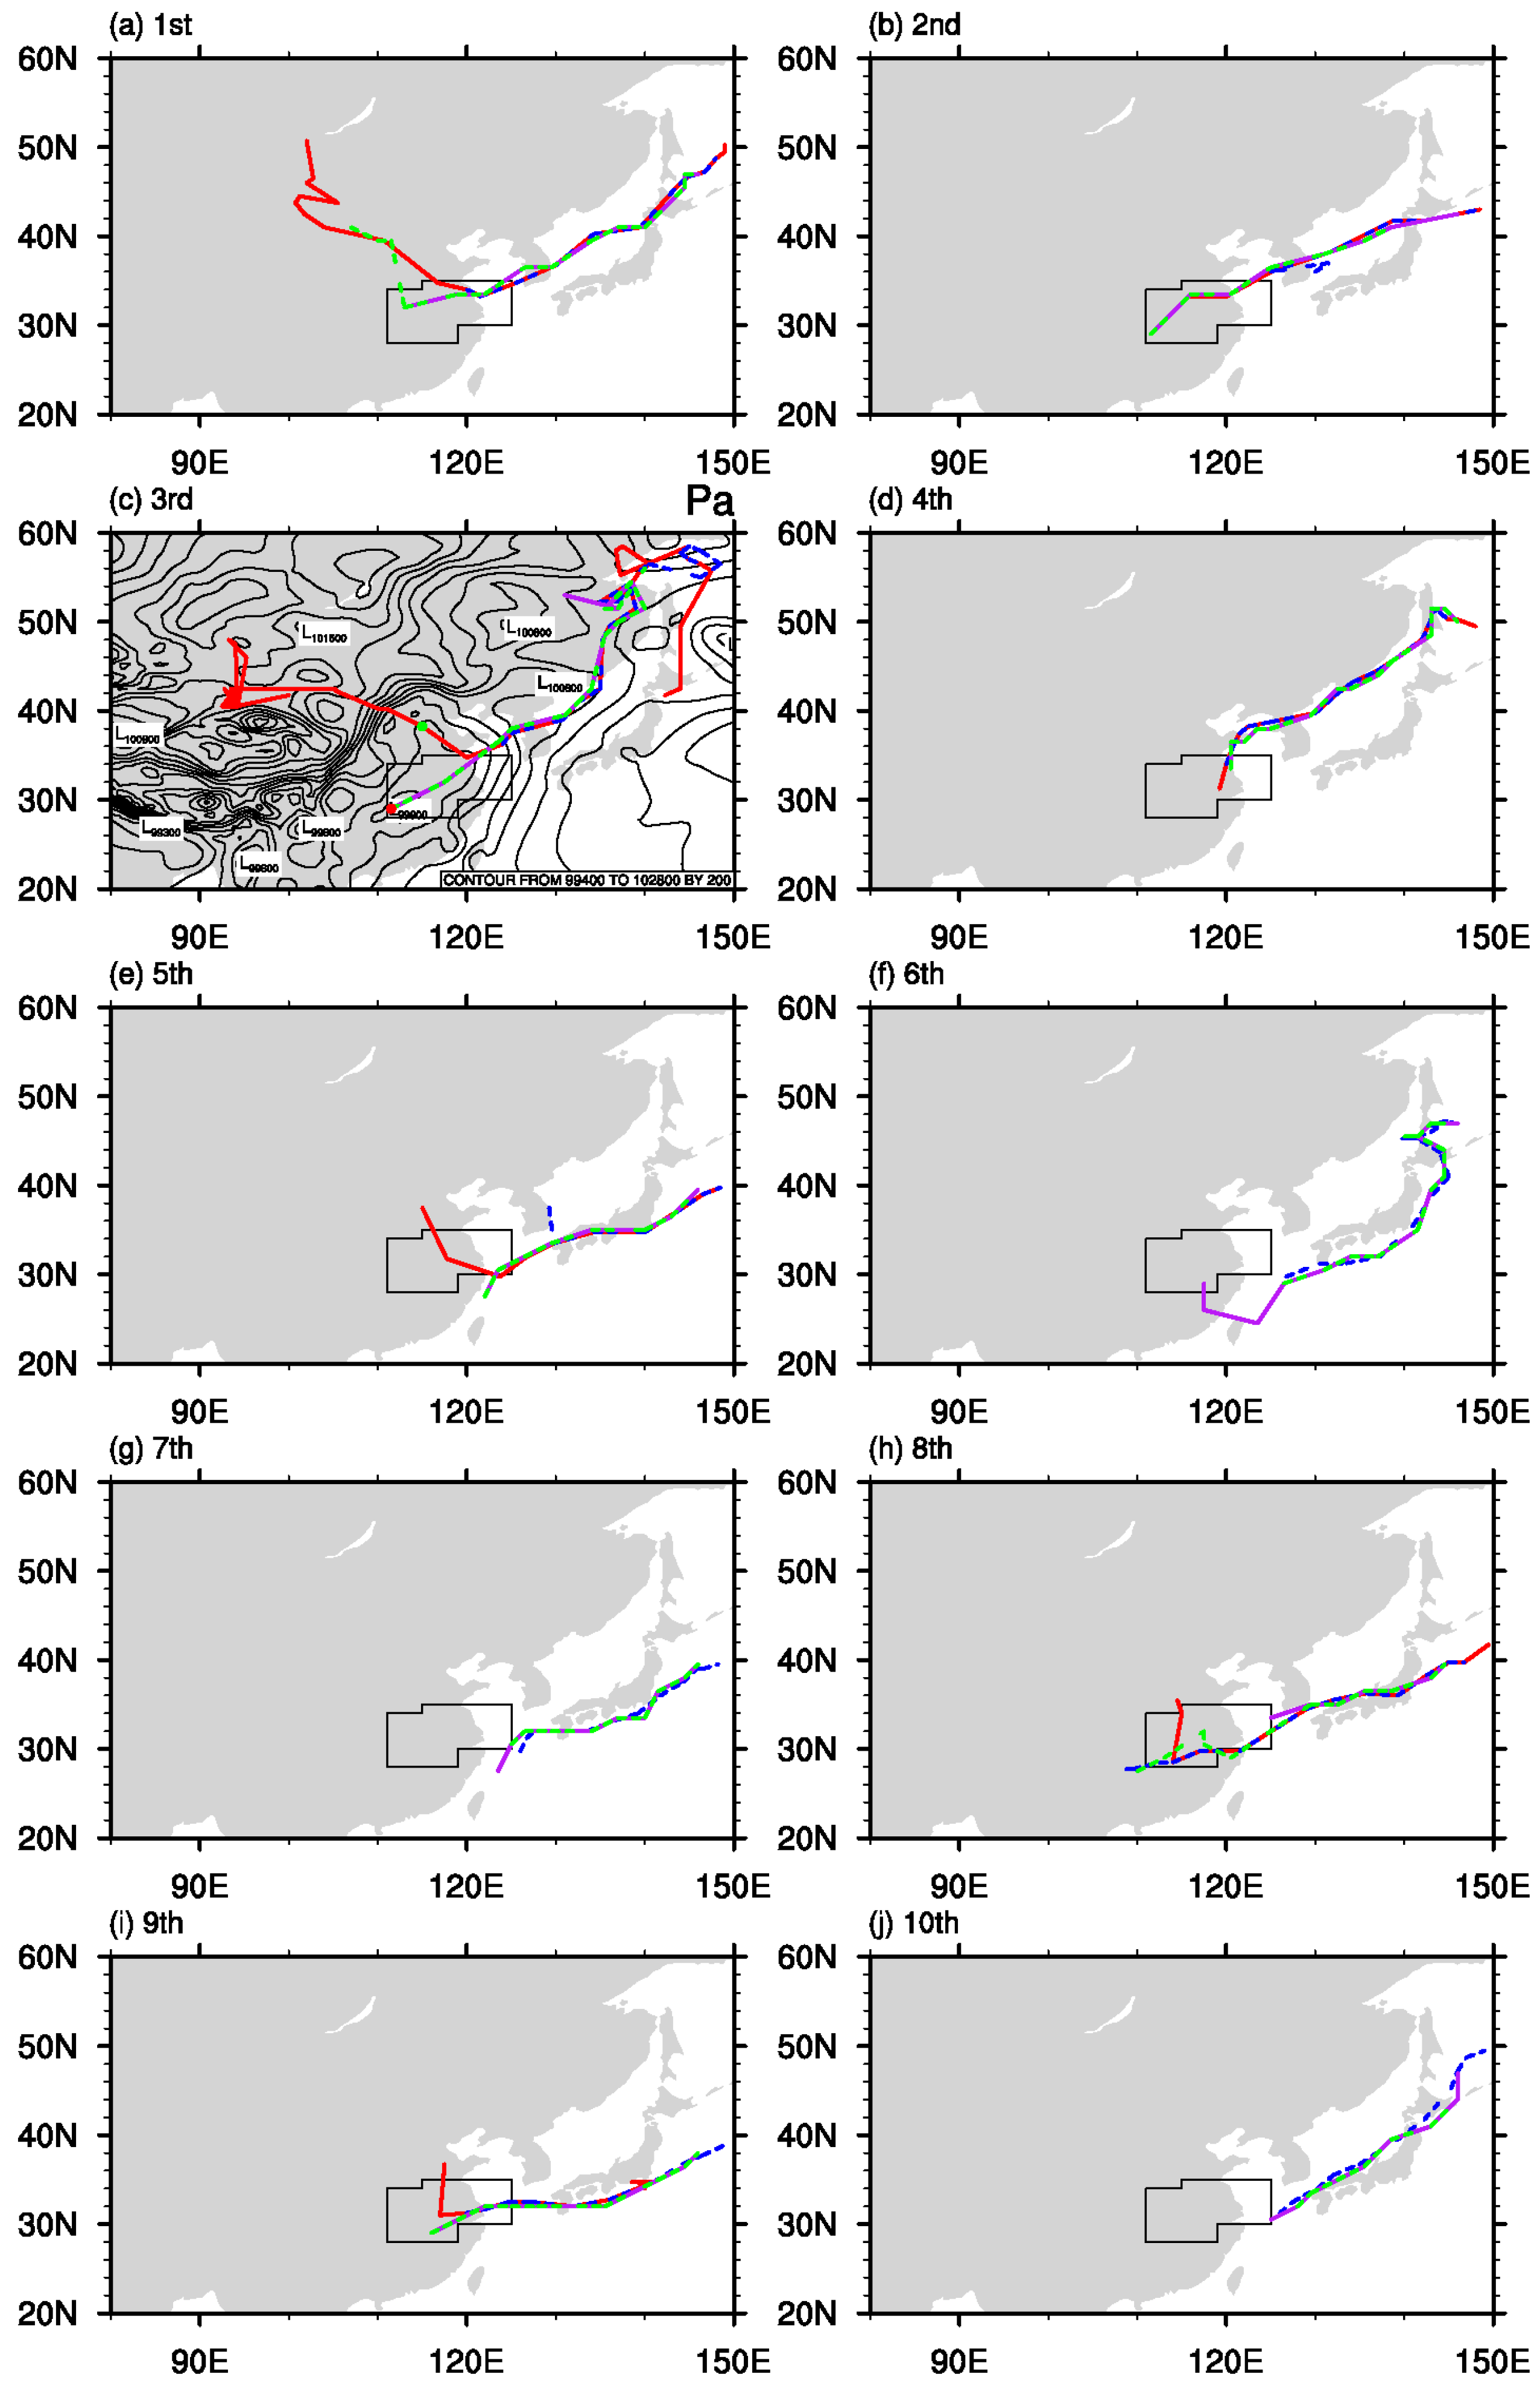
With the rapid development of computer science, the resolution of reanalysis data is becoming increasingly higher. More small-scale cyclones and more details about cyclones can potentially be obtained with higher-resolution datasets. In this section, to test the identification ability of these two methods for cyclone identification under higher-resolution (0.25° × 0.25°) datasets, we applied the two algorithms to two different horizontal resolutions of data (high-resolution NCP—H_NCP, low-resolution NCP—L_NCP, high-resolution CAA—H_CAA, and low-resolution CAA—L_CAA). As shown in Table 4, utilizing the dataset with relatively higher resolution, both algorithms detected more ICs. However, H_NCP detected too many ICs, approximately 59,519 in total, 60% of which were open or shallow systems. Moreover, only 16% of IC centers detected using the H_NCP overlapped with the ICs identified using the H_CAA. In addition, these open or shallow vortices may increase the uncertainty in the determination of IC paths. For example, 10 paths with the lowest center-SLP in the spring are shown in Figure 6. Among these 10 cases, L_NCP, H_CAA and L_CAA were highly fitted, while H_NCP had a large deviation, particularly for path 1, path 3, path 5, path 8 and path 9 during their early stages. For these five paths, we found that most (>55%) of the cyclone centers that were detected using the H_NCP before overlapping with the other three tracks—L_NCP, H_CAA and L_CAA—were open or shallow systems, such as the SLP-center (green dot) shown in Figure 6c. These examples demonstrate that induced open systems could reduce the accuracy of cyclone tracking. Satake et al. [36] also reported that the resolution dependencies were greatly relieved using the neighbor enclosed-area tracking algorithm.

6. Characteristics of ICs with Short Lifetimes

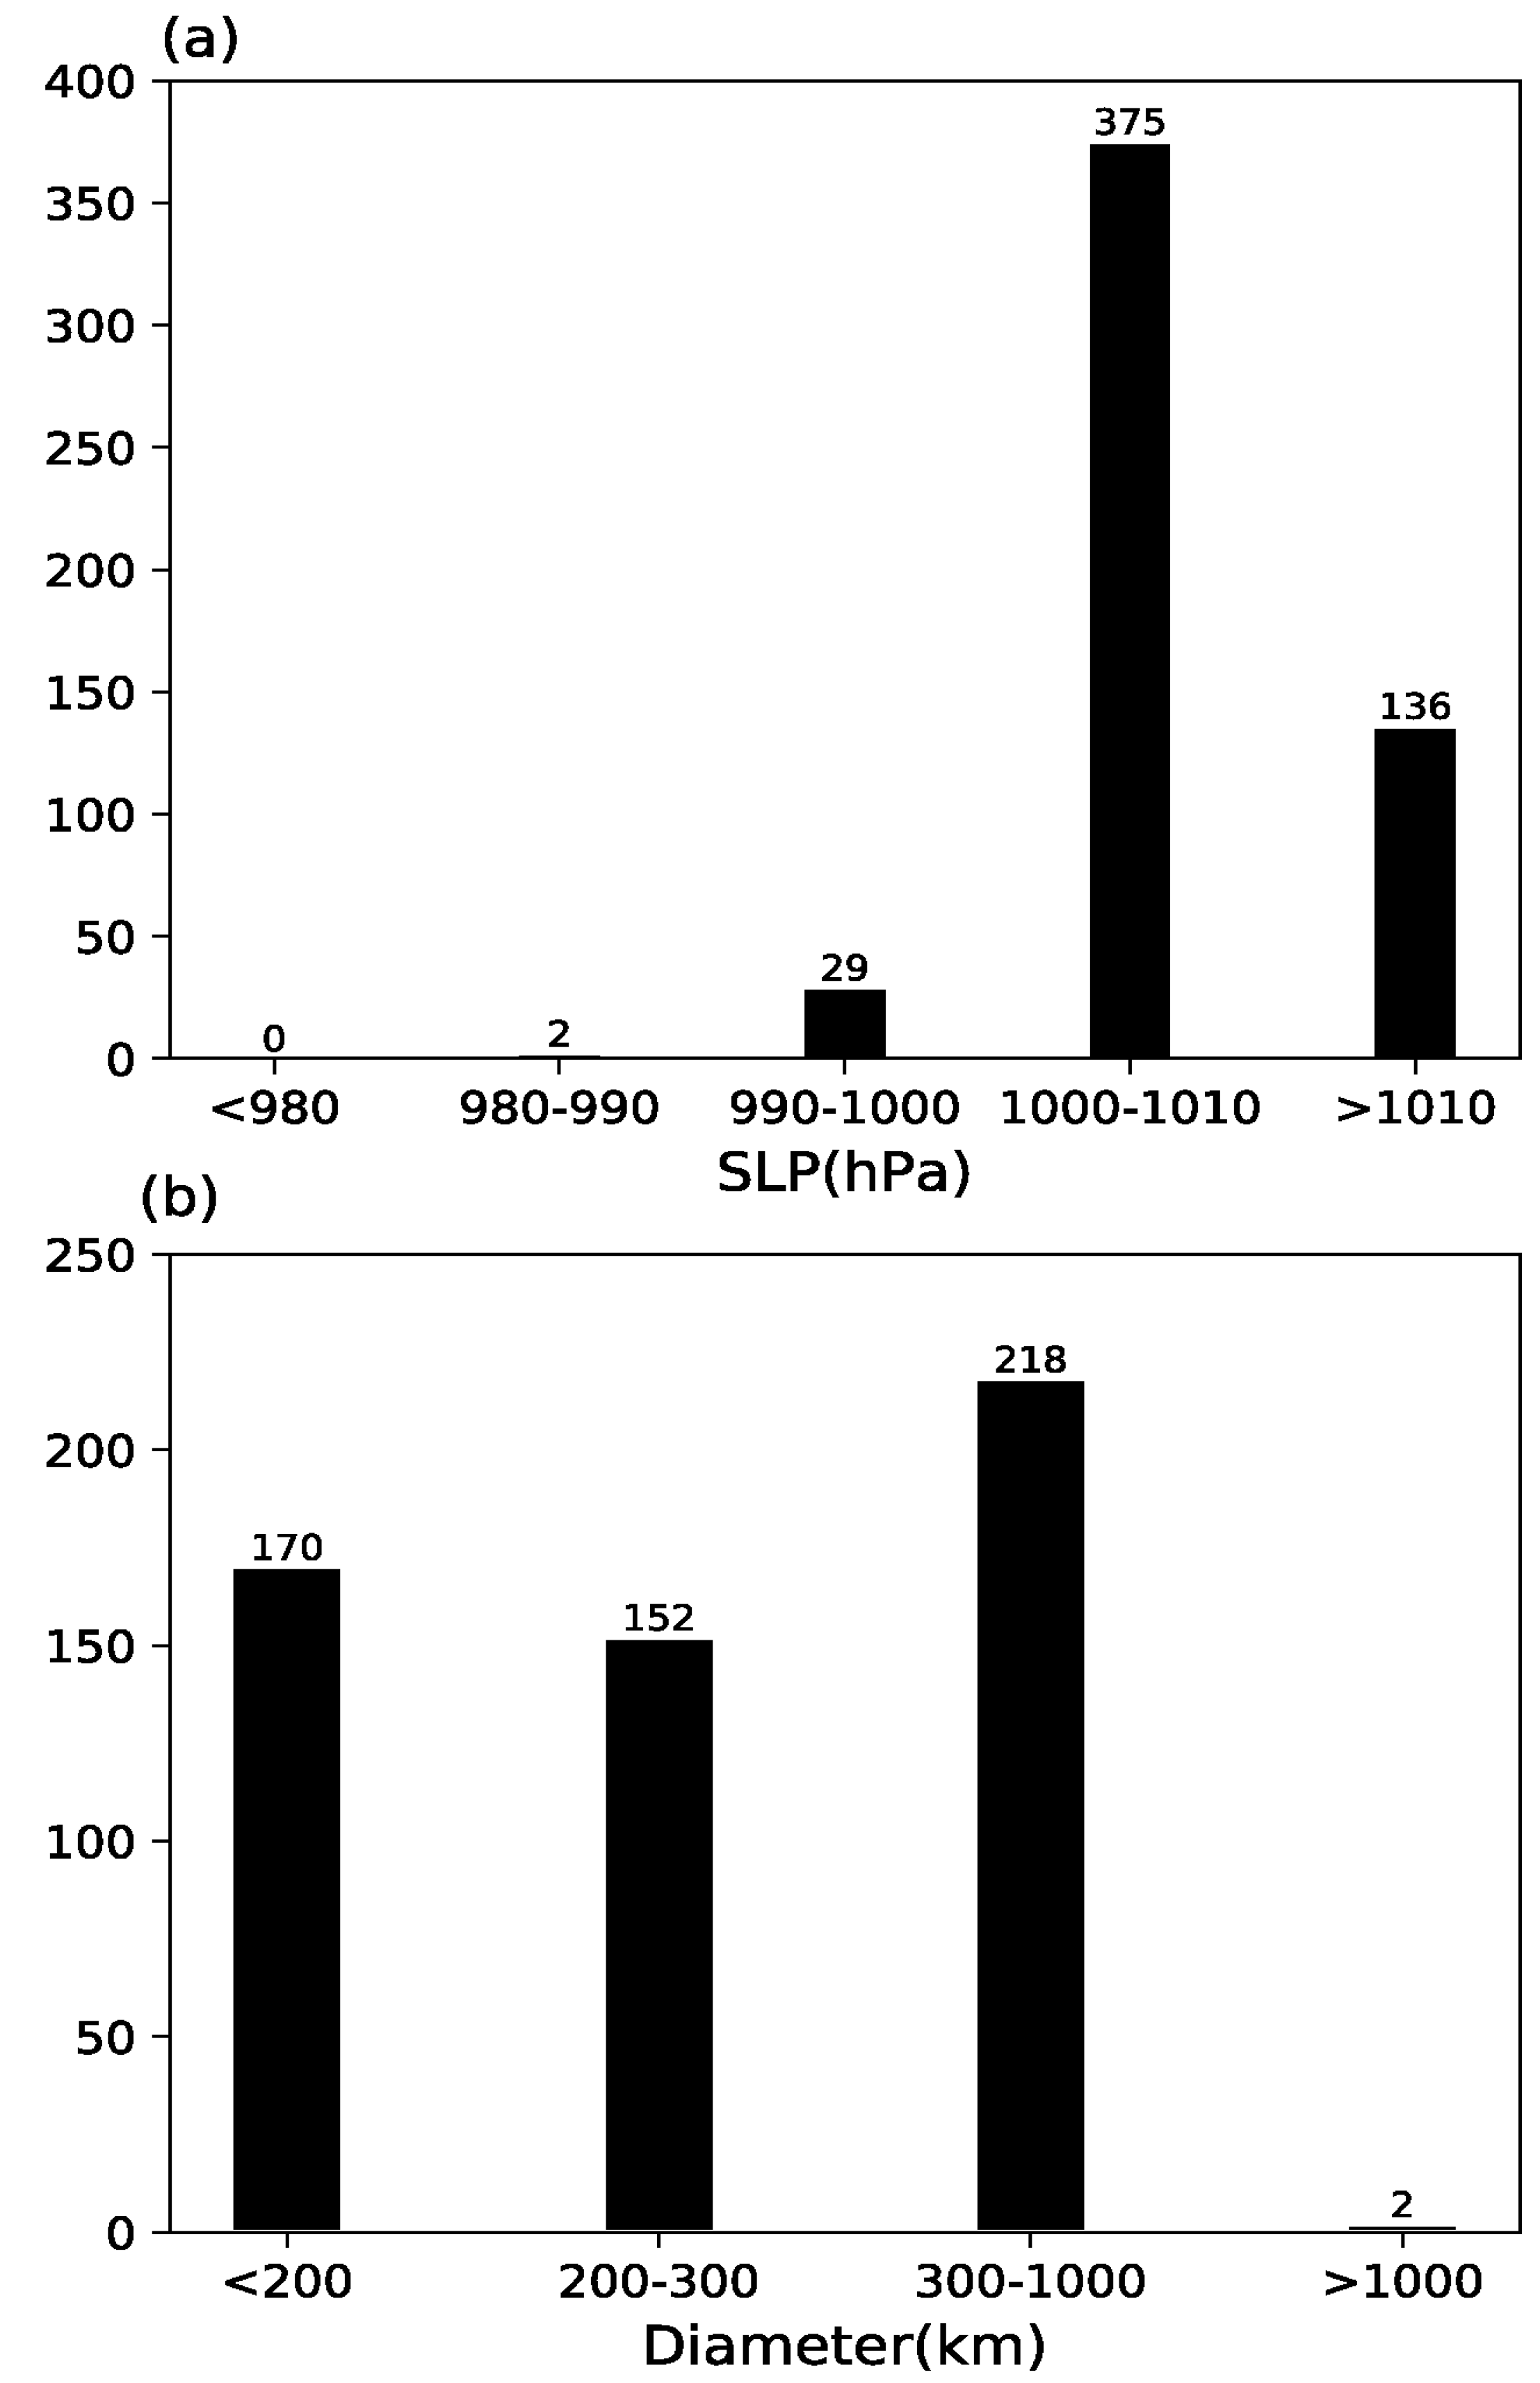
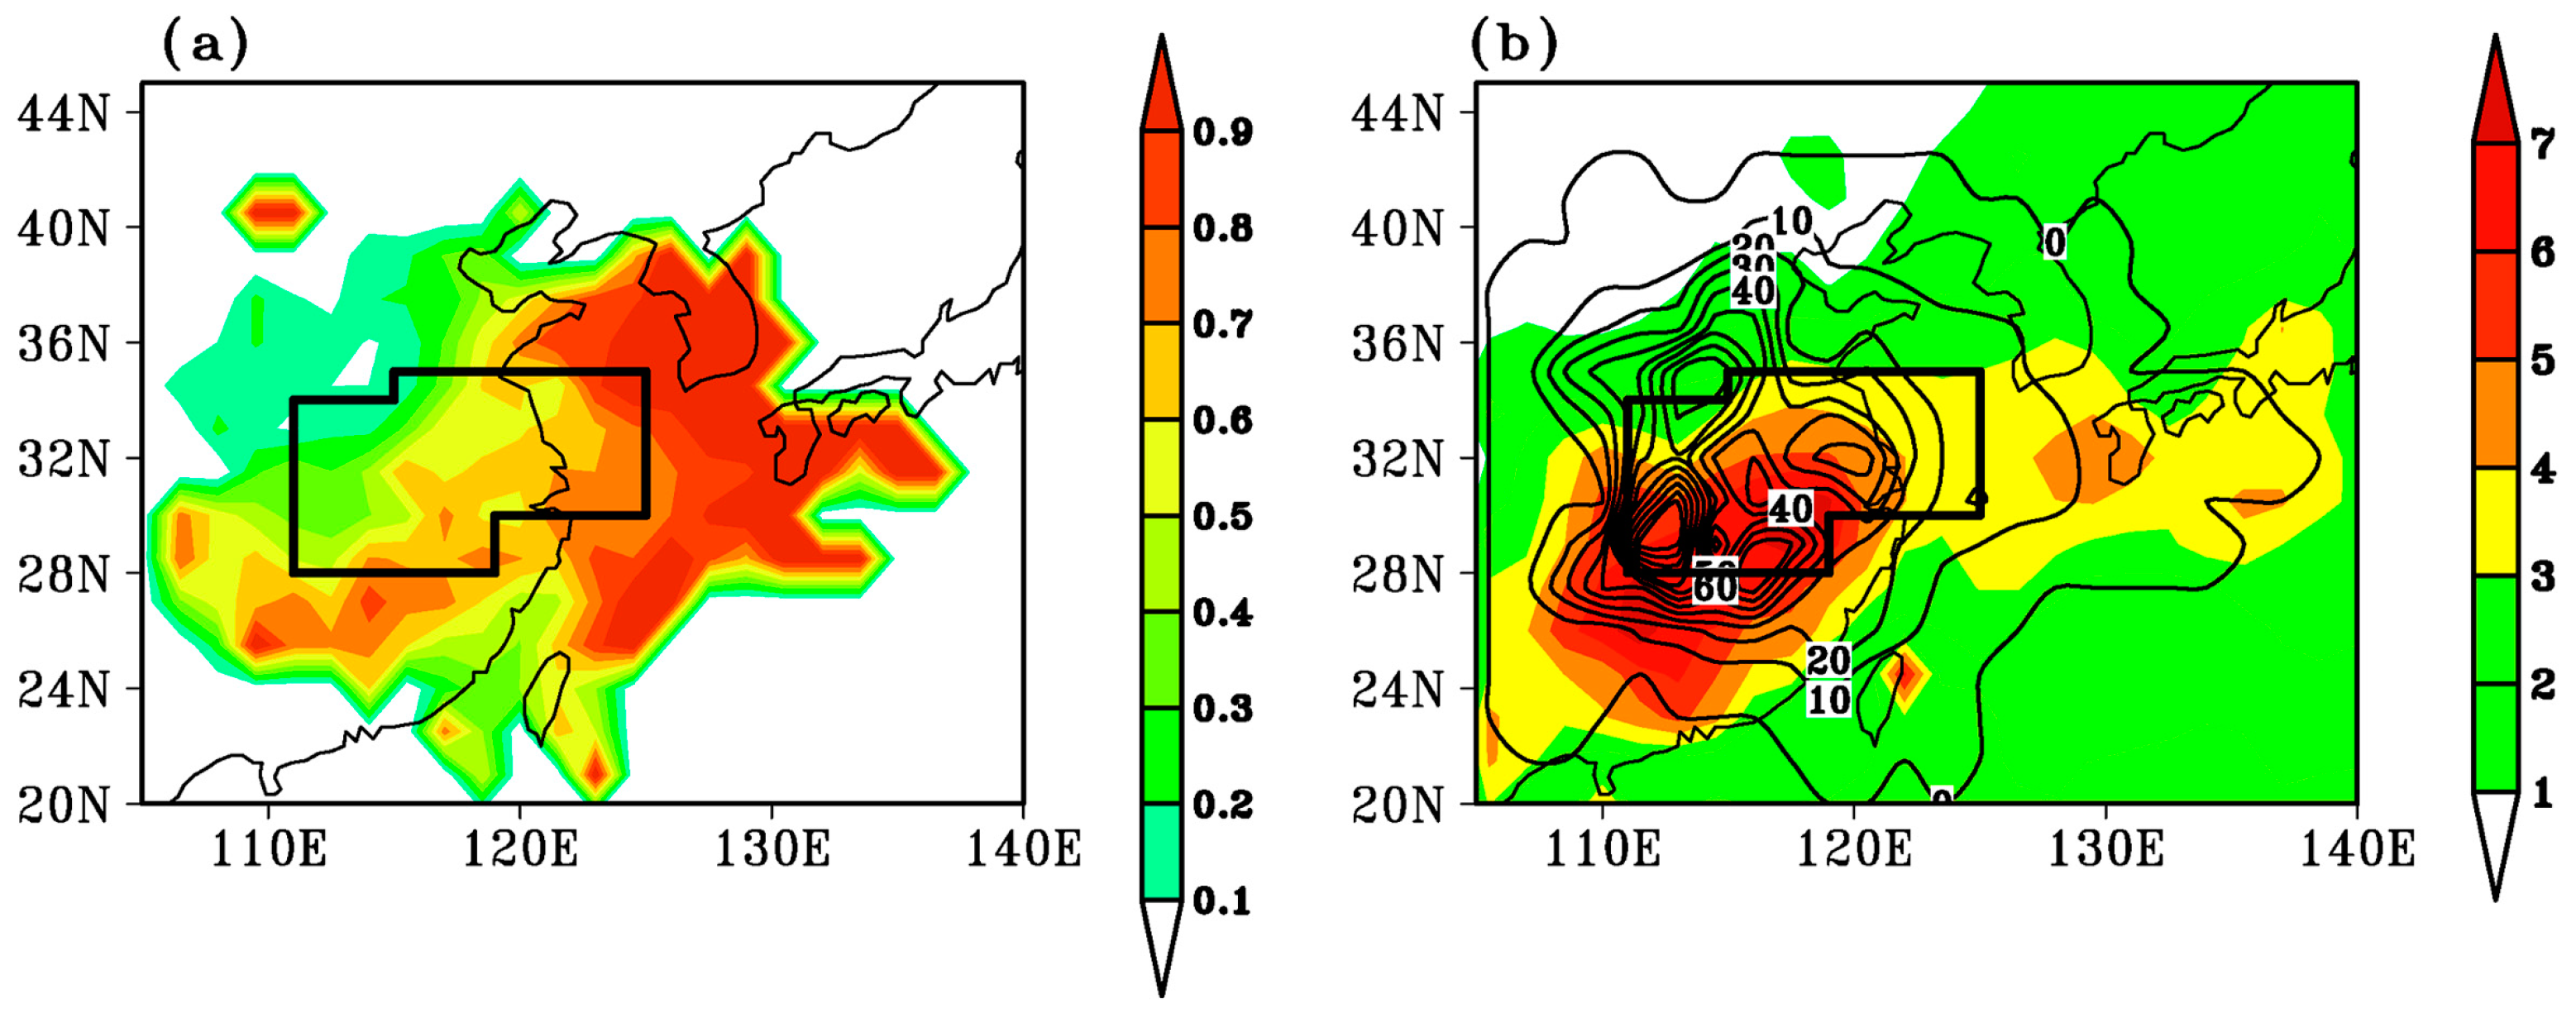
To filter some local heat lows, many existing tracking schemes use a minimum lifecycle to omit short-lived cyclones [18]. However, short-lived cyclones, such as those with a low cut-off, can have large impacts on their local weather (e.g., the Xola wind storm in late December, 2009 [37]). Moreover, 39% of closed ICs detected by the CAA had lifetimes shorter than 18 h. As shown in Figure 7a, most of these ICs had pressures ranging from 1000 hPa to 1010 hPa, accounting for 69% of the total ICs. The average center-SLP of short-lifetime ICs was 1006.74 hPa. Approximately 32% of the center-SLP of these ICs were lower than the median value (1004.98 hPa) of ≥18 h IC in CAA, and approximately 70% were lower than the 3/4 critical value (1009.14 hPa). Therefore, the intensities of the short-lived ICs are comparable with the ≥18 h ICs. Although most of these ICs were meso-scale systems (diameter < 1000 km, Figure 7b), they may also play an important role in local rainfall (e.g., [33]). As documented in Figure 8a, ~50% of short-lived ICs over the southern and eastern part of the CHV were locally associated with rainfall events. In addition, these good coincident areas displayed a high occurrence frequency of ICs as well as more associated precipitation (Figure 8b), indicating that short-lived ICs over the CHV play a substantial physical role in the formation of local rainfall events.

7. Conclusions

In this study, we analyzed the performance and differences between two automated detection methods for atmospheric surface cyclones over the CHV. The first method was based on the neighbor cyclone center point with reference to [16], while the second method was an outermost enclosed contour scheme [21] that is able to identify the horizontal structure of cyclones. We found that the distribution of the tracks and the cyclogenesis locations of the ICs were in good agreement between the NCP and the CAA. The cyclone tracks under both schemes showed that a large number of ICs originated from the southwest of the CHV and then moved northeastward or eastward to Japan, guided by the 700 hPa wind field. However, there were still notable differences in the statistical features of the cyclone activity derived using the NCP and CAA:
  • The frequency of ICs was comparable between the CAA and NCP. However, only <46% of cyclones shared the same cyclone center between these two schemes. The exclusion of open systems and marking a multicenter cyclone as a whole system resulted in the inconsistency in cyclone center location and a lower frequency of cyclones under the CAA. On the other hand, a supplementary set of ICs (51%) was detected in the CAA because of their cyclone regime affecting CHV with their cyclone center point outside the CHV.
  • ICs derived using the CAA had typically longer lifetimes and travel distances, with stronger center intensities than those in the NCP. More cyclones coming from midlatitudes were detected under the CAA, and these cyclones usually had stronger intensities and longer lifetimes. Furthermore, the involvement of open systems in the NCP resulted in a weaker center-SLP under the NCP than the CAA.
  • Two different horizontal resolution SLPs were applied to cyclone detection using the NCP and the CAA. The track of ICs under the CAA with high resolution showed good agreement with that of ICs using the low-resolution CAA, as well as the low-resolution NCP. However, a substantially increased number of open systems were detected using the high-resolution NCP. Due to the interference of these open local minimums, using the high-resolution NCP, 50% of the tracks of the 10 ICs with the lowest center-SLP presented large deviations during their early stage compared to those identified using other methods.
In addition, 39% of the short-lived (<18 h) ICs were detected using the CAA, these were typically excluded by the NCP. However, we found that these short-lived ICs had comparable center intensities to those ICs with longer lifetimes. These short-lived ICs showed a good correlation with the occurrence of simultaneous rainfall events, indicating that short-lived ICs in the CHV should not be ignored.

Author Contributions

Conceptualization, Y.H., C.L., Y.Q., J.C.; Investigation, Y.H., C.L., Y.Q., J.C.; Data curation, Y.H., C.L.; Methodology, Y.H., C.L.; Writing—original draft, Y.H., C.L.; Writing—review & editing, Y.Q., J.C. Authors contributed equally to this work.

Funding

This research was funded by the National Natural Science Foundation of China, grant number No. 41575081, 41875111, 41741005; the Natural Science Foundation of Jiangsu Province, grant number No. BK20161603.

Acknowledgments

The authors express their appreciation to the staff at ECMWF for making the reanalysis datasets freely available. The authors are grateful to the constructive comments of the two reviewers.

Conflicts of Interest

The authors declare no conflict of interest.

References

  1. Trenberth, K.E.; Owen, T.W. Workshop on Indices and Indicators for Climate Extremes, Asheville, NC, USA, 3–6 June 1997 Breakout Group A: Storms. Clim. Chang. 1999, 42, 9–21. [Google Scholar] [CrossRef]
  2. Yingxian, Z.; Yihui, D.; Qiaoping, L. A Climatology of Extratropical Cyclones over East Asia During 1958–2001. Acta Meteorol. Sin. 2012, 26, 261–277. [Google Scholar]
  3. Chao, H.; Zhaoyong, G.; Minggang, L. The seasonal cycle of redistribution of atmospheric mass between continent and ocean in the Northern Hemisphere. Sci. China 2014, 57, 1501–1512. [Google Scholar]
  4. Reale, M.; Lionello, P. Synoptic climatology of winter intense precipitation events along the Mediterranean coasts. Nat. Hazards Earth Syst. Sci. 2013, 13, 1707–1722. [Google Scholar] [CrossRef] [Green Version]
  5. Toreti, A.; Xoplaki, E.; Maraun, D.; Kuglitsch, F.G.; Wanner, H.; Luterbacher, J. Characterisation of extreme winter precipitation in Mediterranean coastal sites and associated anomalous atmospheric circulation patterns. Nat. Hazards Earth Syst. Sci. 2010, 10, 1037–1050. [Google Scholar] [CrossRef] [Green Version]
  6. Lijuan, W.; Chao, W.; Dong, G. Evolution mechanism of synoptic-scale EAP teleconnection pattern and its relationship to summer precipitation in China. Atmos. Res. 2018, 214, 150–162. [Google Scholar]
  7. Jiaxi, C.; Zhaoyong, G.; Fenhua, M. Possible Combined Influences of Absorbing Aerosols and Anomalous Atmospheric Circulation on Summertime Diurnal Temperature Range Variation over the Middle and Lower Reaches of the Yangtze River. J. Meteorol. Res. 2016, 30, 927–943. [Google Scholar]
  8. Murray, R.J.; Simmonds, I. A numerical scheme for tracking cyclone centres from digital data. Part II: Application to January and July general circulation model simulations. Aust. Meteorol. Mag. 1991, 39, 167–180. [Google Scholar]
  9. Hodges, K.I. A General Method for Tracking Analysis and Its Application to Meteorological Data. Mon. Weather Rev. 1994, 122, 2573–2586. [Google Scholar] [CrossRef] [Green Version]
  10. Xiangdong, Z.; Walsh, J.E.; Jing, Z.; Bhatt, U.S.; Ikeda, M. Climatology and Interannual Variability of Arctic Cyclone Activity: 1948–2002. J. Clim. 2004, 17, 2300–2317. [Google Scholar]
  11. Wernli, H.; Schwierz, C. Surface Cyclones in the ERA-40 Dataset (1958–2001). Part I: Novel Identification Method and Global Climatology. J. Atmos. Sci. 2006, 63, 2486–2507. [Google Scholar] [CrossRef]
  12. Rudeva, I.; Gulev, S.K. Climatology of Cyclone Size Characteristics and Their Changes during the Cyclone Life Cycle. Mon. Weather Rev. 2007, 135, 2568–2587. [Google Scholar] [CrossRef]
  13. Xinmin, W.; Panmao, Z.; Cuicui, W. Variations in Extratropical Cyclone Activity in Northern East Asia. Adv. Atmos. Sci. 2009, 26, 471–479. [Google Scholar]
  14. Wang, L.; Dai, Z.; He, J. Numerical simulation of the relationship between the maintance and increase in heavy rainfall of the landing tropical storm BILIS and moisture transport from lower latitudes. J. Trop. Meteorol. 2017, 23, 47–57. [Google Scholar]
  15. Jin, D.; Huo, L. Influence of tropical Atlantic sea surface temperature anomalies on the East Asian summer monsoon. Q. J. R. Meteorol. Soc. 2018. [Google Scholar] [CrossRef]
  16. Serreze, M.C.; Carse, F.; Barry, R.G.; Rogers, J.C. Icelandic Low Cyclone Activity: Climatological Features, Linkages with the NAO, and Relationships with Recent Changes in the Northern Hemisphere Circulation. J. Clim. 1995, 10, 453–464. [Google Scholar] [CrossRef]
  17. Inatsu, M. The neighbor enclosed area tracking algorithm for extratropical wintertime cyclones. Atmos. Sci. Lett. 2009, 10, 267–272. [Google Scholar] [CrossRef]
  18. Neu, U.; Akperov, M.G.; Bellenbaum, N.; Benestad, R.; Blender, R.; Caballero, R.; Cocozza, A.; Dacre, H.F.; Feng, Y.; Fraedrich, K. IMILAST: A Community Effort to Intercompare Extratropical Cyclone Detection and Tracking Algorithms. Bull. Am. Meteorol. Soc. 2013, 94, 529–547. [Google Scholar] [CrossRef]
  19. Simmonds, I. Size Changes over the Life of Sea Level Cyclones in the NCEP Reanalysis. Mon. Weather Rev. 1999, 128, 4118–4125. [Google Scholar] [CrossRef]
  20. Kouroutzoglou, J. On the vertical structure of Mediterranean explosive cyclones. Theor. Appl. Climatol. 2012, 110, 155–176. [Google Scholar] [CrossRef]
  21. Chuhan, L. A modified algorithm for identifying and tracking extratropical cyclones. Adv. Atmos. Sci. 2017, 34, 909–924. [Google Scholar]
  22. Hodges, K.I.; Lee, R.W.; Bengtsson, L. A Comparison of Extratropical Cyclones in Recent Reanalyses ERA-Interim, NASA MERRA, NCEP CFSR, and JRA-25. J. Clim. 2011, 24, 4888–4906. [Google Scholar] [CrossRef]
  23. Tilinina, N.; Gulev, S.K.; Rudeva, I.; Koltermann, P. Comparing Cyclone Life Cycle Characteristics and Their Interannual Variability in Different Reanalyses. J. Clim. 2013, 26, 6419–6438. [Google Scholar] [CrossRef]
  24. Rudeva, I.; Gulev, S.K.; Simmonds, I.; Tilinina, N. The sensitivity of characteristics of cyclone activity to identification procedures in tracking algorithms. Tellus Ser. A Dyn. Meteorol. Oceanogr. 2014, 66, 24961. [Google Scholar] [CrossRef]
  25. Simmonds, I.; Rudeva, I. A comparison of tracking methods for extreme cyclones in the Arctic basin. Tellus Ser. A Dyn. Meteorol. Oceanogr. 2014, 66, 25252. [Google Scholar] [CrossRef]
  26. Hewson, T.D.; Neu, U. Cyclones, windstorms and the IMILAST project. Tellus 2015, 67, 27128. [Google Scholar] [CrossRef]
  27. Lionello, P.; Trigo, I.F.; Gil, V.; Liberato, M.L.R.; Nissen, K.M.; Pinto, J.G.; Raible, C.C.; Reale, M.; Tanzarella, A.; Trigo, R.M. Objective climatology of cyclones in the Mediterranean region: A consensus view among methods with different system identification and tracking criteria. Tellus Ser. A Dyn. Meteorol. Oceanogr. 2016, 68, 29391. [Google Scholar] [CrossRef]
  28. Flaounas, E.; Kelemen, F.D.; Wernli, H.; Gaertner, M.A.; Reale, M.; Sanchez-Gomez, E.; Lionello, P.; Calmanti, S.; Podrascanin, Z.; Somot, S. Assessment of an ensemble of ocean–atmosphere coupled and uncoupled regional climate models to reproduce the climatology of Mediterranean cyclones. Clim. Dyn. 2018, 51, 1023–1040. [Google Scholar] [CrossRef]
  29. Ulbrich, U.; Leckebusch, G.C.; Grieger, J.; Schuster, M.; Akperov, M.; Bardin, M.Y.; Feng, Y.; Gulev, S.; Inatsu, M.; Keay, K. Are Greenhouse Gas Signals of Northern Hemisphere winter extra-tropical cyclone activity dependent on the identification and tracking algorithm? Meteorol. Z. 2013, 22, 61–68. [Google Scholar] [CrossRef] [Green Version]
  30. Chung, Y.S.; Hage, K.D.; Reinelt, E.R. On Lee Cyclogenesis and Airflow in the Canadian Rocky Mountains and the East Asian Mountains. Mon. Weather Rev. 2009, 104, 879. [Google Scholar] [CrossRef]
  31. Ren, X.J.; Yang, X.Q.; Chu, C.J. Seasonal Variations of the Synoptic-Scale Transient Eddy Activity and Polar Front Jet over East Asia. J. Clim. 2010, 23, 3222–3233. [Google Scholar] [CrossRef]
  32. Qian, Z.; Zhaoyong, G. Interdecadal Change in the Eurasia–Pacific Anti-Phase Relation of Atmospheric Mass and Its Possible Link with PDO. J. Meteorol. Res. 2017, 31, 126–141. [Google Scholar]
  33. Yujing, Q.; Chuhan, L.; Liping, L. Multi-scale Cyclone Activity in the Changjiang River-Huaihe River Valleys during Spring and Its Relationship with Rainfall Anomalies. Adv. Atmos. Sci. 2017, 34, 246–257. [Google Scholar]
  34. Berrisford, P.; Dee, D.P.; Fielding, K.; Fuentes, M.; Kållberg, P.W.; Kobayashi, S.; Uppala, S.M. The ERA-Interim Archive; Era Report; ECMWF: Reading, UK, 2009. [Google Scholar]
  35. Jianghuai Cyclone Research Group of Jiangsu Meteorological Bureau. Analysis and Forecast of Jianghuai Cyclone. Meteorol. Mon. 1986, 4, 6–10. [Google Scholar] [CrossRef]
  36. Satake, Y.; Inatsu, M.; Mori, M.; Hasegawa, A. Tropical Cyclone Tracking Using a Neighbor Enclosed Area Tracking Algorithm. Mon. Weather Rev. 2013, 141, 3539–3555. [Google Scholar] [CrossRef] [Green Version]
  37. Pinto, P.; Silva, A. Situação de Vento Forte no Oeste em 23 de Dezembro de 2009: Report from Instituto Português do Mar e da Atmosfera[R/OL]; Instituto de Meteorologia: Lisbon, Portugal, 2010; 40p. [Google Scholar]
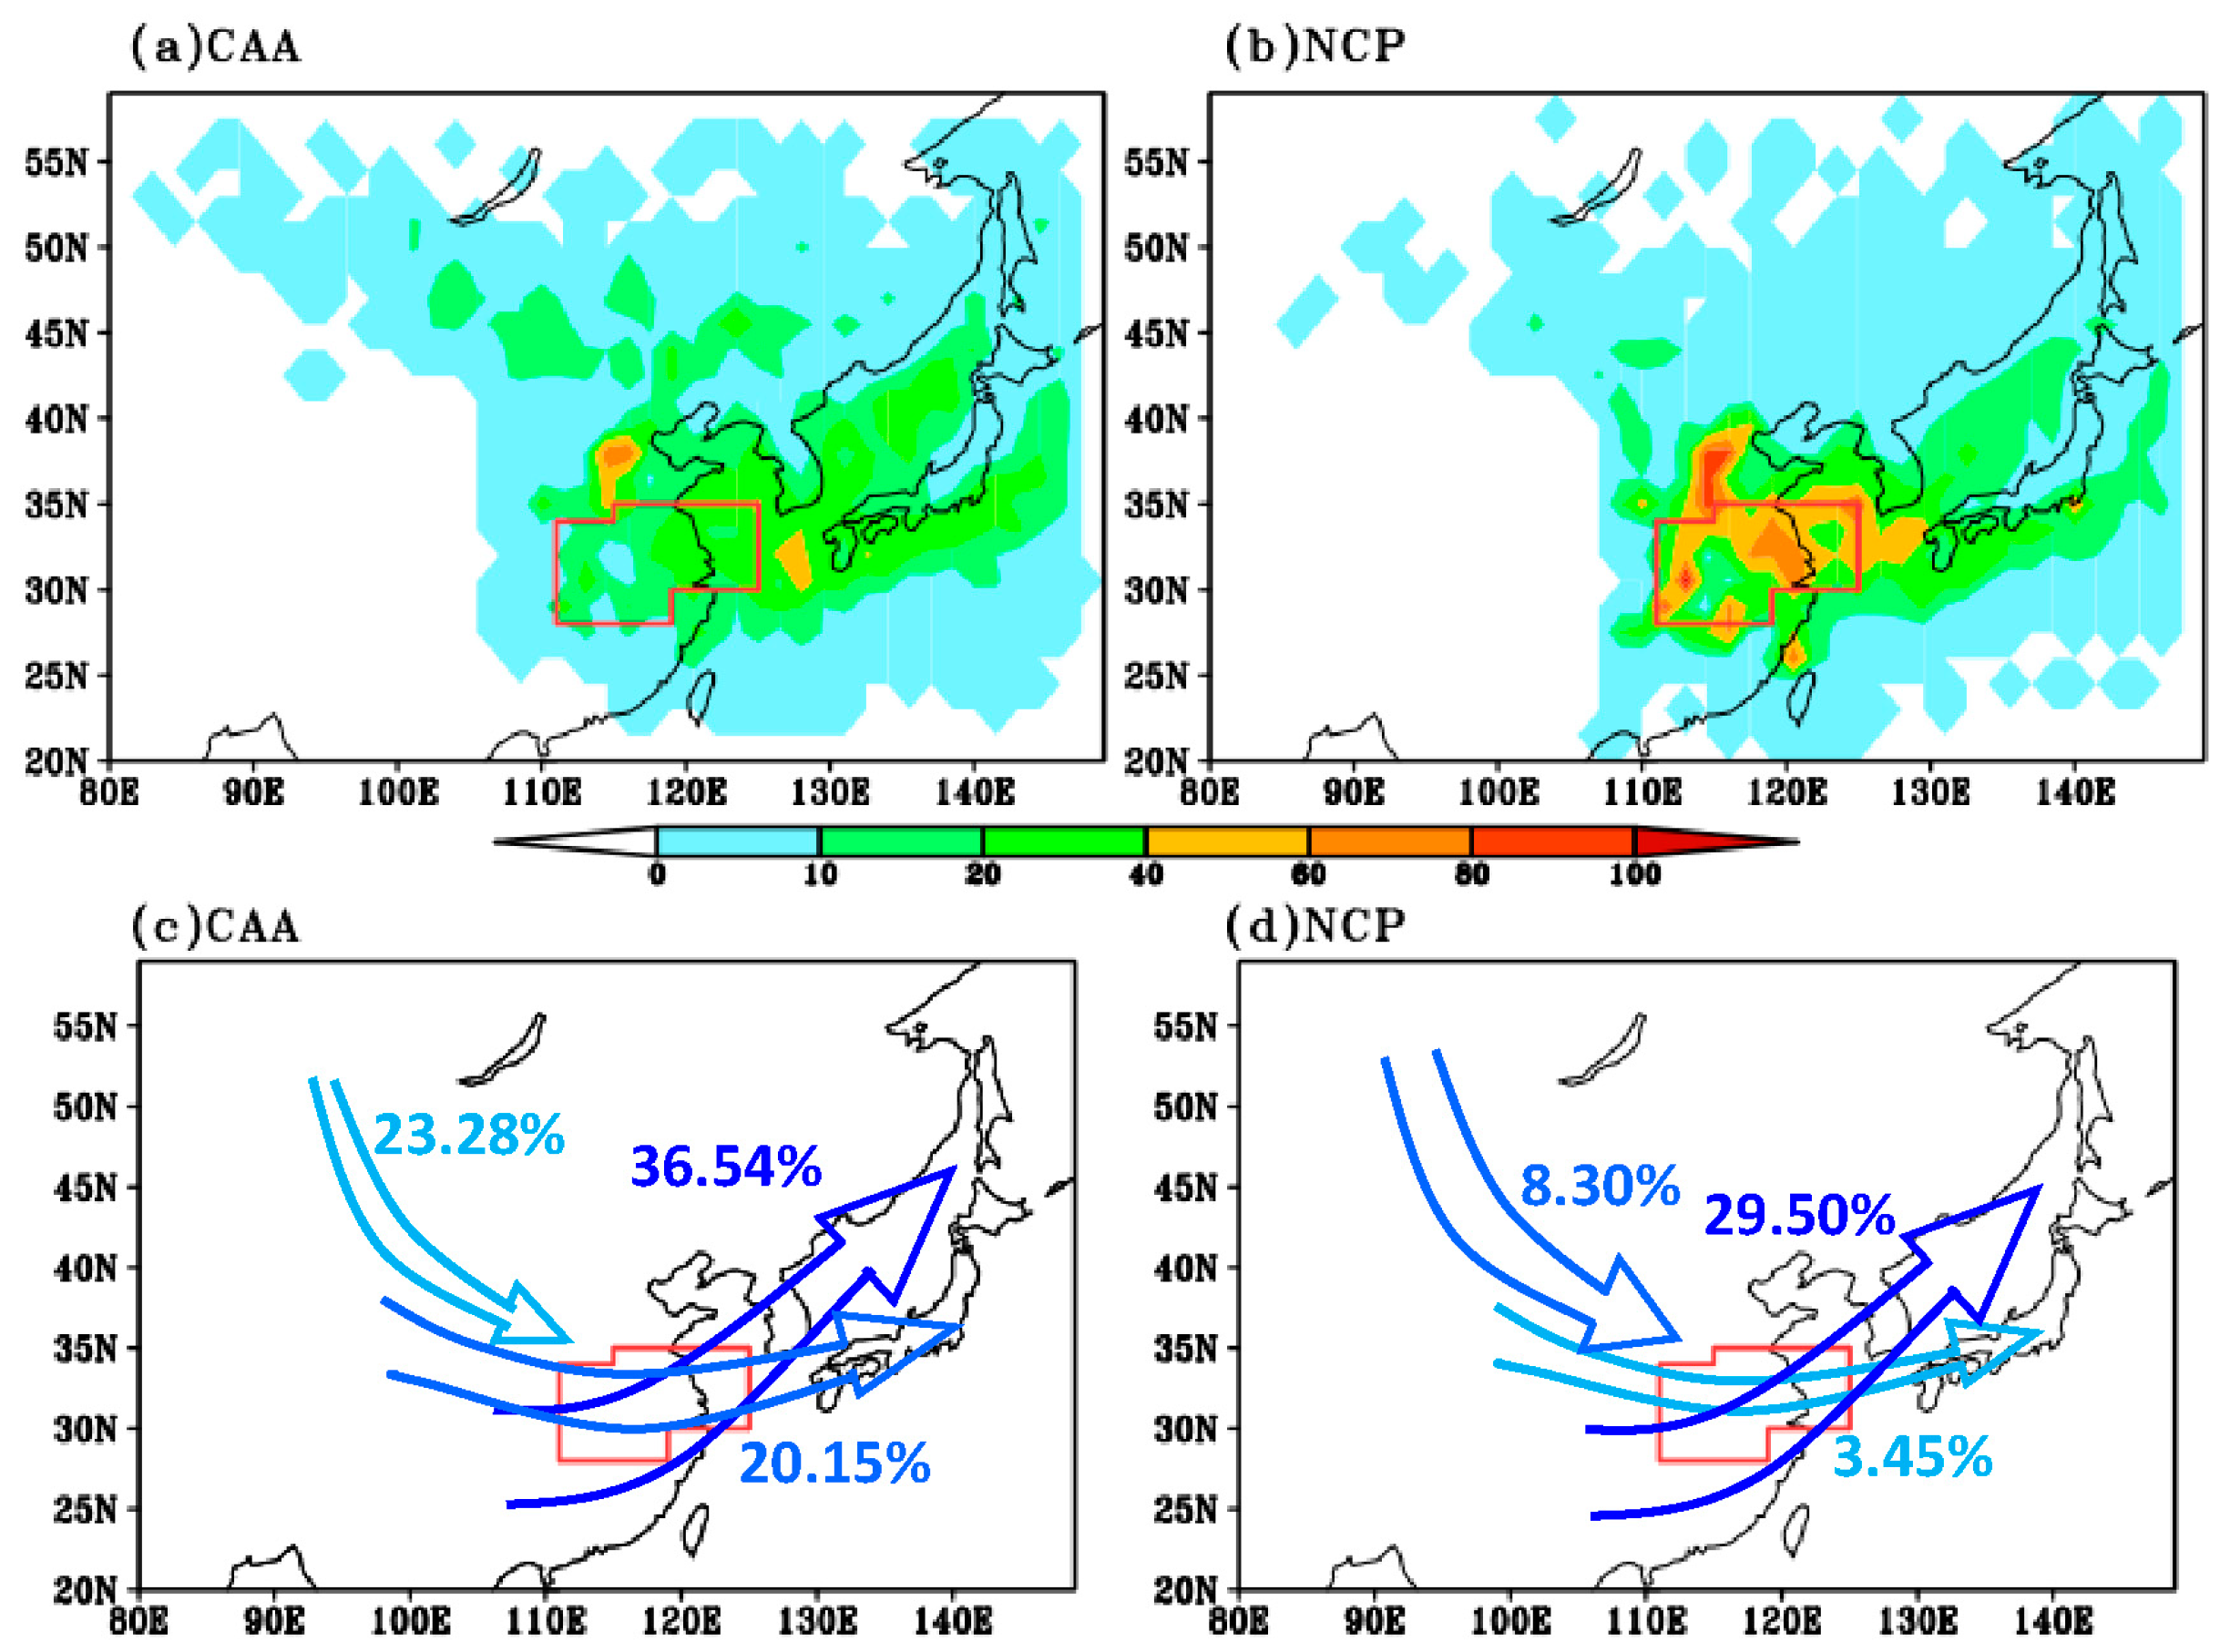
Figure 1. The density of influential cyclone (IC) tracks (number of tracks for each grid point) (a,b) and frequency of the three main high-frequency tracks (c,d). The left panel is for the cyclone area algorithm (CAA), and the right panel is for the neighbor center point (NCP).
Atmosphere 10 00115 g001
Figure 2. The climatology of the wind field at 700 hPa (vector), with the shaded areas representing their wind speed (m·s−1). The black box denotes the Changjiang River–Huaihe River Valley (CHV). The northwest (NW) and northeast (NE) of China are divided into two blue dashed rectangles.
Atmosphere 10 00115 g002
Figure 3. The distribution of the cyclogenesis (a: CAA; b: NCP) and cyclolysis (c: CAA; d: NCP) of ICs.
Atmosphere 10 00115 g003
Figure 4. (a) Lifetimes of ICs using the two methods; (b) The travel distances of ICs with lifetimes of 3–8 time steps.
Atmosphere 10 00115 g004
Figure 5. The frequency (a) and statistical key value (b) of the center-SLP of ICs.
Atmosphere 10 00115 g005
Figure 6. The tracks of the ten lowest center-SLP ICs for the four schemes in Table 4 (red solid line: H_NCP; purple solid line: L_NCP; blue dashed line: H_CAA; green dashed line: L_CAA). Contours in Figure 6c denote the SLP field for 12 UTC, 25 May 1980 (interval of 1.4 hPa) and the green (red) lines denote the local SLP minimums without (with) a closed contour.
Atmosphere 10 00115 g006
Figure 7. (a) SLP and (b) diameter of ICs with lifetimes shorter than 18 h.
Atmosphere 10 00115 g007
Figure 8. Spatial distribution of short-lived ICs (<18 h). (a) Precipitation probability during the lifetime of ICs, (b) frequency (the contour line) and accompanied average precipitation (shaded, mm/day).
Atmosphere 10 00115 g008
Table 1. The sum of IC tracks and IC frequencies in spring from 1979 to 2015.
CAANCP
Track635783
Frequency57766070
Table 2. The frequency and lifetime of ICs originated from the north of China using the NCP.
NCPCAA
Frequency42%46%
Lifetime (hrs)43.358.0
Table 3. The frequencies of open or shallow systems using the NCP.
Lifespan345678
Sum14610576615568
Open or Shallow Systems1279838182118
Percentage87%93%50%30%38%26%
Table 4. Sensitivity of the two algorithms derived by two horizontal resolutions.
AlgorithmsCAANCP
PlanH_CAAL_CAAH_NCPL_NCP
Resolution of data0.25°1.5°0.25°1.5°
Sum of IC frequency103385776595156070
Sum of IC track17986354283683