Article

Diurnal Variations in Surface Wind over the Tibetan Plateau

1
National Meteorological Information Centre, China Meteorological Administration, Beijing 100081, China
2
College of Global Change and Earth System Science, Beijing Normal University, Beijing 100875, China
3
Laboratory for Regional Oceanography and Numerical Modeling, Qingdao National Laboratory for Marine Science and Technology, Qingdao 266237, China
*
Author to whom correspondence should be addressed.
Atmosphere 2019, 10(3), 112; https://doi.org/10.3390/atmos10030112
Submission received: 26 January 2019 / Revised: 20 February 2019 / Accepted: 26 February 2019 / Published: 2 March 2019
(This article belongs to the Special Issue Lower Atmosphere Meteorology)

Abstract

:
This study uses hourly surface wind direction and wind speed observations from 53 meteorological stations on the Tibetan Plateau (TP) (70–105° E, 25–45° N) between 1995 and 2017 to investigate diurnal variations in the surface wind. The results show large diurnal variations in surface wind on the TP. The minimum wind speed occurs in the morning and the maximum in the afternoon. In all four seasons, the prevailing meridional wind is a southerly, and this is typically evident for more than two-thirds of each day. However, in the mornings during December–February and September–November, this southerly wind is replaced by a northerly, but remains southerly in the afternoon. The TP shows remarkable regional characteristics with respect to diurnal variations in wind speed. In the eastern region, the minimum and maximum daily wind speeds occur about 1 h later than in the west. Among the 53 meteorological stations, 79% observed that it took less time for the minimum speed to rise to the maximum speed than for the maximum to drop to the minimum. The blocking effect of the high surrounding terrain causes the diurnal variations seen in the surface winds at the three stations in the Qaidam Basin to differ significantly from those observed at the other stations elsewhere on the plateau. These Qaidam Basin stations recorded their maximum wind speeds around noon, with the minimum at dusk, which is around 1900 LST. The EOF1 (EOF = empirical orthogonal function) of the hourly wind speed on the TP indicates the key daily circulation feature of the region; i.e., the wind speed is high in the afternoon and low in the morning. The EOF2 reflects the regional differences in the diurnal variations of wind speed on the TP; i.e., the eastern region reaches the daily maximum and minimum wind speeds slightly later than the western region.

1. Introduction

Research into diurnal variations in meteorological parameters is important in improving our understanding of weather and climate systems. There has been much research into diurnal variations in global or local meteorological parameters (e.g., precipitation and surface winds). However, the limited amount of available observational data meant that early studies of these diurnal variations focused mainly on tropical areas. Infrared satellite data have been used to investigate the diurnal variations in convective activity using cloud cover, cloud crest brightness temperature, and water vapor (e.g., [1,2,3,4]). Studies in tropical regions have shown that the daily cycle of convective activity is strongly dependent on geographical location, and that topography plays a crucial role in the daily cycle of weather patterns [1,5].
The Tibetan Plateau (TP), also known as the third pole, is the world’s largest landform and has an average elevation of about 4500 m. The TP has a significant effect on its surroundings through thermal and dynamic processes [6,7]. Wind is an important indicator of atmospheric circulation, and changes in wind speed are an indication of circulation changes caused by natural or anthropogenic processes [8]. The wind is known to be distinctively turbulent and non-stationary. As a consequence, the wind velocity varies rather randomly on many different time scales [9]. Previous studies have examined the surface wind regime on the TP. For example, analysis of daily wind speed data from ground observation stations on the TP has shown seasonal differences in the surface wind, with the wind speed dropping most significantly during March–May [10]. Other research has found that changing wind speed is the most important meteorological control on trends in potential evapotranspiration on the TP [11].
There are limited observational data to study diurnal variations in meteorological elements over the TP. This has led to some studies having to rely on data with a low temporal resolution, or data obtained from indirect observations, to analyze such variations. For example, data with a temporal resolution of 3 h have been used to analyze diurnal variations in precipitation, thunderstorms [12], and surface winds [13]. Other studies have used satellite and radar data to explore the changing weather and climate on the TP (e.g., [14,15,16,17]).
Following the rapid deployment of automatic weather stations across China in recent years, hourly observational data are now available. However, these automatic weather stations are typically about 10 years old, so their records are short. Before the establishment of automatic weather stations, various self-recording instruments were widely used for hourly and even minute-by-minute observations, such as self-recording rain gauges and self-registering anemometers, but most of these datasets were recorded on paper, which is more difficult to collate and analyze than digital data, thereby restricting the application of these valuable data. In 2017, the China Meteorological Administration (CMA), after nearly 10 years of data processing work that included integrating the surface wind data observed by automatic weather stations, established the first hourly wind series from 2400 Chinese stations covering the period since 1951. The CMA also developed suitable quality control procedures, based on the characteristics of hourly wind data, to check the accuracy and completeness of the hour-by-hour wind series, and so established the Hourly Surface Wind dataset (HSW dataset) for mainland China [18].
The reliability of various reanalysis data is relatively low (e.g., [19,20]). Observational data recorded at meteorological stations are fundamental to the data processing and analysis that underpins climate research. The direction and speed of surface wind are major elements of China’s meteorological observational dataset. However, few studies have used the long sequence of hourly wind data observed by the stations to analyze diurnal variations in surface winds on the TP. Accordingly, this study uses hourly wind direction and speed data from the TP in the HSW dataset to analyze diurnal variations in surface winds on the TP.

2. Data and Methodology

We used the HSW dataset from mainland China, which was developed, collated, and quality controlled by the National Meteorological Information Center (NMIC) of the CMA (Zhao et al., 2017 [18]). In this study, the TP region is defined as that bounded by 70–105° E and 25–45° N. Our study area in west China encompasses Qinghai Province, Tibet, and parts of neighboring Xinjiang, Gansu, Yunnan, and Sichuan provinces. To avoid biases introduced by missing data, we limited our analysis to the 53 stations on the TP that provide a complete hourly wind speed series from 1995 to 2017 and are located at altitudes above 2000 m (figure omitted).
In China, the standard time (Beijing time) is UTC + 8, and this is the time used for meteorological observations. However, because of its vast size, China is divided into five time zones, and the TP alone spans three time zones (UTC + 5 to UTC + 7). Therefore, using LST to analyze diurnal variations on the TP avoids the difference in diurnal variations in wind speed caused by the gap between LST and Beijing time. In the diurnal cycle of surface wind speed at each station, the hour when the wind speed reached its maximum is defined as the ‘max-hour’, and the hour when the wind speed reached its minimum is defined as the ‘min-hour’. The difference between the maximum and minimum is the daily range of wind speed. The ‘max-dir’ is the wind direction in the hour when the wind speed reached its daily maximum, and the ‘min-dir’ is the wind direction in the hour when the wind speed reached its daily minimum. For our analysis, we divided the year into four equal periods: December–February (DJF), March–May (MAM), June–August (JJA), and September–November (SON).

3. Diurnal Variations in Wind Speed

Figure 1 shows the seasonal and annual mean wind speed, variances of wind speed, zonal wind speed, and meridional wind speed on the TP. The maximum wind speed occurs during MAM, with the average wind speeds at all hours being higher than those of the other three seasons. MAM also sees the largest range in wind speed of up to 2.7 m·s−1, whereas JJA sees the smallest range of 1.8 m·s−1. The minimum wind speeds on the TP in DJF, MAM, JJA, and SON were recorded at 0800, 0600, 0600, and 0600 LST, respectively, and the maximum wind speeds at 1500, 1600, 1600, and 1500 LST, respectively. It is suggested that increased downward turbulent mixing of momentum during the day could be one of the main causes for the early afternoon maximum of surface wind speed [13]. In DJF, the wind speed takes the shortest time to rise from the daily minimum to the daily maximum, of up to 7 h, meaning it takes 17 h to drop from the maximum to the minimum. In MAM and JJA, it takes 10 h for the wind speed to rise from the lowest in the morning to the highest in the afternoon, compared with 9 h in SON. Previous research has shown that in eastern China, wind speed drops to its minimum at 0500 LST and rises to its maximum at 1500 LST each day [21], with a variation of 1.2 m·s−1. On the TP, however, the wind speed reaches its minimum at 0600 LST and maximum at 1500 LST, with an annual average diurnal variation of 2.2 m·s−1. Therefore, the minimum wind speed in the daily cycle of wind speed on the TP arrives 1 h, on average, later than in the eastern part of China, whereas the maximum wind speed arrives at the same time. The amplitude of the variation in the former is nearly twice that in the latter.
The change in wind speed is large when the wind speed is high (Figure 1a,b). In addition, although in the daily cycle of wind speed the hourly wind speeds during SON are lower than those during MAM, the changes in SON wind speed are larger than those in MAM between 1200 and 1500 LST. The maximum hourly wind speed variation during MAM and SON arrives 1 h earlier than the maximum hourly wind speeds.
In the zonal wind diagram (Figure 1c), the prevailing wind alternates between an easterly and a westerly in JJA and SON. In most cases, a westerly wind prevails in JJA, and the westerly component reaches a maximum at 2000 LST of only up to 0.52 m·s−1 which is much smaller than the maxima in other seasons. The zonal wind speed is compensated in averaging on multiple station data, not weakened at each station (figure omitted). The effect of large terrain on airflow movement is mainly manifested in blocking and diverting. On the one hand, these effects of mountain ranges on airflow will lead to asymmetric distribution of surface pressure on windward and leeward slopes, which usually results in a gradient of pressure from the windward slope to the leeward slope. On the other hand, the southwest monsoon from the Indian Ocean can affect southeastern Tibet and southwestern Sichuan province in JJA. Therefore, the zonal wind at some of the 53 stations is westerly in JJA (Figure 1), and the weaker westerly wind will appear in most hours of a day by being compensated in averaging on multiple stations which are not affected by the southwest wind. An east wind prevails during SON, with the zonal wind speeds all above 0.5 m·s−1 between 1200 and 1700 LST, reaching a maximum at 1400 LST of up to 1.1 m·s−1. During DJF and MAM, the average zonal wind for all hours on the TP is an easterly. During DJF, the zonal wind speeds between 1200 and 1700 LST exceed 1.0 m·s−1, reaching a maximum at 1500 LST of up to 2.1 m·s−1. During MAM, the zonal wind speeds between 1100 and 1700 LST exceed 1.0 m·s−1, reaching a maximum at 1400 LST of up to 1.6 m·s−1.
The diurnal variations in the average meridional wind speed during each season and the annual mean can be divided into two groups (Figure 1d): 2000–0800 and 0800–2000 LST. Overall, the prevailing meridional wind in each season is a southerly. To be specific, a southerly and northerly wind alternate during DJF and SON, with the southerly being replaced by a northerly at about 0800–0900 LST, returning to a southerly at 1500–1600 LST. Over the 24 h of each day, the north wind prevails for about 7 h in DJF and SON, while the south wind prevails for the remaining 17 h. During MAM and JJA, the south wind is replaced by a weak northerly for only the 2–3 h before noon, and the southerly prevails for the remaining 21–22 h of each day.
The max-hour and min-hour in the average diurnal wind speed cycle for each station on the TP are shown in Figure 2. The eastern region typically experiences the maximum wind speed about 1 h later than the western region. Among the 53 stations, 10, 15, and 15 stations reach their peak values at 1400, 1500, and 1600 LST, respectively, indicating that most stations (57%) reach the maximum wind speed between 1500 and 1600 LST each day. In contrast to most other stations, Xiaozaohuo (93.2° E, 36.9° N) in Qinghai Province reaches its peak wind speed at 0900 LST, the earliest among the stations, Nuomuhong (96.5° E, 36.4° N) in Qinghai Province reaches its peak at 1100 LST, while Huajialing (105.0° E, 35.4° N) in Gansu Province and Jianzha (102.0° E, 35.9° N) in Qinghai Province reach their peaks at 2100 and 1900 LST, respectively.
Similarly, according to Figure 2b, the eastern region attains a daily minimum wind speed about 1 h later than the western region. Thirty six stations (68% of the total) reach the daily valley at 0600–0700 LST. The Xiaozaohuo, Delingha (97.4° E, 37.4° N), and Nuomuhong stations (all in Qinghai Province) differ from the other stations, reaching their daily minimum wind speed at 1900 LST. Anduo (91.1° E, 32.4° N) in Tibet and Tianjun (99.0° E, 37.3° N) in Qinghai Province reach their daily minimum wind speed at 0100 LST.
The time interval between the min-hour and max-hour for the stations on the TP varies between 6 h (3 stations) and 19 h (2 stations). A total of 30 stations take 8–10 h to see the wind speed rise from the minimum to the maximum, and 42 stations need less than 12 h (Table 1). That is, 79% of the stations take a shorter time to see the wind speed rise from the minimum to the maximum than to see the wind speed drop from the maximum to the minimum. It takes 12 h for three stations to see their wind speed rise from the lowest to the highest, so 6% of the stations take an equal time to see the wind speed go from the lowest to the highest and from the highest to the lowest. A total of eight stations take more than 12 h to see their wind speed rise from the lowest to the highest, so 15% of the stations take longer to see their wind speed rise from the lowest to the highest than to see the wind speed drop from the highest to the lowest.

4. Diurnal Variations in Surface Wind Directions and Diurnal Range of Wind Speed

Figure 3 and Table 2 show that the peak wind directions at each station differ, being northeasterly, southeasterly, northwesterly, and min-hour southwesterly for 24, 22, 4, and 3 stations, respectively. For 87% of the stations, the max-dir is easterly and for 13% it is westerly (Figure 3). For 55% of the stations, the min-dir is easterly. In the min-hour, 10, 19, 15, and 9 stations recorded northeasterly, southeasterly, northwesterly, and southwesterly winds, respectively. For 74% of the stations, the average wind direction is easterly, and 17, 22, 6, and 8 stations have an average wind direction of northeast, southeast, northwest, and southwest, respectively.
Next, we consider the daily range of wind speed at the stations. Figure 4a,b shows the daily range of annual average wind speed and wind speed variance for all stations. The variation in hourly wind speed is greater in the areas with a larger daily range. Tuotuohe (92.6° E, 34.0° N) station in Qinghai Province has the largest daily range of wind speed, reaching 4.2 m·s−1, and Delingha station in Qinghai Province in the northerly part of the TP has the smallest daily range of wind speed, at about 0.7 m·s−1. The average daily range of wind speed across the TP is 2.4 m·s−1.
The daily range of wind speed for all stations on the TP varies significantly from one season to another (Figure 4c–f). The high-value zone with a daily range over 3.6 m·s−1 moves northwestward from DJF to MAM. From MAM to JJA, the high-value zone continues to move northwestward. The spatial distribution of the wind speed daily range in SON is similar to that in DJF, but with a smaller daily range.

5. Diurnal Cycle of Surface Winds in Different Zones

As mentioned above, the diurnal cycles of surface winds recorded in Xiaozaohuo, Delingha, and Nuomuhong are strikingly different from the other zones of the TP, and these three stations are all located in the Qaidam Basin. In this section, we analyze these diurnal variations by treating the three stations as a ‘basin area’ and the remaining 50 stations as a ‘plateau area’. Figure 5 shows the annual average diurnal wind speed variations for the basin area and the plateau area. The diurnal wind speed variations of the two areas are obviously different. The wind speed in the basin area features a broad peak that reaches a maximum either side of noon and with a minimum at 1900 LST. In contrast, the plateau area sees a maximum wind speed at 1500 LST and a minimum wind speed at 0600 LST. At this time (0600 LST), the wind speed in the basin area is not at its minimum, but shows a small reduction compared with the wind speeds in the adjacent periods. Yu et al. (2009) [21] found a similar reversed day–night phase in the surface wind speed between mountain regions and plain regions of China. Based on a single year of wind data from television towers, Crawford and Hudson (1973) [22] concluded that the wind speed of the lower (higher) layers reached a minimum around midnight (noon) and a maximum in the afternoon (midnight). Their research target was diurnal wind speed variations on large plains and high mountain stations. In the present study, most of the stations from which data were collected on the TP are located in large high-altitude terrain, other than the stations at Xiaozaohuo, Delingha, and Nuomuhong, which are located in the Qaidam Basin at lower altitudes than the surrounding stations. Consequently, we suggest that the clear differences in the diurnal variations of the surface winds at these three stations are caused by the blocking effect of the surrounding mountainous terrain.
In MAM, DJF, and SON the Qaidam Basin shows similar diurnal variations in wind speed to the annual mean (Figure 5b). The difference is that the wind speeds in MAM (SON and DJF) are higher (lower) than the annual mean wind speed. The diurnal variation in surface wind speed during JJA is different to that in the other three seasons. In JJA, the wind speed gradually decreases from 0800 to 1900 LST and reaches a daily minimum at 1900 LST. In the other three seasons, however, the diurnal variations in wind speed feature a gradual rise (in MAM) or continuous high speeds (in SON and DJF) from 0800 LST to about 1400 LST. In JJA afternoons on the TP the prevailing wind is a southwesterly. In the afternoons of the other seasons, however, the prevailing wind is a southeasterly (Figure 1c,d). As the TP is higher in the northwest and lower in the southeast, and the Qaidam Basin is aligned northwest–southeast, the blocking effect of the surrounding terrain on the Qaidam Basin is more pronounced in JJA, when a southwest wind prevails, than in the other seasons when a southeasterly prevails. In other words, because the dominant wind direction is aligned with the basin except in JJA, the blocking effect would not play a major role in DJF, MAM, and SON like JJA.
We applied empirical orthogonal function (EOF) analysis to the hourly wind speed data of the TP (51 stations, excluding two remote stations in Xinjiang Province). The hourly wind speed series from each station was standardized prior to the EOF decomposition. The first and second leading EOF (EOF1 and EOF2) passed the North test [23]. EOF1 and EOF2 account for 83% and 13% of the total variance, respectively. EOF1 shows mainly positive values, with weakly negatives in the Qaidam Basin (Figure 6a). The time coefficient curve of EOF1 (Figure 6c) is similar to the series in Figure 1a, with both featuring a single peak. The peak in diurnal wind speed occurs between 1400 and 1500 LST, and the wind speed at night tends to decrease slowly. EOF1 reflects mainly the diurnal variation of wind speed in most areas of the TP, and the diurnal variations that differ between the Qaidam Basin and the much larger plateau area. EOF2 (Figure 6b) varies between positive and negative values with an east–west dipole pattern, while the corresponding time coefficient features a single peak (Figure 6d). EOF2 is negative in the Qilian Mountains in Gansu Province, eastern Qinghai Province, western Sichuan Province, and southeast Tibet (the eastern region), and is positive in mid-west Qinghai Province, eastern Sichuan Province, and central Tibet (the western region). This suggests that EOF2 indicates that the eastern region reaches the peak and valley of diurnal wind speed slightly later than the western region, which is consistent with the conclusion drawn above. The branching effect of the TP on airflow makes the surface wind of the eastern edge of the TP different from that of the western part of the TP. The northerly airflow generated by the circulation of the plateau forms a “leeward wake zone” on the eastern edge of the plateau, and the anticyclone vortex is very strong, while westerly winds prevail in the western part of the plateau [24]. The difference of atmospheric circulation pattern will inevitably lead to the difference of surface wind diurnal variation between the eastern and western regions.

6. Summary and Discussion

The diurnal cycle of surface wind speed on the TP was analyzed using hourly wind observation data from 53 meteorological stations with 23 years (1995–2017) of complete data. Our results reveal some novel spatial and temporal characteristics. The main conclusions are summarized as follows.
(1)
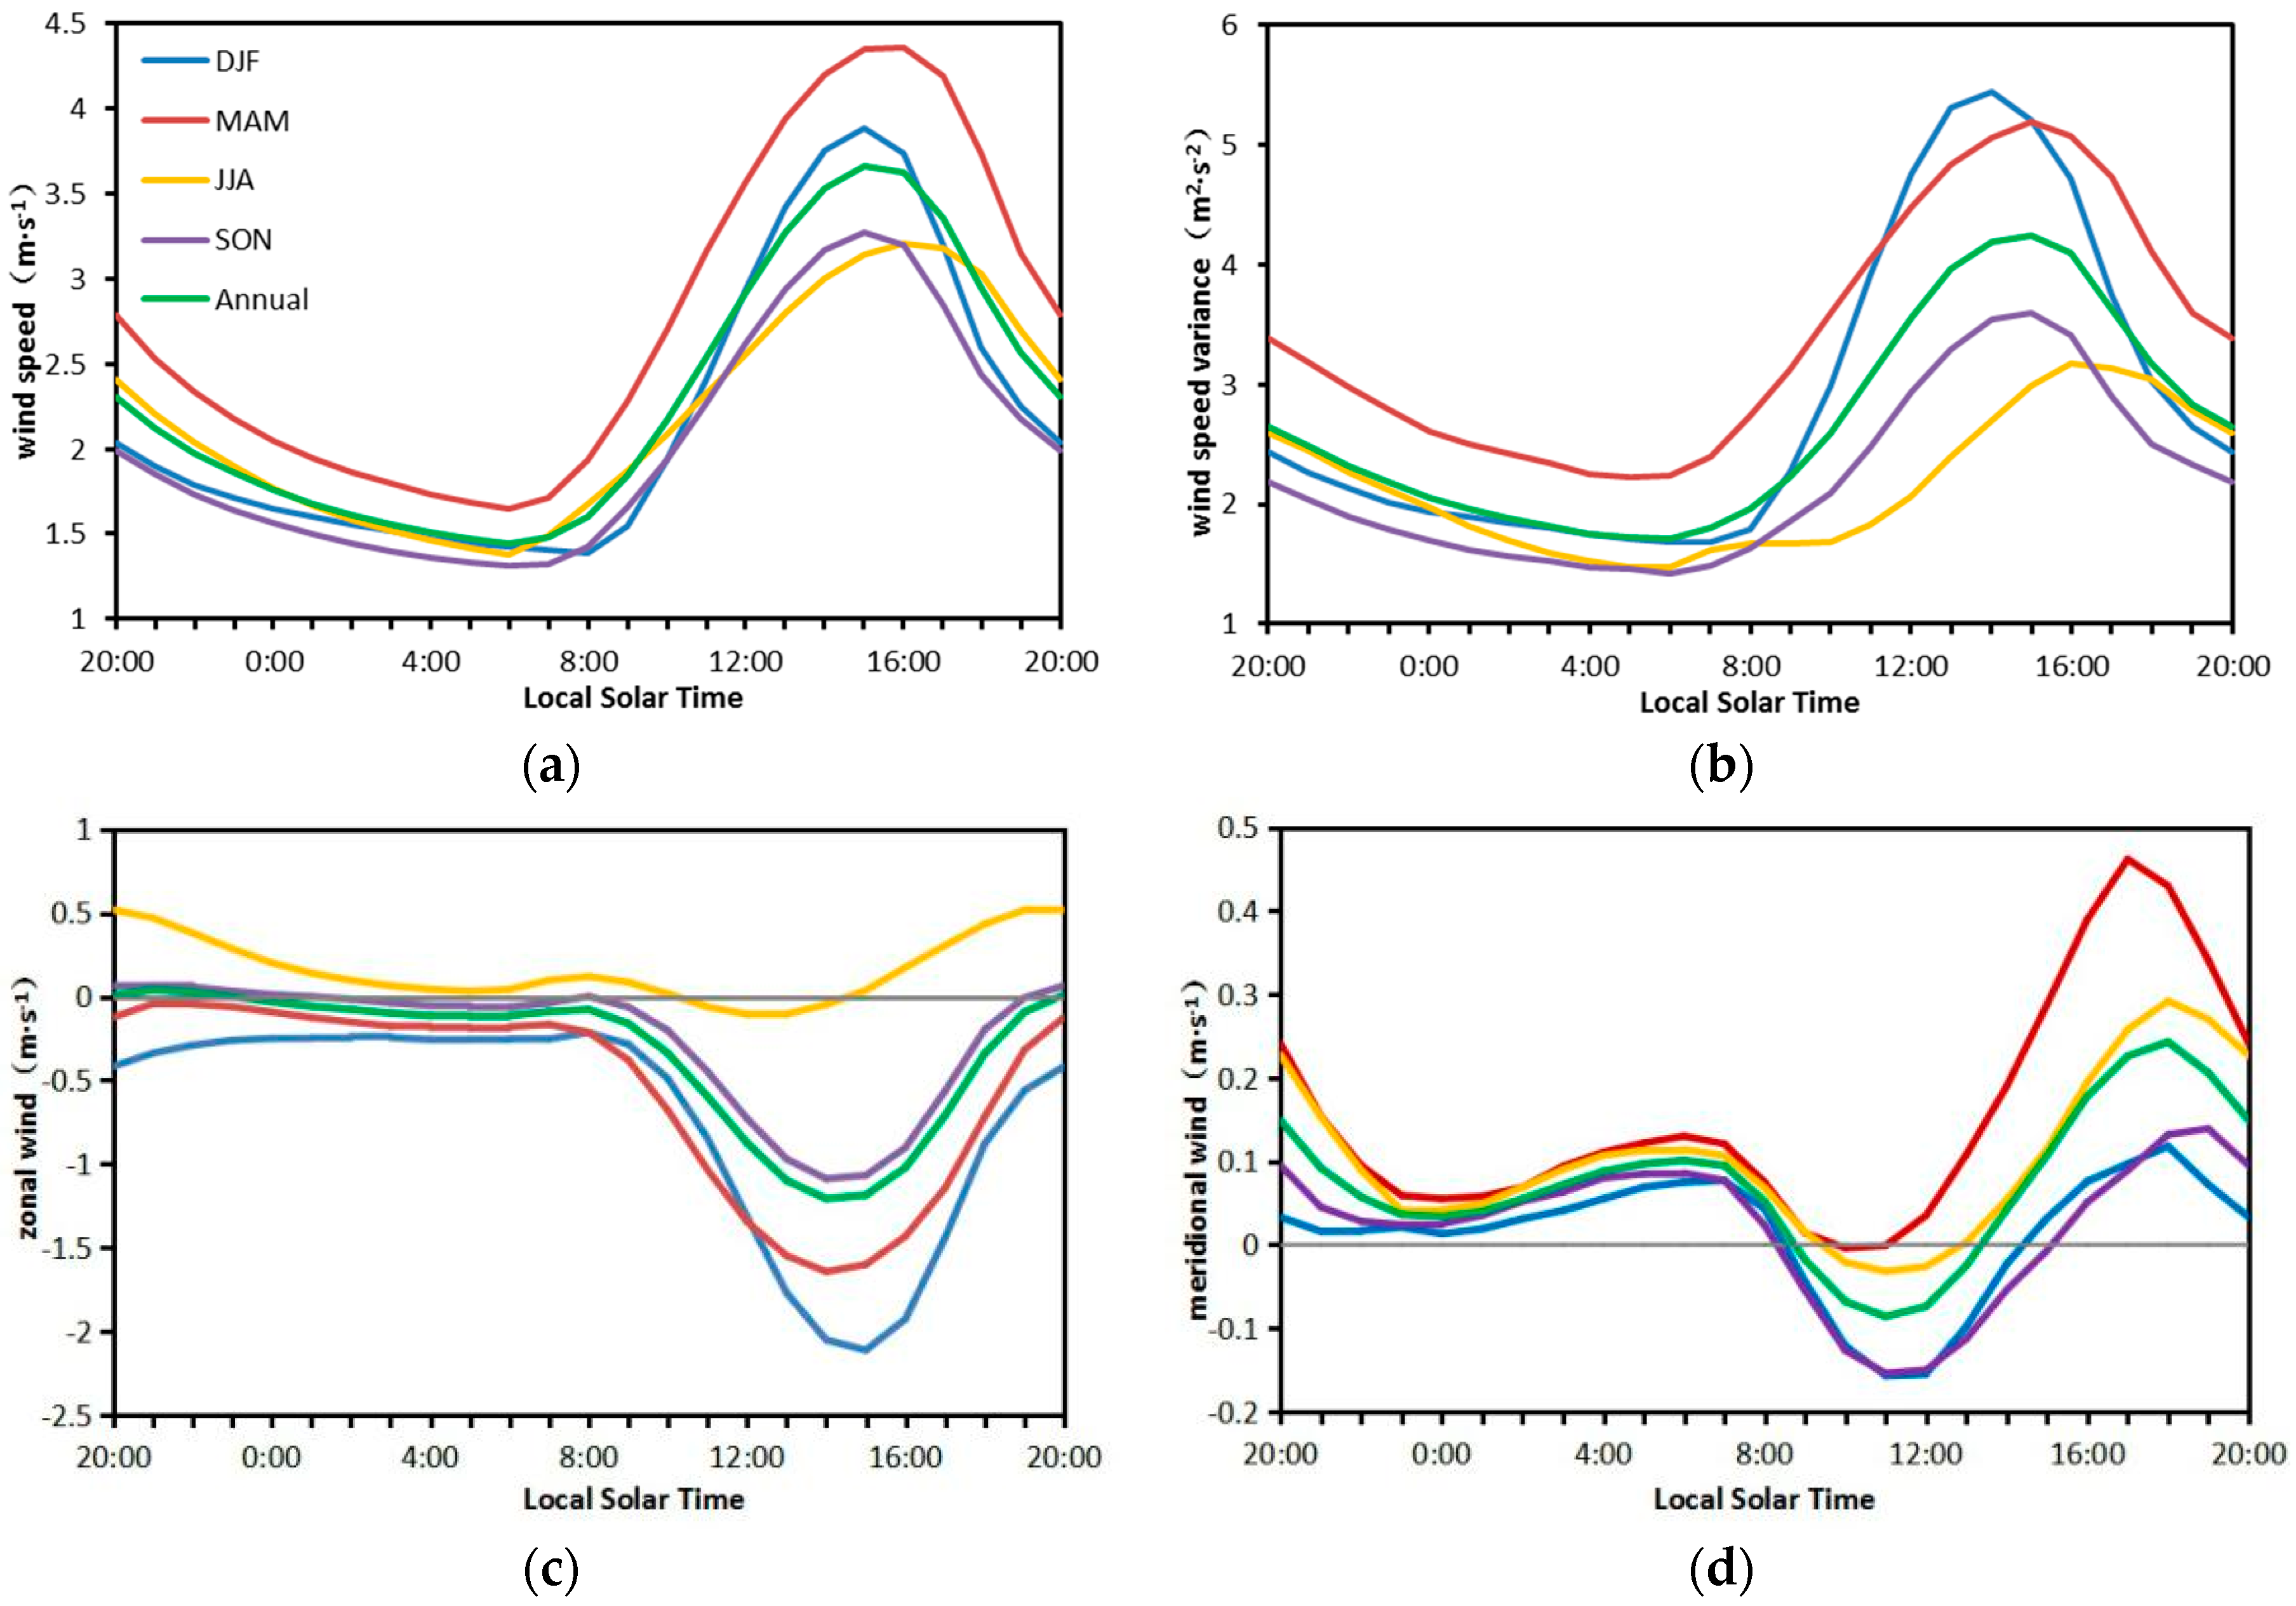
The surface wind speed shows large diurnal variation. MAM has the highest wind speed and largest daily range of wind speed. On the TP, the minimum wind speed occurs in the early morning at 0600 LST and the maximum in the afternoon at 1500 LST. It is understandable that during daytime, as a response to surface solar heating, the downward vertical turbulent transport of momentum reaches its strongest in the afternoon. During night time, as a response to nocturnal cooling in the boundary layer, the eddy viscosity is reduced and less momentum is transported to the lower level. The surface wind slows down gradually due to the surface friction [21]. When the wind speed is high, the variation in wind speed is also large. On the TP the daily minimum wind speed arrives 1 h later than that recorded in eastern China by Yu et al. (2009) [21]. The two regions analyzed see the peak hourly wind speed in the same hour. The average daily range of wind speed on the TP is 2.4 m·s−1, nearly twice that in eastern China.
(2)
The surface winds were decomposed into meridional and zonal winds, and their diurnal variation analyzed. The south wind dominated the meridional winds in each season, accounting for more than two-thirds of each day. In the mornings during DJF and SON, the south wind changes to a north wind, changing back to a south wind in the afternoon. In JJA and SON, east and west winds alternate as the prevailing wind direction. During DJF and MAM, the average wind direction on the TP is easterly throughout the day.
(3)
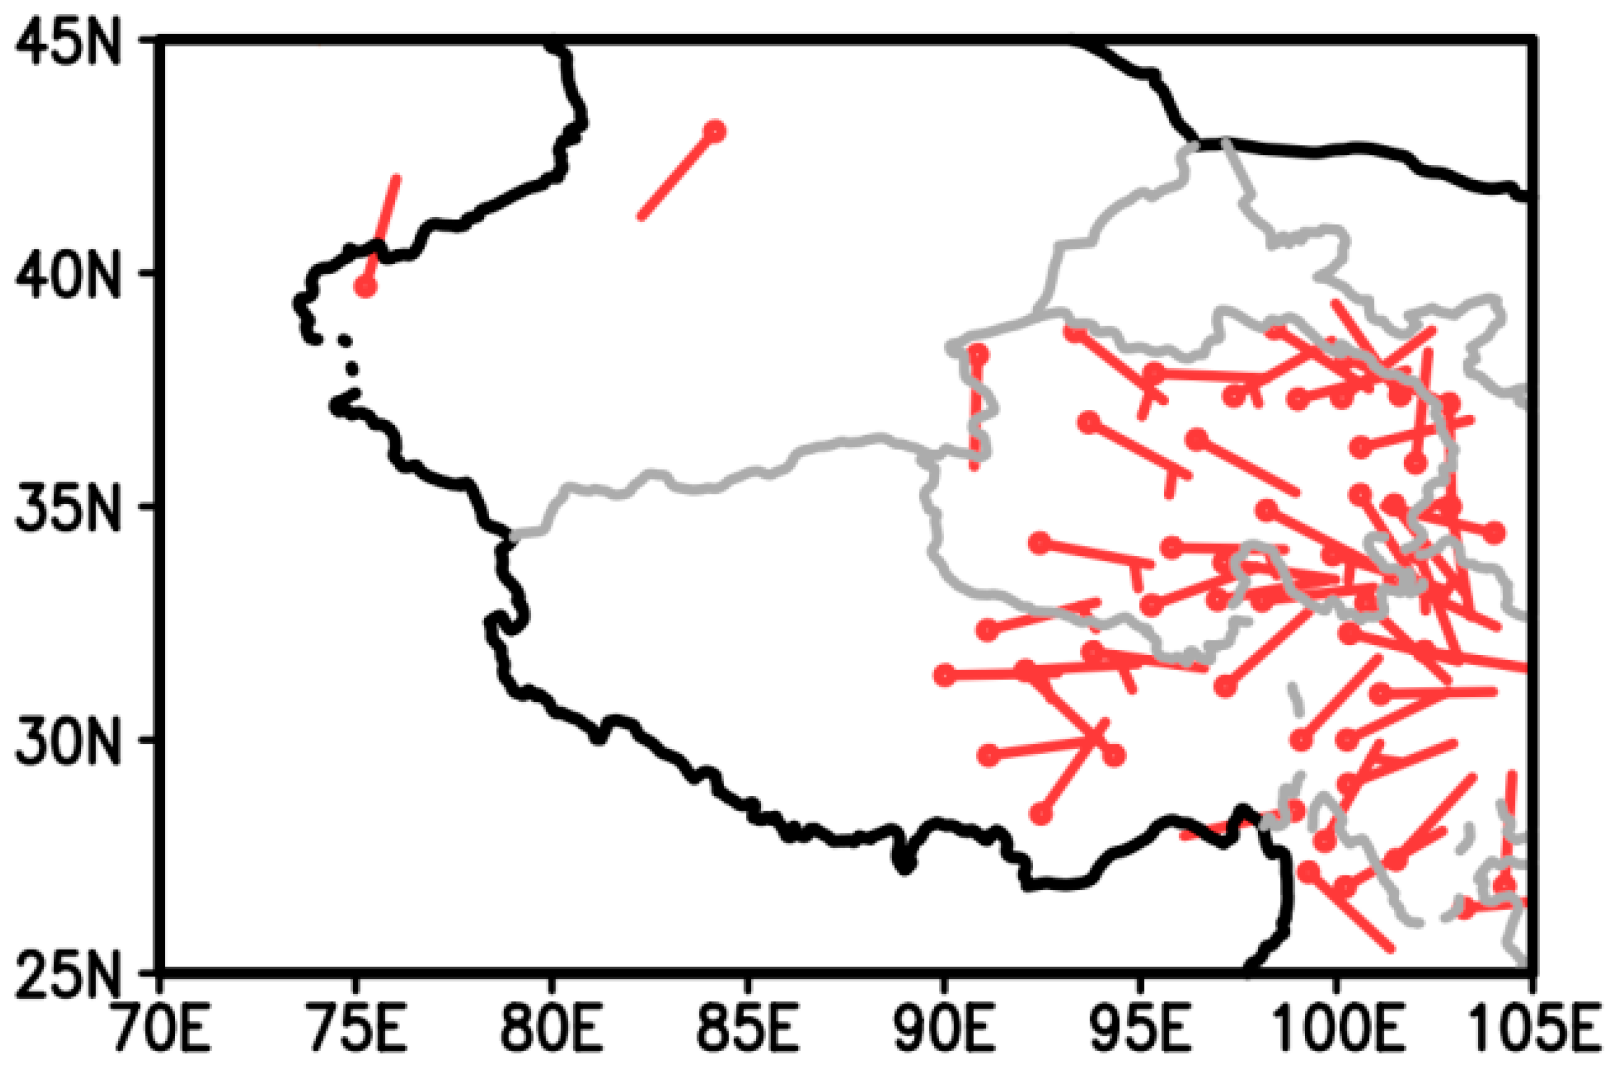
The seasonal variation in the daily wind speed range of each station on the TP is well defined. The area of high diurnal range moved to the northwest with seasonal changes from DJF to MAM and from MAM to JJA. The hourly wind speed at 57% of the stations takes 8–10 h to develop from the lowest to the highest speed. At 79% of the stations the wind speed rises from the lowest to the highest in less time than it takes to change from the highest to the lowest.
(4)
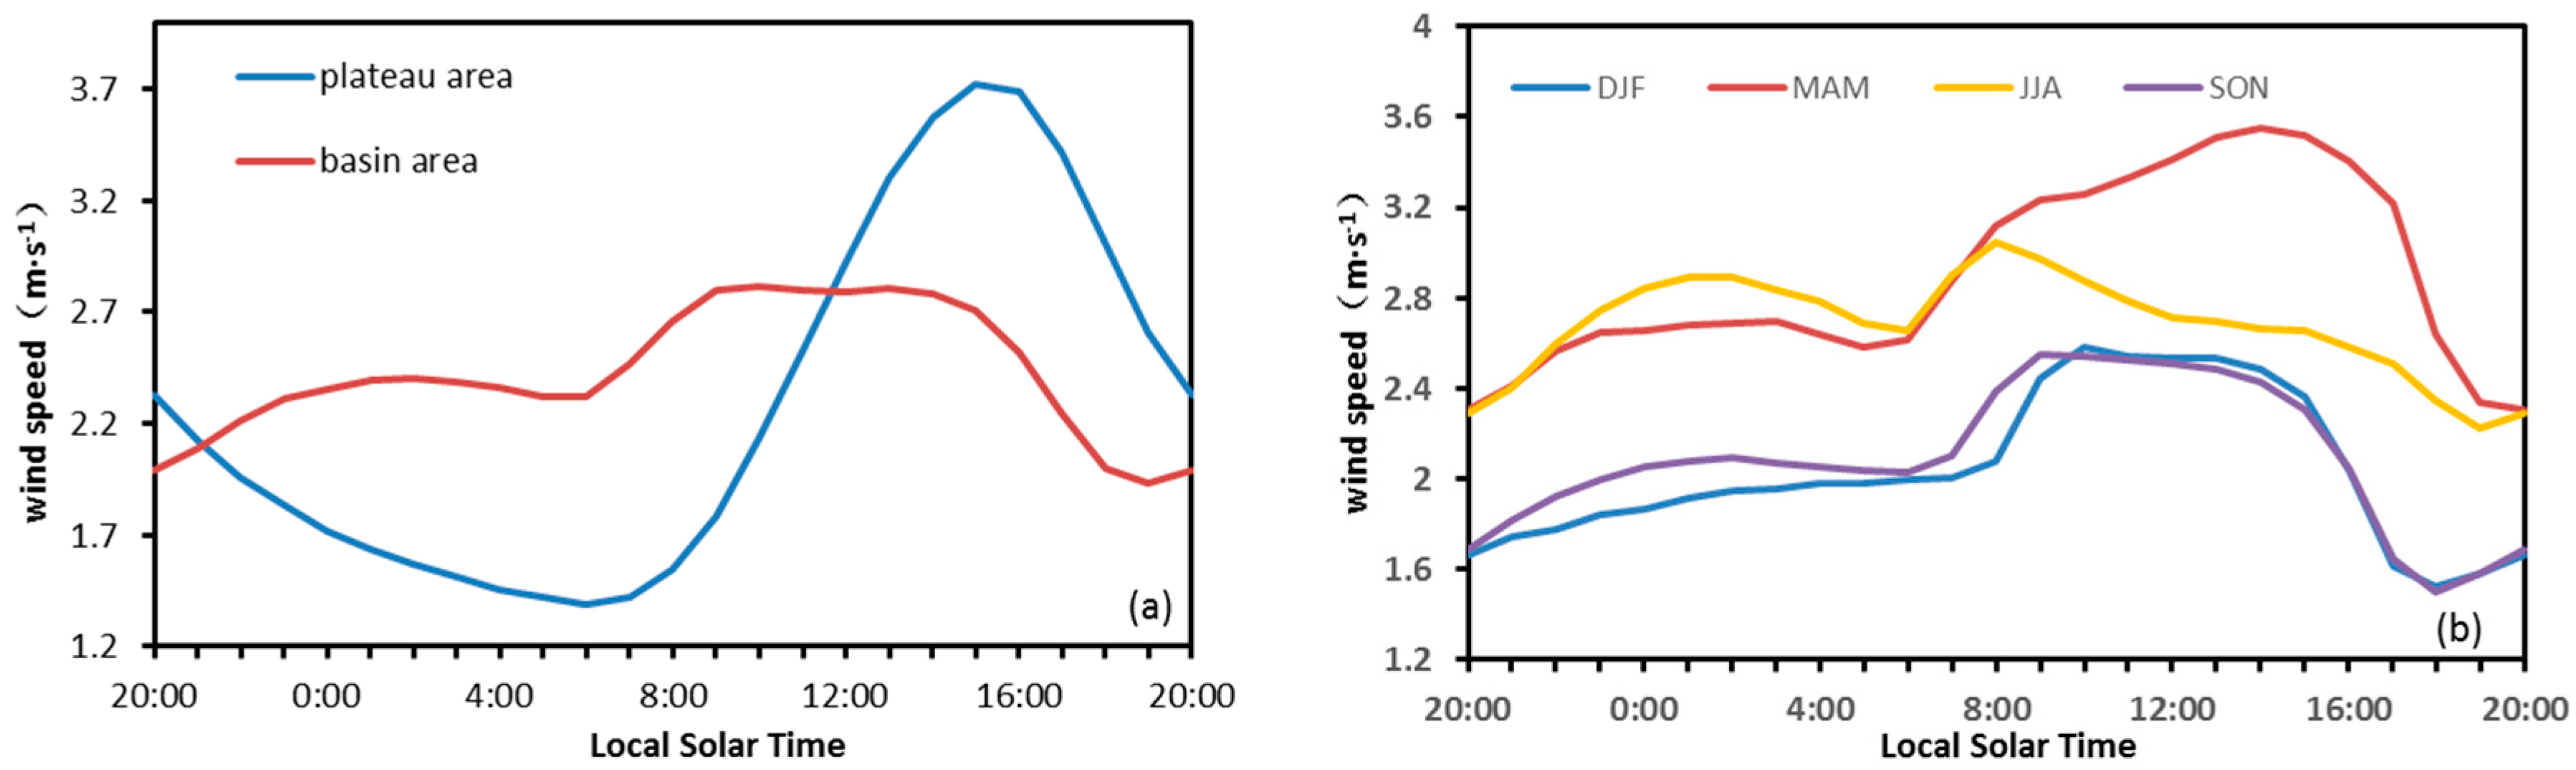
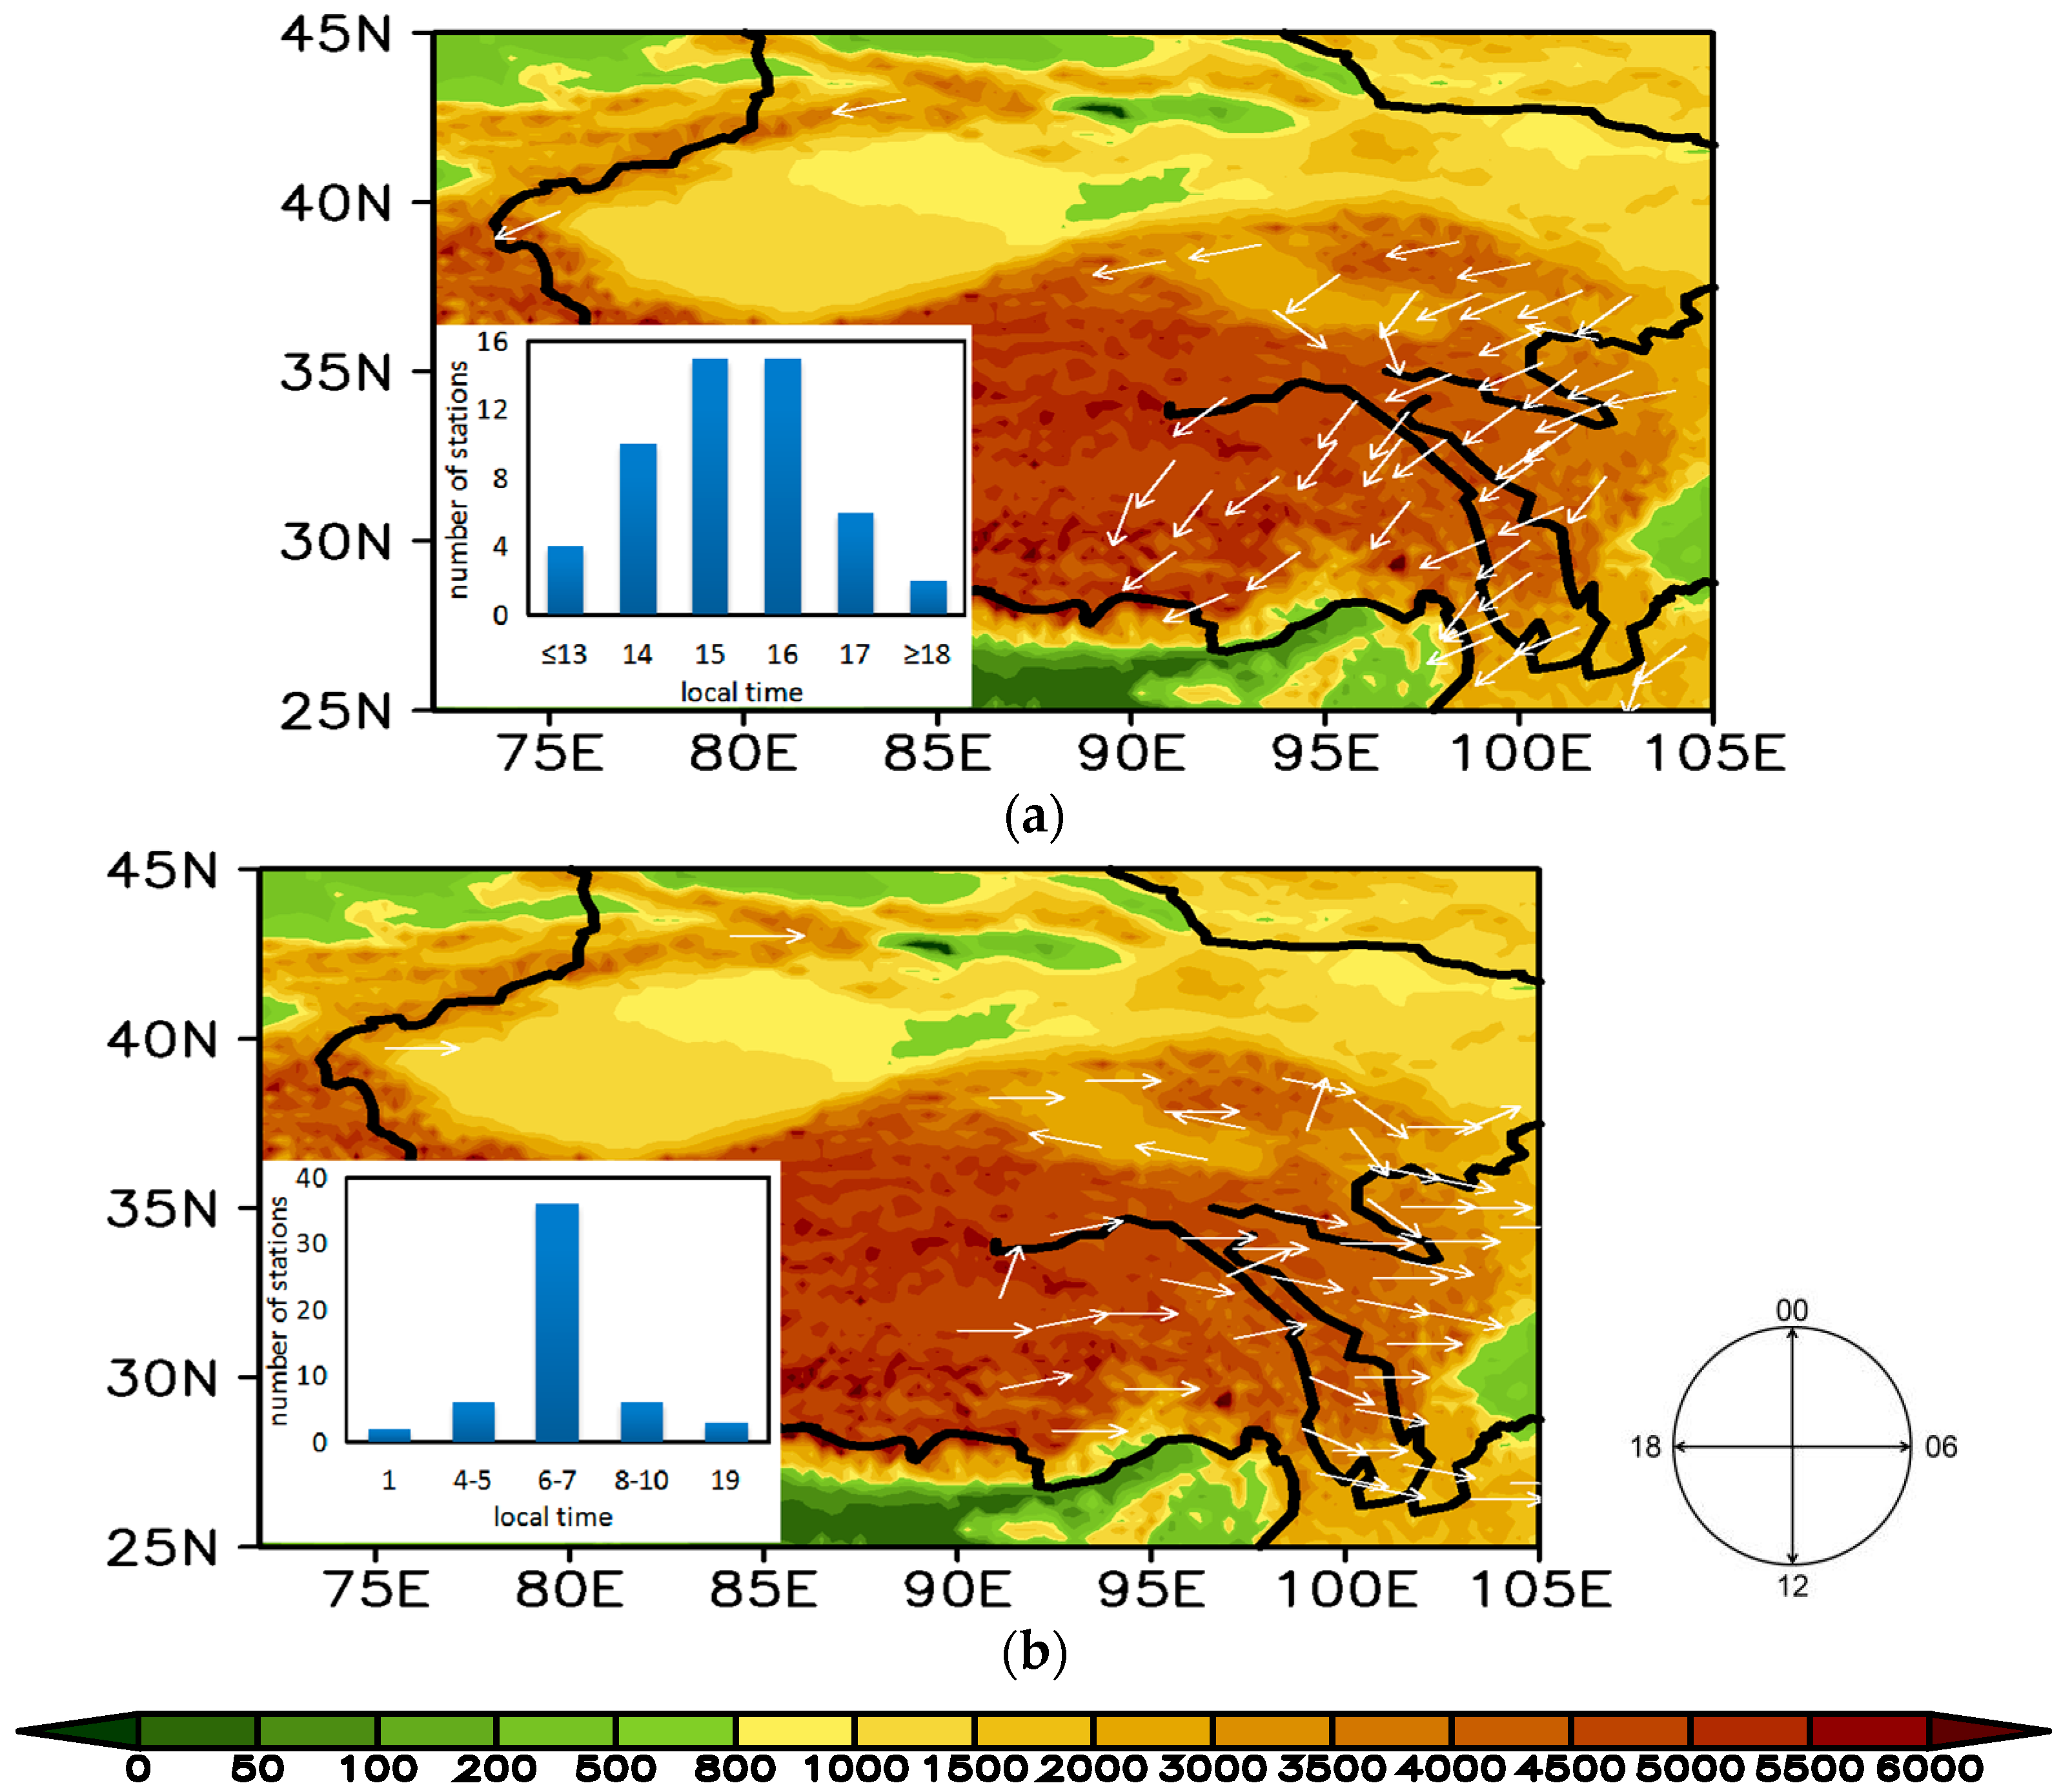
The diurnal variation of wind speed over the TP is noticeable [13]. At 0600–0700 LST, 68% of the stations experienced their lowest wind speed, and 57% recorded their highest wind speeds at 1500 or 1600 LST. The lowest and highest daily wind speeds in the eastern part of the TP were recorded 1 h later than in the western part. The diurnal variation in surface winds in the Qaidam Basin differs significantly from that at the other plateau stations due to the blocking effect of the surrounding terrain. In addition to the hilly area, mountain-valley breeze can also occur on the edge of the plateau and the basin, and there is a significant diurnal variation in wind speed and wind direction. During the daytime, the wind often blows from the valley to the mountainside and the mountaintop. At nighttime, the wind often blows from the mountaintop and the mountainside to the valley. Based on decomposing the observed wind into the system wind and the mountain-valley breeze, researchers could carry out research on the diurnal variation of the surface wind and the mountain-valley breeze. This may contribute to analyzing the causes of diurnal variation of surface wind on the TP, however, more detailed mechanisms are to be further explored in future studies.
(5)
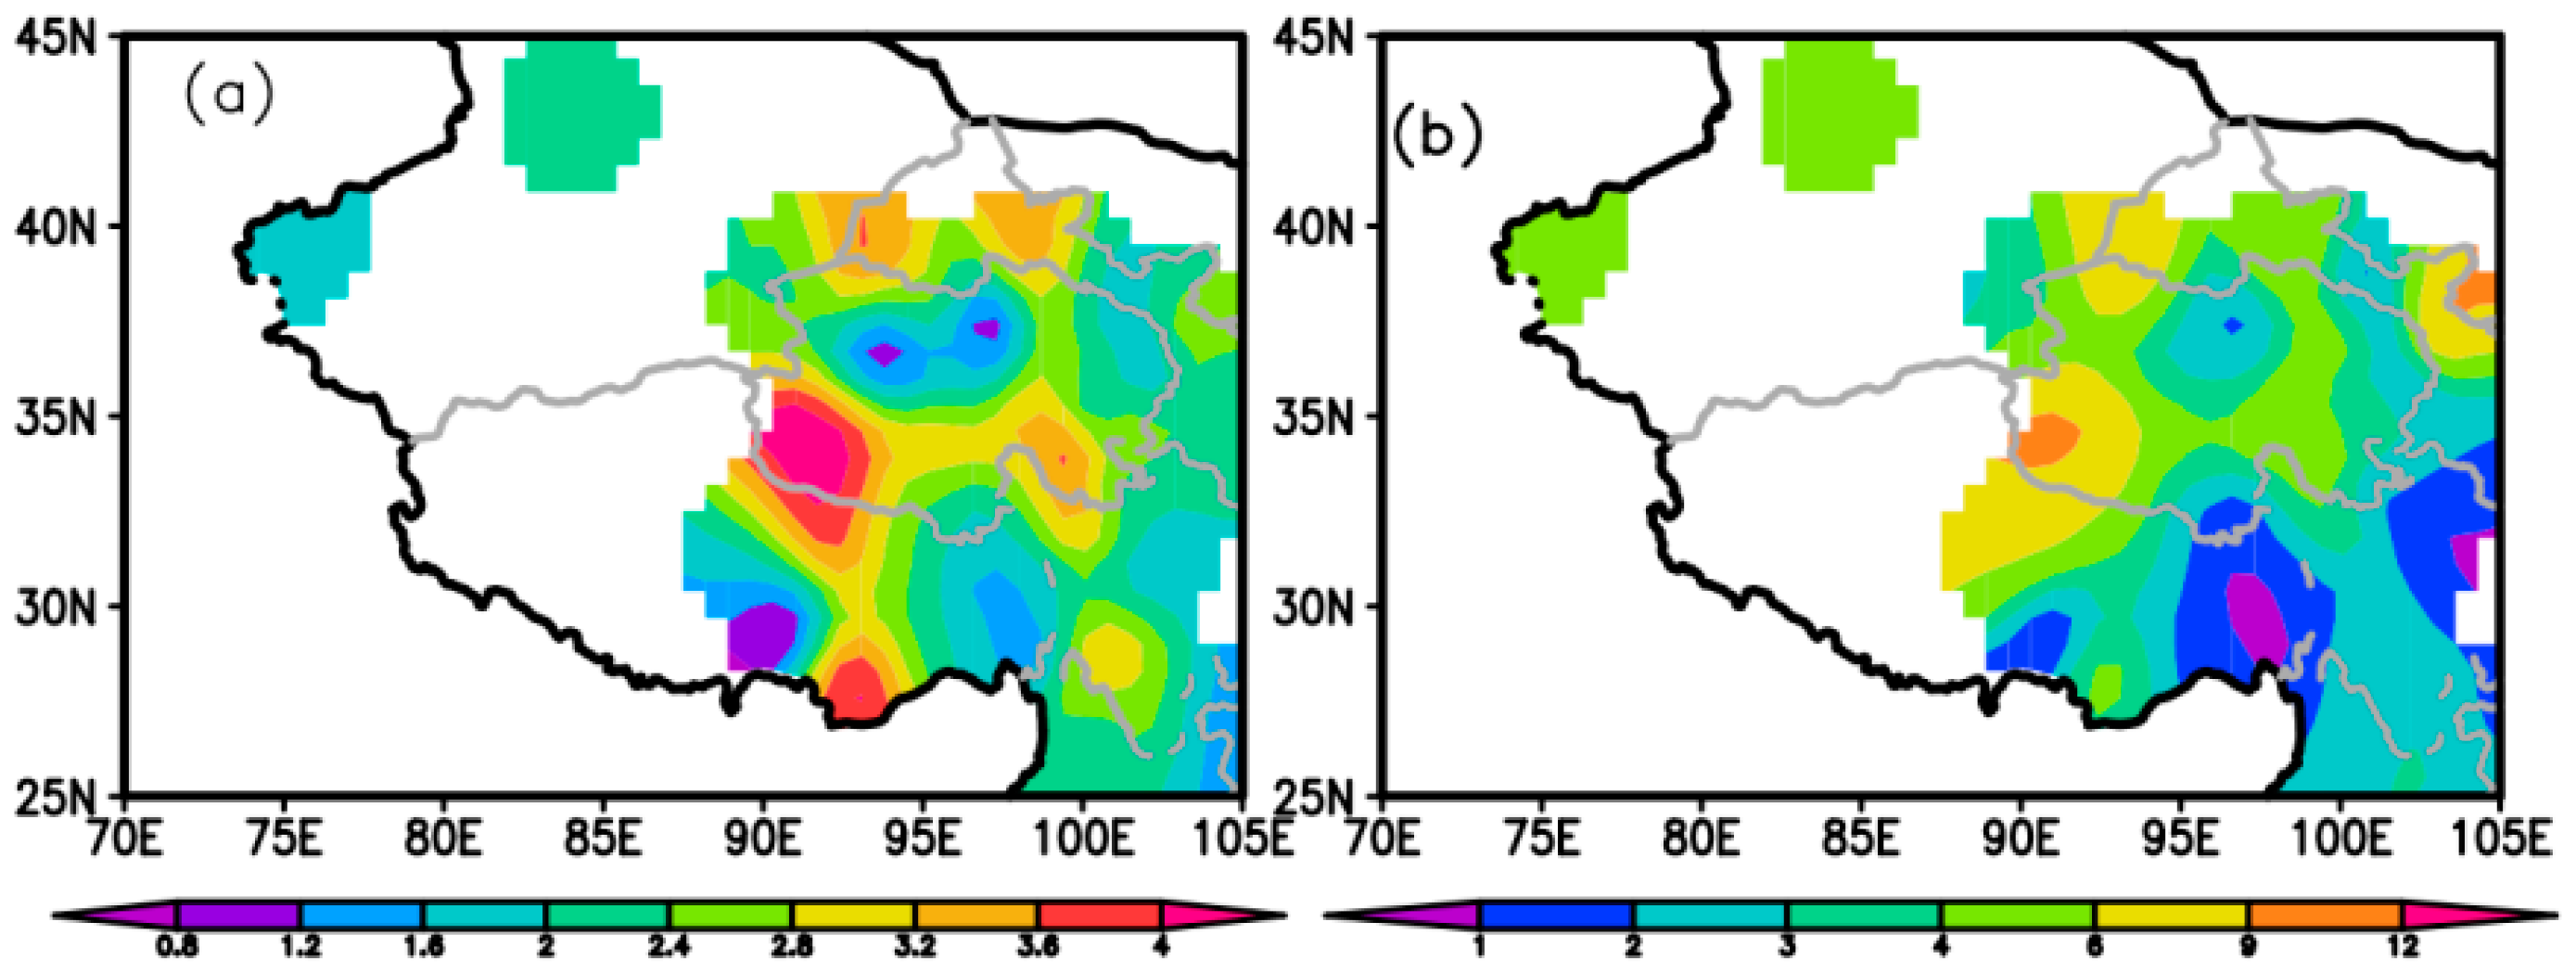
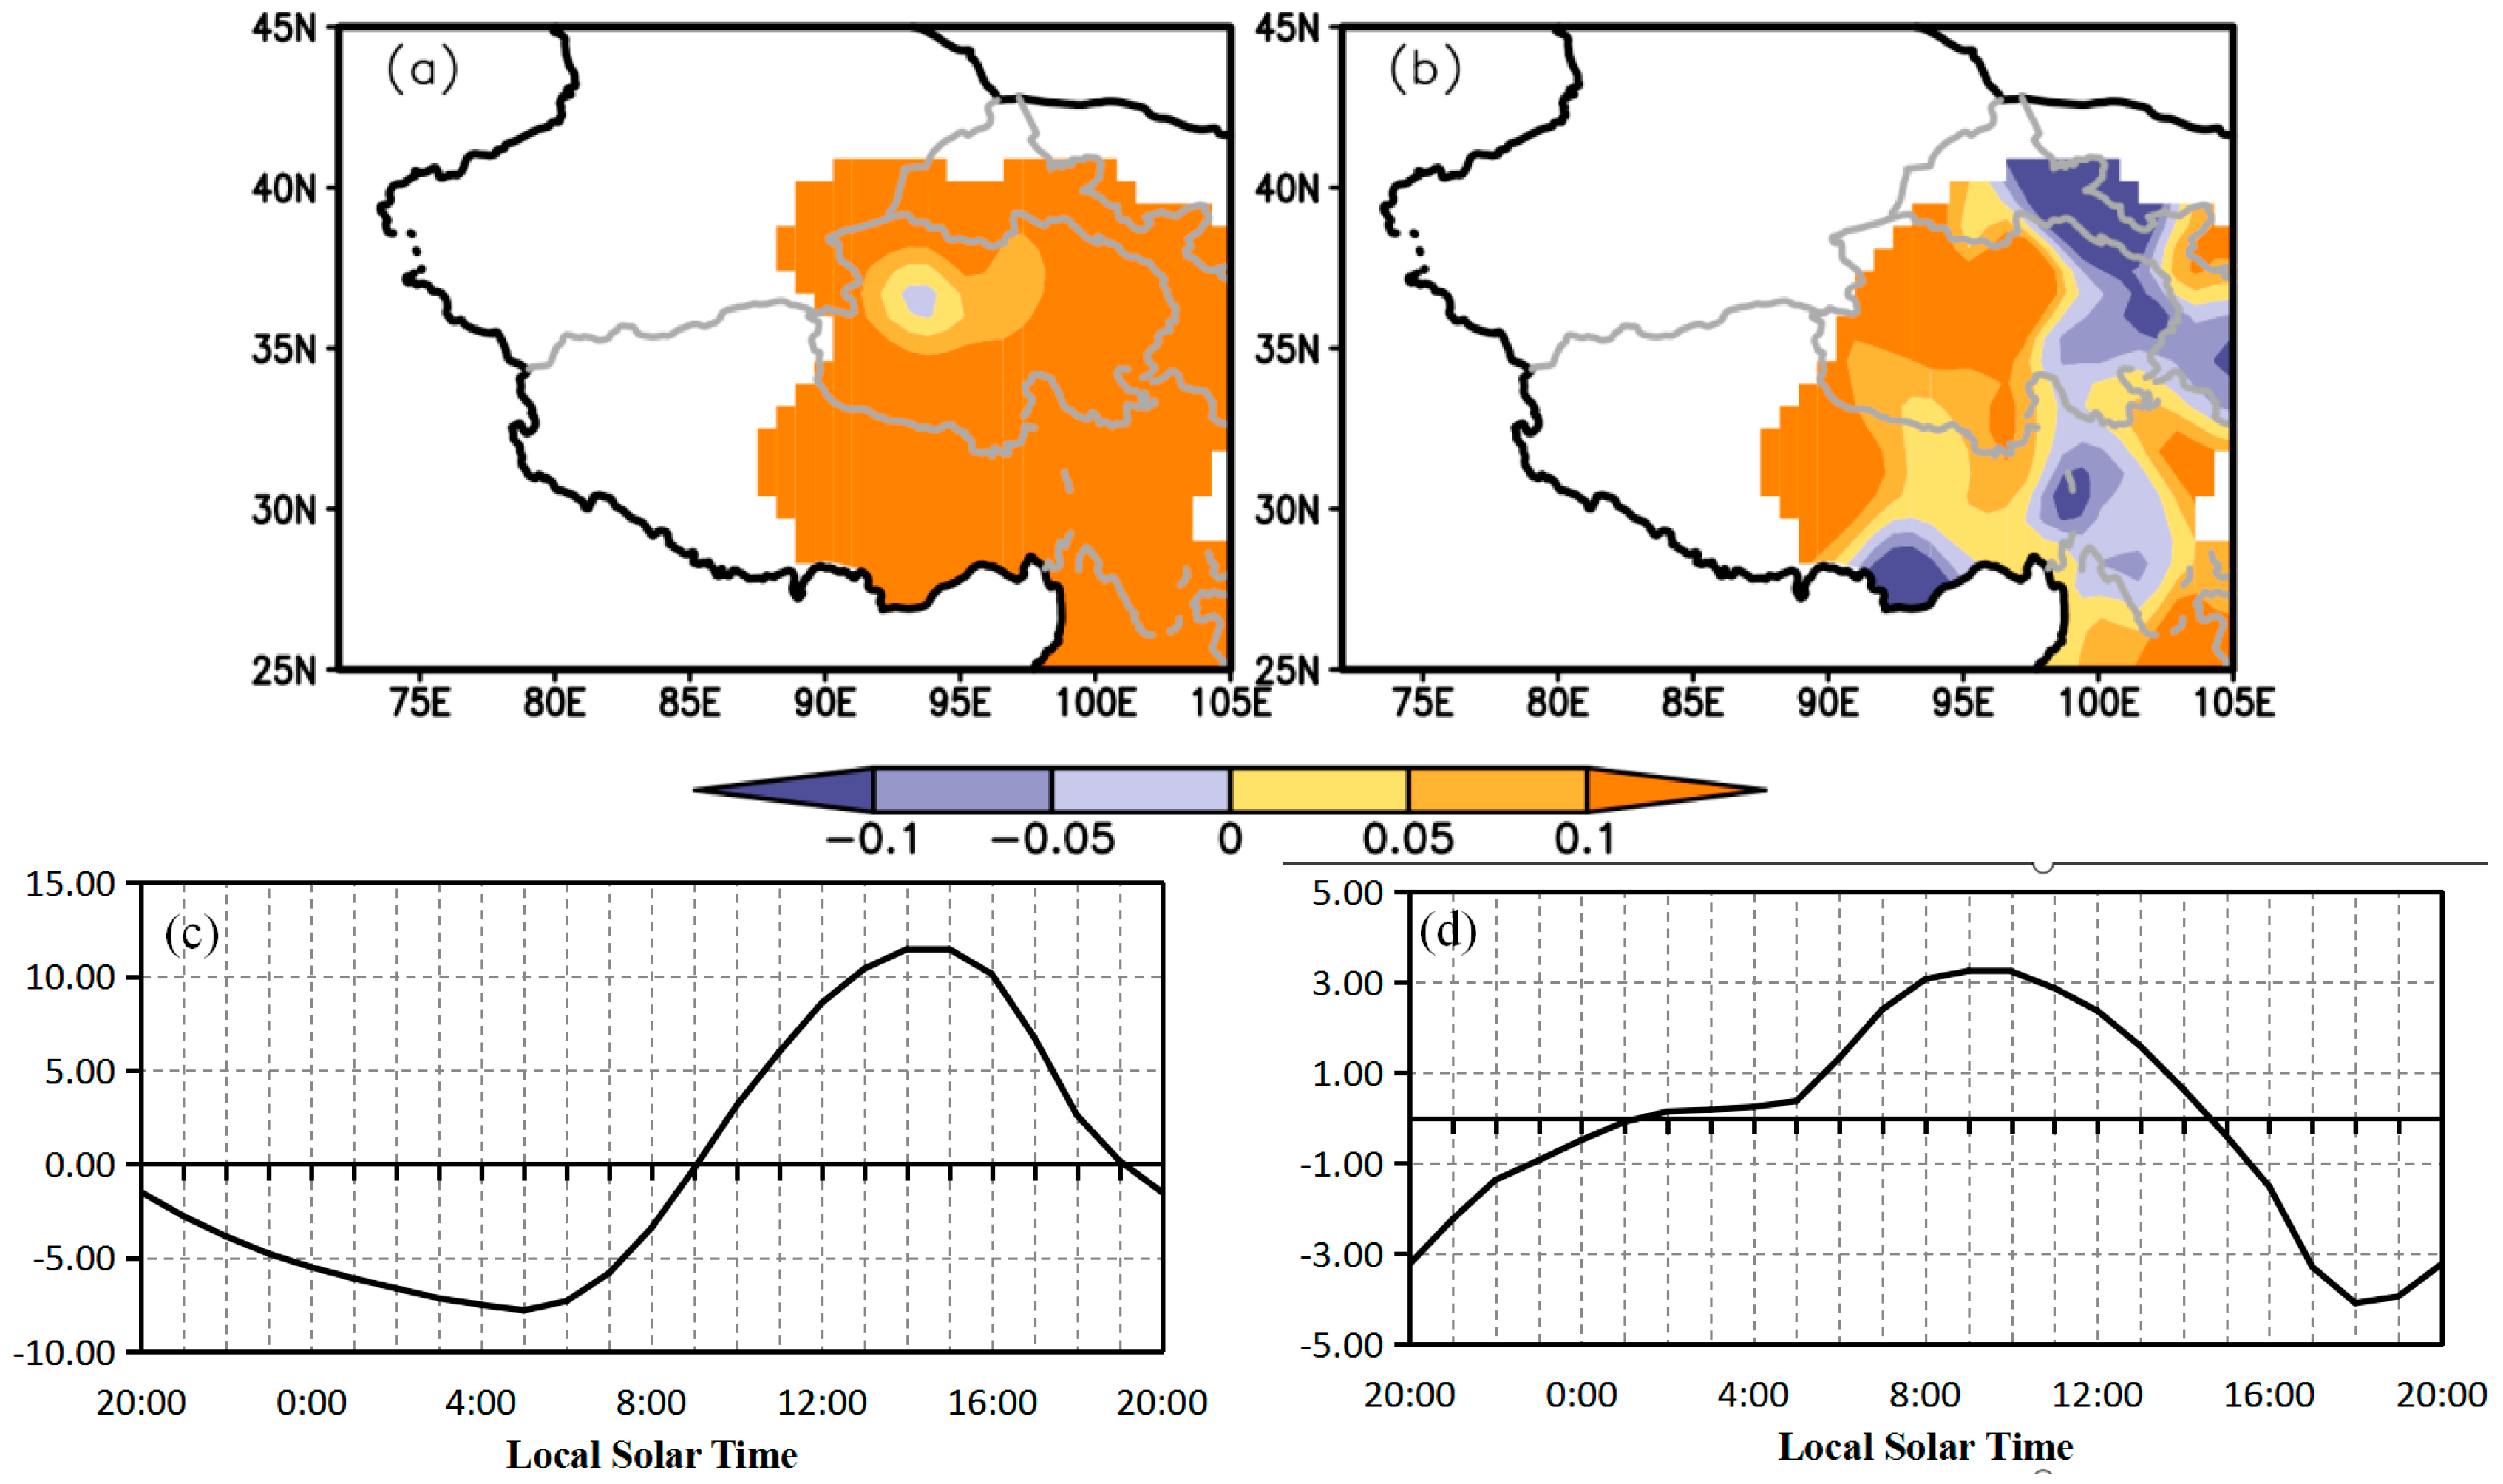
The EOF of the hourly wind speeds reflects the high wind speeds in the afternoon and lower wind speeds in the morning over most of the TP (except for the Qaidam Basin). It also reflects that the wind speed in the eastern part of the TP reaches a diurnal maximum later than that in the western part. It may be reasonable that EOF2 may be related to the different atmospheric circulation systems [25], topographic characteristics, snow cover and vegetation cover in the eastern and western parts of the TP.

Author Contributions

Conceptualization, Y.Z. and J.L.; Data curation, Y.Z. and Q.Z.; Formal analysis, Y.Z.; Funding acquisition, Y.Z.; Investigation, Q.Z.; Methodology, J.L.; Project administration, Q.Z. and X.J.; Resources, Y.Z.; Software, X.J. and A.F.; Supervision, J.L.; Writing—Original Draft, Y.Z. and X.J.; Writing—Review & Editing, Y.Z. and J.L.

Funding

This research received no external funding.

Acknowledgments

This work was supported by the Chinese National Natural Science Foundation ‘Development of Data Sharing Platform of the Tibetan Plateau’s Multi-Source Land-Atmosphere System Information’ under grant number 91637313 and the National Natural Science Foundation of China (NSFC) Project (41530424).

Conflicts of Interest

The authors declare no conflict of interest.

References

  1. Yang, G.-Y.; Slingo, J. The diurnal cycle in the tropics. Mon. Weather Rev. 2001, 129, 784–801. [Google Scholar] [CrossRef]
  2. Nesbitt, S.-W.; Zipser, E.-J. The diurnal cycle of rainfall and convective intensity according to three years of TRMM measurements. J. Clim. 2003, 16, 1456–1475. [Google Scholar] [CrossRef]
  3. Liu, C.-H.; Moncrieff, M.-W. A numerical study of the diurnal cycle of tropical oceanic convection. J. Atmos. Sci. 1998, 55, 2329–2344. [Google Scholar] [CrossRef]
  4. Bowman, K.-P.; Collier, J.-C.; North, G.-R.; Wu, Q.; Ha, E.; Hardin, J. Diurnal cycle of tropical precipitation in Tropical Rainfall Measuring Mission (TRMM) satellite and ocean buoy rain gauge data. J. Geophys. Res. 2005, 110, 1–14. [Google Scholar] [CrossRef]
  5. Zuidema, P. Convective clouds over the Bay of Bengal. Mon. Weather Rev. 2003, 131, 780–798. [Google Scholar] [CrossRef]
  6. Xiao, D.; Zhao, P.; Wang, Y.; Tian, Q.-H.; Zhou, X.-J. Millennial-scale phase relationship between North Atlantic deep-level temperature and Qinghai-Tibet Plateau temperature and its evolution since the Last Interglaciation. Chin. Sci. Bull. 2014, 59, 75–81. [Google Scholar] [CrossRef]
  7. Nan, S.-L.; Zhao, P.; Chen, J.-M. Variability of summertime Tibetan tropospheric temperature and associated precipitation anomalies over the central-eastern Sahel. Clim. Dyn. 2018. [Google Scholar] [CrossRef]
  8. Guo, H.; Xu, M.; Hu, Q. Changes in near-surface wind speed in China: 1969–2005. Int. J. Climatol. 2011, 31, 349–358. [Google Scholar] [CrossRef]
  9. Fu, Z.-T.; Li, Q.-L.; Yuan, N.-M.; Yao, Z.-H. Multi-scale entropy analysis of vertical wind-speed series in atmospheric boundary-layer. Commun. Nonlinear Sci. 2014, 19, 83–91. [Google Scholar] [CrossRef]
  10. Guo, X.-Y.; Wang, L.; Tian, L.-D.; Li, X.-P. Elevation-dependent reductions in wind speed over and around the Tibetan Plateau. Int. J. Climatol. 2017, 37, 1117–1126. [Google Scholar] [CrossRef]
  11. Chen, S.-B.; Liu, Y.-F.; Thomas, A. Climatic change on the Tibetan Plateau: Potential evapotranspiration trends from 1961–2000. Clim. Chang. 2006, 76, 291–319. [Google Scholar]
  12. Dai, A.-G. Global precipitation and thunderstorm frequencies. Part II: Diurnal variations. J. Clim. 2001, 14, 1112–1128. [Google Scholar] [CrossRef]
  13. Dai, A.-G.; Deser, C. Diurnal and semidiurnal variations in global surface wind and divergence fields. J. Geophys. Res. 1999, 104, 109–126. [Google Scholar] [CrossRef]
  14. Murakami, M. Analysis of the deep convective activity over the Western Pacific and Southeast Asia. Part I: Diurnal variation. J. Meteorol. Soc. Jpn. 1983, 61, 60–76. [Google Scholar] [CrossRef]
  15. Bhatt, B.-C.; Nakamura, K. Characteristics of monsoon rainfall around the Himalayas revealed by TRMM precipitation Radar. Mon. Weather Rev. 2005, 133, 149–165. [Google Scholar] [CrossRef]
  16. Liu, L.-P.; Feng, J.-M.; Chu, R.-Z.; Zhou, J.-J. The diurnal variation of precipitation in Monsoon season in the Tibetan Plateau. Adv. Atmos. Sci. 2002, 19, 365–378. [Google Scholar]
  17. Bai, A.-J.; Liu, C.-H.; Liu, X.-D. Diurnal variation of summer rainfall over the Tibetan Plateau and its neighboring regions revealed by TRMM Multisatellite Precipitation Analysis. Chin. J. Geophys. 2008, 51, 704–714. (In Chinese) [Google Scholar] [CrossRef]
  18. Zhao, Y.-F.; Zhang, Q.; Yu, Y.; Yang, G. Development of hourly wind speed dataset in China and application on Qinghai Tibetan Plateau. Plat. Meteorol. 2017, 36, 930–938. [Google Scholar]
  19. Zhang, W.-J.; Jin, F.-F.; Zhao, J.-X.; Li, J.-P. On the bias in simulated ENSO SSTA meridional width of CMIP3 models. J. Clim. 2013, 26, 3173–3186. [Google Scholar] [CrossRef]
  20. He, W.-P.; Zhao, S.-S. Assessment of the quality of NCEP-2 and CFSR reanalysis daily temperature in China based on long-range correlation. Clim. Dyn. 2018, 50, 493–505. [Google Scholar] [CrossRef]
  21. Yu, R.-C.; Li, J.; Chen, H.-M. Diurnal variation of surface wind over central eastern China. Clim. Dyn. 2009, 33, 1089–1097. [Google Scholar] [CrossRef]
  22. Crawford, K.-C.; Hudson, H.-R. The diurnal wind variation in the lowest 1500 ft in Central Oklahoma: June 1966–May 1967. J. Appl. Meteorol. 1973, 12, 127–132. [Google Scholar] [CrossRef]
  23. North, G.-R.; Bell, T.-L.; Cahalan, R.-F.; Moeng, F.-J. Sampling errors in the estimation of empirical orthogonal functions. Mon. Weather Rev. 1982, 110, 699–706. [Google Scholar] [CrossRef]
  24. Qin, Q.-C.; Shen, X.-S. An estimate of surface pressure drag of the Tibetan Plateau and its characteristic analysis. Acta. Meteorol. Sin. 2015, 73, 93–109. (In Chinese) [Google Scholar]
  25. Yang, K.; Wu, H.; Qin, J.; Lin, C.-G.; Tang, W.-J.; Chen, Y.-Y. Recent climate changes over the Tibetan Plateau and their impacts on energy and water cycle: A review. Glob. Planet Chang. 2014, 112, 79–91. [Google Scholar] [CrossRef]
Figure 1. Diurnal variations in seasonal and annual mean wind speed (a), variances of wind speed (b), zonal wind speed (c), and meridional wind speed (d) averaged over the TP.
Atmosphere 10 00112 g001
Figure 2. Timing of daily maximum (a) and minimum (b) surface wind speeds (vectors according to key at right, LST). Shading denotes elevation (m). The insets show histograms of the peak (a) and valley (b) hours.
Atmosphere 10 00112 g002
Figure 3. Surface wind direction and speed at the max-hour for each station.
Atmosphere 10 00112 g003
Figure 4. Daily range of annual average wind speed (a) (m·s−1), hourly wind speed variance (b), and daily range of wind speed (m·s−1) in December–February (DJF) (c), March–May (MAM) (d), June–August (JJA) (e), and September–November (SON) (f).
Atmosphere 10 00112 g004aAtmosphere 10 00112 g004b
Figure 5. (a) Diurnal variations in annual mean wind speed averaged over the plateau area (blue line) and the basin area (red line). (b) Diurnal variations in seasonal mean wind speed averaged over the basin area.
Atmosphere 10 00112 g005
Figure 6. (a) The first leading empirical orthogonal function (EOF1) pattern of climatological hourly wind speeds on the Tibetan Plateau (TP). (b) As for (a), but for the second leading empirical orthogonal function (EOF2). (c) Time series corresponding to EOF1. (d) Time series corresponding to EOF2.
Atmosphere 10 00112 g006
Table 1. Frequency distribution of the time (hours) required from the lowest to the highest daily wind speeds among the stations.
Number of hours67891011121314151619
Number of stations25914115211111
Percentage (%)3.89.417.026.420.89.43.81.91.91.91.91.9
Table 2. The numbers of stations which recorded northeasterly, southeasterly, northwesterly, and southwesterly winds in max-dir, min-dir, and average wind direction.
Wind DirectionThe Numbers of Stations
Max-DirMin-DirAverage Wind Direction
Northeast241017
Southeast221922
Northwest4156
Southwest398

