Article

Characteristics and Source Apportionment of Metallic Elements in PM2.5 at Urban and Suburban Sites in Beijing: Implication of Emission Reduction

1
State Key Laboratory of Atmospheric Boundary Layer Physics and Atmospheric Chemistry (LAPC), Institute of Atmospheric Physics, Chinese Academy of Sciences, Beijing 100029, China
2
Department of Environmental Science and Engineering, Beijing University of Chemical Technology, Beijing 100029, China
3
Beijing Meteorological Information Center, Beijing 100089, China
4
Plateau Atmosphere and Environment Key Laboratory of Sichuan Province, School of Atmospheric Sciences, Chengdu University of Information Technology, Chengdu 610225, China
5
College of Resources and Environment, University of Chinese Academy of Sciences, Beijing 100049, China
6
Center for Excellence in Regional Atmospheric Environment, Institute of Urban Environment, Chinese Academy of Sciences, Xiamen 361021, China
*
Authors to whom correspondence should be addressed.
Atmosphere 2019, 10(3), 105; https://doi.org/10.3390/atmos10030105
Submission received: 24 January 2019 / Revised: 17 February 2019 / Accepted: 20 February 2019 / Published: 26 February 2019
(This article belongs to the Special Issue Urban Atmospheric Aerosols: Sources, Analysis and Effects)

Abstract

:
To gain insights into the impacts of emission reduction measures on the characteristics and sources of trace elements during the 2014 Asia-Pacific Economic Cooperation (APEC) summit, PM2.5 samples were simultaneously collected from an urban site and a suburban site in Beijing from September 15th to November 12th, and fifteen metallic elements were analyzed, including five crustal elements (Mg, Al, K, Ca and Fe), nine trace metals (V, Cr, Mn, Co, Cu, Zn, Ag, Cd and Pb) and As. Most of the trace metals (V, Cr, Mn, As, Cd and Pb) decreased more than 40% due to the emission regulations during APEC, while the crustal elements decreased considerably (4–45%). Relative to the daytime, trace metals increased during the nighttime at both sites before the APEC summit, but no significant difference was observed during the APEC summit, suggesting suppressed emissions from anthropogenic activities. Five sources (dust, traffic exhaust, industrial sources, coal and oil combustion and biomass burning) were resolved using positive matrix factorization (PMF), which were collectively decreased by 30.7% at the urban site and 14.4% at the suburban site during the APEC summit. Coal and oil combustion regulations were the most effective for reducing the trace elements concentrations (urban site: 63.1%; suburban site: 52.0%), followed by measures to reduce traffic exhaust (52.8%) at the urban site and measures to reduce biomass burning (37.7%) at the suburban site. Our results signify that future control efforts of metallic elements in megacities like Beijing should prioritize coal and oil combustion, as well as traffic emissions.

1. Introduction

PM2.5, also known as atmospheric fine particles, refers to particulate matter with an aerodynamic diameter of less than or equal to 2.5 μm. These particles not only endanger human health but also impact regional atmospheric visibility and environmental climate [1,2,3]. Because PM2.5 particles are small in size and have large specific surface areas, they easily adsorb large quantities of organic compounds, such as mutagens, pathogens and heavy metals. Trace elements are some of the most important components in PM2.5, as they are non-biodegradable, highly enriched and highly toxic. Previous studies have found that Mn, Ni, Cu, Zn, Se and Pb are potentially toxic to the human body, and that As, Cr and Ni are potent carcinogens that can seriously threaten human health [4,5,6,7]. Besides the effects on human health, trace metals could also damage ecological environments through dry and wet deposition to terrestrial and aquatic ecosystems [8].
The Asia-Pacific Economic Cooperation (APEC) summit that convened in November 2014, which is the transition period between autumn and winter, was held in Beijing. During this period, the air was dry, the wind speed was low, and the static inversion temperature was relatively stable. Beijing is surrounded by mountains on three sides (to the north, south and west), and thus the southerly airflow near the ground is weak and is consequently not conducive for the horizontal diffusion of pollutants. In addition, the strong sea level pressure and uniform pressure field that collectively result in the vertical stability of the atmospheric stratification over Beijing are not conducive for the vertical diffusion of pollutants. Moreover, the Beijing-Tianjin-Hebei region contains numerous highly polluting industries, including the steel, cement, oil refining, and petrochemical industries, which emit enormous quantities of air pollutants that are carried along southerly currents from Hebei, Tianjin, and Shandong toward Beijing. To ensure a desirable level of air quality during the APEC conference, Beijing, Tianjin, Hebei, Shanxi, and Shandong Provinces in addition to Inner Mongolia and other provinces and cities have adopted emission reduction measures of unprecedented intensity and scope, thereby generating the characteristic “APEC blue” sky over Beijing during the summit. These control measures include regulations permitting only even or odd license plate number vehicle use, air pollution supervision for air quality, vacation days off for the public, construction site restrictions to mitigate road dust, polluting company and industry restrictions, and regional controls by several provinces.
Several studies were performed within the Beijing-Tianjin-Hebei region regarding the air quality and impacts of emission regulations on PM2.5 during the APEC summit [9,10,11,12]. A previous study also examined the characteristics of PM2.5, including the concentrations, size distributions and sources of PM2.5, during the APEC summit in Beijing [13]. The relative impacts of emission regulations and meteorological properties on the mitigation of air pollution over Beijing during the APEC summit were also studied [14], as were the source apportionment of atmospheric ammonia before, during, and after the conference [15]. However, these previous studies have rarely considered the effects of control measures on the trace elements in fine particles, which was more associated with the human health. In addition, although the characteristics and sources of trace elements in PM2.5 have been studied at length [16,17,18], previous studies regarding the properties of trace elements had not been conducted under different emission scenarios, especially for the emission reduction scenario in the near future. The APEC summit provided a unique city-wide experiment to examine the response of various trace element sources to such comprehensive and intensive mitigation efforts.
In the present study, the pollution characteristics of metallic elements in PM2.5 before and after the 2014 APEC summit were analyzed by simultaneously measuring the mass concentrations of metallic elements in the urban and suburban areas of Beijing. An analysis of the enrichment factor (EF) and a positive matrix factorization (PMF) model were used to compare the sources of metal elements due to emissions reduction. The results of these analyses could be used to understand the effects of emission reduction measures on pollution levels and the pollution characteristics of metal elements and to provide suggestions for future air pollution regulations.

2. Materials and Methods

2.1. Sites and Sampling

The PM2.5 sampling was conducted simultaneously at the urban and suburban sites in Beijing, with two PM2.5 samplers (TH-150C, Tianhong, Wuhan) at an airflow rate of 100 L min−1 from 15 September to 12 November 2014. The urban site (JDM) was established in the Institute of Atmospheric Physics (IAP), Chinese Academy of Sciences (39.97° N, 116.38° E), which is located between the North Third Ring Road and Fourth Ring Road in Beijing. This site is approximately 1 km from the Third Ring Road, 200 m away from the north-south highway, and 50 m north of East-West Beitucheng West Road. The sampler was situated on the rooftop of a two-floor building, approximately 10 m above the ground. The suburban site (HR) was established on the campus of the University of Chinese Academy of Sciences (40.41° N, 116.68° E), approximately 55 km northeast of the urban site (JDM). This site is located at the foot of the Great Wall adjacent to Yanqi Lake. The sampler was placed on rooftop of a four- floor building approximately 15 m above the ground. Two PM2.5 samples were collected each day at both sites, one from 08:00 to 19:30 (daytime measurement) and one from 20:00 to 07:30 the next day (nighttime measurement). In total, 116 samples were acquired at each site. After sampling, all the filters were sealed and stored in a refrigerator (−20 °C) until subsequent analysis. An automatic meteorological observation instrument (Vaisala Company, Finland) was used to observe various meteorological factors at the same site, including the sea level pressure, ambient temperature, relative humidity, wind speed and wind direction.

2.2. Chemical Analysis

The quartz fiber filters packaged with aluminum foil were pre-fired in a Muffle furnace at 500 °C for 4 h to remove a small amount of organic matter. To reduce the influences of volatilization and water vapor during the weighing process, the filters were balanced within a chamber at constant temperature and constant humidity (temperature: 20 °C ± 1 °C; humidity: 40% ± 5%) for more than 48 h both before and after sampling. Then, these filters were weighed using a microelectronic balance with a reading precision of 10 μg. To guarantee the accuracy of the weights, the weighing was repeated until a difference of less than 0.10 mg between the two measured weights was achieved. The net increase in the quality of the filter from before sampling to after sampling was used to represent the quality of the particulate matter. The mass of the particles was divided by the volume of the sample to obtain the atmospheric PM2.5 masses.
In this study, microwave acid digestion was used to digest the filter samples into a liquid solution for elemental analysis. One-quarter of each filter sample was placed in the digestion vessel with a mixture of 6mL HNO3, 2mL H2O2, and 0.6mL HF and was then exposed to a three-stage microwave digestion procedure from a microwave-accelerated reaction system (MARS; CEM Corporation, USA). After that, the digestion solution was transferred to polyethylene terephthalate (PET) bottles and diluted to 50 mL with deionized water (with a conductivity: 18.2 MΩ/cm). Inductively coupled plasma mass spectrometry (ICP-MS 7500a; Agilent Technologies, Japan subsidiary) was used to determine the concentrations of 15 trace elements in the digestion solution, including Mg, Al, K, Ca, V, Cr, Mn, Fe, Co, Cu, Zn, As, Ag, Cd and Pb. The concentrations of the trace elements were quantified using a multi-element external standard, and the external standard liquid was diluted into four concentration gradients with 5% HNO3. The correlation coefficient of the standard curve exceeded 0.9999. The internal standard elements solutions (45Sc, 72Ge, 103Rh, 115In, 159Tb, 175Lu and 209Bi) were simultaneously placed into the instrument with the samples during the analyses. Each sample was determined 3 times. The relative standard deviation (RSD) of the internal standard element was less than 3%, indicating that the instrument was stable. When the RSD was greater than 3%, the sample was analyzed again. The concentrations of the elements in PM2.5 were calculated by measuring the concentrations of the elements and the sampling volume. More detailed information, such as instrument optimization, calibration, and quality control, is given in [19].

2.3. Data Analysis

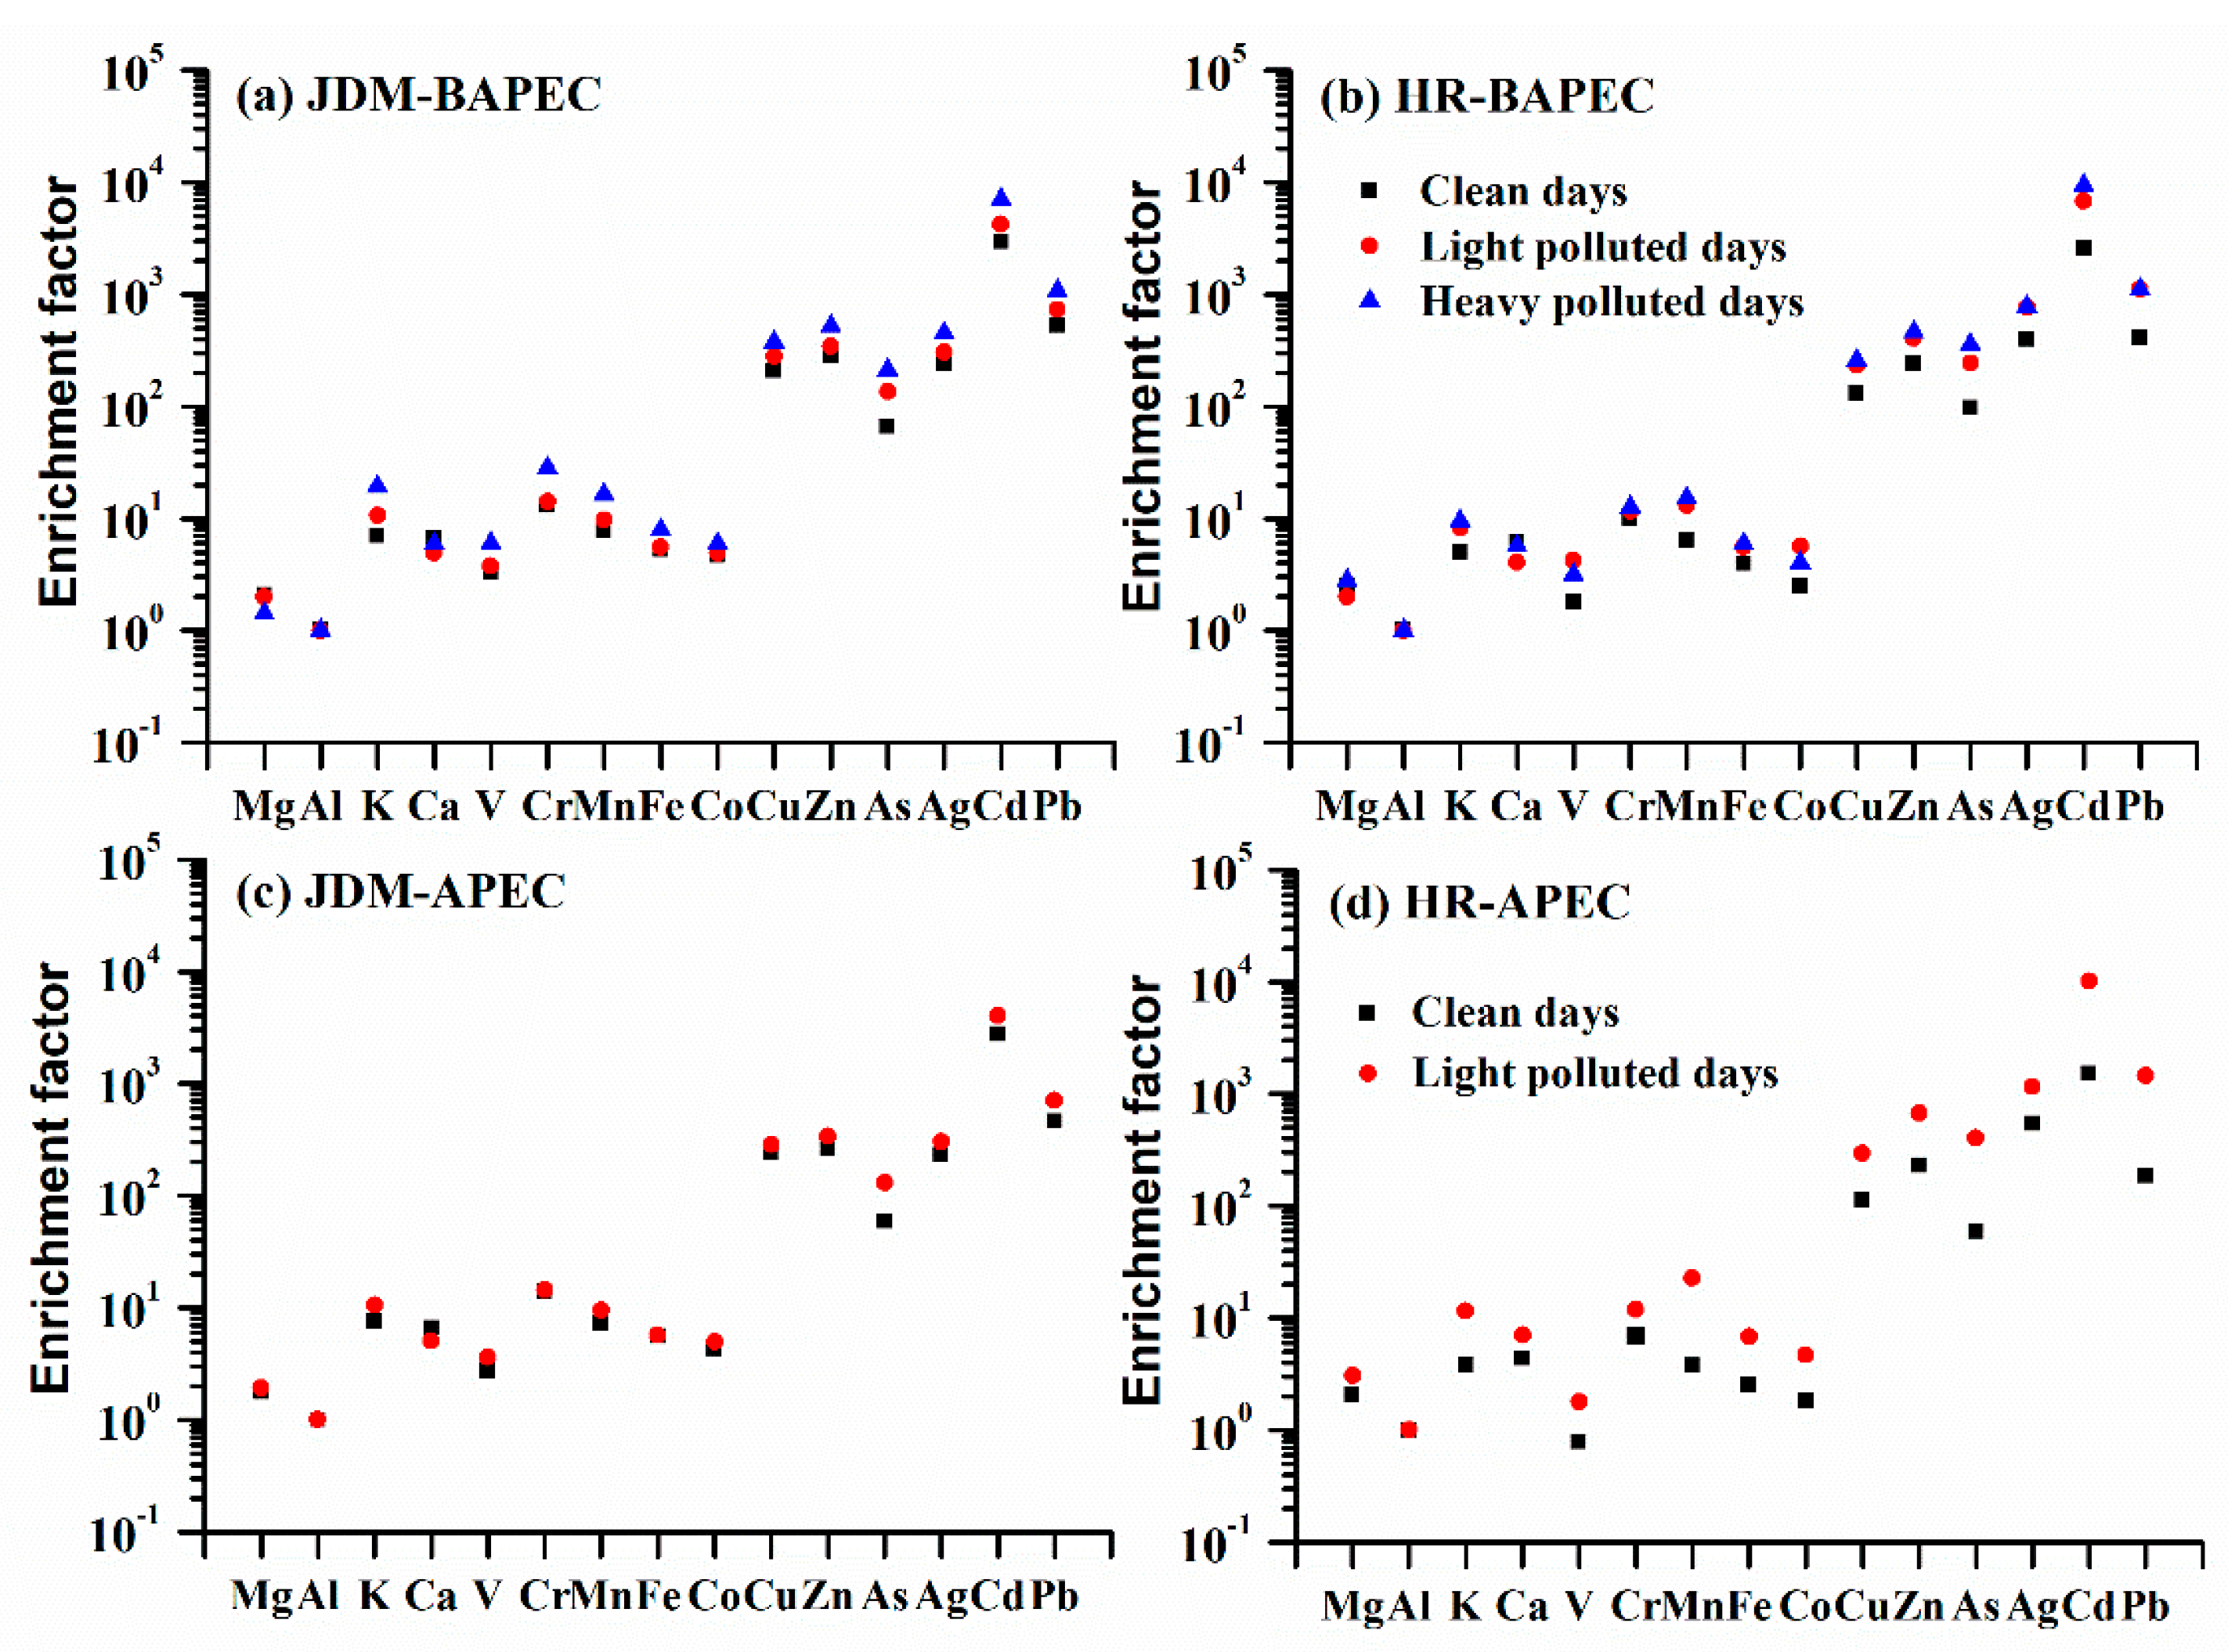
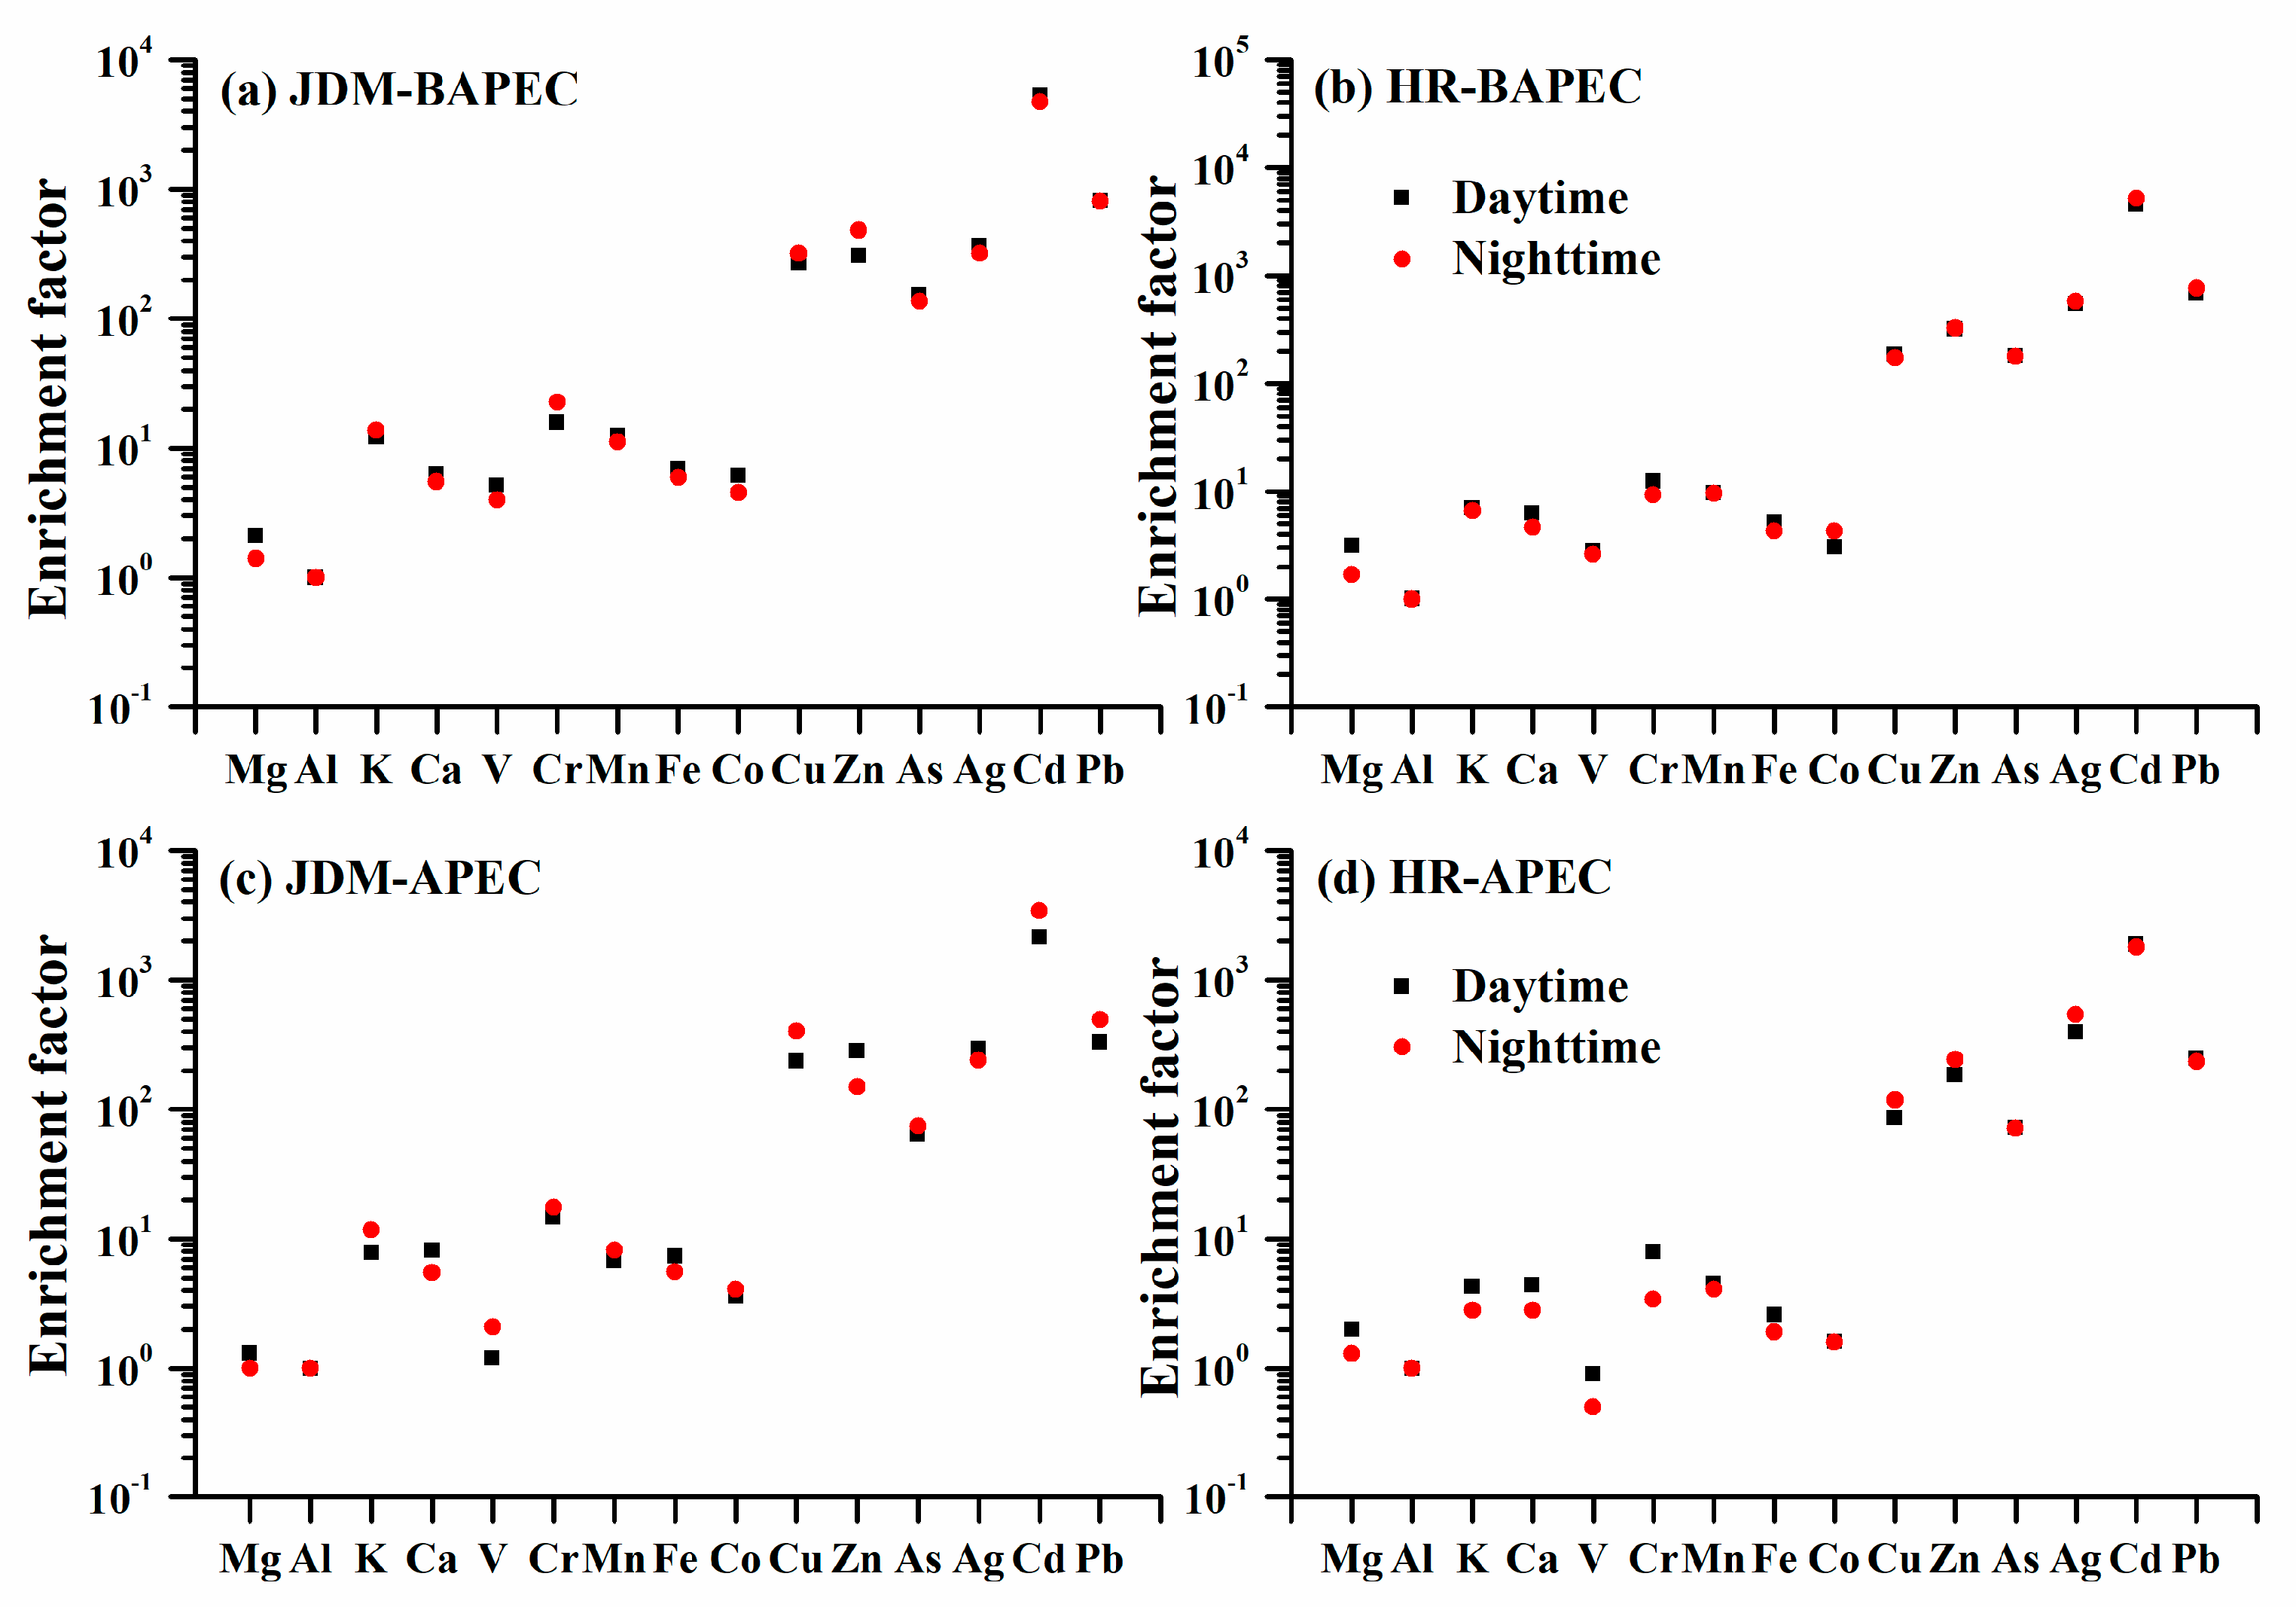
2.3.1. Enrichment Factor (EF)

The EF is often used to measure the enrichment of elements in atmospheric particulate matter and to determine and estimate the natural and anthropogenic sources of those metallic elements. The EF is calculated as follows:
E F = ( C α / C β ) a e r o s o l ( C α / C β ) c r u s t
where Cα is the mass concentration of the investigated element α, Cβ is the mass concentration of a comparable element β, (Cα/Cβ)aerosol is the ratio of comparable elements to reference elements in the aerosol, and (Cα/Cβ)crust is the ratio of research elements to comparable elements in the crust. Usually, the elements that are relatively more stable, more volatile, less anthropogenic and ubiquitous throughout the crust are selected as comparable elements (Al, Fe, Ti, Sc, and Si are commonly chosen). In this study, Al was chosen as the comparable element. In addition, the concentrations of the crustal elements were derived from a previous investigation [20]. When the EF is less than 10, the element is mainly derived from the crust, while EF values between 10 and 100 indicate that the element originated from both natural and anthropogenic sources. When the EF is greater than 100, the element mainly originated from anthropogenic sources [21].

2.3.2. Positive Matrix Factorization (PMF)

The PMF model, which is based on the factor analysis method, was first developed in 1993 by Paatero [22], after which it was quickly popularized and broadly applied. Compared with chemical mass balance (CMB) models, PMF models do not need to analyze information regarding the pollution source. In addition, it is not necessary to establish the pollution source composition spectrum; rather, the various factors can be obtained by using the standard deviation of the data [23]. The basic principle of this model is to assume that X is an n × m matrix, where n is the number of samples and m is the number of chemical components.
x i j = k = 1 p g i k f k j + e i j      ( i = 1 , 2 n ; j =   1 , 2 m ; k =   1 , 2 p )
The goal of the optimization is that the objective function Q will tend toward the value of the degrees of freedom.
Q ( E ) = i = 1 n j = 1 m ( e i j / u i j ) 2
where xij is the concentration of a substance j in the receptor on day i, gik is the contribution of a factor k to the receptor on day i, fkj is the fraction of the chemical composition of a substance j of the factor k, eij is the residual of the chemical composition of a substance j on day i, and uij is the uncertainty of X.
Missing data values were substituted with median concentrations. The uncertainty (Unc) is calculated according to the method recommended by the U.S. Environmental Protection Agency (EPA) PMF Fundamentals [24,25,26,27].
When the concentration of the chemical composition is lower than the method detection limit (MDL) of the instrument, the uncertainty is as follows:
U n c = 5 6 M D L
When the concentration of the chemical composition is higher than the MDL of the instrument, the uncertainty is as follows:
U n c = ( E r r o r F r a c t i o n + C o n c e n t r a t i o n ) 2 + ( M D L ) 2
In this study, we uses the multivariate EPA PMF 5.0 model to resolve the sources of metallic elements. The daily PM2.5 elemental composition datasets obtained at the two sites during the entire observation period (15 September to 12 November) were applied to PMF 5.0 to determine sources and their contributions to the total metallic element mass. The identification of the sources was based on certain chemical tracers that are generally presumed to be emitted by specific sources and are present in significant amounts in the samples collected. After testing the PMF results between 4 and 9 factors, the five factors solution was chosen by comparing PMF factor profiles with reference source profiles and tracers from previous studies. For the selected 5-factor case, the G-space plot pairings showed that the points were distributed across the solution space between the axes. Based on the Displacement (DISP) and Bootstrap-Displacement (BS-DISP) results, the FPEAK value set at 0.1 (JDM) and −0.1 (HR).

3. Results and Discussion

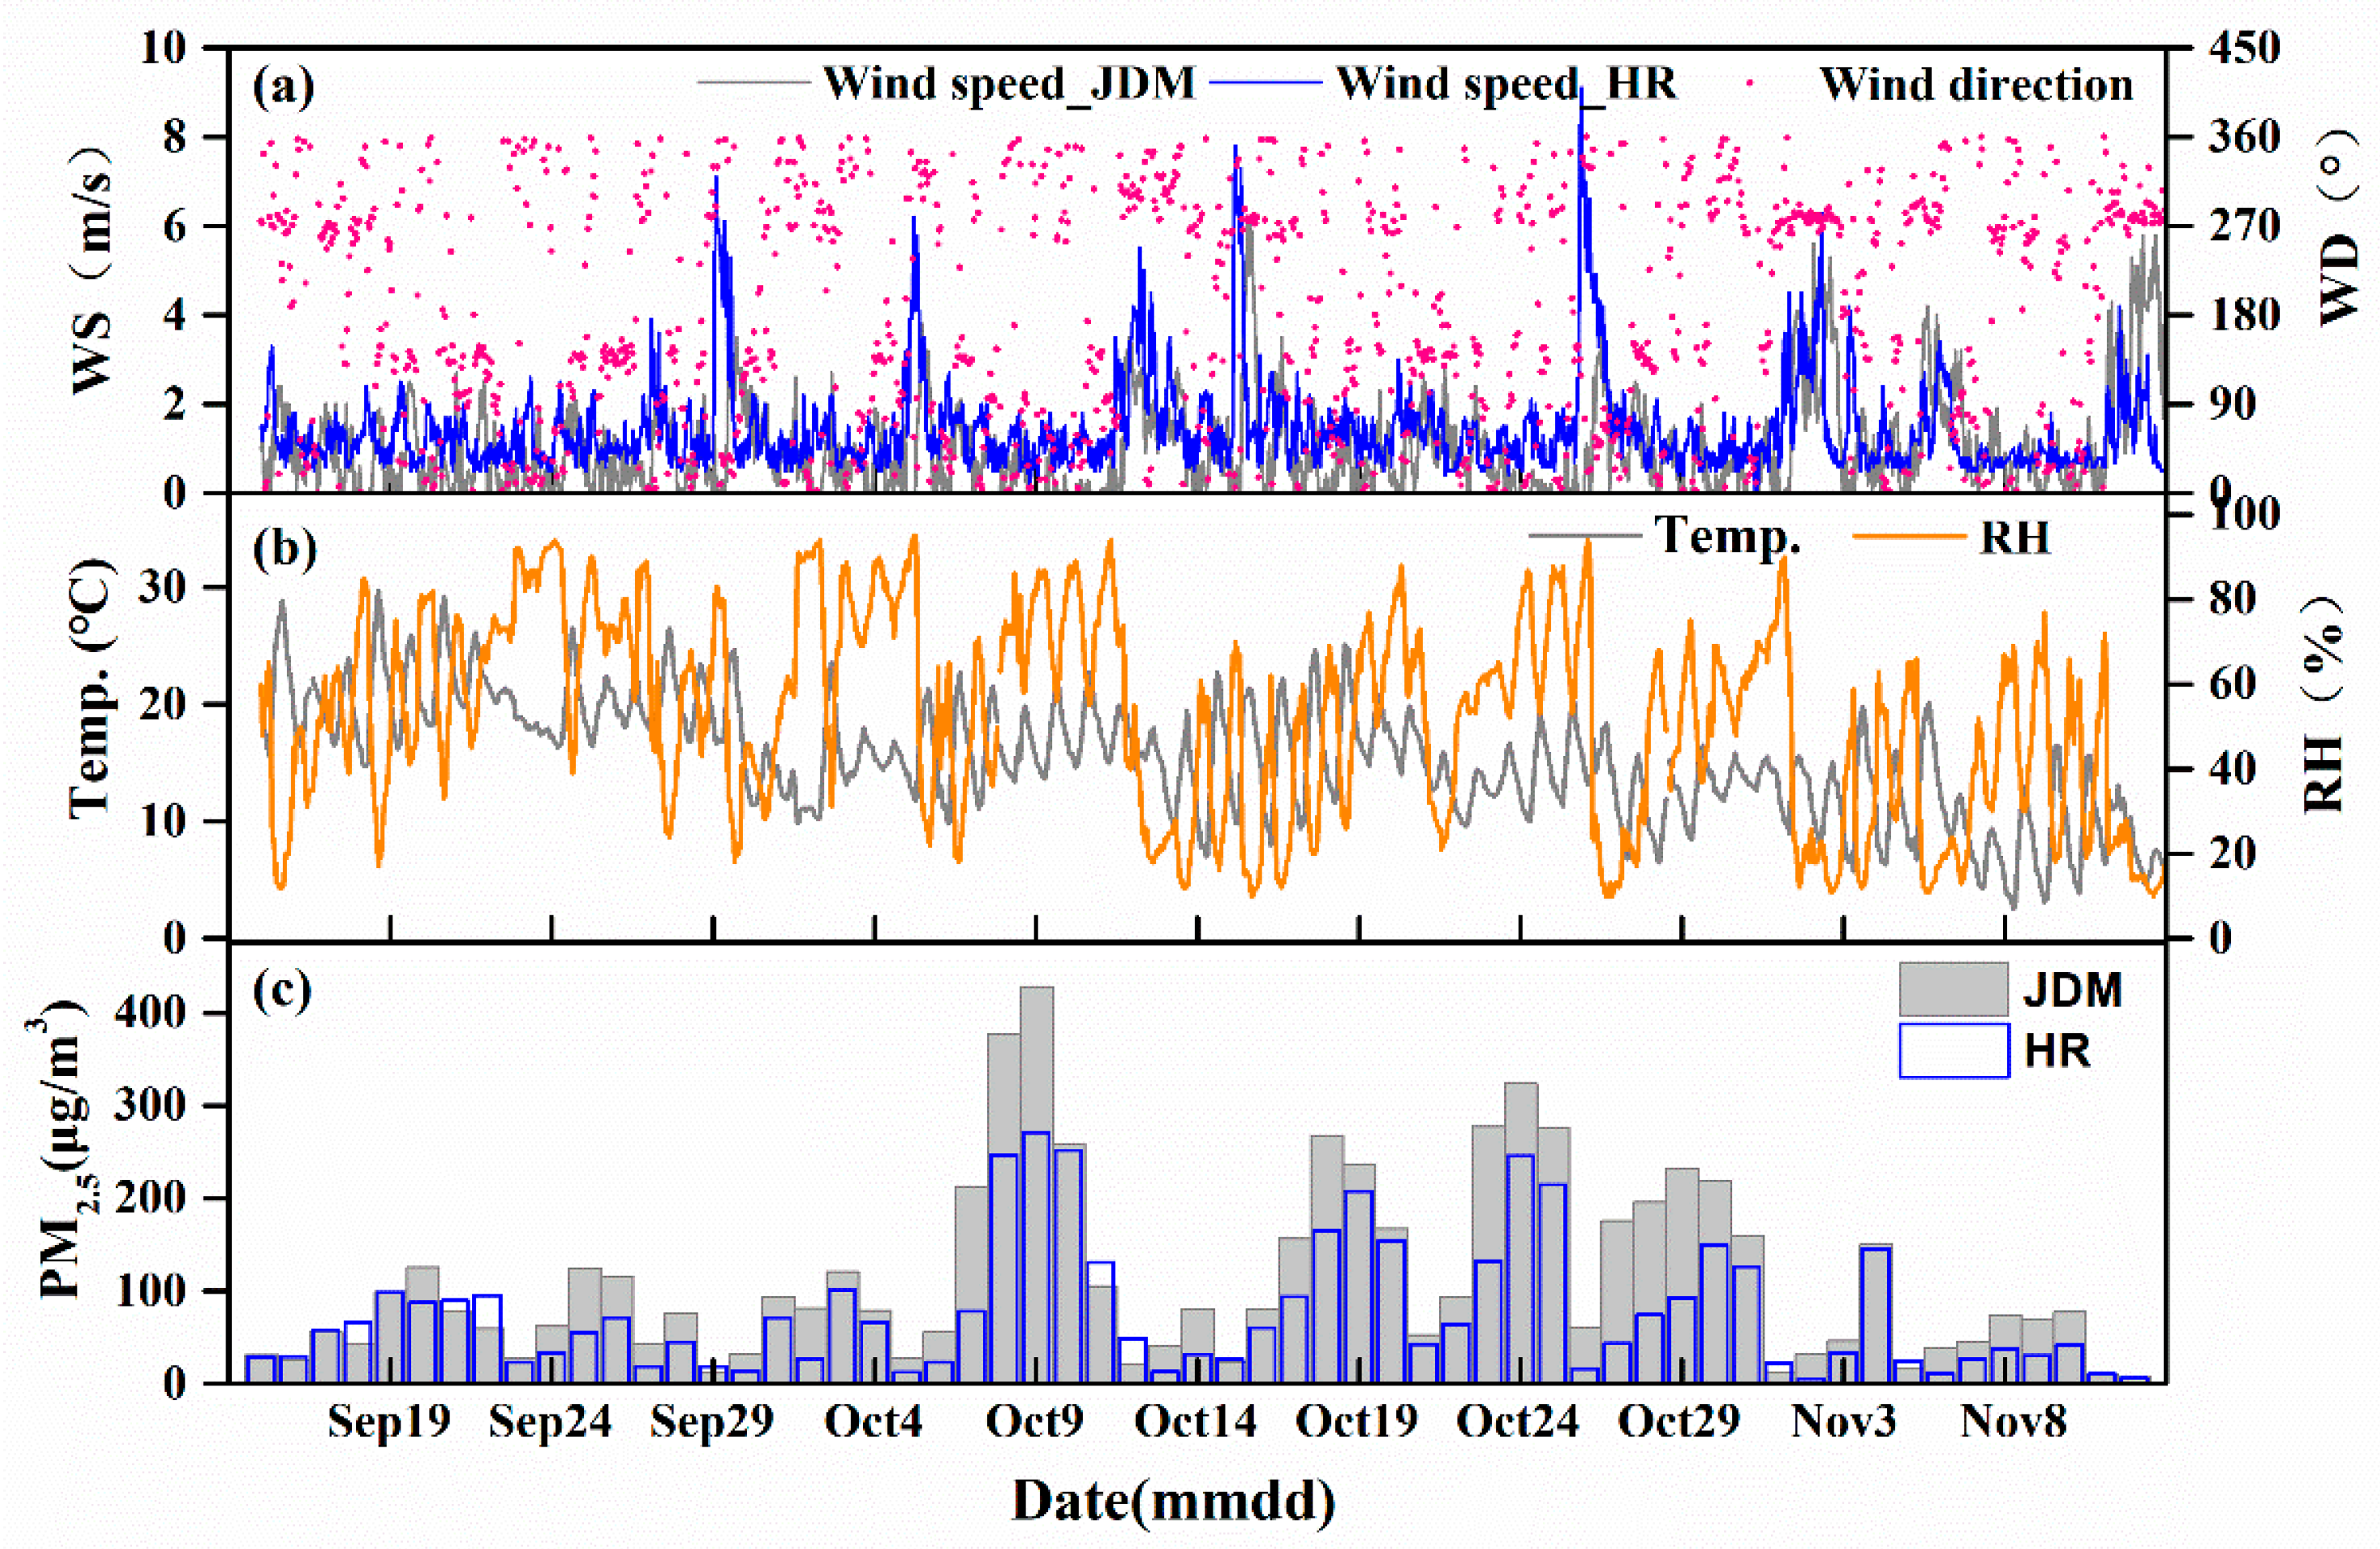
3.1. PM2.5 Mass Concentration and Meteorological Conditions

The meteorological conditions and PM2.5 mass concentrations obtained from the observation period are given in Figure 1. The average PM2.5 mass concentrations before the APEC summit (BAPEC period, from 15 September to 2 November) were 127.6 μg/m3 (JDM) and 87.7 μg/m3 (HR), both of which exceed the second level of the National Ambient Air Quality Standard (75 μg/m3). The numbers of days with average mass concentrations that surpassed the standard level of 75 μg/m3 were 30 and 20 days at JDM and HR, respectively, accounting for 63.8% and 42.6% of the total number of sampling days. If the mass concentration of PM2.5 exceeds 75 for two consecutive days, it is classified as a pollution event in this study. During the BAPEC period, 7 (JDM) and 5 (HR) pollution events were observed. Prior to each pollution event, southerly wind flows with short durations were usually observed. In addition, stagnant weather is usually accompanied by faint southern and southeastern winds [28], which would benefit the transportation of atmospheric pollutants to Beijing from its adjacent southern areas where the intensive industrial zone were located. As showed in Figure 1, a 6-day pollution event was observed from 6 October to 11 October at the urban and suburban sites. At the urban site (JDM), a continuous southerly wind with a mean wind speed of 1.4 m/s was observed from 12:00 to 24:00 on October 6th. Then, the wind speed largely decreased, and the average wind speed decreased to 0.3 m/s in the following 4 days. In addition, the average relative humidity increased to 71.2%. These conditions were not conducive to the dispersal of pollutants; thus, the PM2.5 concentration reached a maximum of 428 μg/m3 on 9 October. On the afternoon of 11 October, a northerly wind with an average wind speed of 2.2 m/s was observed, following which the pollution gradually dissipated. During the same pollution event, the average PM2.5 mass concentration at the suburban area (HR) was 195.8 μg/m3 with a maximum value of 271.3 μg/m3, much lower than that at the urban area (JDM). Apart from the lower anthropogenic emissions in the suburban site, the higher average wind speed (1.1 m/s) at HR suggest a better diffusion condition and leading to the lower PM2.5.
As shown in Table 1, the average PM2.5 mass concentrations at sites JDM and HR during the APEC summit were 48.4 μg/m3 and 33.1 μg/m3, respectively, both of which were significantly lower than those during the BAPEC period (p < 0.05). The numbers of days with pollution levels that exceeded 75 μg/m3 were only 2 and 1 at JDM and HR, respectively, accounting for 16.7% and 8.3% of the total number of sampling days. In addition, no heavy pollution days were observed at either site. Compared with the BAPEC period, the wind speeds increased and the relative humidity decreased during the APEC summit in the urban site, which suggested the meteorological conditions were conducive to the dispersal of pollutants, and the favorable meteorological conditions also played an important role in maintaining good air quality during the APEC summit. However, it should be noted that the wind speeds was comparable during BAPEC and APEC periods in the suburban site, which may suggest a similar meteorological conditions and the control measures would be more important that contributed to the good air quality.

3.2. Concentrations of Metallic Elements

Table 2 presents the average mass concentrations of metallic elements in PM2.5 in each site during the BAPEC and APEC periods. In both the urban and suburban sites, the concentrations of K, Fe, Ca, Al and Mg were the highest among the metallic elements examined herein. These 5 elements are all naturally occurring within the crust, and their total concentration accounted for more than 85% of the total concentration of all of the measured metallic elements. The concentration of Cd was less than 5 ng/m3, which is the reference concentration limit provided by the standard GB3095-2012 and the World Health Organization (WHO). The concentration of As during the BAPEC period exceeded the reference limit (6 ng/m3) provided by the GB3095-2012 and WHO standards, while that during APEC was less than 6 ng/m3. The concentration of Pb was less than the seasonal concentration limit (1100 ng/m3) specified by GB3095-2012 and was also less than the mean annual concentration limit (500 ng/m3). The concentrations of crustal elements in Beijing decreased after 2010 relative to those prior to 2010; the concentrations of Mg, Al and Ca decreased by approximately 30% while those of K, Fe and Mn decreased by approximately 60% (Table S1). Likely as a result of the growth in car ownership throughout Beijing in recent years, the Cu concentration rose by 67.1%, especially since a large quantity of Cu is produced during car manufacturing and braking. The concentration of Pb decreased by 34.4% due to the increased usage of unleaded gasoline during recent years; interestingly, the Pb concentration decreased in spite of the aforementioned increase in car ownership. The concentrations of V, As, Cd and Cr, which are related to industrial sources and coal-fired fuel sources, decreased by more than 70%. These decreases may have been related to the relocation of the Capital Steel Corporation Limited in 2010.
During the BAPEC period, the majority of the observed metallic elements were significantly higher (p < 0.05) in the urban site than in the suburban site, except for the Mg and Ag (Table 2). The same phenomenon was also observed during APEC, however, the difference in concentration of Al, Mn, Cd and Pb were insignificant. In addition, another two more element (As and Zn) showed higher concentrations at the suburban site during APEC. The concentration of each element was greater during the BAPEC period than during the APEC, and the metallic element concentrations were greater at JDM than at HR, regardless of the date. The total concentrations of metallic elements during the BAPEC period were 5028.1 ng/m3 and 2851 ng/m3 at JDM and HR, respectively, which were approximately 1.4 times the total site concentrations during the APEC. Compared with the BAPEC period, all the metallic elements in PM2.5 decreased, and a significant reduction (p < 0.05) was observed for Mg, K, V, Co, Zn, As, Ag, Cd and Pb at the urban site. For the suburban site, although higher reductions of Ca, Cr, Fe, Co, Cu, Cd and Pb were observed compared with the urban site, the other elements showed insignificant reduction, especially for the Ag and Cu, which may suggested the different effects of control measures present in the urban and suburban areas in Beijing.

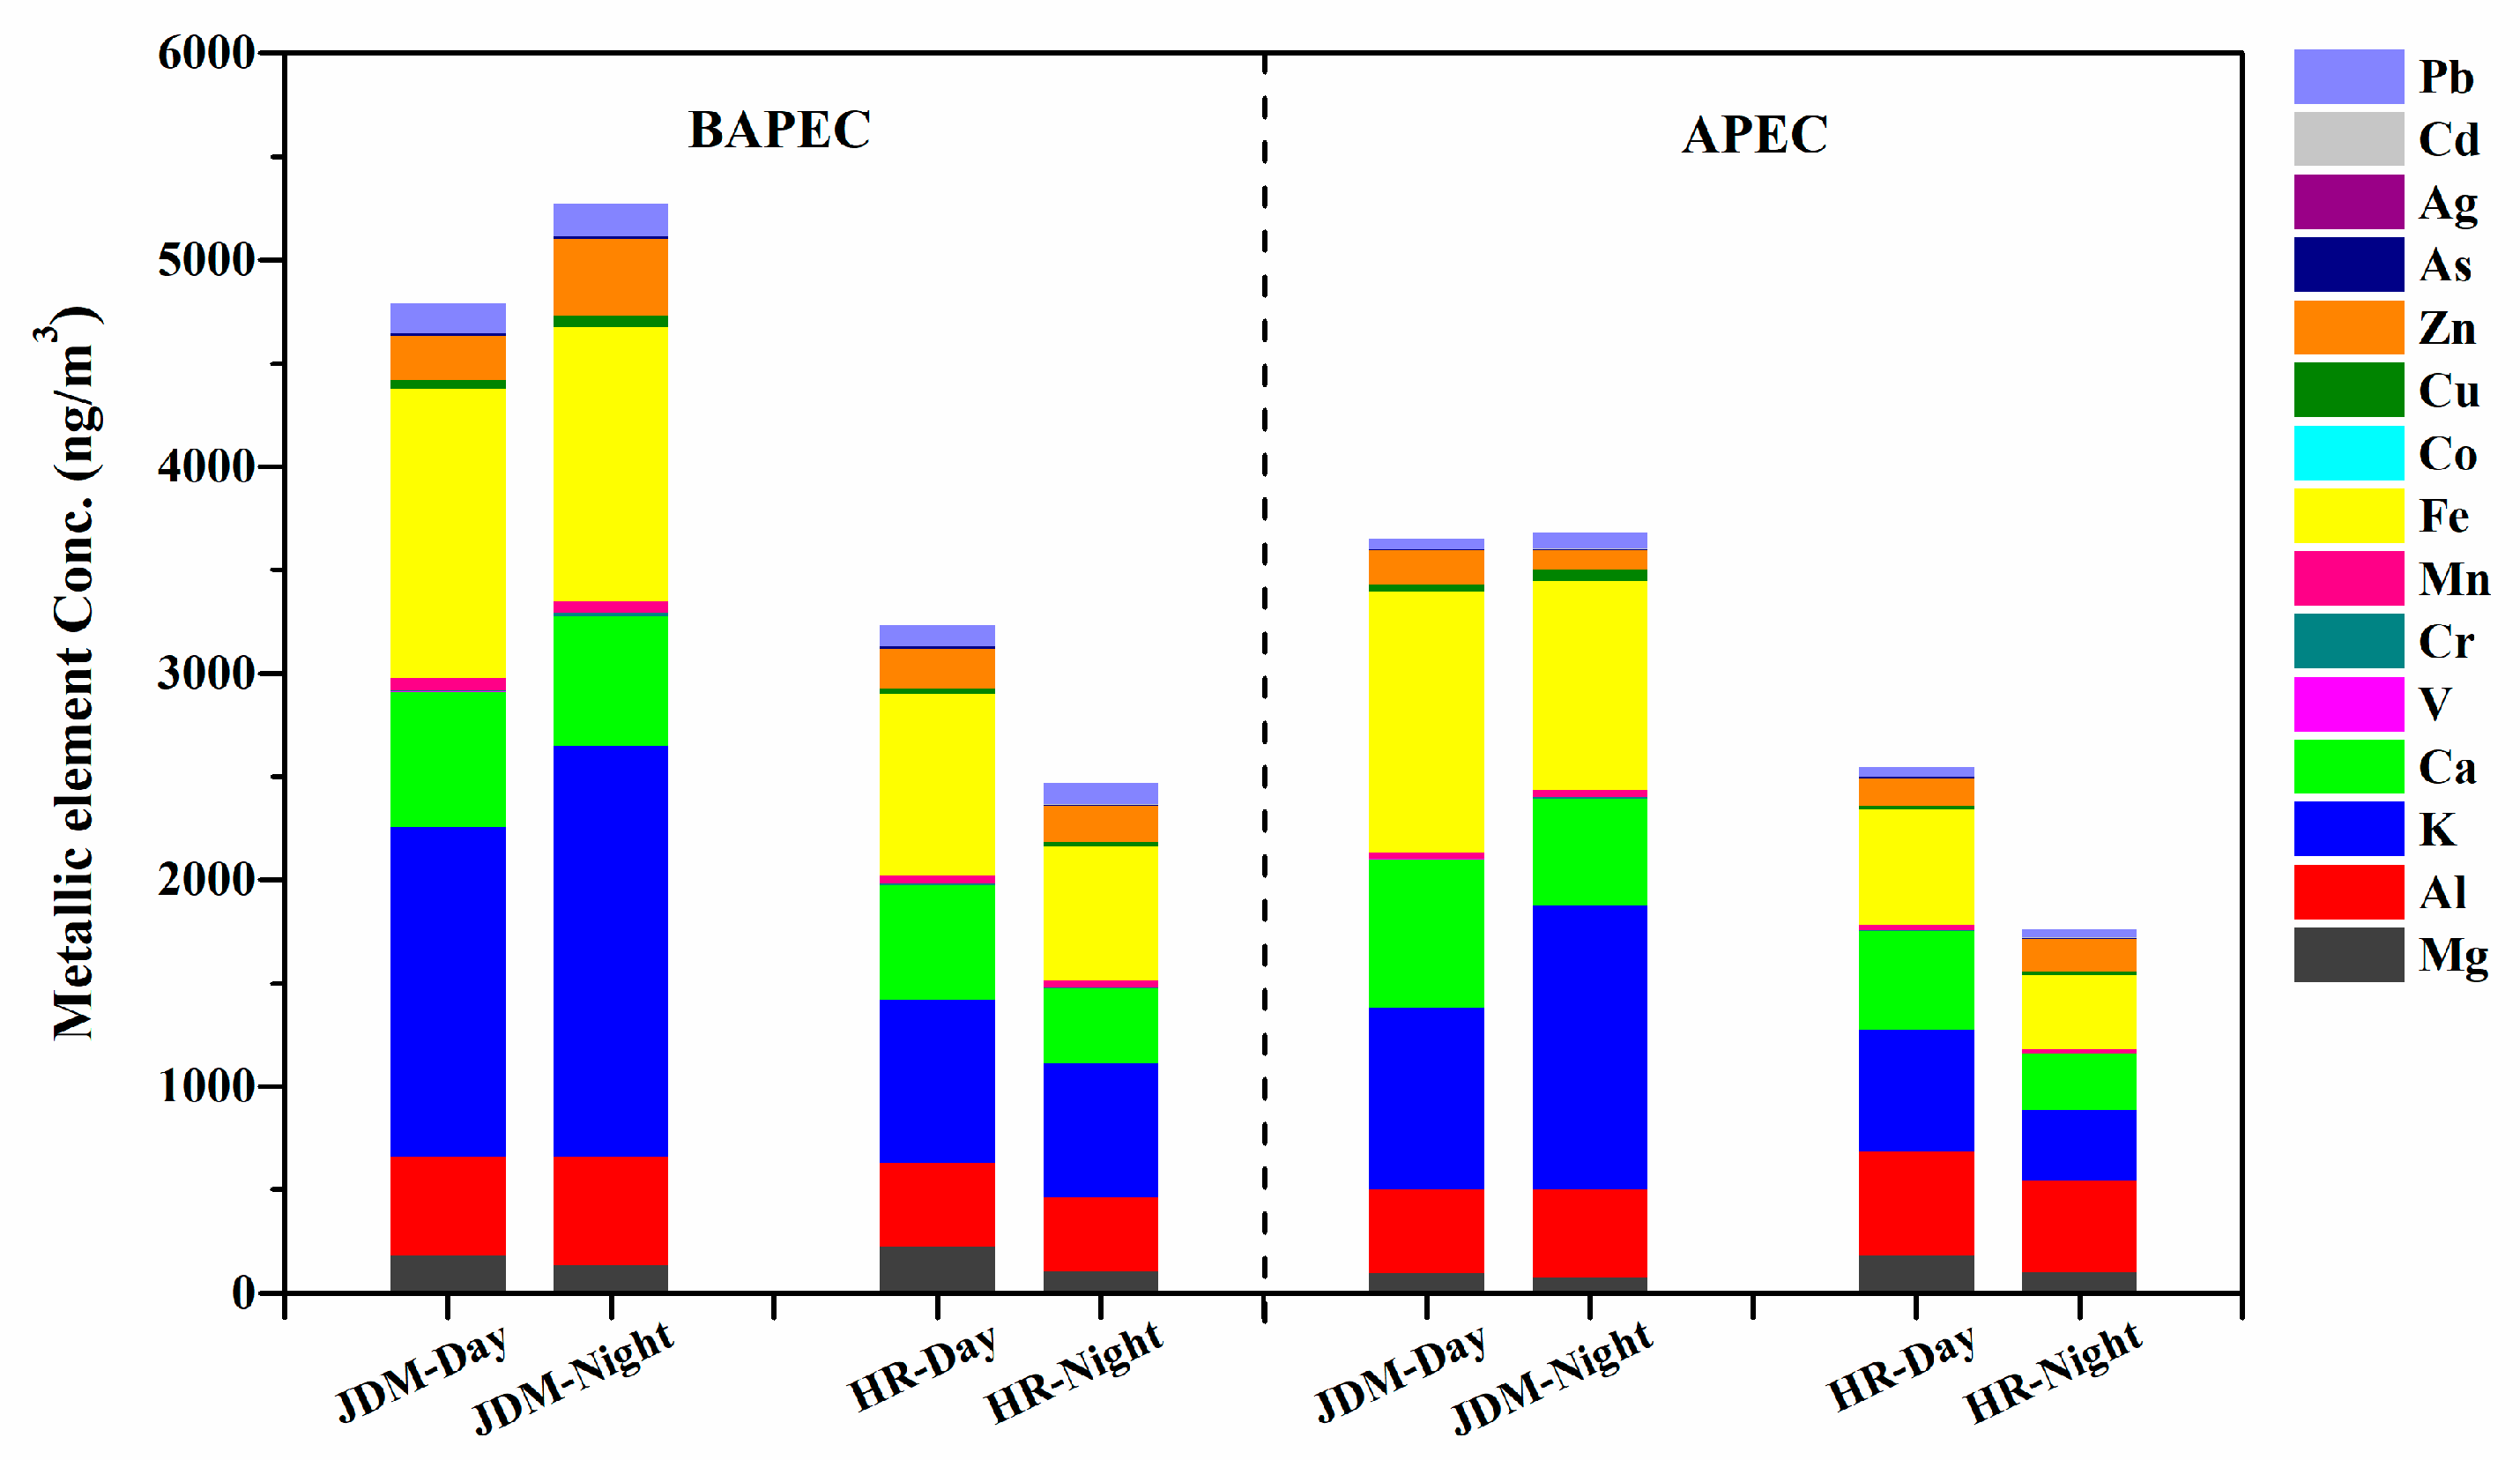
3.3. Day/Night Variations in Metallic Elements

Figure 2 and Figure 3 display the daytime and nighttime concentrations and EFs, respectively, of metallic elements during the BAPEC period and during the APEC. Compared with that during the daytime, the total concentration of metallic elements at night increased at JDM and declined at HR, regardless of the date. During the BAPEC period at JDM, the concentration of each crustal element (except K) decreased at night; the concentration and EF of K respectively increased by 24.7% and from 12.1 in the daytime to 13.7 at night, which suggests that K could be influenced by human activities like biomass burning that usually conducted in the south area of Beijing after the autumn harvest. The concentrations and EFs of the crustal elements at HR were generally reduced at night; their EFs were all less than 10, suggesting that the crustal elements at HR were not affected by anthropogenic factors. During the APEC, the variations in the crustal element concentrations at the two sites were similar to those during the BAPEC period.
During the BAPEC period, the total concentration of trace metal elements increased from 422.0 ng/m3 during the daytime to 608.9 ng/m3, during the nighttime at JDM, representing an increase of 44.3%. The concentrations of Cr, Cu, Zn and Pb increased by 58.6%, 32%, 72.4% and 10%, respectively. Moreover, the EFs of Cu and Zn rose from 266.3 and 306.4 (daytime) to 320.1 and 481.0 (nighttime), respectively. The EFs of Cu and Zn increased significantly at night. The daytime and nighttime concentrations of metallic elements within the PM2.5 pollution at JDM during the BAPEC period were significantly different. This shows that the Cr, Cu, Zn and Pb detected at JDM were heavily affected by anthropogenic factors during the nighttime. A previous study found that the nighttime concentrations of organic carbon (OC) and elemental carbon (EC) were higher than those during the daytime, which was primarily due to lower temperatures and increased carbon emissions at night [29]. In this study, the concentrations of Cu, Zn and Pb increased significantly at night, reflecting enhanced levels of traffic activity. Moreover, the atmospheric boundary layer was generally lower and the wind speed was reduced (from 1.0 m/s to 0.6 m/s) at night, which could have worsened diffusion conditions and increased the concentrations of metallic elements. During the APEC summit, the total concentration of trace metal elements at JDM at night was 242 ng/m3, which was 6.9% lower than that during the daytime; the variation in the concentration and EFs of each element was not obvious, however, as their differences were minor. This suggests that the regional emission control measures played a dominant role in driving these diurnal variations in urban area in Beijing.
In contrast, the concentrations of the trace metal elements at night decreased during the BAPEC period at HR. The concentrations of V, Cr, Cu, Zn and As decreased by 10.3–34.8% during the nighttime, indicating that biomass burning, motor vehicle activity and coal burning decreased during the nighttime at HR. In addition, increased wind speeds at night would have accelerated the diffusion of pollution, thereby reducing the impact of human factors on the pollution at HR at night. Interestingly, the concentrations of Cu, Zn and Ag increased at night by 20.5%, 16% and 21.5%, respectively, during the APEC at HR, and the EFs of Cu and Zn also increased slightly. This indicates that the effects of anthropogenic factors on Cu and Zn were enhanced at night during the APEC summit in contrast to the diurnal trends during the BAPEC period. Therefore, the control measures during daytime are more effective than those at the night in the suburban area of Beijing during the APEC summit.

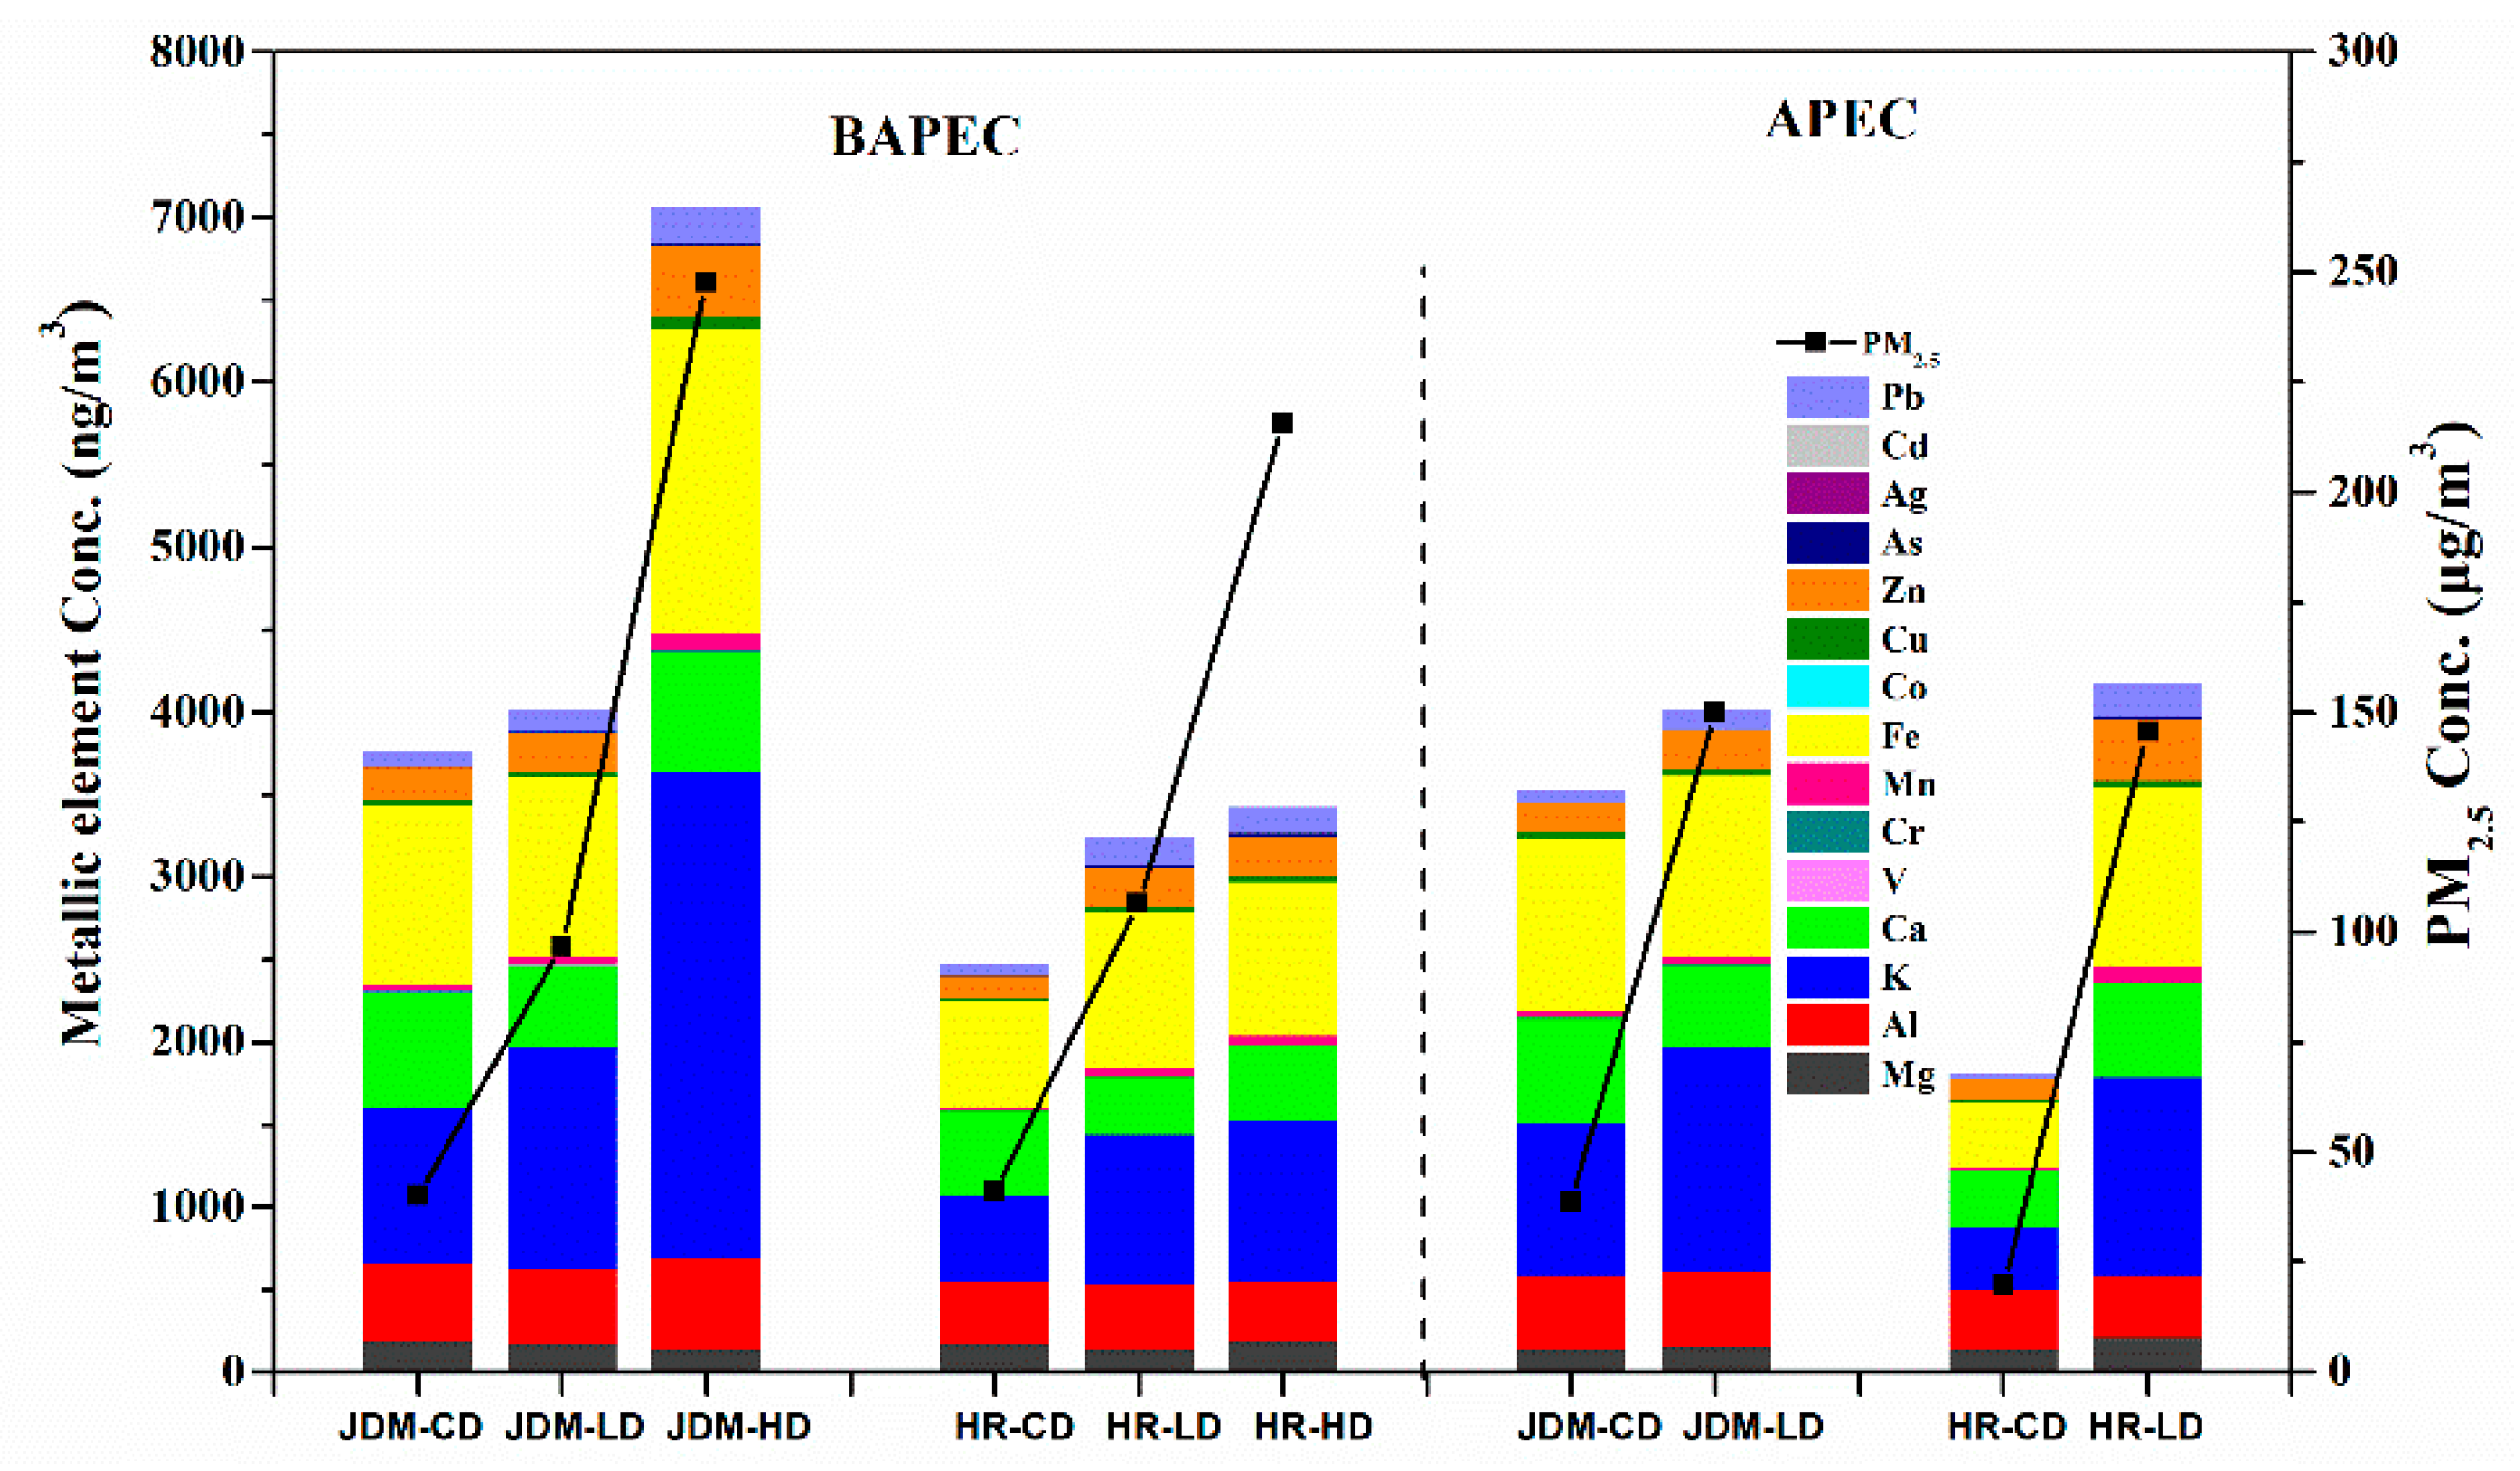
3.4. Characteristics of Metallic Elements under Different Pollution Levels

The air quality was classified into three categories based on the second level of the National Ambient Air Quality Standard (GB3095-2012): when the concentration was less than 75 μg/m3, the air quality was classified as clean days (C); when the mass concentration was between 75 and 150 μg/m3, the air quality was classified as light polluted days (L); and when the concentration exceeded 150 μg/m3, the air quality was classified as heavy polluted days (H).
The concentrations and EFs of the metallic elements in different pollution levels both during the BAPEC period and during the APEC summit are shown in Figure 4 and Figure 5, respectively. Generally, the total concentration of metallic elements increased with an increase in the pollution at either site. The proportion of each metallic element in PM2.5 decreased, indicating that the main source of the increase in PM2.5 was not the growth of metallic elements, which is consistent with the findings of a previous study [30]. The concentration of the majority metallic elements was increased with relatively aggravated pollution levels during the BAPEC in the urban site, and the significant increase (p < 0.05) was observed for K, Cr, Mn, Fe, Co, Cu, Zn, As, Ag, Cd and Pb when pollution level changed from clean days to heavily polluted days and there no significant difference for all the 15 elements when pollution level changed from clean days to lightly polluted days. Interestingly, the concentrations of Mg, Al and Ca varied insignificantly and irregularly during the BAPEC period, coincident with relatively aggravated pollution levels. Similar variation of the metallic elements under different pollution levels was also observed in the suburban site. The majority of trace metal elements were significantly increased when the pollution level changed from clean days to heavily polluted days, while the crustal elements like Mg, Al and Ca showed an inconspicuous increase. Meanwhile, the EFs of the majority metallic elements was increased with relatively aggravated pollution levels, except for the Co and Ag in the suburban site. For example, the EF of K was less than 10 on clear days and higher than 10 on pollution days, indicating that K is more affected by human factors on pollution days. The concentration of As on severely polluted days was 3.6 times higher than that on clear days and 1.9 times higher than that on light pollution days. The concentrations, EFs and proportions of V, Co, Ag and Pb to the total metallic elements all exhibited their maximum values on light pollution days at HR. The concentrations of other trace metal elements, such as As and Cd, increased sharply with an increase in the pollution severity; their concentrations were 3.5 times higher on heavy pollution days than on clear days.
During APEC, there were only two and one lightly polluted days at the urban and suburban sites respect tively, and no heavily polluted day at either site was observed. The total metallic element concentration on pollution days was 2.3 times higher than that on clear days at HR and 1.1 times higher at JDM. With the exception of Ca, the crustal elements at JDM exhibited magnitudes of increase; for example, the concentration of K rose from 925.4 ng/m3 to 1344.9 ng/m3. The concentrations of the crustal elements Mg, Al and Ca on lightly polluted days were 1~1.7 times those on clear days at HR. The elements K, Mn and Fe showed broader ranges of increases ranging from 2.8 to 6.3 times greater concentrations on pollution days. Among them, the EF of Mn increased from 3.8 to 22.7, indicating that anthropogenic emissions of Mn was largely enhanced on pollution days. With an increase in the pollution, the concentrations and EFs of trace metal elements at the two sites increased, and the range in the increased concentrations at HR was broader than that at JDM. The concentrations of As, Cd and Pb on lightly polluted days were 1.5~2.3 and 6.9~8 times higher than those on clear days at JDM and HR, respectively. Furthermore, the EFs of Mn, Fe, Cu, Zn, As, Cd and Pb on polluted days were 1.3~2.2 and 2.7~7.8 times higher than those on clear days at JDM and HR, respectively. These results indicates that traffic exhaust, industrial sources and coal combustion may be the main sources of trace metal elements, which is consistent with the findings of previous research [31]. Therefore, trace metal elements are more easily enriched on pollution days.

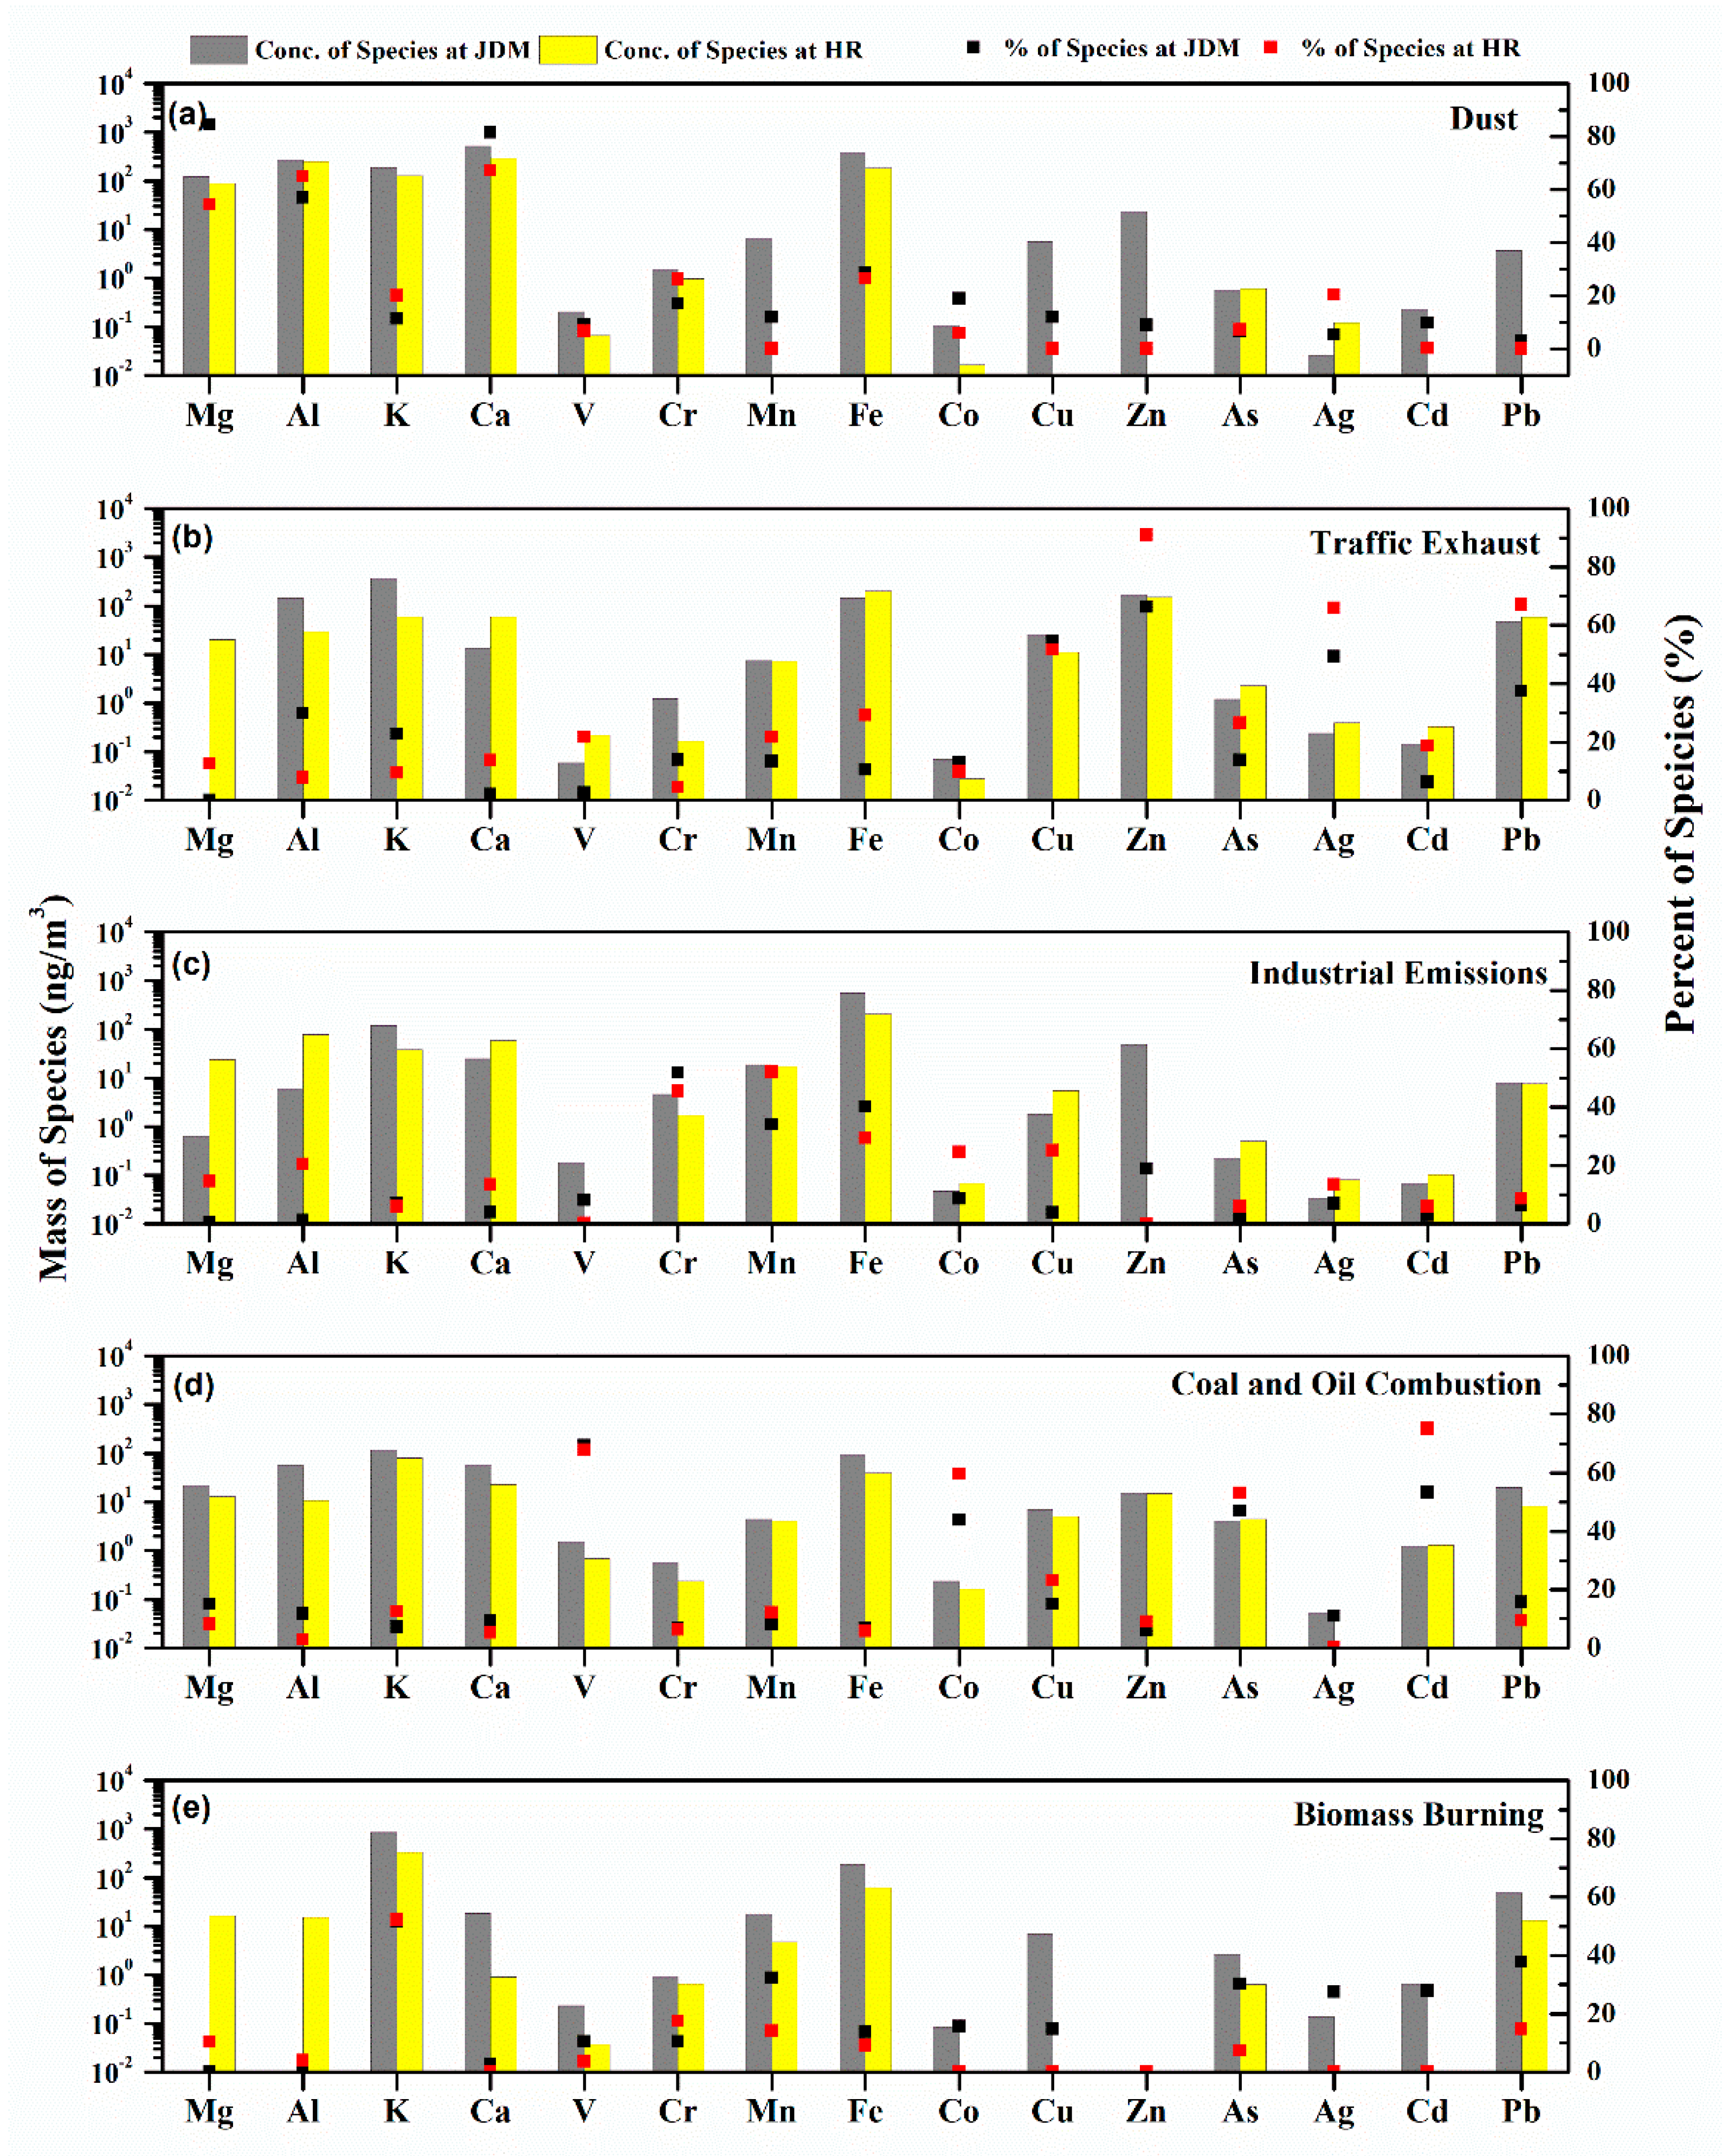
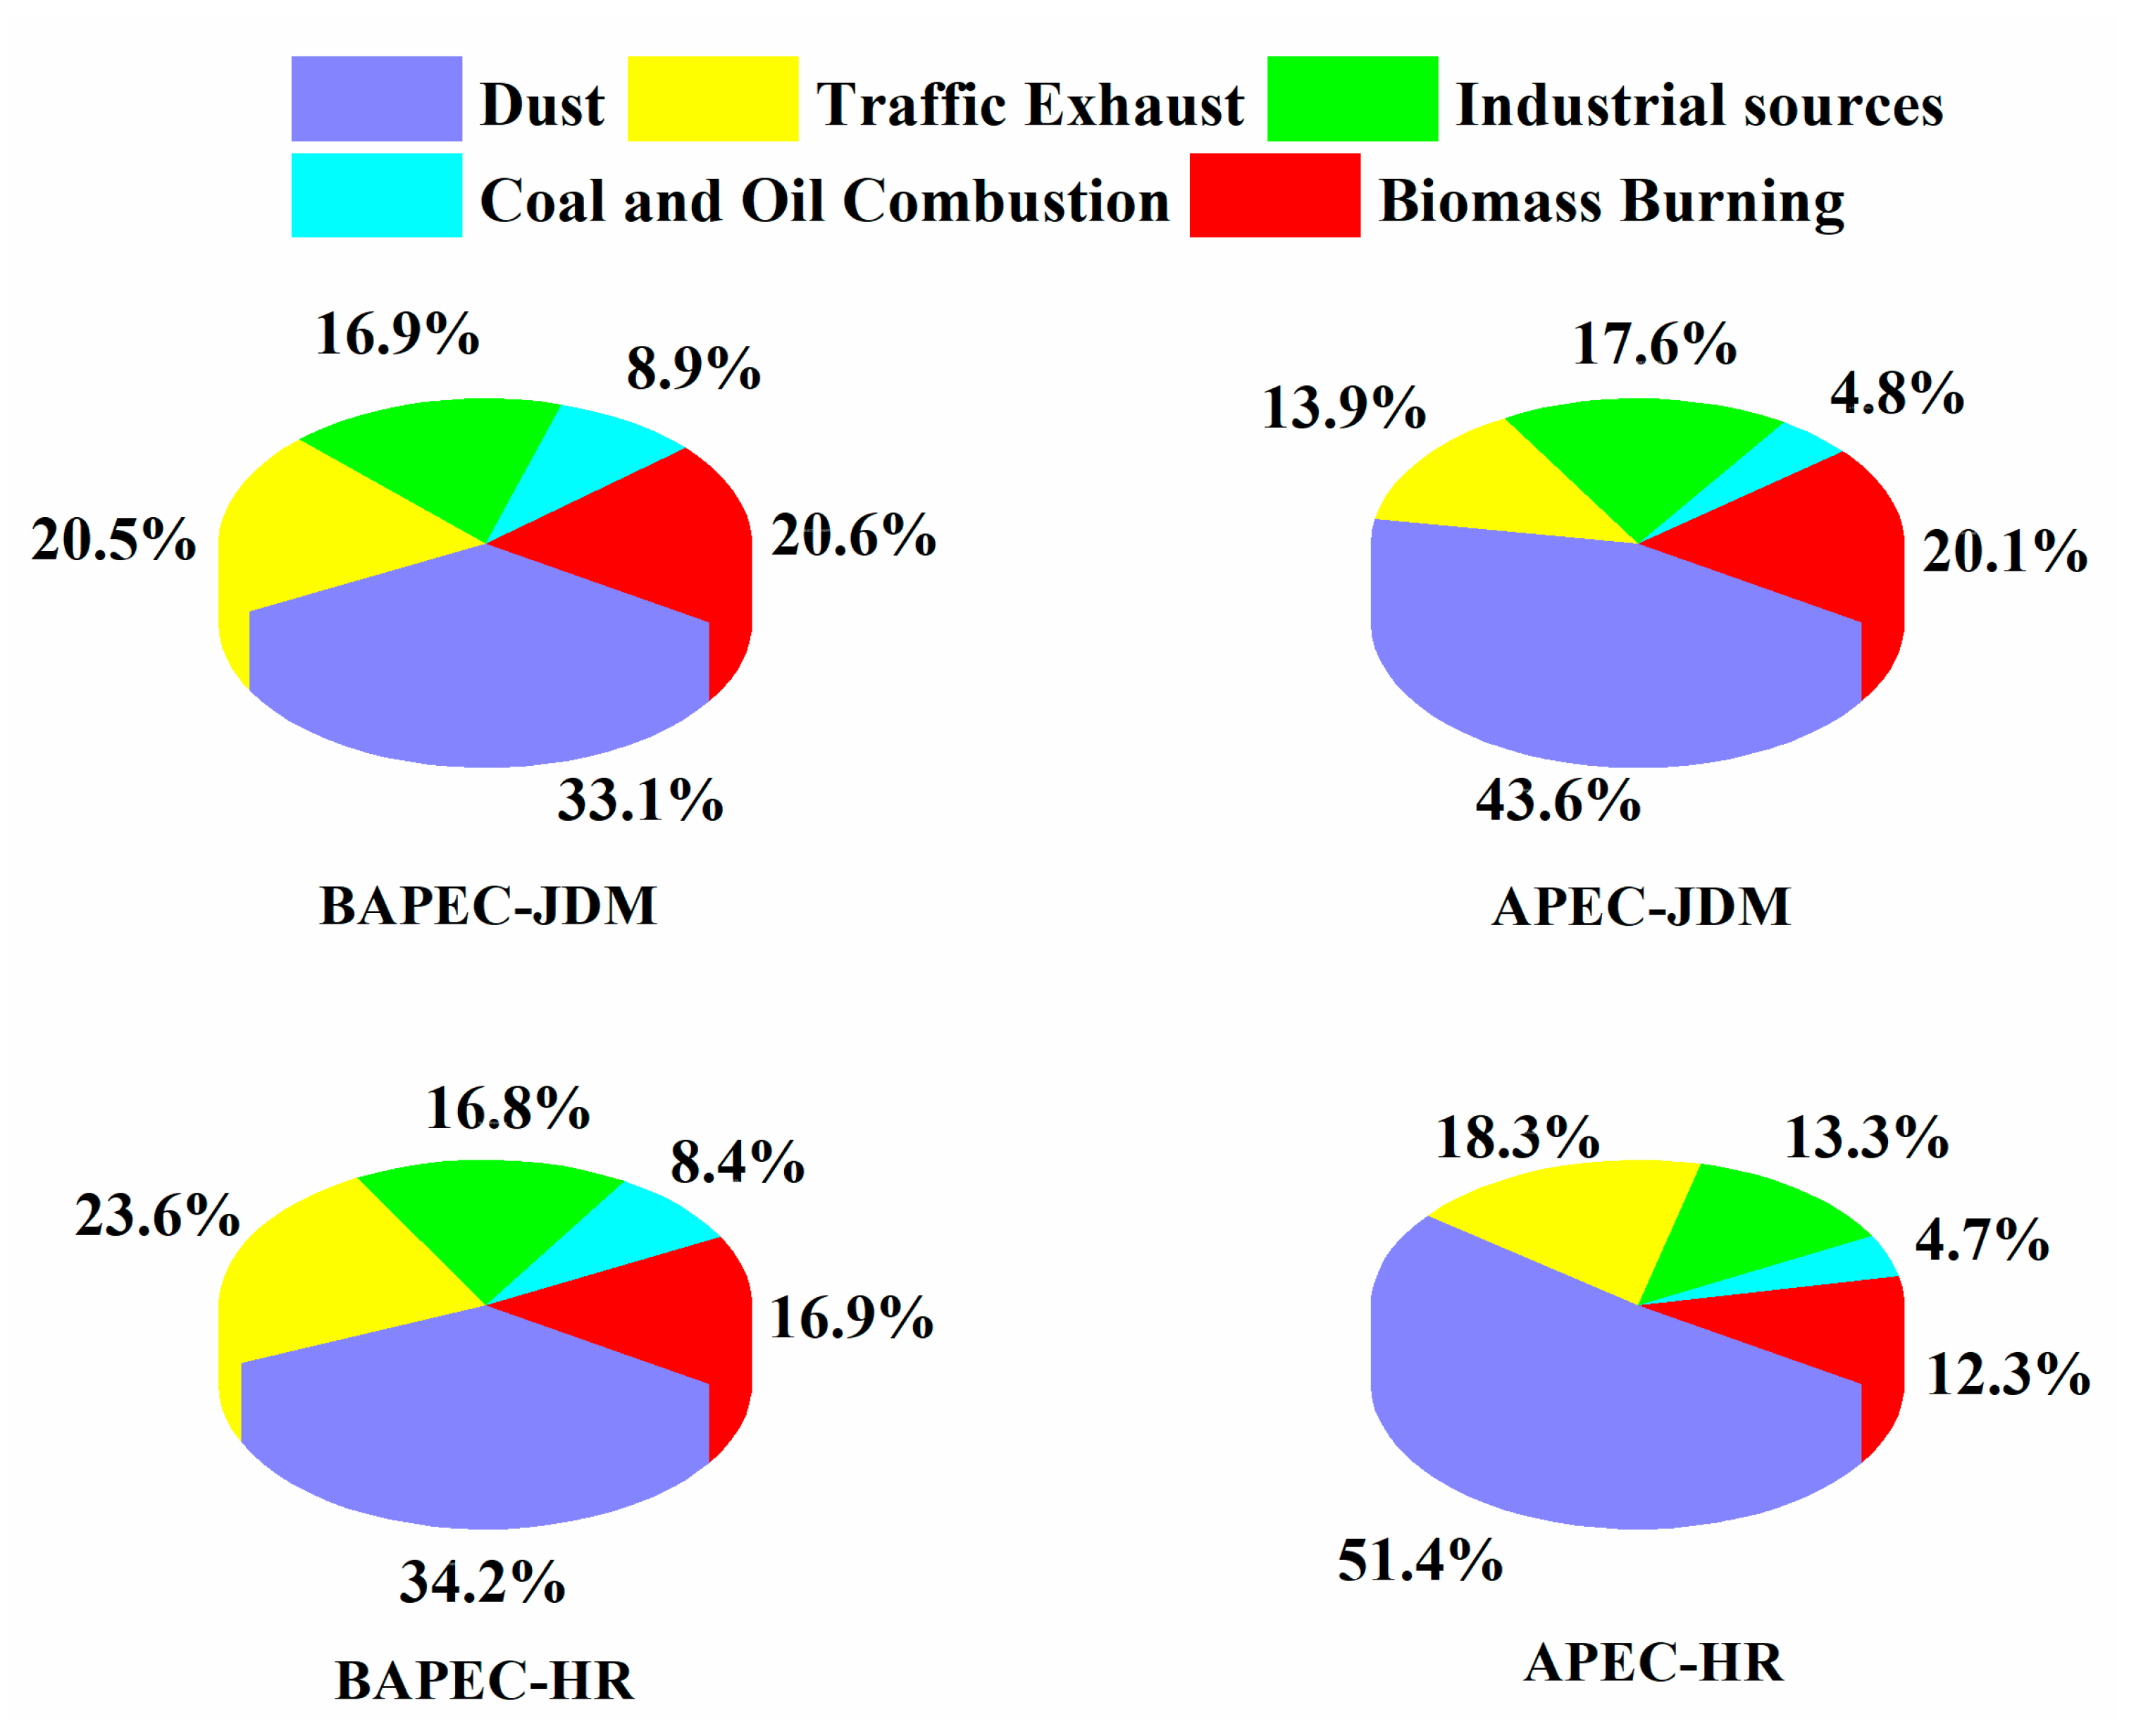
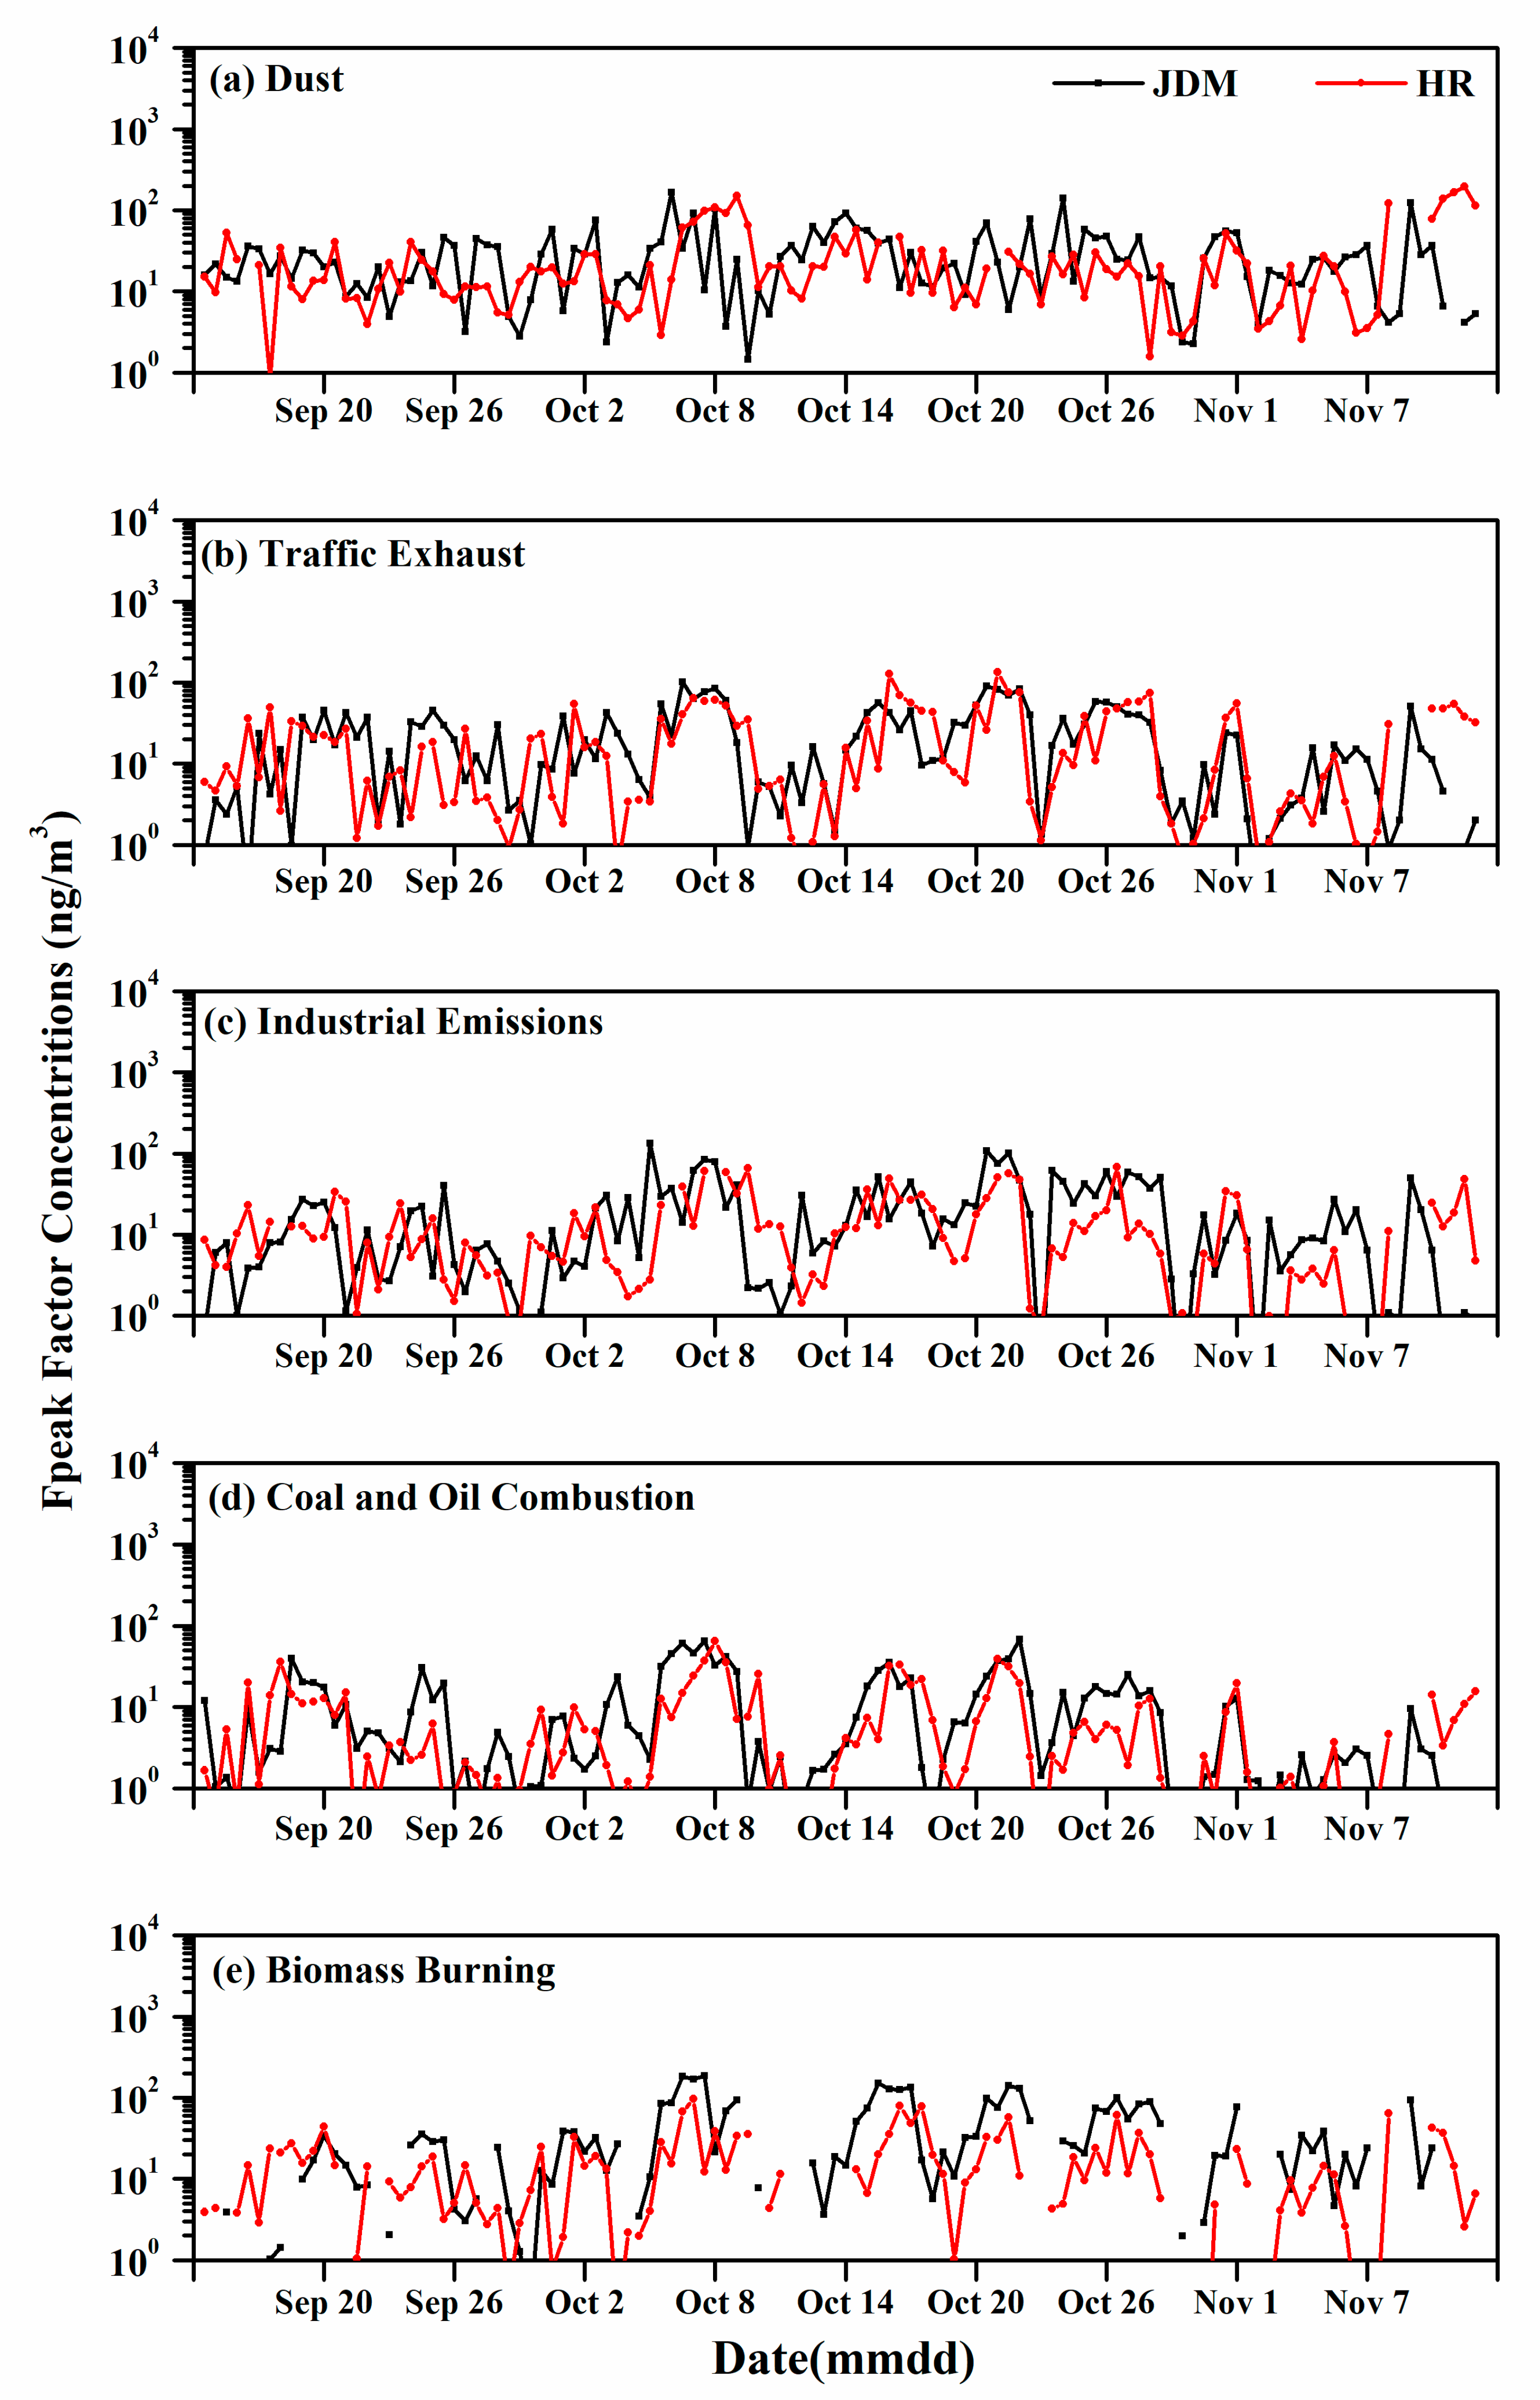
3.5. Source Apportionment of Metallic Elements

The source profiles and the time series of the factors are displayed in Figure 6 and Figure 7. The percentages of each source are shown in Figure 8. The PMF source factors for the metallic elements for the entire study and during the BAPEC and APEC periods, in addition to the changes in their percentages during the APEC summit are provided in Table 3. The five sources of metallic elements, that is, dust, traffic exhaust, industrial sources, coal and oil combustion and biomass burning, were identified. Secondary aerosols is not identified by this study, which was different from the previous source appointment studies conducted in Beijing (Table S2). It should be note that previous source appointment studies were mainly concerned with the total PM2.5 mass, while this study was concerned about the metallic elements, which may lead to the different source contribution results between this study and the prior ones.
The first factor was identified as dust considering the abundance of the typical crustal elements (Mg, Al and Ca) [32,33,34]. Ca and Mg are the particular elements from cement and lime which mainly comes from construction dust. Besides, the Al and Mg take larger proportion among the yellow dust. Furthermore, the EFs of Ca and Mg were much lower than 10 in this study, indicating the nature of their origins. Therefore, this factor possibly mixed among construction dust and yellow dust. The average amounts of metallic elements from dust were approximately 162.0ng/m3 (33.1%) during the BAPEC period and 148.1ng/m3 (43.6%) during the APEC summit. Same monitoring values at HR were 95.5ng/m3 (34.2%) and 122.7ng/m3 (51.4%) respectively. The increased dust concentration at HR was possibly related to decreasing humidity levels (nearly 20%) during the APEC. The overall contribution from construction dust and soil dust was approximately 40% in 2007~2013 in Beijing [35], which is similar to the contribution rate from dust at HR in this study.
The second factor, which contained Zn, Cu and Pb, was identified as traffic exhaust. In the past, smelters and metallurgical industries were considered as the main sources of Cu and Zn in Beijing. However, metal smelting is no longer the main reason to makes Cu and Zn after relocating of the Capital Steel Corporation Limited in 2010. Zn was used in lubricant oil as an additive. Both Zn and Cu had been used in brake linings and tire manufacturing [36]. The friction between a brake pad and a brake plate will release Cu, and friction between the tire and the ground will release Zn. In China, Pb has been used within gasoline as an antidetonator. Both Zn and Pb have also been used as indicators of gasoline combustion in Hong Kong particle apportionment [37]. The concentration of Pb is low in this study which might be related with the promotion of unleaded gasoline. During the BAPEC period, the average amounts of metallic elements from traffic exhaust at JDM and HR were 100.2 ng/m3 (20.5%) and 65.8 ng/m3 (23.6%), respectively. Meanwhile, those during the APEC summit at JDM and HR were 47.3 ng/m3 (13.9%) and 43.6 ng/m3 (18.3%), respectively. These results are similar to the previous findings [38], that traffic emissions accounted for 22.9% and 21.7% before heating and during heating, respectively.
The third factor was identified as industrial sources due to its association with industrial elements (Cr, Mn and Fe). These components may be transported from the adjacent area Hebei Province, where a large number of highly polluting industries are located. Cr is a characteristic element of metallurgy and chemical dust. Both Cr and its compounds are widely used in metallurgy, electroplating, pigment, leather and other industries [39]. Previous study found that ferrous metallurgy could emit Mn [40]. Furthermore, both Fe and Mn are characteristic components of iron and steel industry emissions. Therefore, this factor could be identified as industrial sources. The average mass concentration of industrial sources decreased by 27.9% at JDM (from 83.0 ng/m3 to 59.9 ng/m3) and by 32.4% at HR (from 46.8 ng/m3 to 31.6 ng/m3) from the BAPEC period to during the APEC summit.
The fourth factor is identified as coal and oil combustion, which is suggested by the presence of V, Co, As and Cd. Coal is the dominant fuel in China. Its combustion is the predominant source of fine particulate matter over China [41]. The element As is characteristic of coal-fired dust [42], and coal combustion will also release some Co and Cd. V mainly originates from the combustion of petroleum (primarily heavy oil) and is easily discharged into the atmosphere in the form of particulate matter [43]. The contribution of coal and oil combustion in the BAPEC period were around 8% at both sites, while the contribution of this source decreased by 63.1% at JDM (from 43.7 ng/m3 to 16.1 ng/m3) and by 52.0% at HR (from 23.5 ng/m3 to 11.3 ng/m3) during APEC (Table 3). The contributions of coal and oil combustion in this study were much lower than the previous studies (11–38% in [18] and 26.1% in [44]), which may be attributed to the implementation of a coal-to-gas switch in recent years of Beijing.
The last factor was assigned to biomass burning because it contained a significant majority of K, which was a known biomass burning tracer [45]. K is a typical marker of biomass burning. Farming in Beijing’s suburban districts has still been extensive in recent years. The farmers sometimes fertilize the soil and cooking by burning the crop remnants and the fallen leave in autumn and winter, which enhance the emission of K [46]. Besides, the several barbecue restaurants around the site JDM, which burning the carbon used in the barbecue may be enhance the biomass burning. During the BAPEC, the average mass concentrations of biomass combustion were 101.0 ng/m3 (accounted for 20.6%) at JDM and 47.3 ng/m3 (16.9%) at HR, while those same concentrations at JDM and HR were 68.4 ng/m3 (20.1%) and 29.5 ng/m3 (12.3%), respectively, during the APEC. These results are larger than the yearly average contribution of biomass burning in the year of 2010 (11.2%) [47], possibly because the sampling period of this study was consistent with the harvest period in Beijing and surrounding areas.
The mean contributions from the five sources decreased during the APEC summit. Generally, the five source contributions collectively diminished by 30.7% at JDM and 14.4% at HR during APEC relative to BAPEC, indicating that the air pollution regulations implemented during the APEC summit were effective, and the decline at JDM is more obvious than that at HR. These results are different to those from the prior study [14] stating that the contributions from seven sources (road dust, soil dust, traffic exhaust, secondary aerosols, industrial sources, biomass burning and residual oil combustion) collectively were reduced by 73.3% during the APEC summit at HR relative to the BAPEC period. It should be noted that secondary aerosol was not resolved in this study, which was the dominant factor attributed to the decline of PM2.5 during the APEC summit [13]. In the present study, coal and oil combustion regulations were the most effective for reducing the pollution concentrations (JDM:63.1%; HR:52.0%), followed by measures to reduce traffic exhaust (52.8%), biomass burning (32.2%) and industrial sources (27.9%) at JDM and measures to reduce biomass burning (37.7%), traffic exhaust (33.7%) and industrial sources (32.4%) at HR. The variations in pollution from traffic sources during the BAPEC period and during the APEC summit at JDM were both greater than those at HR, while the variation in pollution from biomass combustion was the opposite.

4. Conclusions

Significant reductions in the PM2.5 mass concentrations were observed both in the urban and suburban areas of Beijing during the APEC summit. The air quality evidently improved during APEC, during which period the mass concentrations at the urban site (JDM) and the suburban site (HR) were 48.4 μg/m3 and 33.1 μg/m3, which were 62.1% and 62.3% lower than those during the BAPEC period, respectively. Most of the trace metals (V, Cr, Mn, As, Cd and Pb) decreased more than 40% due to the emission regulations during APEC, while the crustal elements decreased considerably (4–45%). Relative to the daytime, trace metals increased during the nighttime at both sites before the APEC summit, but no significant difference was observed during the APEC summit, suggesting the suppressed emissions from anthropogenic activities. The concentration of the majority metallic elements increased with relatively aggravated pollution levels during the BAPEC period, and a significant increase (p < 0.05) was observed for K, Cr, Mn, Fe, Co, Cu, Zn, As, Ag, Cd and Pb when pollution levels changed from clean days to heavily polluted days. There was no significant difference for all the 15 elements when the pollution level changed from clean days to lightly polluted days. The EF results suggest trace metal elements are more easily enriched on pollution days. Five sources (dust, traffic exhaust, industrial sources, coal and oil combustion and biomass burning) were resolved using positive matrix factorization (PMF), which collectively decreased by 30.7% at the urban site and 14.4% at the suburban site during the APEC summit. Coal and oil combustion regulations were the most effective for reducing the trace element concentrations (urban site: 63.1%; suburban site: 52.0%), followed by measures to reduce traffic exhaust (52.8%) at the urban site and measures to reduce biomass burning (37.7%) at the suburban site. Our results suggest future control efforts for metallic elements in megacities like Beijing should prioritize coal and oil combustion as well as traffic emissions.

Supplementary Materials

The following are available online at https://www.mdpi.com/2073-4433/10/3/105/s1, Table S1: Concentrations of metallic elements in PM2.5 in Beijing (ng/m3), Table S2: PM2.5 Sources identification and source contributions in Beijing by PMF model in previous studies.

Author Contributions

Formal analysis, M.L.; Funding acquisition, Y.W.; Methodology, M.L.; investigation, X.H.; Y.X. and J.L.; data curation, B.H., J.C. and Y.Z.; Project administration, Y.W and Z.L.; Supervision, Z.L. and J.X; Writing—original draft, M.L.

Funding

This study was funded by the Ministry of Science and Technology of China (Grant nos. 2017YFC0210000), the National Natural Science Foundation of China (Grant nos. 41705110), Beijing Major Science and Technology Project (Z181100005418014), the National research program for key issues in air pollution control (DQGG0101) and the Strategic Priority Research Program of the Chinese Academy of Sciences (Grant nos. XDB05020200).

Acknowledgments

We would like to thank the staff in University of Chinese Academy of Sciences for the help in the sample collection.

Conflicts of Interest

The authors declare no conflict of interest. The funders had no role in the design of the study; in the collection, analyses, or interpretation of data; in the writing of the manuscript, or in the decision to publish the results.

References

  1. Dockery, D.W.; Pope, C.A.; Xu, X.; Spengler, J.D.; Ware, J.H.; Fay, M.E.; Ferris, B.G., Jr.; Speizer, F.E. An association between air pollution and mortality in six U.S. cities. New England J. Med. 1993, 329, 1753–1759. [Google Scholar] [CrossRef] [PubMed]
  2. Rd, P.C.; Dockery, D.W. Health effects of fine particulate air pollution: Lines that connect. J. Air Waste Manage. Assoc. 2006, 56, 709–742. [Google Scholar]
  3. Wang, J.L.; Zhang, Y.H.; Shao, M.; Liu, X.L.; Zeng, L.M.; Cheng, C.L.; Xu, X.F. Quantitative relationship between visibility and mass concentration of PM2.5 in Beijing. J. Environ. Sci. 2006, 18, 475–481. [Google Scholar]
  4. Chow, J.C.; Watson, J.G.; Fujita, E.M.; Lu, Z.; Lawson, D.R.; Ashbaugh, L.L. Temporal and spatial variations of PM2.5 and PM10 aerosol in the southern California air quality study. Atmos Environ. 1994, 28, 2061–2080. [Google Scholar] [CrossRef]
  5. Donaldson, K.; Brown, D.; Clouter, A.; Duffin, R.; Macnee, W.; Renwick, L.; Tran, L.; Stone, V. The pulmonary toxicology of ultrafine particles. J. Aerosol Med. 2002, 15, 213–220. [Google Scholar] [CrossRef] [PubMed]
  6. Prahalad, A.K.; Soukup, J.M.; Inmon, J.; Willis, R.; Ghio, A.J.; Becker, S.; Gallagher, J.E. Ambient air particles: Effects on cellular oxidant radical generation in relation to particulate elemental chemistry. Toxicol. Appl. Pharmacol. 1999, 158, 81–91. [Google Scholar] [CrossRef] [PubMed]
  7. Gao, Y.; Nelson, E.D.; Field, M.P.; Ding, Q.; Li, H.; Sherrell, R.M.; Gigliotti, C.L.; Van Ry, D.A.; Glenn, T.R.; Eisenreich, S.J. Characterization of atmospheric trace elements on PM2.5 particulate matter over the New York–New Jersey harbor estuary. Atoms. Environ. 2002, 36, 1077–1086. [Google Scholar] [CrossRef]
  8. Pan, Y.P.; Wang, Y.S. Atmospheric wet and dry deposition of trace elements at 10 sites in Northern China. Atmos. Chem. Phys. 2015, 15, 951–972. [Google Scholar] [CrossRef]
  9. Chen, Z.; Zhang, J.; Zhang, T.; Liu, W.; Liu, J. Haze observations by simultaneous lidar and WPS in Beijing before and during APEC, 2014. Sci. China Chem. 2015, 58, 1385–1392. [Google Scholar] [CrossRef]
  10. Sheng, L.; Lu, K.; Ma, X.; Hu, J.K.; Song, Z.X.; Huang, S.X.; Zhang, J.P. The air quality of Beijing-Tianjin-Hebei regions around the Asia-Pacific Economic Cooperation (APEC) meetings. Atmos. Pollut. Res. 2015, 6, 1066–1072. [Google Scholar] [CrossRef]
  11. Tang, G.; Zhu, X.; Hu, B.; Xin, J.; Wang, L.; Münkel, C.; Mao, G.; Wang, Y. Impact of emission controls on air quality in Beijing during APEC 2014: Lidar ceilometer observations. Atoms. Chem. Phys. 2015, 15, 12667–12680. [Google Scholar] [CrossRef]
  12. Wen, W.; Cheng, S.; Chen, X.; Wang, G.; Li, S.; Wang, X.; Li, S.; Wang, X.; Liu, X. Impact of emission control on PM2.5 and the chemical composition change in Beijing-Tianjin-Hebei during the APEC summit 2014. Environ. Sci. Pollut. Res. 2016, 23, 4509–4521. [Google Scholar] [CrossRef] [PubMed]
  13. Liu, Z.; Hu, B.; Zhang, J.; Xin, J.; Wu, F.; Gao, W.; Wang, M.; Wang, Y. Characterization of fine particles during the 2014 Asia-Pacific economic cooperation summit: Number concentration, size distribution and sources. Tellus B Chem Phys. Meteor. 2017, 69. [Google Scholar] [CrossRef]
  14. Wang, Y.; Zhang, Y.; Schauer, J.J.; De, F.B.; Guo, B.; Zhang, Y. Relative impact of emissions controls and meteorology on air pollution mitigation associated with the Asia-Pacific Economic Cooperation (APEC) conference in Beijing, China. Sci. Total Environ. 2016, 571, 1467–1476. [Google Scholar] [CrossRef] [PubMed]
  15. Chang, Y.; Liu, X.; Deng, C.; Dore, A.J.; Zhuang, G. Source apportionment of atmospheric ammonia before, during, and after the 2014 APEC summit in Beijing using stable nitrogen isotope signatures. Atmos. Chem. Phys. 2016, 16, 1–26. [Google Scholar] [CrossRef]
  16. Liacos, J.W.; Kam, W.; Delfino, R.J.; Schauer, J.J.; Sioutas, C. Characterization of organic, metal and trace element PM2.5 species and derivation of freeway-based emission rates in Los Angeles, CA. Sci. Total. Environ. 2012, 435–436, 159–166. [Google Scholar] [CrossRef] [PubMed]
  17. Yatkin, S.; Bayram, A. Source apportionment of PM10 and PM2.5 using positive matrix factorization and chemical mass balance in Izmir, Turkey. Sci. Total Environ. 2008, 390, 109–123. [Google Scholar] [CrossRef] [PubMed]
  18. Song, Y.; Tang, X.Y.; Xie, S.D.; Zhang, Y.H.; Wei, Y.J.; Zhang, M.S.; Zeng, L.; Lu, S. Source apportionment of PM2.5 in Beijing in 2004. J. Hazard. Mater. 2007, 146, 124–130. [Google Scholar] [CrossRef] [PubMed]
  19. Liu, Z.; Gao, W.; Yu, Y.; Hu, B.; Xin, J.; Sun, Y.; Wang, L.; Wang, G.; Bi, X.; Zhang, G.; et al. Characteristics of PM2.5 mass concentrations and chemical species in urban and background areas of China: Emerging results from the CARE-China network. Atmos. Chem. Phys. 2018, 18, 8849–8871. [Google Scholar] [CrossRef]
  20. Taylor, S.R.; Mclennan, S.M. The geochemical evolution of the continental crust. Rev. Geophys. 1995, 33, 293–301. [Google Scholar] [CrossRef]
  21. Duce, R.A.; Hoffman, G.L.; Zoller, W.H. Atmospheric trace metals at remote northern and southern hemisphere sites: Pollution or natural? Science 1975, 187, 59–61. [Google Scholar] [CrossRef] [PubMed]
  22. Paatero, P.; Tapper, U. Analysis of different modes of factor analysis as least squares fit problems. Chemom. Intell. Lab. Syst. 1993, 18, 183–194. [Google Scholar] [CrossRef]
  23. Huang, S.; Arimoto, R.K. Testing and optimizing two factor-analysis techniques on aerosol at Narragansett, Rhode Island. Atoms. Environ. 1999, 33, 2169–2185. [Google Scholar] [CrossRef]
  24. Polissar, A.V.; Hopke, P.K.; Paatero, P.; Malm, W.C.; Sisler, J.F. Atmospheric aerosol over Alaska: 2. Elemental composition and sources. J. Geophy Res. Atmos. 1998, 103, 19045–19057. [Google Scholar] [CrossRef]
  25. Liu, Z.R.; Hu, B.; Liu, Q.; Sun, Y.; Wang, Y.S. Source apportionment of urban fine particle number concentration during summertime in Beijing. Atoms. Environ. 2014, 96, 359–369. [Google Scholar] [CrossRef]
  26. Titos, G.; Lyamani, H.; Pandolfi, M.; Alastuey, A.; Alados-Arboledas, L. Identification of fine (PM1) and coarse (PM10-1) sources of particulate matter in an urban environment. Atoms. Environ. 2014, 89, 593–602. [Google Scholar] [CrossRef]
  27. Moon, K.J.; Han, J.S.; Ghim, Y.S.; Kim, Y.J. Source apportionment of fine carbonaceous particles by positive matrix factorization at Gosan background site in East Asia. Environ. Int. 2008, 34, 654–664. [Google Scholar] [CrossRef] [PubMed]
  28. Wang, L.; Liu, Z.; Sun, Y.; Ji, D.; Wang, Y. Long-range transport and regional sources of PM2.5 in Beijing based on long-term observations from 2005 to 2010. Atmos. Res. 2015, 157, 37–48. [Google Scholar] [CrossRef]
  29. Ram, K.; Sarin, M.M. Day-night variability of EC, OC, WSOC and inorganic ions in urban environment of Indo-Gangetic Plain: Implications to secondary aerosol formation. Atoms. Environ. 2011, 45, 460–468. [Google Scholar] [CrossRef]
  30. Qiao, B.W.; Liu, Z.R.; Hu, B.; Liu, J.Y.; Pang, N.N.; Wu, F.K.; Xu, Z.J.; Wang, Y.S. Concentration Characteristics and Sources of Trace Metals in PM2.5 During Wintertime in Beijing. Environ Sci. 2017, 38, 876–883. (in Chinese). [Google Scholar]
  31. Yang, Y.J.; Wang, Y.S.; Huang, W.W.; Hu, B.; Wen, T.X. Size Distributions and Elemental Compositions of Particulate Matter on Clears Hazy and Foggy days in Beijing, China. Adv. Atmos. Sci. 2010, 27, 663–675. [Google Scholar] [CrossRef]
  32. Watson, J.G.; Chow, J.C. Source characterization of major emission sources in the imperial and Mexicali Valleys along the US/Mexico border. Sci. Total Environ. 2001, 276, 33–47. [Google Scholar] [CrossRef]
  33. Zhao, W.; Hopke, P.K. Source apportionment for ambient particles in the San Gorgonio wilderness. Atoms. Environ. 2004, 38, 5901–5910. [Google Scholar] [CrossRef]
  34. Kim, E.; Hopke, P.K.; Edgerton, E.S. Improving source identification of Atlanta aerosol using temperature resolve carbon factions in positive matrix factorization. Atoms. Environ. 2004, 38, 3349–3362. [Google Scholar] [CrossRef]
  35. Jin, X.C.; Zhang, G.Y.; Xiao, C.J.; Huang, D.H.; Yuan, G.J.; Yao, Y.G.; Wang, X.H.; Hua, L.; Wang, P.S.; Ni, B. Source Apportionment of PM2.5 in Xinzhen, Beijing Using PIXE and XRF. Energy Sci. Technol. 2014, 48, 1325–1330. (in Chinese). [Google Scholar]
  36. Thorpe, A.; Harrison, R.M. Sources and properties of non-exhaust particulate matter from road traffic: A review. Sci. Total Environ. 2008, 400, 270–282. [Google Scholar] [CrossRef] [PubMed]
  37. Lee, E.; Chan, C.K.; Paatero, P. Application of positive matrix factorization in source apportionment of particulate pollutants in Hong Kong. Atoms. Environ. 1999, 33, 3201–3212. [Google Scholar] [CrossRef]
  38. Yang, H.; Chen, J.; Wen, J.; Tian, H.; Liu, X. Composition and sources of PM2.5 around the heating periods of 2013 and 2014 in Beijing: Implications for efficient mitigation measures. Atoms. Environ. 2016, 124, 378–386. [Google Scholar] [CrossRef]
  39. Dall’Osto, M.; Querol, X.; Amato, F.; Karanasiou, A. Hourly elemental concentrations in PM2.5 aerosols sampled simultaneously at urban background and road site during SAPUSS-diurnal variations and PMF receptor modelling. Atmos. Chem. Phys. 2013, 13, 4375–4392. [Google Scholar]
  40. Querol, X.; Zhuang, X.; Alastuey, A.; Viana, M.; Lv, W.; Wang, Y.; Lopez, A.; Zhu, Z.; Wei, H.; Xu, S. Speciation and sources of atmospheric aerosols in a highly industrialised emerging mega-city in central China. J. Environ. Monitor. 2006, 8, 1049–1059. [Google Scholar] [CrossRef]
  41. Yao, Q.; Li, S.Q.; Xu, H.W.; Zhuo, J.K.; Song, Q. Reprint of: Studies on formation and control of combustion particulate matter in China: A review. Energy 2009, 35, 4480–4493. [Google Scholar] [CrossRef]
  42. Hien, P.D.; Binh, N.T.; Truong, Y.; Ngo, N.T.; Sieu, L.N. Comparative receptor modelling study of TSP, PM2 and PM2−10 in Ho Chi Minh City. Atoms. Environ. 2001, 35, 2669–2678. [Google Scholar] [CrossRef]
  43. Wang, G.; Oldfield, F.; Xia, D.; Chen, F.; Liu, X.; Zhang, W. Magnetic properties and correlation with heavy metals in urban street dust: A case study from the city of Lanzhou, China. Atoms. Environ. 2012, 46, 289–298. [Google Scholar] [CrossRef]
  44. Huang, R.J.; Zhang, Y.; Bozzetti, C.; Ho, K.F.; Cao, J.J.; Han, Y.; Daellenbach, K.R.; Slowik, J.G.; Platt, S.M.; Canonaco, F.; et al. High secondary aerosol contribution to particulate pollution during haze events in China. Nature 2014, 514, 218–222. [Google Scholar] [CrossRef] [PubMed]
  45. Cachier, H.; Ducret, J. Influence of biomass burning on equatorial African rains. Nature 1991, 352, 228–230. [Google Scholar] [CrossRef]
  46. Duan, F.; Yu, L.T.; Cachier, H. Identification and estimate of biomass burning contribution to the urban aerosol organic carbon concentrations in Beijing. Atoms. Environ. 2004, 38, 1275–1282. [Google Scholar] [CrossRef]
  47. Yu, L.D.; Wang, G.F.; Zhang, R.J.; Zhang, L.M.; Song, Yu.; Wu, B.B. Characterization and Source Apportionment of PM2.5 in an Urban Environment in Beijing. Aerosol. Air. Qual. Res. 2013, 13, 574–583. [Google Scholar] [CrossRef]
Figure 1. (a,b) Meteorological conditions and (c) PM2.5 mass concentration during the sampling period at the Beijing urban site (JDM) and suburban site (HR).
Atmosphere 10 00105 g001
Figure 2. Daytime and nighttime concentrations of metallic elements before and during the APEC summit in Beijing urban site (JDM) and suburban site (HR).
Atmosphere 10 00105 g002
Figure 3. Daytime and nighttime enrichment factors of metallic elements (a,b) before and (c,d) during the APEC summit in Beijing urban site (JDM) and suburban site (HR).
Atmosphere 10 00105 g003
Figure 4. Concentrations of metallic elements at clean days (CD), light polluted days (LD) and heavy polluted days (HD) before and during the APEC summit in Beijing urban site (JDM) and suburban site (HR).
Atmosphere 10 00105 g004
Figure 5. Enrichment factors of metallic elements on clean days, light polluted days and heavy polluted days (a,b) before and (c,d) during the APEC summit in Beijing urban site (JDM) and suburban site (HR).
Atmosphere 10 00105 g005
Figure 6. Source profile of the five factors ((a) dust, (b) traffic exhaust, (c) industrial sources, (d) coal and oil combustion and (e) biomass burning) of metallic elements in PM2.5 resolved by PMF in Beijing urban site (JDM) and suburban site (HR).
Atmosphere 10 00105 g006
Figure 7. Time series of source contributions of the five factors ((a) dust, (b) traffic exhaust, (c) industrial sources, (d) coal and oil combustion and (e) biomass burning) to metallic elements in PM2.5 resolved by PMF in Beijing urban site (JDM) and suburban site (HR).
Atmosphere 10 00105 g007
Figure 8. Source contribution of the five factor to metallic elements in PM2.5 before and during the APEC summit in Beijing urban site (JDM) and suburban site (HR).
Atmosphere 10 00105 g008
Table 1. PM2.5 mass concentrations and meteorological parameters before and during the Asia-Pacific Economic Cooperation (APEC) summit in Beijing urban site (JDM) and suburban site (HR).
ParametersJDM (n = 47)HR (n = 12)Reduction (%)
BAPECAPECBAPECAPECJDMHR
PM2.5 (μg/m3)127.648.487.733.162.1 *62.3 *
Days of PM2.5 exceeding 75 μg/m330220193.395.0
Exceeding Rate (%)63.816.742.68.373.880.5
Temperature (℃)16.810.114.36.939.9 **21.7 **
Relative Humidity (%)56.334.169.543.939.4 **36.8 **
Wind Speed (m/s)0.821.581.441.36−92.7 **5.6
* denote the difference reach significance level (p < 0.05), and ** denote the significance level (p < 0.01).
Table 2. Average mass concentrations of metallic elements in PM2.5 and the differences between urban and suburban site and the reductions between before APEC (BAPEC) and APEC periods.
BAPEC (n = 47)APEC (n = 12)Reduction (%) b
ng/m3JDMHRDiff. (%) aJDMHRDiff. (%) aJDMHR
Mg160.7167.6−4.388.3142.6−61.5 *45.1 **14.9
Al501383.123.5 **c416.2365.212.316.94.7 *
K1789.9718.659.9 **1125.3460.359.1 **37.1 *35.9 *
Ca641.9456.328.9 **616.5369.940.0 **4.018.9
V2.61.253.8 **0.760.3652.6 **70.8 **70.0 **
Cr9.54.057.9 **6.52.660.0 **31.635.0 **
Mn59.337.436.9 **31.320.634.247.2 **44.9 **
Fe1360.9766.643.7 **1139.1455.460.0 **16.340.6 **
Co0.590.3147.5 **0.360.1752.8 **39.0 *45.2
Cu49.823.153.6 **45.216.363.9 **9.229.4
Zn291.8180.738.1 **130.1146.8−12.855.4 **18.8
As10.09.55.04.04.7−17.560.0 **50.5 *
Ag0.530.67−26.4 *0.350.67−91.4 **40.0 *0.0
Cd2.62.023.1 *1.20.925.053.8 **55.0 *
Pb147.199.932.1 **62.541.134.257.5 **58.9 **
a The difference (Diff.) in metallic elements concentrations between urban (JDM) and suburban (HR) site; b The reduction in metallic elements concentrations between the BAPEC and APEC periods; c,* denote the difference reach significance level (p < 0.05) , and ** denote the significance level (p < 0.01).
Table 3. Averaged concentration of metallic elements in PM2.5 for the five factors for before and during the APEC summit in Beijing urban site (JDM) and suburban site (HR).
SourcesJDMHR
BAPECAPECReduction (%)BAPECAPECReduction (%)
Dust (ng/m3)162.0148.1−8.695.5122.728.5
Traffic Exhaust (ng/m3)100.247.3−52.865.843.6−33.7
Industrial Emissions (ng/m3)83.059.9−27.946.831.6−32.4
Coal and Oil Combustion (ng/m3)43.716.1−63.123.511.3−52.0
Biomass Burning (ng/m3)101.068.4−32.247.329.5−37.7

