Article

Influence of the Anthropogenic Fugitive, Combustion, and Industrial Dust on Winter Air Quality in East Asia

School of Earth and Environmental Sciences, Seoul National University, Seoul 08826, Korea
*
Author to whom correspondence should be addressed.
Atmosphere 2019, 10(12), 790; https://doi.org/10.3390/atmos10120790
Submission received: 1 November 2019 / Revised: 5 December 2019 / Accepted: 5 December 2019 / Published: 7 December 2019
(This article belongs to the Special Issue Recent Advances of Air Pollution Studies in South Korea)

Abstract

:
We estimate the effects of the anthropogenic fugitive, combustion, and industrial dust (AFCID) on winter air quality in China and South Korea for November 2015–March 2016 using the Comprehensive Regional Emissions inventory for Atmospheric Transport Experiment (KU-CREATE) monthly anthropogenic emission inventory in conjunction with a nested version of GEOS-Chem. Including AFCID emissions in models results in a better agreement with observations and a reduced normalized mean bias of −28% compared to −40% without AFCID. Furthermore, we find that AFCID amounts to winter PM10 concentrations of 17.9 μg m−3 (17%) in eastern China (30−40° N, 112−120° E) with the largest contribution of AFCID to winter PM10 concentrations of up to 45 μg m−3 occurring in eastern China causing a significant impact on air quality to downwind regions. Including AFCID in the model results in an increase of simulated winter PM10 concentrations in South Korea by 3.1 μg m−3 (9%), of which transboundary transport from China accounts for more than 70% of this increased PM10 concentration. Our results indicate that AFCID is an essential factor for winter PM10 concentrations over East Asia and its sources and physical characteristics need to be better quantified to improve PM air quality forecasts.

1. Introduction

Severe environmental pollution due to rapid economic growth, industrialization, and urbanization has become a social problem in East Asia. Among the environmental problems being faced by East Asia, air quality degradation caused by severe haze is a primary concern not only in China but also in neighboring countries directly affected by transboundary transport from China [1,2]. Aerosols also affect human health by increasing the risk of cardiovascular and respiratory diseases [3,4]. Cohen et al. [5] reported that lung cancer and cardiovascular disease ranked fifth among global risk factors due to aerosol exposure.
In recent years, aerosol concentrations have decreased in East Asia due to intense regulatory policies [6,7,8,9]; however, East Asia still has high aerosol concentrations compared to other regions. In winter, severe air pollution events frequently occur due to unfavorable weather conditions and excessive use of heating energy. Recent studies report that stagnant weather conditions in winter play an important role in severe haze events and are generally characterized by weak wind speed, low boundary layer height, strong temperature inversion, and high relative humidity [10,11,12].
Air quality modeling is a powerful tool for understanding the physical and chemical processes that affect air pollution. Global and regional models estimate aerosol concentrations comprising carbonaceous, inorganic ions, mineral dust, and sea salt [13,14], with the first two components mainly contributed by human activity and the latter two assumed to be caused naturally by wind from the arid desert and ocean. In addition to these components, recent emission studies suggest that anthropogenic fugitive, combustion, and industrial dust (AFCID) are also major sources for aerosol concentrations in urban areas [15,16,17,18]. Zheng et al. [15] suggest that the total amounts of AFCID emissions in China are higher than the sum of black carbon (BC) and organic carbon (OC) emissions. Nevertheless, only a few global and regional chemical transport models include AFCID emissions in aerosol simulations [19,20,21].
The primary sources of AFCID are coal burning and industrial processes (e.g., steel and cement production), refurbishing paved and unpaved roads, mining, quarrying, and agricultural operations [22]. Previous global modeling work by Philip et al. [19] suggests that AFCID increases annual mean PM2.5 concentrations by 2–16 μg m−3 and reduces bias by 10% in East and South Asia. Since global models tend to underestimate aerosol loadings, including missing AFCID sources in the models will not only reduce the bias but also more accurately estimate the effects of aerosols on air quality and human health. To better understand this relationship, we use a nested version of the GEOS-Chem along with the latest AFCID emission inventory to quantify the impact of AFCID on winter aerosol concentrations in East Asia.

2. Model and Methods

We performed aerosol simulations in East Asia from October 2015 to March 2016 using a GEOS-Chem (version 12.1.0) 3-D global chemical transport model driven by Goddard Earth Observing System–Forward Processing (GEOS-FP) assimilated meteorological fields. GEOS-FP provides meteorological data such as temperature, wind, humidity, boundary layer height, and other variables in a horizontal grid of 0.25° × 0.3125°.
The model includes a fully coupled tropospheric chemistry with five anthropogenic aerosols: BC, OC, ammonium, sulfate, and nitrate [23,24]. The model also includes two wind-generated natural aerosols: soil dust, and sea salt [25,26]. The standard GEOS-Chem model classifies natural mineral dust in four size bins of diameters 0.2–2.0, 2.0–3.6, 3.6–6.0, and 6.0–12.0 μm. AFCID is estimated to be within a diameter of 2.0 μm and therefore, belongs in the smallest bin, and the characteristics of aerosol produced by AFCID are considered the same as the dust species.
The BC and OC simulations are based on the methods detailed by Park et al. [23] with the hydrophobic component becoming hydrophilic with an e-folding time of 1.15 days. We use a simple secondary organic aerosol (SOA) scheme that assumes irreversible uptake as the mechanism of SOA formation. This scheme includes two SOA-related tracers of SOA precursor (SOAP) and particle-phase (SOAS). The SOAP is directly emitted proportionally to anthropogenic and biomass burning of CO with ratios of 0.069 and 0.013 (g CO emitted)−1, respectively [27,28]. Biogenic SOA forms from monoterpene and isoprene in yields of 5% and 1.5%, respectively. Secondary inorganic aerosols of ammonium, sulfate, and nitrate are calculated using ISORROPIA II, which takes into account H2SO4-HNO3-NH3-H2O thermodynamic equilibrium [29]. The GEOS-Chem uses the dust entrainment and deposition (DEAD) scheme developed by Zender et al. [30], which employs the source function used in the Goddard Chemistry Aerosol Radiation and Transport (GOCART) model [31,32]. Sea salt is produced as a function of local 10 m wind speeds, dry particle sizes, and sea surface temperatures [25,33]. In GEOS-Chem, the removal of all aerosol species in the atmosphere occur through dry deposition processes such as gravity sedimentation and turbulent dry transfer to the surface [34]. The model also includes wet deposition processes of washout/rainout in large-scale precipitation and convective updraft scavenging [35].
The anthropogenic emissions of BC, OC, SO2, NOX, NH3, VOCs, and AFCID in East Asia are sourced from the Comprehensive Regional Emissions inventory for Atmospheric Transport Experiment (KU-CREATE v4.7) [36,37], which was developed for air quality modeling and analysis in Asia. KU-CREATE inventory is created by using the highly compatible Greenhouse Gas and Air Pollution Interactions and Synergies (GAINS)-Asia framework. Based on up-to-date statistics, the KU-CREATE inventory considers emission activity, emission factors, and abatement efficiencies from a bottom-up emission inventory. Recently, it was provided as an emission inventory for Korea–United States Air Quality (KORUS-AQ; https://www-air.larc.nasa.gov/missions/korus-aq/) field campaign.
The annual AFCID emissions in East Asia (20–50° N, 100–140° E) for 2015 and 2016 are 5.8 Tg year−1 and 5.2 Tg year−1, respectively. Figure 1a,b shows the annual AFCID emissions for 2015 and 2016 from the KU-CREATE inventory indicating high AFCID emissions occurring in eastern China. Values are up to 50% higher in winter than summer due to heating related sources (Figure 1c). It is also noteworthy that AFCID emissions are reduced by 10% in 2016 compared to 2015 due to regulations enacted in China.
Biomass burning emissions are sourced from the Global Fire Emission Database version 4 (GFED4) inventory [38] with 0.25° × 0.25° spatial resolution and the daily time resolution. For biogenic emissions, we use the Model of Emissions of Gases and Aerosols from Nature (MEGAN v2.1) inventory [39] as implemented in GEOS-Chem by Hu et al. [40].
We evaluate the model using observed hourly PM2.5 and PM10 concentrations in surface air collected from the China National Environmental Monitoring Center (CNEMC; http://www.pm25.in) and the Korean Ministry of Environment (MOE; http://www.airkorea.or.kr). Since we obtained the Chinese data in 2016, model evaluation was performed only from January to March 2016. Furthermore, for efficient comparison between the model and observations, we re-gridded the observations to fit the model horizontal grid.
We conducted two six months simulations: a baseline simulation with no AFCID emissions and a sensitivity simulation with AFCID emissions. The first month is used to spin up the model. We quantify AFCID contributions and aerosol concentrations in East Asia using the difference between the baseline and sensitivity simulations. We also conducted two additional sensitivity simulations by zeroing out AFCID emissions in China and AFCID emissions in both China and South Korea, respectively. The differences between the simulation with AFCID emissions and each sensitivity simulation yields the contributions from China, the rest of the world, and South Korea, respectively, to PM2.5 concentrations in South Korea.

3. Results

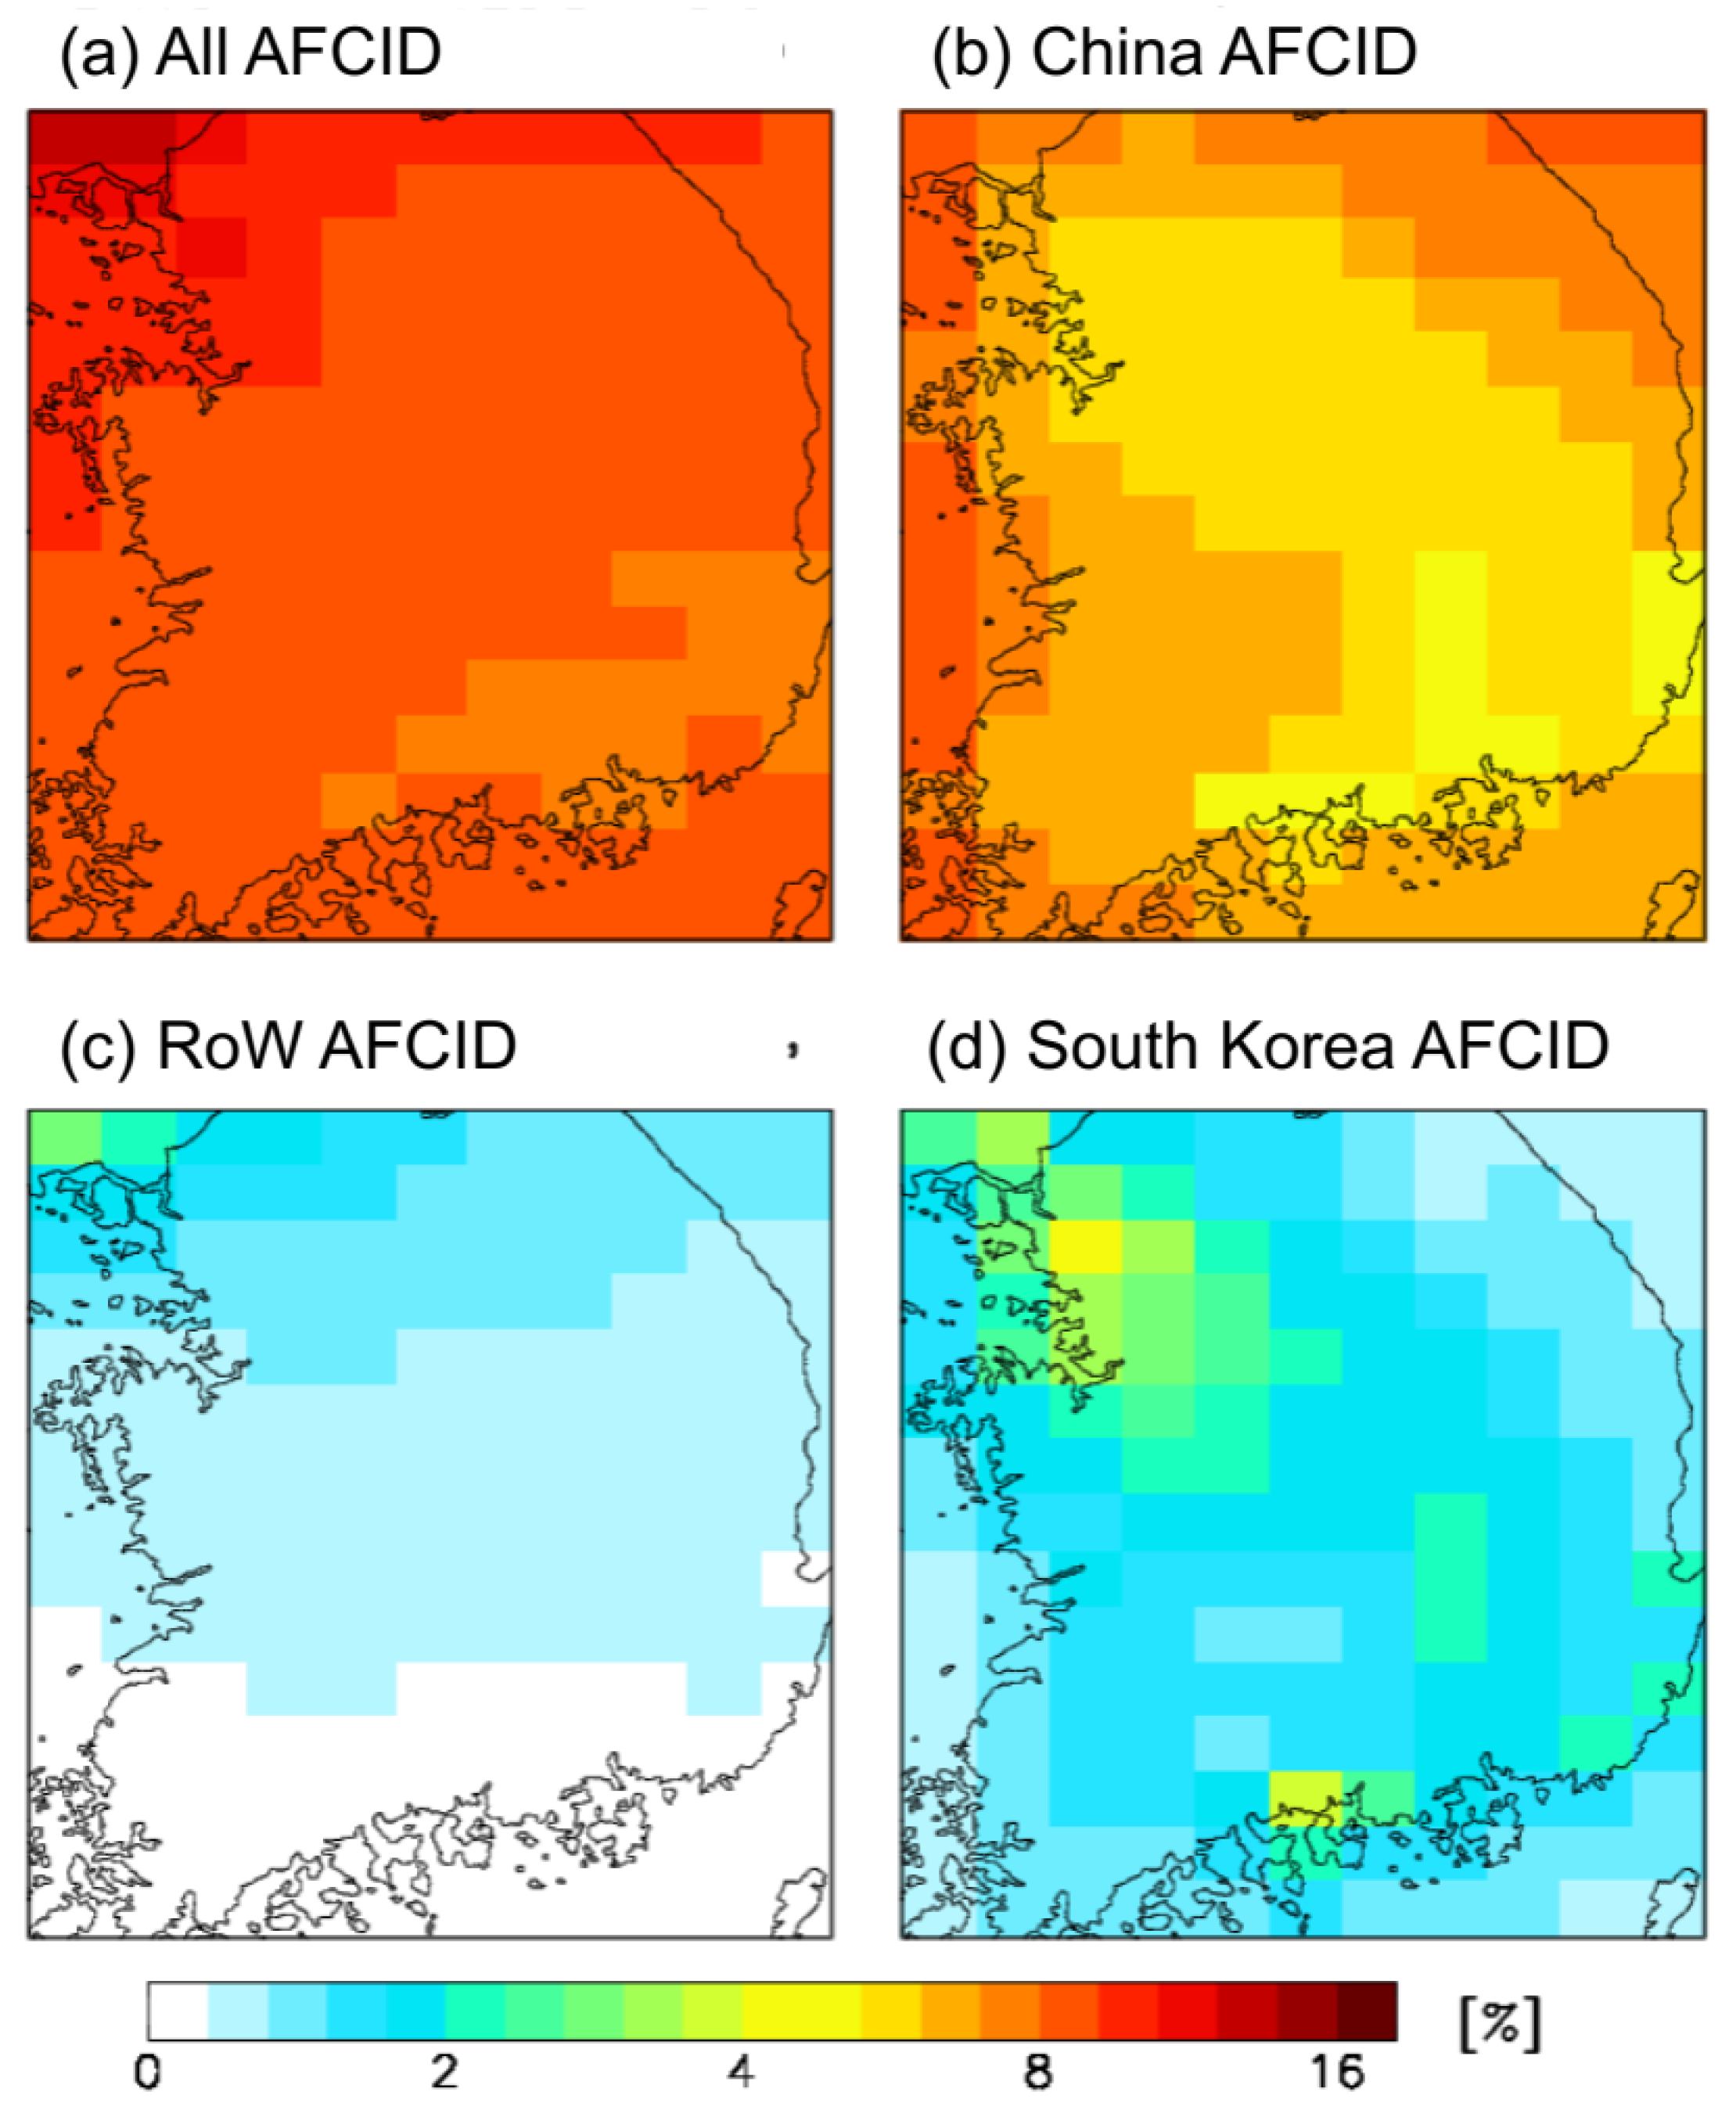
3.1. Impacts of AFCID on PM10 Concentrations

In this session, we investigate the impact of AFCID on winter air quality in East Asia using the sensitivity tests of AFCID emissions. Figure 2 shows the spatial distributions and scatter plots of observed and simulated PM10 concentrations with and without AFCID emissions. As aforementioned in the methods, due to the absence of Chinese observations in 2015, we only compare the models and observations from January to March 2016. The simulated PM10 reproduces the spatial patterns of the highest aerosol concentration in eastern China, where there are also high levels of anthropogenic emissions. However, without the AFCID, the modeled PM10 concentrations are 40% lower than observed values (Figure 2c), with significant discrepancies mainly in eastern China (Figure 2a). In contrast, the inclusion of AFCID emissions more closely reproduces observations with improved slope and correlation coefficients from 0.63 to 0.79 and 0.66 to 0.68, respectively.
Figure 3a shows the enhancement of winter PM10 concentrations in East Asia due to AFCID. The results indicate that AFCID increase surface PM10 concentrations in eastern China (30−40° N, 112−120° E) by 17.9 μg m−3 in the winter season. In particular, the largest increases are found up to 45 μg m−3, which is much higher than 16 μg m−3, as previously suggested by Philip et al. [19]. This is because we focused only on the winter season when the pollutant emissions are relatively high, and used the finer model horizontal grid of 0.25° × 0.3125° in East Asia. Since AFCID, like SO2 and NOx, is based on human activity, increased PM10 concentration is mainly concentrated in urban areas. Figure 3b also shows the percentage enhancement of PM10 concentrations by AFCID emissions. The results indicate that AFCID increases PM10 concentrations by an average of 17% in eastern China, with the largest increases by up to 36%. In particular, AFCID contributes significantly to PM10 concentrations in northeastern China (Figure 3b).
Large amounts of AFCID emissions from eastern China can affect downwind regions such as Korea and Japan. Figure 4 shows the sensitivity results of source contributions to the increase in surface PM10 concentration in South Korea. The sensitivity results show that AFCID increases the winter surface PM10 concentrations in South Korea (34–38° N, 126–129.5° E) by 3.1 μg m−3, of which 2.3 μg m−3 by transboundary transport from China, 0.6 μg m−3 by local sources from South Korea, and 0.2 μg m−3 from the rest of the world. In South Korea, the winter PM10 concentrations increased by 8.9% by AFCID, accounting for 6.7%, 1.5%, and 0.6% from China, Korea, and the rest of the world, respectively (Figure 5). These results indicate that AFCID from China contributes significantly to increasing PM10 concentration in South Korea in the winter season. It also suggests that AFCID should be taken into account for aerosol simulation in the downwind regions of East Asia.

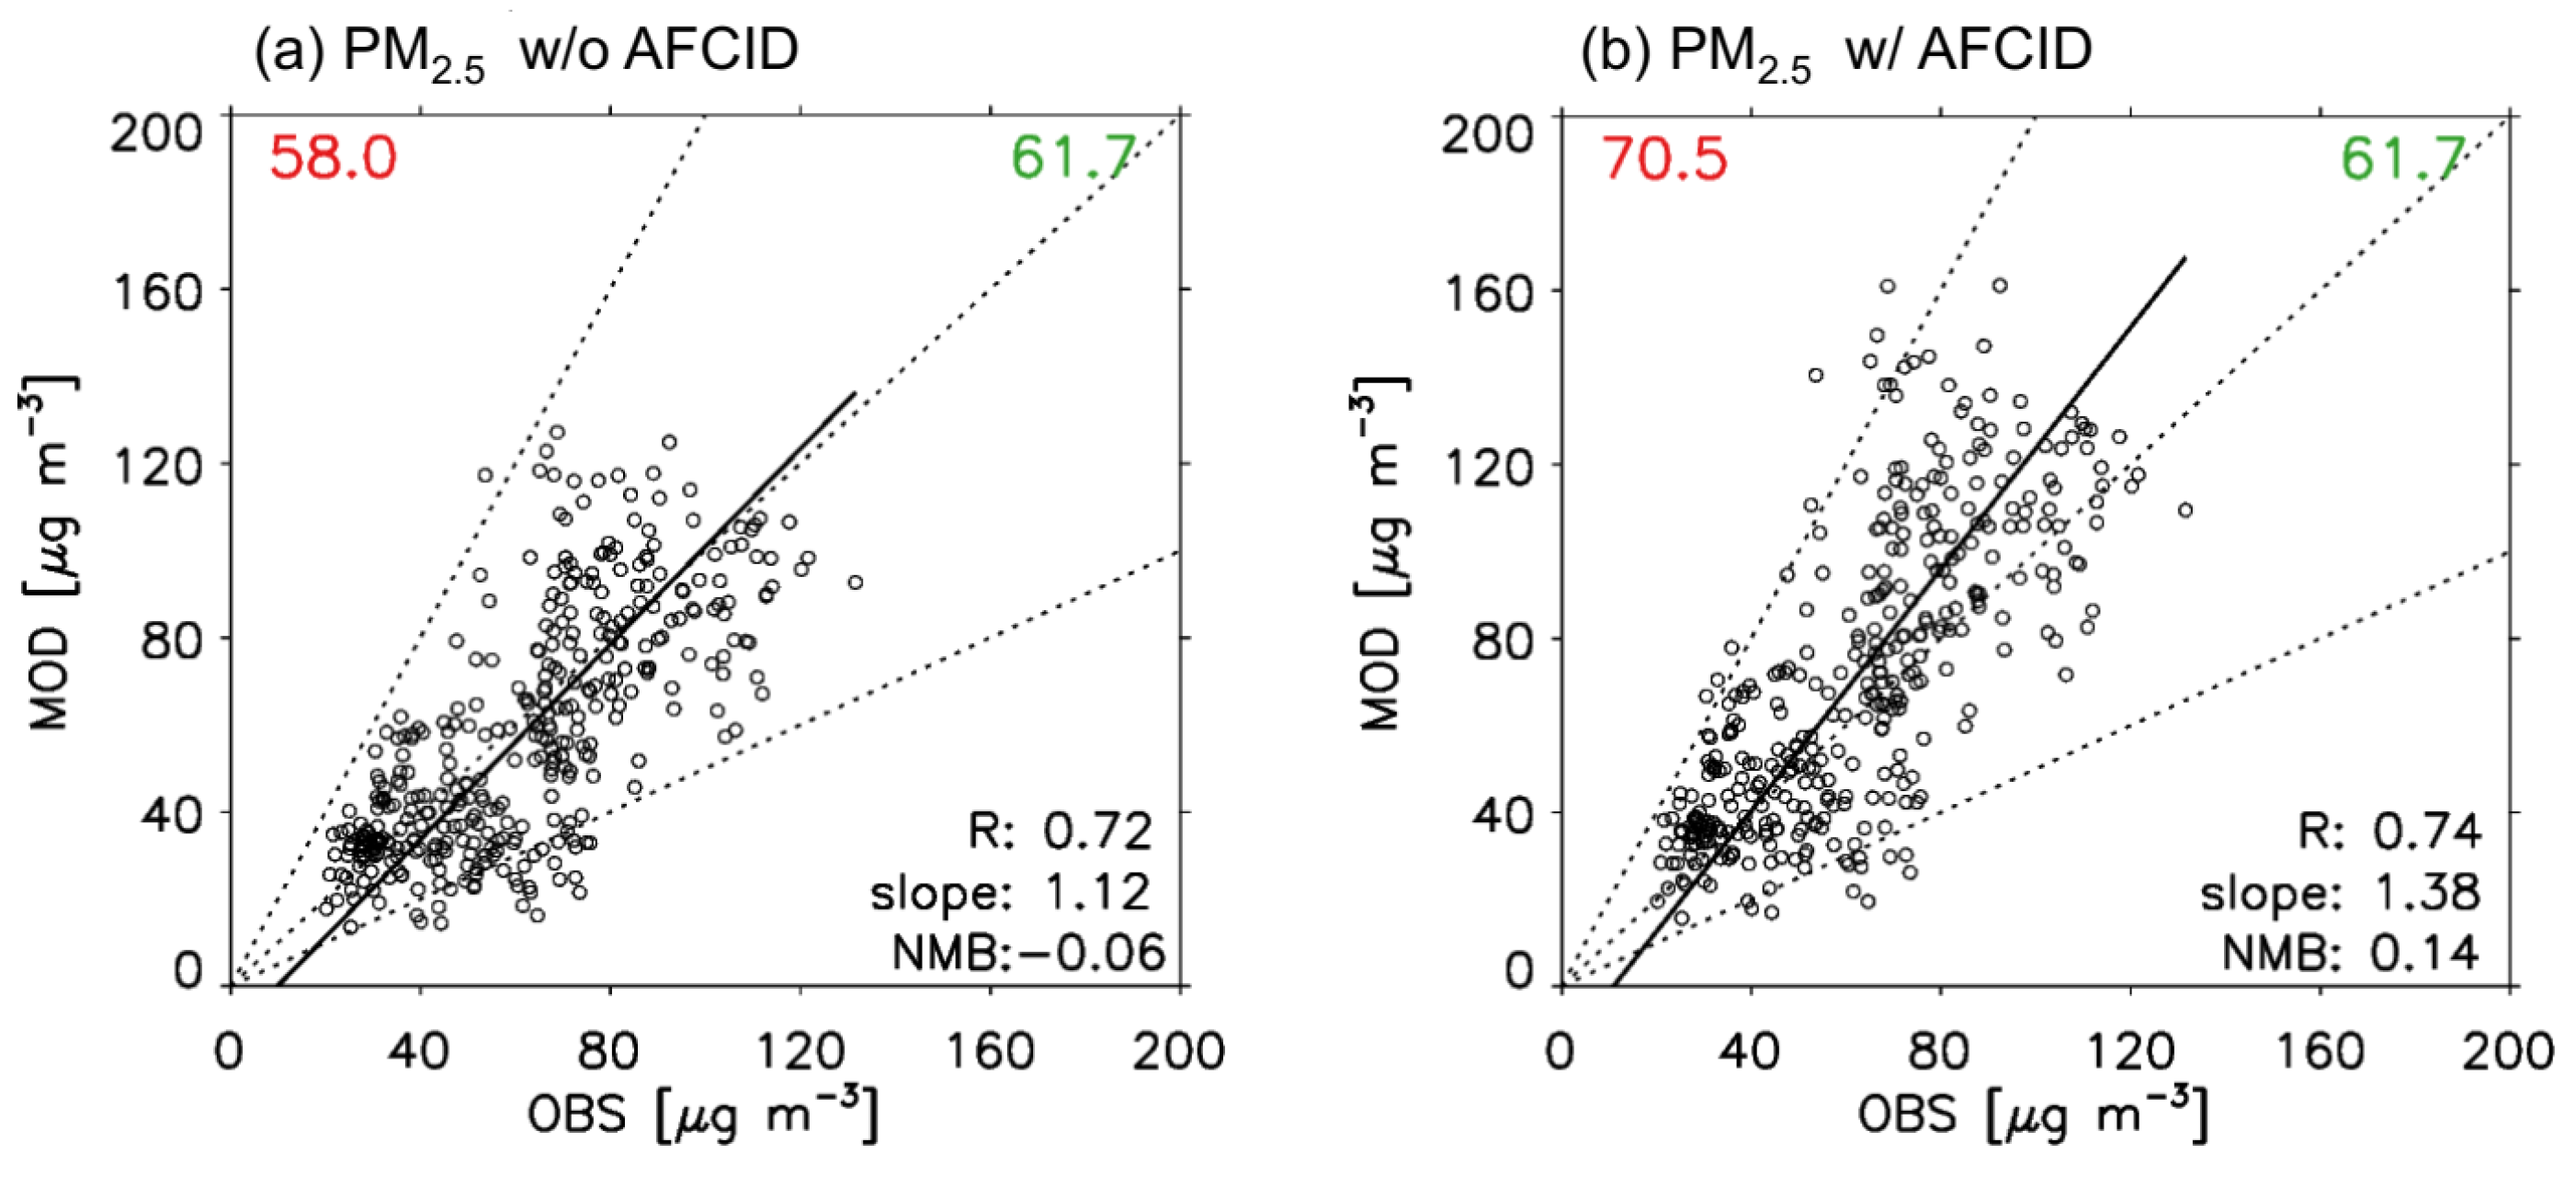
3.2. Implications of PM2.5 Analysis

In this study, we estimate the impacts of AFCID on PM10 concentrations in East Asia instead of on PM2.5. Since we only included the aerosols produced by AFCID emissions in PM2.5, the simulated PM2.5 and PM10 concentration increase due to AFCID emissions are the same. Figure 6 shows the scatter plots of PM2.5 concentrations with and without AFCID emissions. Unlike the improvement of simulated PM10 concentration by AFCID, the simulated PM2.5 is higher (NMB and slope increases from −6% to 14% and from 1.12 to 1.38, respectively).
It is difficult to make a direct comparison between the modeled and observed PM2.5 concentrations in the surface air over East Asia. Figure 7 shows the ratio between observed and simulated PM2.5 vs. PM10 concentrations in winter over East Asia. The observed PM2.5 mass concentration accounts for about 60% of PM10 concentration (Figure 7a), and observations indicate that 40% of PM10 is distributed in coarse-mode between 2.5 μm and 10 μm. This ratio is similar to several previous observations [41,42,43], however in the model, the PM2.5 concentration accounts for about 96% of PM10 (Figure 7b) because we consider the simulated PM2.5 concentrations to include BC, OC, ammonium, sulfate, nitrate, AFCID, and find-mode natural dust, and sea salt. To compare, the simulated PM10 concentration only includes coarse-mode dust and sea salt aerosols in addition to the modeled PM2.5 concentrations. Previous observations suggest that sulfate, nitrate, and organic carbon aerosols are observed in coarse-mode particles larger than 2.5 μm [44,45]. These observations are more frequent in winter than in summer [45]. GEOS-Chem uses a bulk aerosol technique that calculates only mass concentrations to simulate secondary inorganic and carbonaceous aerosols, and therefore it is difficult to calculate the fine-mode and coarse-mode particles separately. More accurate simulations of secondary inorganic and carbonaceous aerosols in coarse-mode particles require the use of a moving sectional and moment-based approach.
In order to improve the ratio between the simulated PM2.5 and PM10 concentrations, we perform a simple sensitivity analysis by assigning simulated AFCID concentrations. By assigning simulated AFCID concentrations to coarse-mode bins between 2.5 μm and 10 μm instead of the fine-mode bin, the ratio between simulated PM2.5 and PM10 concentrations is significantly improved (Figure 7c). This assumption that all AFCIDs are distributed in the coarse-mode is exaggerated, and thus, physical loss processes such as dry deposition are sensitively dependent on the size of the AFCID. However, a simple sensitivity analysis suggests that AFCID physical properties should be better quantified to improve PM air quality forecasts, and further study is needed for detailed size information of AFCID in the model.
In addition, a recent emission inventory study by Zheng et al. [15] suggested that the total amount of PM2.5 and PM10 emissions from China as of 2016 was 8.1 Tg year−1 and 10.8 Tg year−1, respectively. These results indicate that the difference between PM2.5 and PM10 emissions, 2.7 Tg year−1, is most likely to be AFCID in coarse-mode, which is expected to improve the simulated PM10 concentration.

4. Summary and Discussion

In order to clearly estimate the effects of aerosols on air quality and human health, it is important to completely understand the major sources. In this study, we used a nested version of GEOS-Chem and the latest AFCID emissions to estimate the impacts of AFCID on winter air quality in East Asia for November 2015–March 2016. First, we evaluated the model with and without AFCID emissions by comparing against observed PM10 concentrations in surface air in China and South Korea. The results indicate that AFCID reduced the bias of model surface PM10 concentration from −40% to −28%. We found that AFCID increased the winter PM10 concentrations in eastern China by 17.9 μg m−3 (17%) and up to 45 μg m−3 (36%). AFCID also increased the PM10 concentrations in South Korea by 3.1 μg m−3 (8.9%), of which 2.3 μg m−3 (6.7%) was contributed by China while 0.6 μg m−3 (1.5%) was contributed by local sources in South Korea. These results imply that AFCID emitted from China has a significant impact not only on China but also on the downwind regions. Our findings indicate that the aerosol concentration increased by AFCID is higher than that in a previous study [19], which means that AFCID plays an essential role in winter air quality. We further suggest that global and regional chemical transport models should include AFCID emissions in aerosol simulations.
Although AFCID improves the simulated PM10 concentrations in winter in East Asia, there is still a gap between observed and modeled PM2.5 and PM10 concentrations. In this regard, we suggest that the overestimation of model PM2.5 concentrations may contribute to coarse-mode nitrate and OC aerosols. Moreover, AFCID size distribution and emissions in coarse-mode will improve the simulated PM2.5 and PM10 concentrations. Therefore, it is necessary to better quantify the source and physical properties of AFCID to improve PM air quality forecasts.

Author Contributions

Writing—original draft, J.I.J.; Writing—review and editing, R.J.P.

Funding

This work was supported by Korea Environment Industry & Technology Institute (KEITI) through Public Technology Program based on Environmental Policy Program, funded by Korea Ministry of Environment (MOE) (2019000160002).

Acknowledgments

The authors are grateful to two anonymous reviewers for their valuable comments.

Conflicts of Interest

The authors declare no conflict of interest.

References

  1. Choi, J.; Park, R.J.; Lee, H.M.; Lee, S.; Jo, D.S.; Jeong, J.I.; Henze, D.K.; Woo, J.H.; Ban, S.J.; Lee, M.D.; et al. Impacts of local vs. trans-boundary emissions from different sectors on PM2.5 exposure in South Korea during the KORUS-AQ campaign. Atmos. Environ. 2019, 203, 196–205. [Google Scholar] [CrossRef]
  2. Lee, S.; Kim, J.; Choi, M.; Hong, J.; Lim, H.; Eck, T.F.; Holben, B.N.; Ahn, J.Y.; Kim, J.; Koo, J.H. Analysis of long-range transboundary transport (LRTT) effect on Korean aerosol pollution during the KORUS-AQ campaign. Atmos. Environ. 2019, 204, 53–67. [Google Scholar] [CrossRef]
  3. Song, C.; He, J.; Wu, L.; Jin, T.; Chen, X.; Li, R.; Ren, P.; Zhang, L.; Mao, H. Health burden attributable to ambient PM2.5 in China. Environ. Pollut. 2017, 223, 575–586. [Google Scholar] [CrossRef] [PubMed]
  4. West, J.J.; Cohen, A.; Dentener, F.; Brunekreef, B.; Zhu, T.; Armstrong, B.; Bell, M.L.; Brauer, M.; Carmichael, G.; Costa, D.L.; et al. What We Breathe Impacts Our Health: Improving Understanding of the Link between Air Pollution and Health. Environ. Sci. Technol. 2016, 50, 4895–4904. [Google Scholar] [CrossRef]
  5. Cohen, A.J.; Brauer, M.; Burnett, R.; Anderson, H.R.; Frostad, J.; Estep, K.; Balakrishnan, K.; Brunekreef, B.; Dandona, L.; Dandona, R.; et al. Estimates and 25-year trends of the global burden of disease attributable to ambient air pollution: An analysis of data from the Global Burden of Diseases Study 2015. Lancet 2017, 389, 1907–1918. [Google Scholar] [CrossRef] [Green Version]
  6. Liu, F.; Zhang, Q.; Van Der, A.R.J.; Zheng, B.; Tong, D.; Yan, L.; Zheng, Y.; He, K. Recent reduction in NO x emissions over China: Synthesis of satellite observations and emission inventories. Environ. Res. Lett. 2016, 11. [Google Scholar] [CrossRef] [Green Version]
  7. Zhang, J.; Reid, J.S.; Alfaro-Contreras, R.; Xian, P. Has China been exporting less particulate air pollution over the past decade? Geophys. Res. Lett. 2017, 44, 2941–2948. [Google Scholar] [CrossRef]
  8. Zhao, B.; Jiang, J.H.; Gu, Y.; Diner, D.; Worden, J.; Liou, K.N.; Su, H.; Xing, J.; Garay, M.; Huang, L. Decadal-scale trends in regional aerosol particle properties and their linkage to emission changes. Environ. Res. Lett. 2017, 12. [Google Scholar] [CrossRef]
  9. Zheng, B.; Chevallier, F.; Ciais, P.; Yin, Y.; Deeter, M.N.; Worden, H.M.; Wang, Y.; Zhang, Q.; He, K. Rapid decline in carbon monoxide emissions and export from East Asia between years 2005 and 2016. Environ. Res. Lett. 2018, 13. [Google Scholar] [CrossRef] [Green Version]
  10. Li, Z.; Guo, J.; Ding, A.; Liao, H.; Liu, J.; Sun, Y.; Wang, T.; Xue, H.; Zhang, H.; Zhu, B. Aerosol and boundary-layer interactions and impact on air quality. Natl. Sci. Rev. 2017, 4, 810–833. [Google Scholar] [CrossRef]
  11. Liu, T.; Gong, S.; He, J.; Yu, M.; Wang, Q.; Li, H.; Liu, W.; Zhang, J.; Li, L.; Wang, X.; et al. Attributions of meteorological and emission factors to the 2015 winter severe haze pollution episodes in China’s Jing-Jin-Ji area. Atmos. Chem. Phys. 2017, 17, 2971–2980. [Google Scholar] [CrossRef] [Green Version]
  12. Song, C.; Wu, L.; Xie, Y.; He, J.; Chen, X.; Wang, T.; Lin, Y.; Jin, T.; Wang, A.; Liu, Y.; et al. Air pollution in China: Status and spatiotemporal variations. Environ. Pollut. 2017, 227, 334–347. [Google Scholar] [CrossRef] [PubMed]
  13. Huneeus, N.; Schulz, M.; Balkanski, Y.; Griesfeller, J.; Prospero, J.; Kinne, S.; Bauer, S.; Boucher, O.; Chin, M.; Dentener, F.; et al. Global dust model intercomparison in AeroCom phase i. Atmos. Chem. Phys. 2011, 11, 7781–7816. [Google Scholar] [CrossRef] [Green Version]
  14. Myhre, G.; Samset, B.H.; Schulz, M.; Balkanski, Y.; Bauer, S.; Berntsen, T.K.; Bian, H.; Bellouin, N.; Chin, M.; Diehl, T.; et al. Radiative forcing of the direct aerosol effect from AeroCom Phase II simulations. Atmos. Chem. Phys. 2013, 13, 1853–1877. [Google Scholar] [CrossRef] [Green Version]
  15. Zheng, B.; Tong, D.; Li, M.; Liu, F.; Hong, C.; Geng, G.; Li, H.; Li, X.; Peng, L.; Qi, J.; et al. Trends in China’s anthropogenic emissions since 2010 as the consequence of clean air actions. Atmos. Chem. Phys. 2018, 18, 14095–14111. [Google Scholar] [CrossRef] [Green Version]
  16. Klimont, Z.; Kupiainen, K.; Heyes, C.; Purohit, P.; Cofala, J.; Rafaj, P.; Borken-Kleefeld, J.; Schöpp, W. Global anthropogenic emissions of particulate matter including black carbon. Atmos. Chem. Phys. 2017, 17, 8681–8723. [Google Scholar] [CrossRef] [Green Version]
  17. Janssens-Maenhout, G.; Crippa, M.; Guizzardi, D.; Dentener, F.; Muntean, M.; Pouliot, G.; Keating, T.; Zhang, Q.; Kurokawa, J.; Wankmüller, R.; et al. HTAP-v2.2: A mosaic of regional and global emission grid maps for 2008 and 2010 to study hemispheric transport of air pollution. Atmos. Chem. Phys. 2015, 15, 11411–11432. [Google Scholar] [CrossRef] [Green Version]
  18. Qi, J.; Zheng, B.; Li, M.; Yu, F.; Chen, C.; Liu, F.; Zhou, X.; Yuan, J.; Zhang, Q.; He, K. A high-resolution air pollutants emission inventory in 2013 for the Beijing-Tianjin-Hebei region, China. Atmos. Environ. 2017, 170, 156–168. [Google Scholar] [CrossRef]
  19. Philip, S.; Martin, R.V.; Snider, G.; Weagle, C.L.; Van Donkelaar, A.; Brauer, M.; Henze, D.K.; Klimont, Z.; Venkataraman, C.; Guttikunda, S.K.; et al. Anthropogenic fugitive, combustion and industrial dust is a significant, underrepresented fine particulate matter source in global atmospheric models. Environ. Res. Lett. 2017, 12. [Google Scholar] [CrossRef]
  20. Weagle, C.L.; Snider, G.; Li, C.; Van Donkelaar, A.; Philip, S.; Bissonnette, P.; Burke, J.; Jackson, J.; Latimer, R.; Stone, E.; et al. Global Sources of Fine Particulate Matter: Interpretation of PM2.5 Chemical Composition Observed by SPARTAN using a Global Chemical Transport Model. Environ. Sci. Technol. 2018, 52, 11670–11681. [Google Scholar] [CrossRef]
  21. Zhang, L.; Liu, L.; Zhao, Y.; Gong, S.; Zhang, X.; Henze, D.K.; Capps, S.L.; Fu, T.-M.; Zhang, Q.; Wang, Y. Source attribution of particulate matter pollution over North China with the adjoint method. Environ. Res. Lett. 2015, 10. [Google Scholar] [CrossRef]
  22. Kurokawa, J.; Ohara, T.; Morikawa, T.; Hanayama, S.; Janssens-Maenhout, G.; Fukui, T.; Kawashima, K.; Akimoto, H. Emissions of air pollutants and greenhouse gases over Asian regions during 2000–2008: Regional Emission inventory in ASia (REAS) version 2. Atmos. Chem. Phys. 2013, 13, 11019–11058. [Google Scholar] [CrossRef] [Green Version]
  23. Park, R.J.; Jacob, D.J.; Chin, M.; Martin, R.V. Sources of carbonaceous aerosols over the United States and implications for natural visibility. J. Geophys. Res. Atmos. 2003, 108. [Google Scholar] [CrossRef]
  24. Park, R.J.; Jacob, D.J.; Field, B.D.; Yantosca, R.M.; Chin, M. Natural and transboundary pollution influences on sulfate-nitrate-ammonium aerosols in the United States: Implications for policy. J. Geophys. Res. Atmos. 2004, 109. [Google Scholar] [CrossRef]
  25. Alexander, B.; Park, R.J.; Jacob, D.J.; Li, Q.B.; Yantosca, R.M.; Savarino, J.; Lee, C.C.W.; Thiemens, M.H. Sulfate formation in sea-salt aerosols: Constraints from oxygen isotopes. J. Geophys. Res. Atmos. 2005, 110, 1–12. [Google Scholar] [CrossRef]
  26. Fairlie, T.D.; Jacob, D.J.; Park, R.J. The impact of transpacific transport of mineral dust in the United States. Atmos. Environ. 2007, 41, 1251–1266. [Google Scholar] [CrossRef]
  27. Kim, P.S.; Jacob, D.J.; Fisher, J.A.; Travis, K.; Yu, K.; Zhu, L.; Yantosca, R.M.; Sulprizio, M.P.; Jimenez, J.L.; Campuzano-Jost, P.; et al. Sources, seasonality, and trends of southeast US aerosol: An integrated analysis of surface, aircraft, and satellite observations with the GEOS-Chem chemical transport model. Atmos. Chem. Phys. 2015, 15, 10411–10433. [Google Scholar] [CrossRef] [Green Version]
  28. Hayes, P.L.; Carlton, A.G.; Baker, K.R.; Ahmadov, R.; Washenfelder, R.A.; Alvarez, S.; Rappenglück, B.; Gilman, J.B.; Kuster, W.C.; De Gouw, J.A.; et al. Modeling the formation and aging of secondary organic aerosols in Los Angeles during CalNex 2010. Atmos. Chem. Phys. 2015, 15, 5773–5801. [Google Scholar] [CrossRef] [Green Version]
  29. Fountoukis, C.; Nenes, A. ISORROPIAII: A computationally efficient thermodynamic equilibrium model for K+-Ca2+-Mg2+-NH4 +-Na+-SO4 2−-NO3 -Cl-H2O aerosols. Atmos. Chem. Phys. 2007, 7, 4639–4659. [Google Scholar] [CrossRef] [Green Version]
  30. Zender, C.S.; Bian, H.; Newman, D. Mineral Dust Entrainment and Deposition (DEAD) model: Description and 1990s dust climatology. J. Geophys. Res. Atmos. 2003, 108. [Google Scholar] [CrossRef] [Green Version]
  31. Chin, M.; Ginoux, P.; Kinne, S.; Torres, O.; Holben, B.N.; Duncan, B.N.; Martin, R.V.; Logan, J.A.; Higurashi, A.; Nakajima, T. Tropospheric aerosol optical thickness from the GOCART model and comparisons with satellite and sun photometer measurements. J. Atmos. Sci. 2002, 59, 461–483. [Google Scholar] [CrossRef]
  32. Ginoux, P.; Chin, M.; Tegen, I.; Prospero, J.M.; Holben, B.; Dubovik, O.; Lin, S.J. Sources and distributions of dust aerosols simulated with the GOCART model. J. Geophys. Res. Atmos. 2001, 106, 20255–20273. [Google Scholar] [CrossRef]
  33. Gong, S.L. A parameterization of sea-salt aerosol source function for sub- and super-micron particles. Glob. Biogeochem. Cycles 2003, 17. [Google Scholar] [CrossRef]
  34. Zhang, L.M.; Gong, S.L.; Padro, J.; Barrie, L. A size-segregated particle dry deposition scheme for an atmospheric aerosol module. Atmos. Environ. 2001, 35, 549–560. [Google Scholar] [CrossRef]
  35. Liu, H.; Jacob, D.J.; Bey, I.; Yantosca, R.M. Constraints from 210Pb and 7Be on wet deposition and transport in a global three-dimensional chemical tracer model driven by assimilated meteorological fields. J. Geophys. Res. Atmos. 2001, 106, 12109–12128. [Google Scholar] [CrossRef] [Green Version]
  36. Woo, J.H.; Choi, K.C.; Kim, H.K.; Baek, B.H.; Jang, M.; Eum, J.H.; Song, C.H.; Ma, Y.I.; Sunwoo, Y.; Chang, L.S.; et al. Development of an anthropogenic emissions processing system for Asia using SMOKE. Atmos. Environ. 2012, 58, 5–13. [Google Scholar] [CrossRef]
  37. Jang, Y.; Lee, Y.; Kim, J.; Kim, Y.; Woo, J.H. Improvement China Point Source for Improving Bottom-Up Emission Inventory. Asia Pac. J. Atmos. Sci. 2019, 1–12. [Google Scholar] [CrossRef]
  38. Giglio, L.; Randerson, J.T.; Van Der Werf, G.R. Analysis of daily, monthly, and annual burned area using the fourth-generation global fire emissions database (GFED4). J. Geophys. Res. Biogeosciences 2013, 118, 317–328. [Google Scholar] [CrossRef] [Green Version]
  39. Guenther, A.B.; Jiang, X.; Heald, C.L.; Sakulyanontvittaya, T.; Duhl, T.; Emmons, L.K.; Wang, X. The model of emissions of gases and aerosols from nature version 2.1 (MEGAN2.1): An extended and updated framework for modeling biogenic emissions. Geosci. Model Dev. 2012, 5, 1471–1492. [Google Scholar] [CrossRef] [Green Version]
  40. Hu, L.; Jacob, D.J.; Liu, X.; Zhang, Y.; Zhang, L.; Kim, P.S.; Sulprizio, M.P.; Yantosca, R.M. Global budget of tropospheric ozone: Evaluating recent model advances with satellite (OMI), aircraft (IAGOS), and ozonesonde observations. Atmos. Environ. 2017, 167, 323–334. [Google Scholar] [CrossRef]
  41. Hu, J.; Wang, Y.; Ying, Q.; Zhang, H. Spatial and temporal variability of PM2.5 and PM10 over the North China Plain and the Yangtze River Delta, China. Atmos. Environ. 2014, 95, 598–609. [Google Scholar] [CrossRef]
  42. Wang, P.; Cao, J.; Tie, X.; Wang, G.; Li, G.; Hu, T.; Wu, Y.; Xu, Y.; Xu, G.; Zhao, Y.; et al. Impact of meteorological parameters and gaseous pollutants on PM2.5 and PM10 mass concentrations during 2010 in Xi’an, China. Aerosol Air Qual. Res. 2015, 15, 1844–1854. [Google Scholar] [CrossRef] [Green Version]
  43. Xu, G.; Jiao, L.; Zhang, B.; Zhao, S.; Yuan, M.; Gu, Y.; Liu, J.; Tang, X. Spatial and temporal variability of the PM2.5/PM10 ratio in Wuhan, Central China. Aerosol Air Qual. Res. 2017, 17, 741–751. [Google Scholar] [CrossRef] [Green Version]
  44. Lim, S.; Lee, M.; Lee, G.; Kim, S.; Yoon, S.; Kang, K. Ionic and carbonaceous compositions of PM10, PM2.5 and PM1.0 at Gosan ABC Superstation and their ratios as source signature. Atmos. Chem. Phys. 2012, 12, 2007–2024. [Google Scholar] [CrossRef] [Green Version]
  45. Liu, Z.; Xie, Y.; Hu, B.; Wen, T.; Xin, J.; Li, X.; Wang, Y. Size-resolved aerosol water-soluble ions during the summer and winter seasons in Beijing: Formation mechanisms of secondary inorganic aerosols. Chemosphere 2017, 183, 119–131. [Google Scholar] [CrossRef]
Figure 1. Spatial distributions of annual AFCID emissions from KU-CREATE for (a) 2015 and (b) 2016, and (c) time series of monthly AFCID emissions over East Asia (20−50° N, 100−140° E) for 2015 (blue line) and 2016 (red line).
Atmosphere 10 00790 g001
Figure 2. Observed and simulated PM10 concentrations in surface air for (a) without, and (b) with AFCID emissions over East Asia in the winter season (January−March 2016). Scatter plots of the observed and simulated surface PM10 concentrations for (c) without, and (d) with AFCID emissions over China and South Korea in the winter season (January−March 2016). The observed (green) and simulated (red) mean values are shown in the upper right and left corner of each panel, respectively. The 1:1, 1:2, and 2:1 lines are inset. The correlation coefficient (R), slope, and normalized mean bias (NMB) are shown inset.
Atmosphere 10 00790 g002
Figure 3. Spatial distributions of the enhancements of (a) concentration (μg m−3), and (b) percentage (%) of surface PM10 due to AFCID in the winter season (November 2015−March 2016) over East Asia.
Atmosphere 10 00790 g003
Figure 4. Enhancement (μg m−3) of PM10 concentrations due to AFCID emissions from (a) all sources, (b) China, (c) the rest of the world (RoW), and (d) South Korea in wintertime (November 2015−March 2016) over South Korea.
Atmosphere 10 00790 g004
Figure 5. Percentage enhancement (%) of PM10 concentrations due to AFCID emissions from (a) all sources, (b) China, (c) the rest of the world (RoW), and (d) South Korea in wintertime (November 2015−March 2016) over South Korea.
Atmosphere 10 00790 g005
Figure 6. Scatter plots of the observed and simulated surface PM2.5 concentrations for (a) without, and (b) with AFCID emissions over China and South Korea in the winter season (January−March 2016). The observed (green) and simulated (red) mean values are shown in the upper right and left corner of each panel, respectively. The 1:1, 1:2, and 2:1 lines are inset. The correlation coefficient (R), slope and normalized mean bias (NMB) are shown in inset.
Atmosphere 10 00790 g006
Figure 7. Scatter plots of the (a) observed and (b) simulated PM2.5 versus PM10 concentrations over China and South Korea in the winter season (January−March 2016). Simulated concentrations are sampled from model grids corresponding to the observation sites. (c) Scatter plots of the simulated PM2.5 and PM10 concentrations from the model with no AFCID emission. PM10 (green) and PM2.5 (red) mean values are shown in the upper right and left corner of each panel, respectively. The 1:1, 1:2, and 2:1 lines are inset. The correlation coefficient (R), slope and ratio between PM2.5 and PM10 are shown in inset.
Atmosphere 10 00790 g007

