Article

Temporal Changes in China’s Air Temperature Distribution and Its Impact on Hot Extreme Occurrence

1
School of Hydrology and Water Resources, Nanjing University of Information Science & Technology, Nanjing 210044, China
2
State Key Laboratory of Hydrology-Water Resources and Hydraulic Engineering, Hohai University, Nanjing 210098, China
3
Institute of Surface-Earth System Science, Tianjin University, Tianjin 300072, China
*
Authors to whom correspondence should be addressed.
Atmosphere 2019, 10(12), 748; https://doi.org/10.3390/atmos10120748
Submission received: 5 November 2019 / Revised: 22 November 2019 / Accepted: 23 November 2019 / Published: 27 November 2019
(This article belongs to the Section Meteorology)

Abstract

:
The likelihood of experiencing hot extremes has drastically increased due to global warming. Using 554 ground-based air temperature stations, changes in the number of hot days (NHD) in the Chinese mainland during 1960 to 2011 was investigated. We found that the NHD of the current period (1991–2011) was 70% higher than that of the base period (1960–1990). This NHD increment was attributed to the increased summer air temperature mean and its extended hot tail length—defined as the range of the mean and 90th percentile of summer air temperature. To distinguish the relative contribution of air temperature mean and hot tail length change to the NHD occurrence, a numerical-based frame work was proposed. Results showed that global warming (mean temperature increase) contributes approximately 75% of the total NHD increment. Although the average contribution of the hot tail length change is relatively small, it dominates the NHD change in regions where global warming is insignificant, e.g., the central part of China. Results suggest that frameworks and models that fail to capture the air temperature tail changes will result in biased low hot extreme occurrence estimations. This low bias would be particularly significant in regions where the mean temperature change is marginal. Hence, capturing the tail change should be the key model evaluation criterion in regions where the annual mean temperature change is relatively insignificant.

1. Introduction

Hot extreme occurrence has significantly increased in the past decades [1,2,3], and has caused tremendous economic losses and mortalities [4,5,6]. Environmental factors causing the hot extremes were investigated by previous studies. For instances, dry soils limit the latent heat flux and, hence, heatwaves can be triggered and intensified by soil moisture deficit (e.g., [7,8,9]). Atmospheric heat accumulation and blocking can also induce heatwaves [7,10].
Independent from these specific environmental triggers, human-induced global warming plays a crucial role in directly causing hot extreme events [11,12]. Extreme hot days are defined as days with air temperature exceeding certain thresholds. Therefore, global warming will increase the probability of exceeding these prescribed thresholds, which leads to an increased risk of experiencing hot days. For example, in July 2010 Moscow might not (80% probability) have experienced heatwaves without global warming [13]. Likewise, human-induced global warming doubled the risk of the Europe 2003 heatwave [14]. The analyses from different parts of the world showed the widespread significant changes in temperature extremes in the recent past, especially in the last few decades [15,16]. There is growing evidence that such extreme temperature events will become more frequent and more severe in the future [17,18].
Both recent model-based analyses and in-situ-based analyses confirmed an increasing trend of hot extreme occurrence in China [19,20], which was attributable to human activities [21]. Although the temporal mean air temperature change is a key contributor to the increased hot extremes in China, the increased variance of air temperature might also have significant impacts on the risk of hot extreme occurrence [22]. Provided the air temperature is normally distributed, an increased variance means the air temperature distribution has heavier tails, i.e., air temperature can vary over a broader range. Consequently, the increased air temperature variance/tail length can lead to the increasing probability of hot extreme occurrence. A recent study found that the long-term air temperature might not be normally distributed [23], which showed that the tails of the air temperature distribution could be significantly heavier than that of normal distribution. It implied that the likelihood of experiencing hot extremes might be much higher than the estimates, based on the air temperature variance.
Quantifying the relative contributions of the mean and hot tail change (defined as the range of mean and 90th percentile summer air temperature) to the hot extremes, has significant importance for understanding the impacts of global warming and evaluating current climate models. For instance, provided the likelihood of hot extreme occurrence is primarily attributed to the protracted tails of air temperature distribution, models that better capture the tails are more suitable for projecting future extreme event occurrences, and vice versa. Clearly, such analysis can be directly used to determine models and reanalyze systems for analyzing and predicting China’s hot extreme changes. Unfortunately, the change and the relative contributions of air temperature mean and tail length change to hot extreme occurrence probability are rarely reported.
The goal of this study was therefore to: (1) investigate the change of the mean and the hot tail length of air temperature distributions in the past decades; (2) quantify the relative contribution of the mean and the tail length change to the hot extreme occurrence change. This study focused on the Chinese mainland, and the long-term (1961–2011) high-quality, ground-based air temperature networks were used to analyze the hot extremes.

2. Methods and Data Collection

2.1. Air Temperature Data

The screen level (2-m) ground-based air temperature observations from 756 stations were provided by China Meteorological Data Service Center (CMDC). The air temperature data were available from 1960 to 2011 (http://data.cma.cn). The meteorological data were well quality-controlled, which aimed to provide reliable ground-based air temperature data for climate studies [24].
Several stations still contain missing values during the periods of air temperature station malfunction. To avoid the potential impacts of sampling size differences across stations, we limited ourselves to use stations where the summer (June to August) missing values were less than 5%, for both the base period (1960–1990) and the current period (1991–2011). In total, air temperature data collected from 554 stations were used. Note that all air temperature data were independently observed. Therefore, we assumed that air temperature statistics calculated from these 554 sites contained no cross-correlated errors.

2.2. Number of Extreme Hot Days (NHD)

Similar to the previous studies [9,25], the threshold temperature was defined as the 90th percentile of the base period (1960–1990) summer air temperature, at each station. Days with daily mean temperature exceeding this threshold value were defined as hot days. The number of hot days (NHD) was calculated as the annual mean of the number of the hot days during the current period (1991–2011, note as NHD-C), as well as the base period (1961–1991, note as NHD-B).

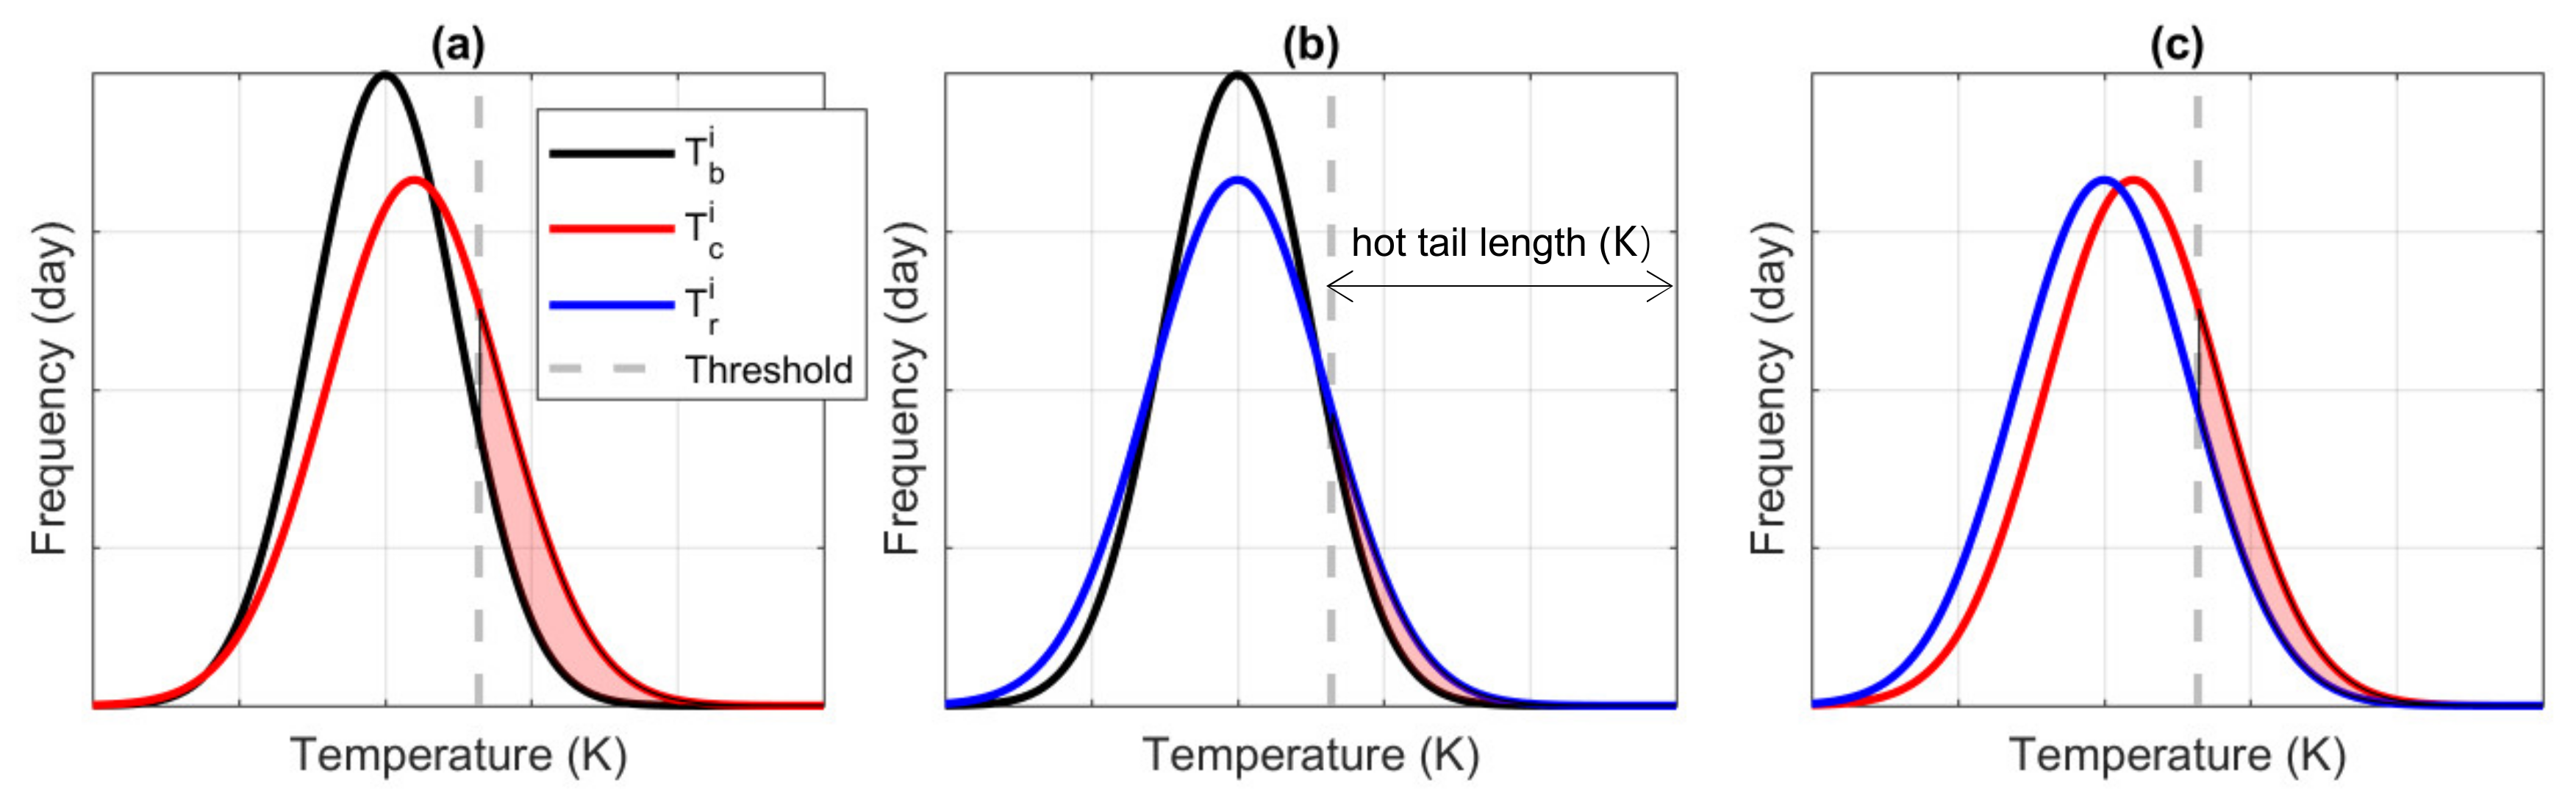
2.3. Decomposing the NHD Change Contributors

As noted above, the changed mean and the hot tail length of the summer temperatures were the key contributors of the NHD changes. Hence, in order to differentiate between these two contributors, we first need to define the mean and the hot tail length change between the current and the base period. In this study, the hot tail length was defined as the mean to 90th percentile range of long-term summer air temperature.
The mean summer temperature change was calculated as the difference of the annual mean summer temperature between the current (1991 to 2011) and the base period (1960–1990), for each station.
The hot tail length comparison essentially compared the shape change of the air temperature distribution between the two periods. To avoid assuming that air temperature follows certain probabilistic density distributions, we proposed a new concept to directly analyze tail length changes, using empirical sampling distributions. This was done by directly shifting the mean temperature of the current period to the base period:
T r , t i = T c , t i T c i ¯ + T b i ¯
where T r , t i is the created reference air temperature data at station i and time t; T c i ¯ and T b i ¯ are the mean air temperature of station i for the current and the base period, respectively. The hot tail length of T b i and T c i was calculated as the temperature range of 90th percentile and the maximum summer air temperature of the base and the current period, respectively.
Likewise, the NHD was calculated for each station using T r i , denoted as NHD-R. Figure 1 illustrates the NHD contribution decomposition using NHD-R. The change in NHD due to a change in the mean (presumably induced by global warming) was found by assuming no change in the shape of the distribution estimated in the current period but only due to a shift of the entire distribution. The remaining change was due to a modified shape, or change in hot tail length, and the sum of the two differences equals the total change in NHD, as illustrated in Figure 1.

3. Results

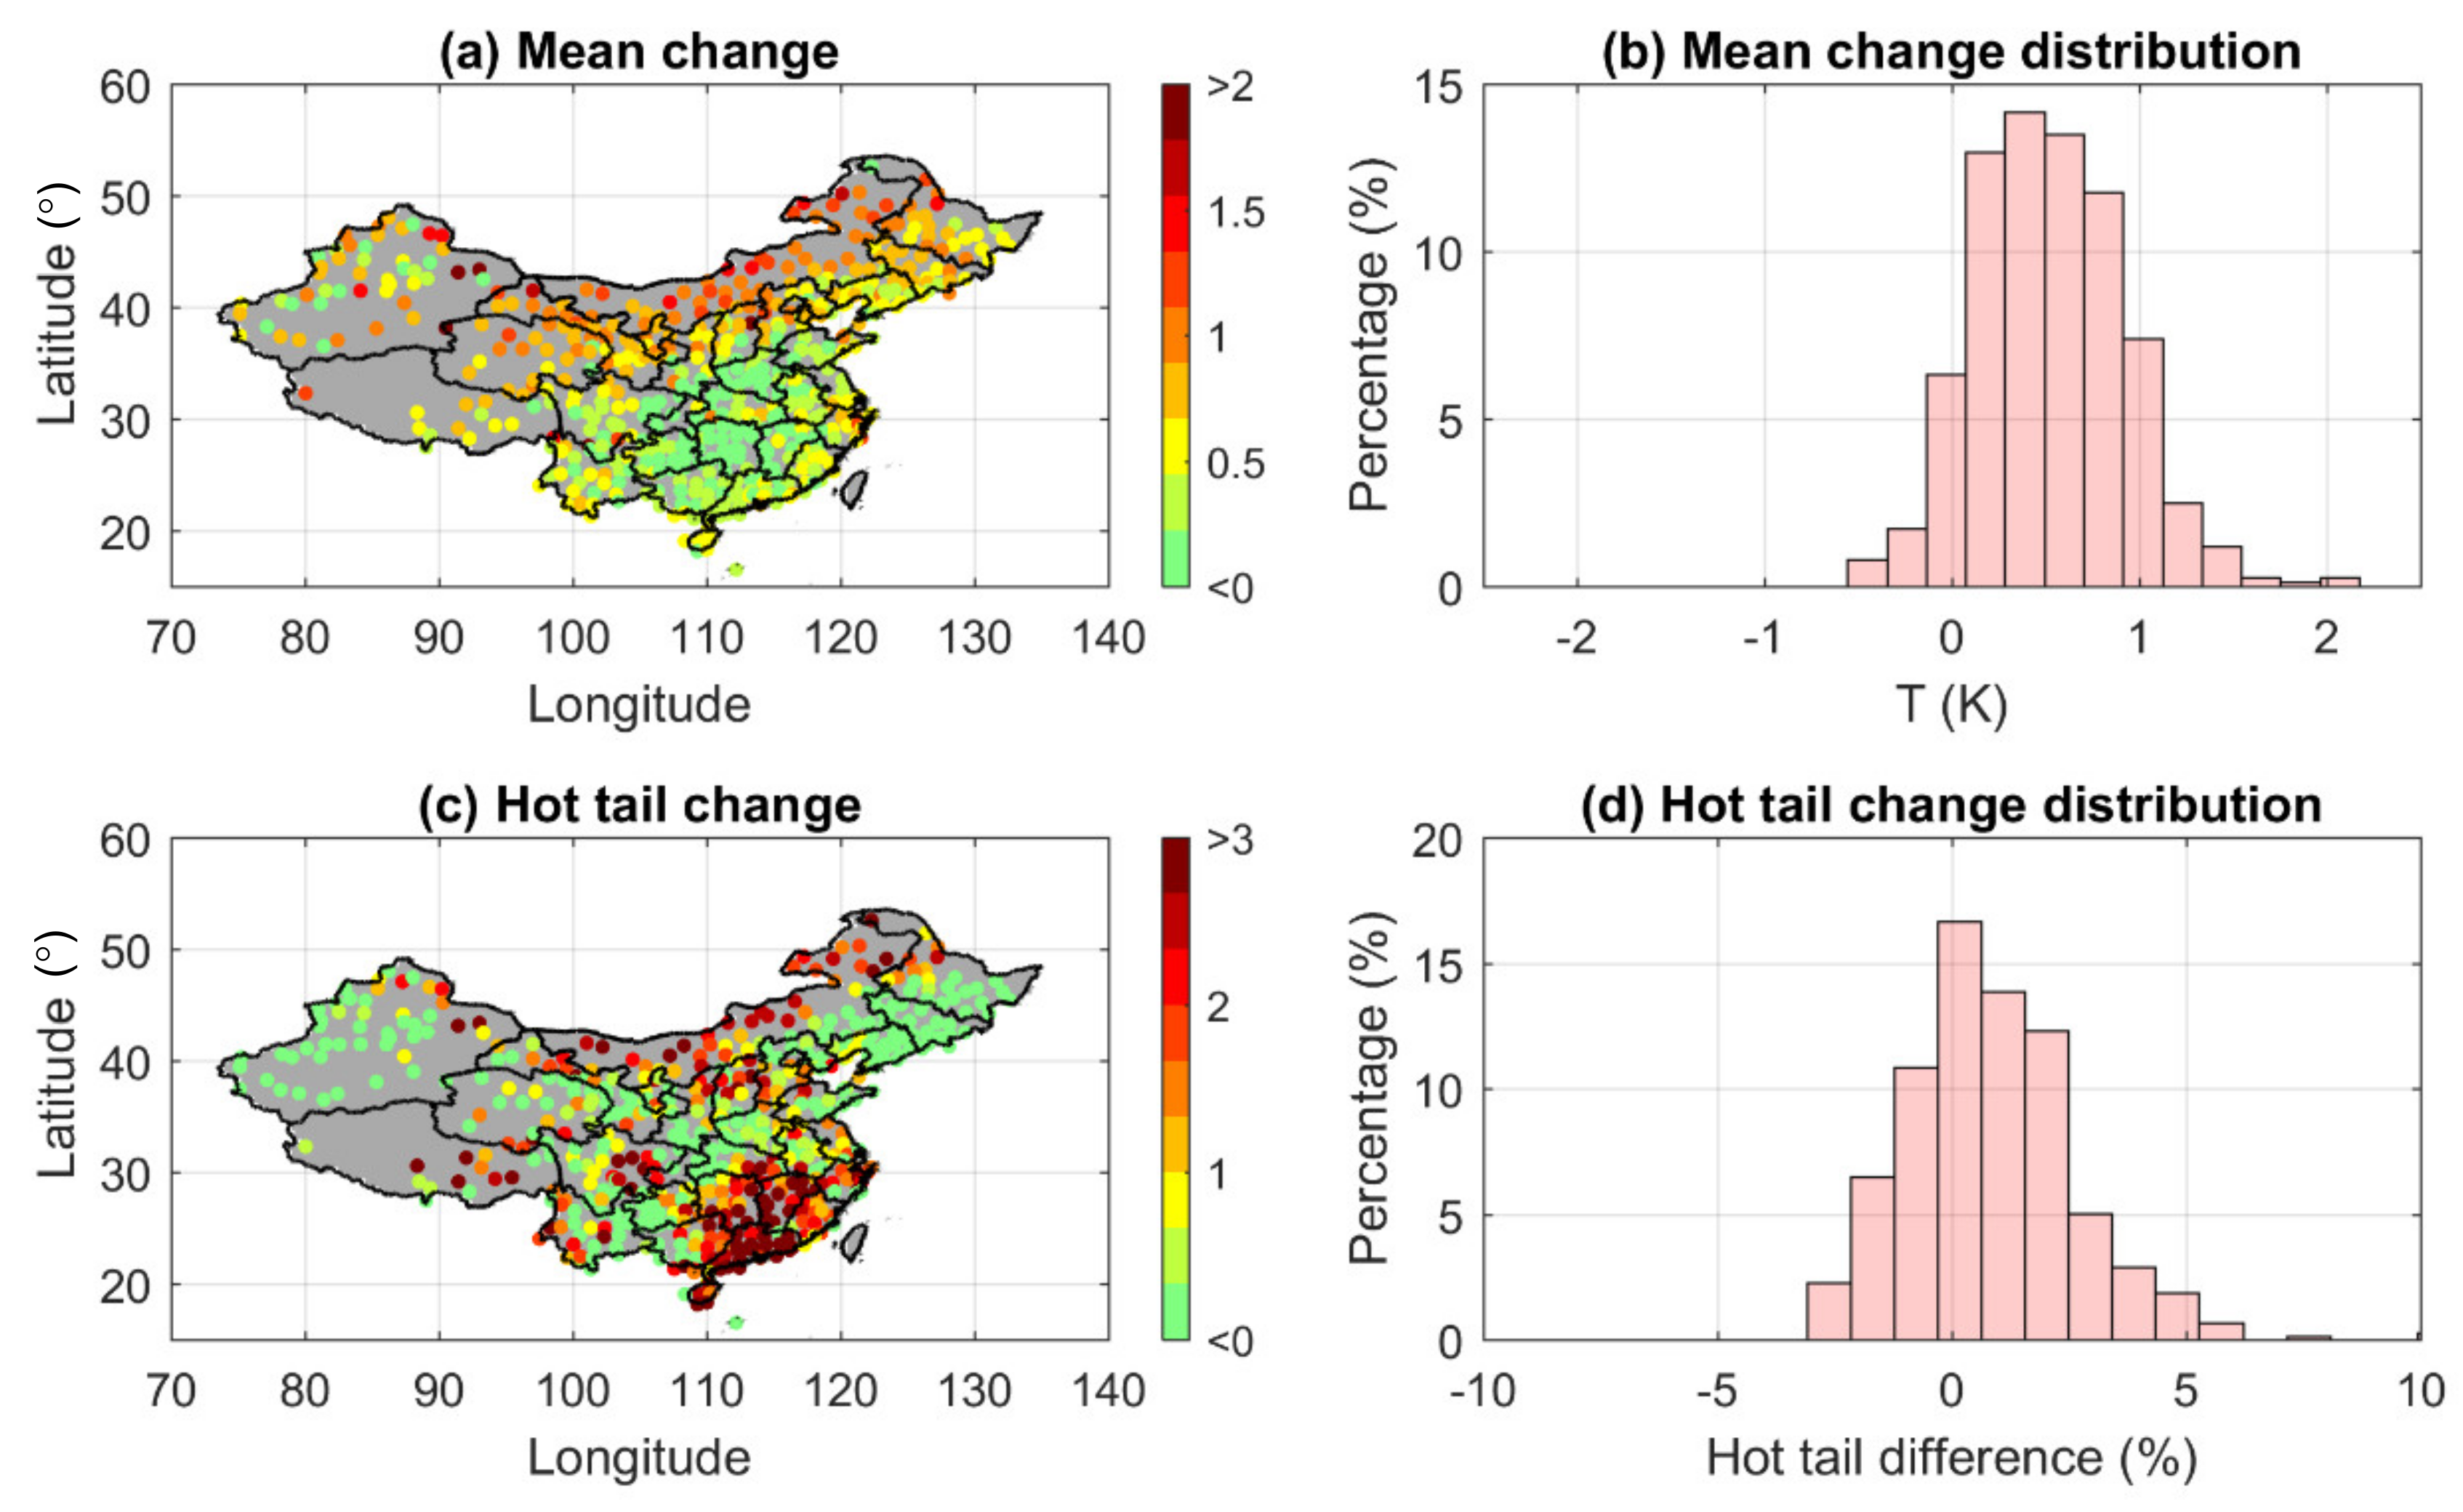
3.1. China’s Long-Term Air Temperature Distribution Change

The spatial variability of mean summer temperature increase is shown in Figure 2a. Generally, mean summer temperature increment decreases from north to south. The mean summer temperatures were mostly unchanged in the central part of China. On average, the summer mean temperature of 1991–2011 was 0.53 K higher than that of the base period (Figure 2b).
Figure 2c shows that the tails of the summer temperature distributions were substantially extended in the southern part of China and Inner Mongolia. Figure 2d represents 66% of the 554 stations that showed increased hot tail lengths in total. A paired t-test showed that the hot tail length of mean summer air temperature during 1991–2011 was significantly (p < 0.05) increased by 0.8 percent (Figure 2d).

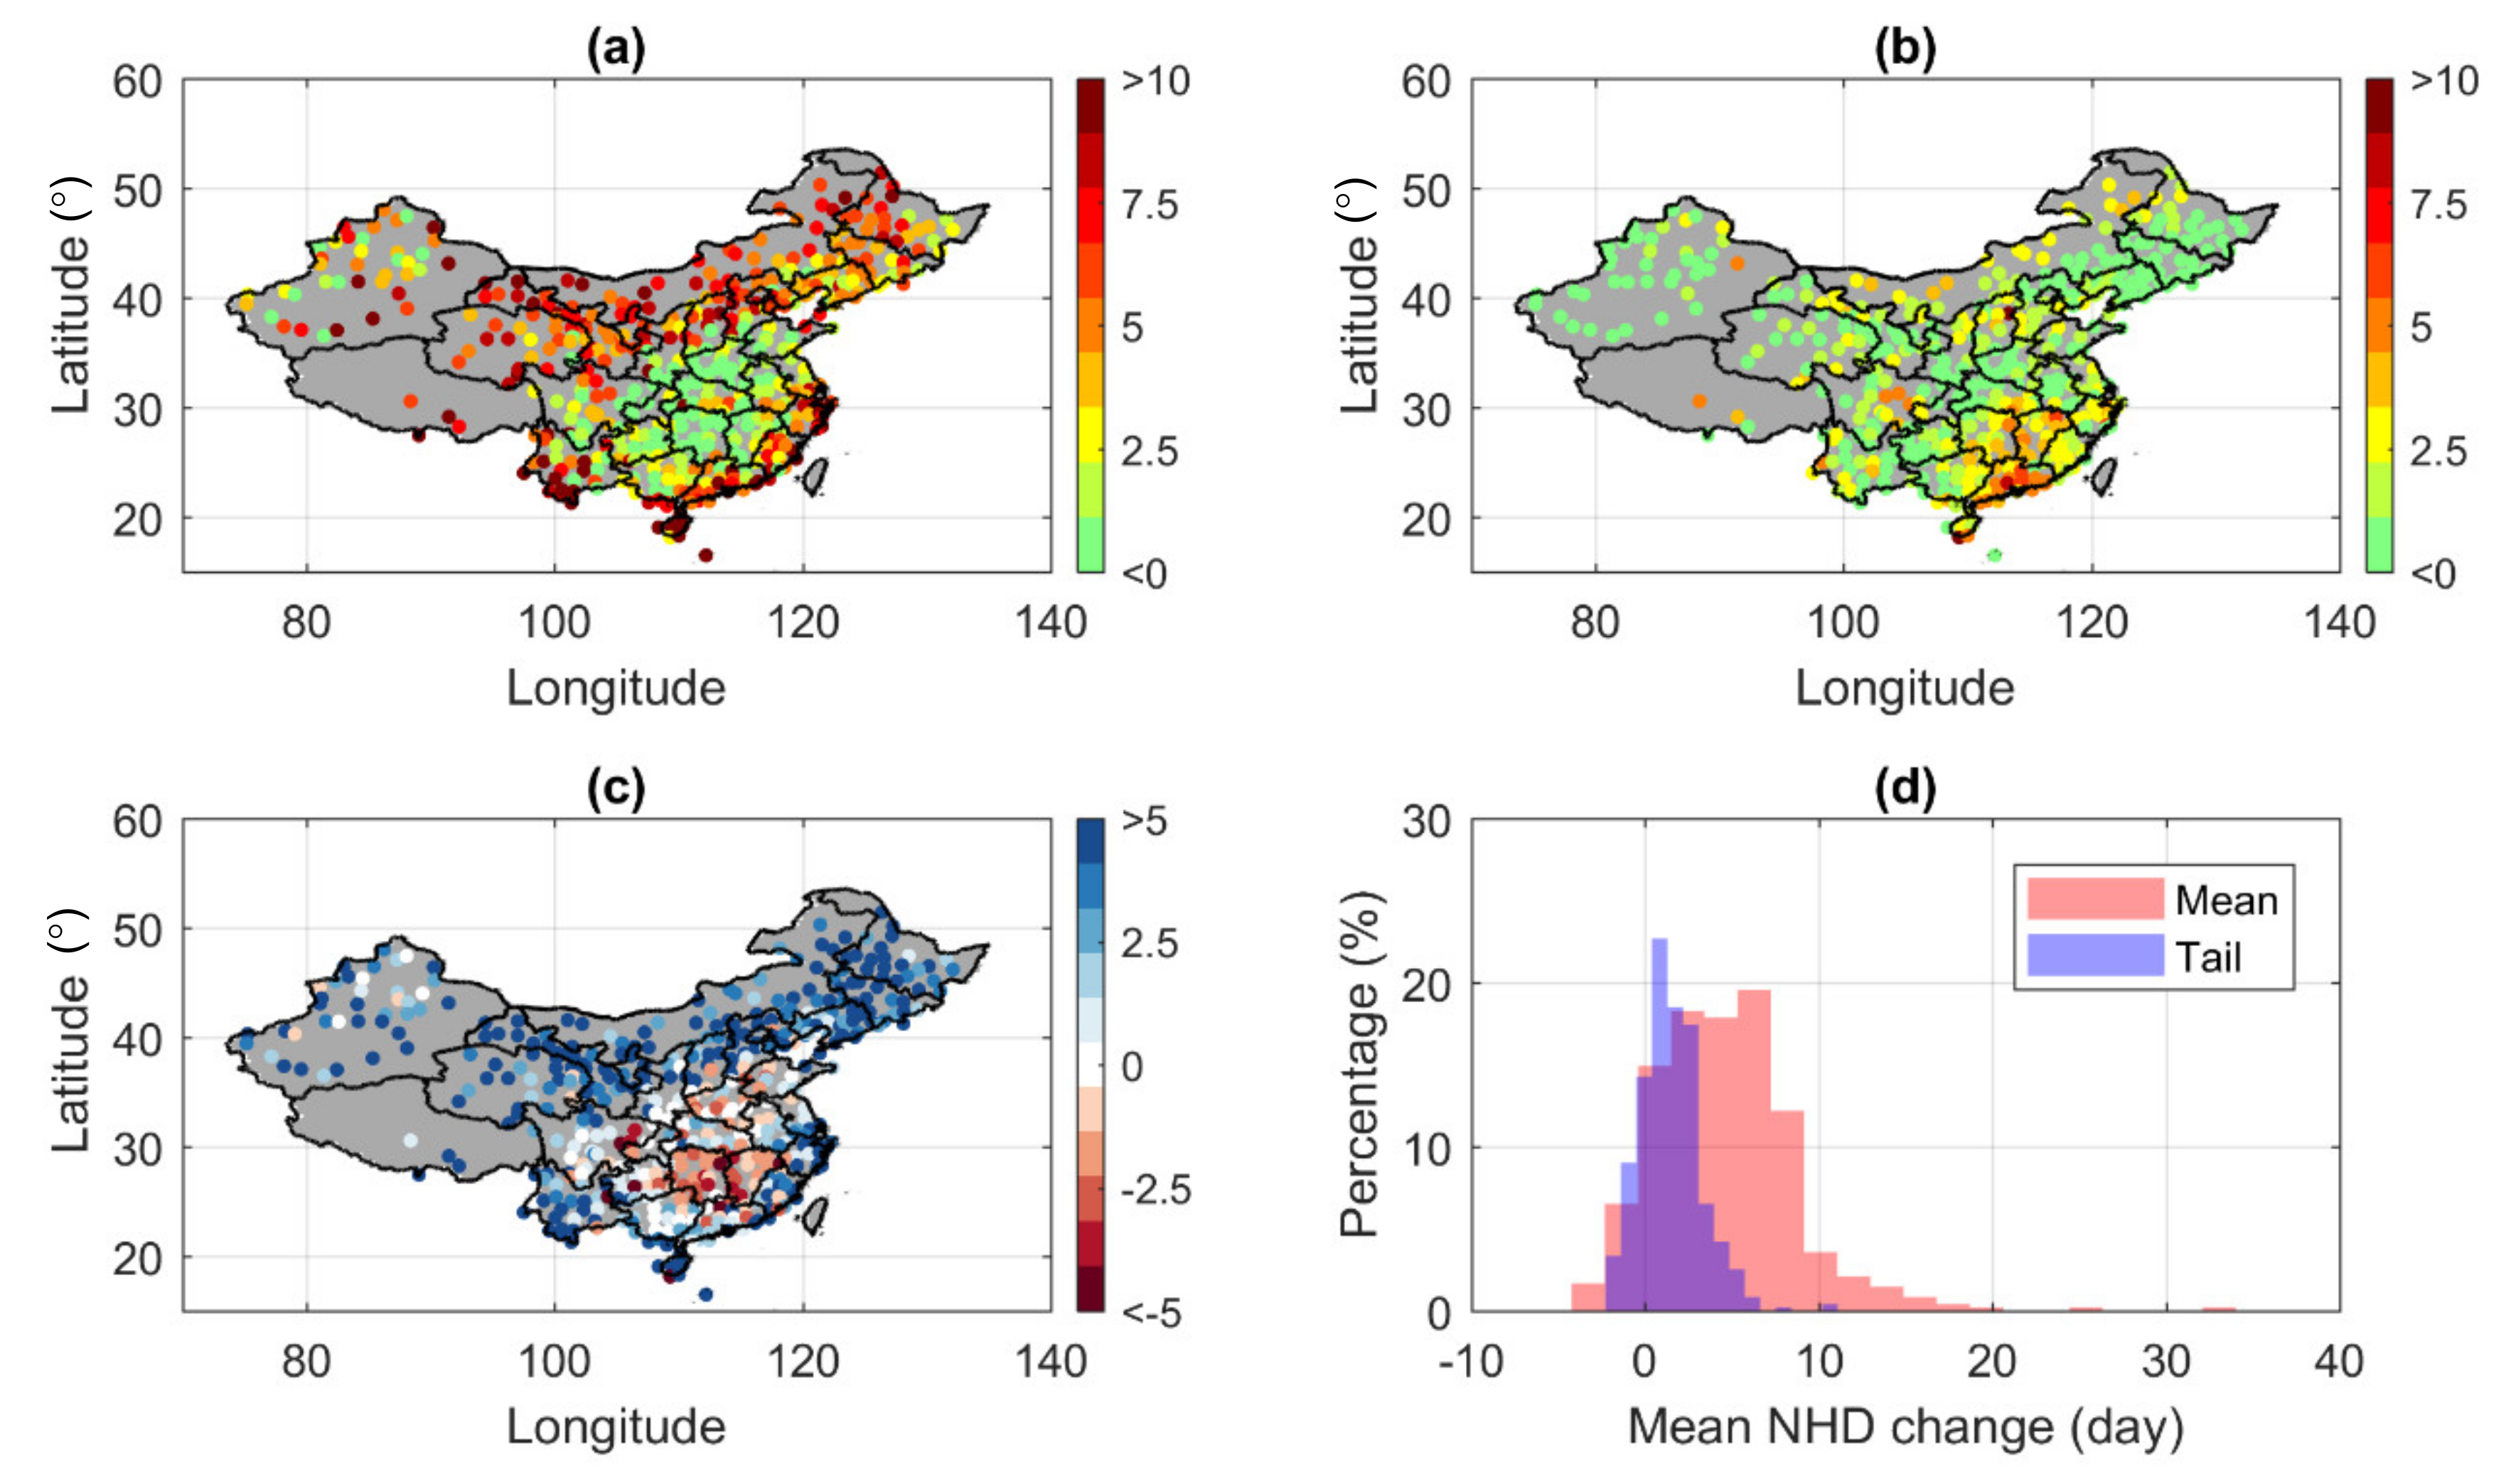
3.2. The Spatial Distribution of China’s Annual Mean NHD Change

Since the threshold of hot days was defined as the 90th percentile of the summer temperatures of the base period (1960 to 1990), the likelihood of the heat extreme occurrence was 10%. Thus, the NHD of the base period was approximately 9 days per year, across all stations (Figure 3a).
Compared to the base period, the NHD during the period of 1991 to 2011 increased substantially (Figure 3b,c). Spatial variability of both NHD and its increment was observed. For instance, the northern part of China and the southeast coast experience approximately 20 hot days per year, which are approximately 10 days more than the base period. On the contrary, the increment of NHD was relatively small in Central China, and some stations even showed a decreased NHD (Figure 3b). On average, the likelihood of NHD occurrence during 1991 to 2011 was 70% higher than that of the base period (1960 to 1990).

3.3. Mean and Hot Tail Length Change Induced NHD Change in China

Figure 4 shows that the mean temperature rise primarily determined the NHD change. Global warming and hot tail length protraction averagely results in 4.5 and 1.5 NHD increment (Figure 4d), respectively, i.e., mean temperature rise was responsible for approximately 75% of the NHD change. Since the spatial distribution of the NHD increment was tightly correlated to the spatial pattern of mean temperature increase (Figure 2a and Figure 4a), areas with strongest global warming were also associated with largest NHD increase, e.g., Inner Mongolia.
Although the average hot tail length change impact on NHD was relatively small (Figure 4b), it dominated the NHD of Central China (Figure 4c), where the tail length change could increase NHD up to 7–10 days—primarily in the southern part of Central China (Figure 4b,d).

4. Discussion and Conclusions

Ground-based air temperature observations showed that the distribution of summer air temperature in the Chinese mainland has significantly (p < 0.05) increased mean and a prolonged hot tails in recent years (1991 to 2011). Strong spatial variability of the air temperature distribution change, i.e., the shifted mean and protracted hot tails, was observed. Generally, the air temperature distribution change was more severe in Inner Mongolia and the southeast coast.
As demonstrated in previous studies, both global climate warming and anthropogenic activities are the key contributors of air temperature warming in China [19]. However, the cause of the prolonged air temperature hot tails is yet unknown. This might be partly related to enhanced land–atmosphere coupling strength. As shown in [26], a decreased soil moisture supply generally enhances the strength of land and atmosphere feedback, which eventually increases the variability of summer air temperatures. Likewise, anthropogenic activities might also increase China’s hot tail length. However, entirely attributing the impacts of these factors on China’s air temperature change was beyond the scope of this study. Instead, the goal of this study was to quantify the bulk deformation of China’s air temperature distribution and its impact on NHD.
The results were particularly relevant to hot extreme prediction framework validation and modification. Frameworks that assume that temperature distribution tail length was temporally stationary (e.g., [13]) could underestimate up to 25% of the hot extreme occurrence probability. This bias would be most noticeable at regions where mean temperature change was relatively small, e.g., Southeast China. Additionally, as noted above, increased hot tail length suggests a strongly increased extreme air temperature, which might have even stronger impacts on human health and social economy.
Global warming is shown to be spatially non-uniform (Figure 2 and also see [27]). As shown above, factors controlling the likelihood of hot extreme occurrence change vary with the magnitude of global warming. Hence, the accuracy of estimating the spatial variability of mean temperature change would be vital for projecting the future regional hot extreme occurrence. Additionally, the capability of capturing the air temperature tail change should be the primary goal of climatic models at areas where mean temperature shift is insignificant. For instance, neglecting the hot tail changes of the air temperature will incorrectly predict a decreased NHD change in Southeast China, which will be strongly in contrast with the observed NHD changes.
However, it should be noted that CMDC air temperature is more densely observed in humid Southeast China (e.g., see Figure 2). Therefore, there might be a lack of sufficient observation sites in arid and dry–wet transitional climate zones (northwest China and Tibetan Plateau). Hence, the next step will include global-wide temperature observations across all climate zones. This might be preferable for a comprehensive exploration of changes in historical air temperatures.

Author Contributions

Conceptualization, L.W. and J.D.; methodology, J.D.; software, L.W. and J.D.; validation, L.W., J.D. and W.S.; formal analysis, L.W. and J.D.; resources, L.W.; data curation, L.W.; writing—original draft preparation, L.W., J.D. and W.S.; writing—review and editing, L.W. and J.D.; visualization, L.W.; supervision, X.C.; project administration, L.W. and J.D.; funding acquisition, L.W., J.D. and X.C.

Funding

This research was funded by “The UK-China Critical Zone Observatory (CZO) Programme”, grant number 41571130071, “The National Natural Scientific Foundation of China”, grant number 51909121, and “The Belt and Road Special Foundation of the State Key Laboratory of Hydrology-Water Resources and Hydraulic Engineering”, grant number 2018490311 and 2018491711.

Acknowledgments

The observation data were provided by the China Meteorological Data Service Center (CMDC). Senior engineer Dan Qi assisted our data collection. The authors are grateful to the anonymous reviewers, the Associate Editor, and the Editor, whose comments and suggestions improved the quality of the manuscript.

Conflicts of Interest

The authors declare no conflict of interest. The funders had no role in the design of the study; in the collection, analyses, or interpretation of data; in the writing of the manuscript, or in the decision to publish the results.

References

  1. Mazdiyasni, O.; AghaKouchak, A. Substantial increase in concurrent droughts and heatwaves in the United States. Proc. Natl. Acad. Sci. USA 2015, 112, 11484–11489. [Google Scholar] [CrossRef] [PubMed]
  2. Meehl, G.A. More Intense, More Frequent, and Longer Lasting Heat Waves in the 21st Century. Science 2004, 305, 994–997. [Google Scholar] [CrossRef] [PubMed]
  3. Coumou, D.; Rahmstorf, S. A decade of weather extremes. Nat. Clim. Chang. 2012, 2, 491–496. [Google Scholar] [CrossRef]
  4. Tan, J.; Zheng, Y.; Song, G.; Kalkstein, L.S.; Kalkstein, A.J.; Tang, X. Heat wave impacts on mortality in Shanghai, 1998 and 2003. Int. J. Biometeorol. 2007, 51, 193–200. [Google Scholar] [CrossRef] [PubMed]
  5. Alexander, L. Climate science: Extreme heat rooted in dry soils. Nat. Geosci. 2011, 4, 12–13. [Google Scholar] [CrossRef]
  6. Anderson, G.B.; Bell, M.L. Heat waves in the United States: Mortality risk during heat waves and effect modification by heat wave characteristics in 43 US communities. Environ. Health Perspect. 2011, 119, 210–218. [Google Scholar] [CrossRef]
  7. Miralles, D.G.; Teuling, A.J.; Van Heerwaarden, C.C.; De Arellano, J.V.-G. Mega-heatwave temperatures due to combined soil desiccation and atmospheric heat accumulation. Nat. Geosci. 2014, 7, 345–349. [Google Scholar] [CrossRef]
  8. Seneviratne, S.I.; Koster, R.D.; Guo, Z.; Dirmeyer, P.A.; Kowalczyk, E.; Lawrence, D.; Liu, P.; Mocko, D.; Lu, C.-H.; Oleson, K.W.; et al. Soil Moisture Memory in AGCM Simulations: Analysis of Global Land–Atmosphere Coupling Experiment (GLACE) Data. J. Hydrometeorol. 2006, 7, 1090–1112. [Google Scholar] [CrossRef]
  9. Hirschi, M.; Seneviratne, S.I.; Alexandrov, V.; Boberg, F.; Boroneant, C.; Christensen, O.B.; Formayer, H.; Orlowsky, B.; Stepanek, P. Observational evidence for soil-moisture impact on hot extremes in southeastern Europe. Nat. Geosci. 2011, 4, 17–21. [Google Scholar] [CrossRef]
  10. Grumm, R.H. The Central European and Russian Heat Event of July–August 2010. Bull. Am. Meteorol. Soc. 2011, 92, 1285–1296. [Google Scholar] [CrossRef]
  11. Hansen, J.; Sato, M.; Ruedy, R. Perception of climate change. Proc. Natl. Acad. Sci. USA 2012, 109, E2415–E2423. [Google Scholar] [CrossRef] [PubMed]
  12. Fischer, E.M.; Knutti, R. Anthropogenic contribution to global occurrence of heavy-precipitation and high-temperature extremes. Nat. Clim. Chang. 2015, 5, 560–564. [Google Scholar] [CrossRef]
  13. Rahmstorf, S.; Coumou, D. Increase of extreme events in a warming world. Proc. Natl. Acad. Sci. USA 2011, 108, 17905–17909. [Google Scholar] [CrossRef] [PubMed]
  14. Stott, P.A.; Stone, D.A.; Allen, M.R.; Stone, D. Human contribution to the European heatwave of 2003. Nature 2004, 432, 610–614. [Google Scholar] [CrossRef]
  15. Fonseca, D.; Carvalho, M.; Marta-Almeida, M.; Melo-Gonçalves, P.; Rocha, A. Recent trends of extreme temperature indices for the Iberian Peninsula. Phys. Chem. Earth 2016, 94, 66–76. [Google Scholar] [CrossRef]
  16. Ruml, M.; Gregoric, E.; Vujadinovic, M.; Radovanovic, S.; Stojicic, Đ. Observed changes of temperature extremes in Serbia over the period 1961−2010. Atmos. Res. 2017, 183, 26–41. [Google Scholar]
  17. Viceto, C.; Pereira, S.C.; Rocha, A. Climate Change Projections of Extreme Temperatures for the Iberian Peninsula. Atmosphere 2019, 10, 229. [Google Scholar] [CrossRef]
  18. Pereira, S.C.; Marta-Almeida, M.; Carvalho, A.C.; Rocha, A. Heat wave and cold spell changes in Iberia for a future climate scenario. Int. J. Clim. 2017, 37, 5192–5205. [Google Scholar] [CrossRef]
  19. Chen, Y.; Zhai, P. Revisiting summertime hot extremes in China during 1961–2015: Overlooked compound extremes and significant changes. Geophys. Res. Lett. 2017, 44, 5096–5103. [Google Scholar] [CrossRef]
  20. Zhang, J.; Wu, L. Land-atmosphere coupling amplifies hot extremes over China. Chin. Sci. Bull. 2011, 56, 3328–3332. [Google Scholar] [CrossRef]
  21. Sun, Y.; Zhang, X.; Zwiers, F.W.; Song, L.; Wan, H.; Hu, T.; Yin, H.; Ren, G. Rapid increase in the risk of extreme summer heat in Eastern China. Nat. Clim. Chang. 2014, 4, 1082–1085. [Google Scholar] [CrossRef]
  22. Katz, R.W.; Brown, B.G. Extreme events in a changing climate: Variability is more important than averages. Clim. Chang. 1992, 21, 289–302. [Google Scholar] [CrossRef]
  23. Ruff, T.W.; Neelin, J.D. Long tails in regional surface temperature probability distributions with implications for extremes under global warming. Geophys. Res. Lett. 2012, 39. [Google Scholar] [CrossRef]
  24. Li, L.; Zha, Y. Satellite-based regional warming hiatus in China and its implication. Sci. Total. Environ. 2019, 648, 1394–1402. [Google Scholar] [CrossRef]
  25. Seneviratne, S.I.; Donat, M.G.; Mueller, B.; Alexander, L.V. No pause in the increase of hot temperature extremes. Nat. Clim. Chang. 2014, 4, 161–163. [Google Scholar] [CrossRef]
  26. Seneviratne, S.I.; Lüthi, D.; Litschi, M.; Schär, C. Land–atmosphere coupling and climate change in Europe. Nature 2006, 443, 205–209. [Google Scholar] [CrossRef]
  27. Ji, F.; Wu, Z.; Huang, J.; Chassignet, E.P. Evolution of land surface air temperature trend. Nat. Clim. Chang. 2014, 4, 462–466. [Google Scholar] [CrossRef]
Figure 1. Illustration of number of hot days (NHD) calculation and decomposition. The gray dashed line represents the threshold, and days beyond this threshold are defined as hot days. The shaded red areas in (a), (b), and (c) represent the total, hot tail length change, and the global warming induced NHD change, respectively.
Atmosphere 10 00748 g001
Figure 2. The mean summer temperature change (in K) (a,b), hot tail change (in K) (c), and hot tail differences (d) between the base (1960 to 1990) and the current period (1991 to 2011).
Atmosphere 10 00748 g002
Figure 3. The Chinese mainland annual mean NHD (days) for the base (a) and current (b) periods. The spatial distribution and the statistical distributions of their differences are shown in (c) and (d), respectively.
Atmosphere 10 00748 g003
Figure 4. The mean (a) and hot tail length (b) of the summer temperature distribution change (K) resulted NHD and the relative differences (c). The statistical distributions of the NHD change due to mean and hot tail length change are shown in (d).
Atmosphere 10 00748 g004

