Article

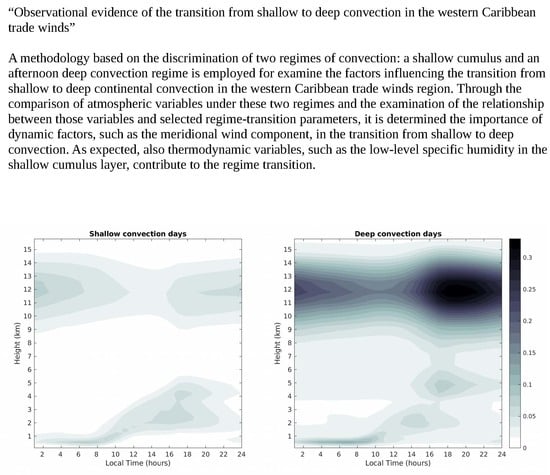
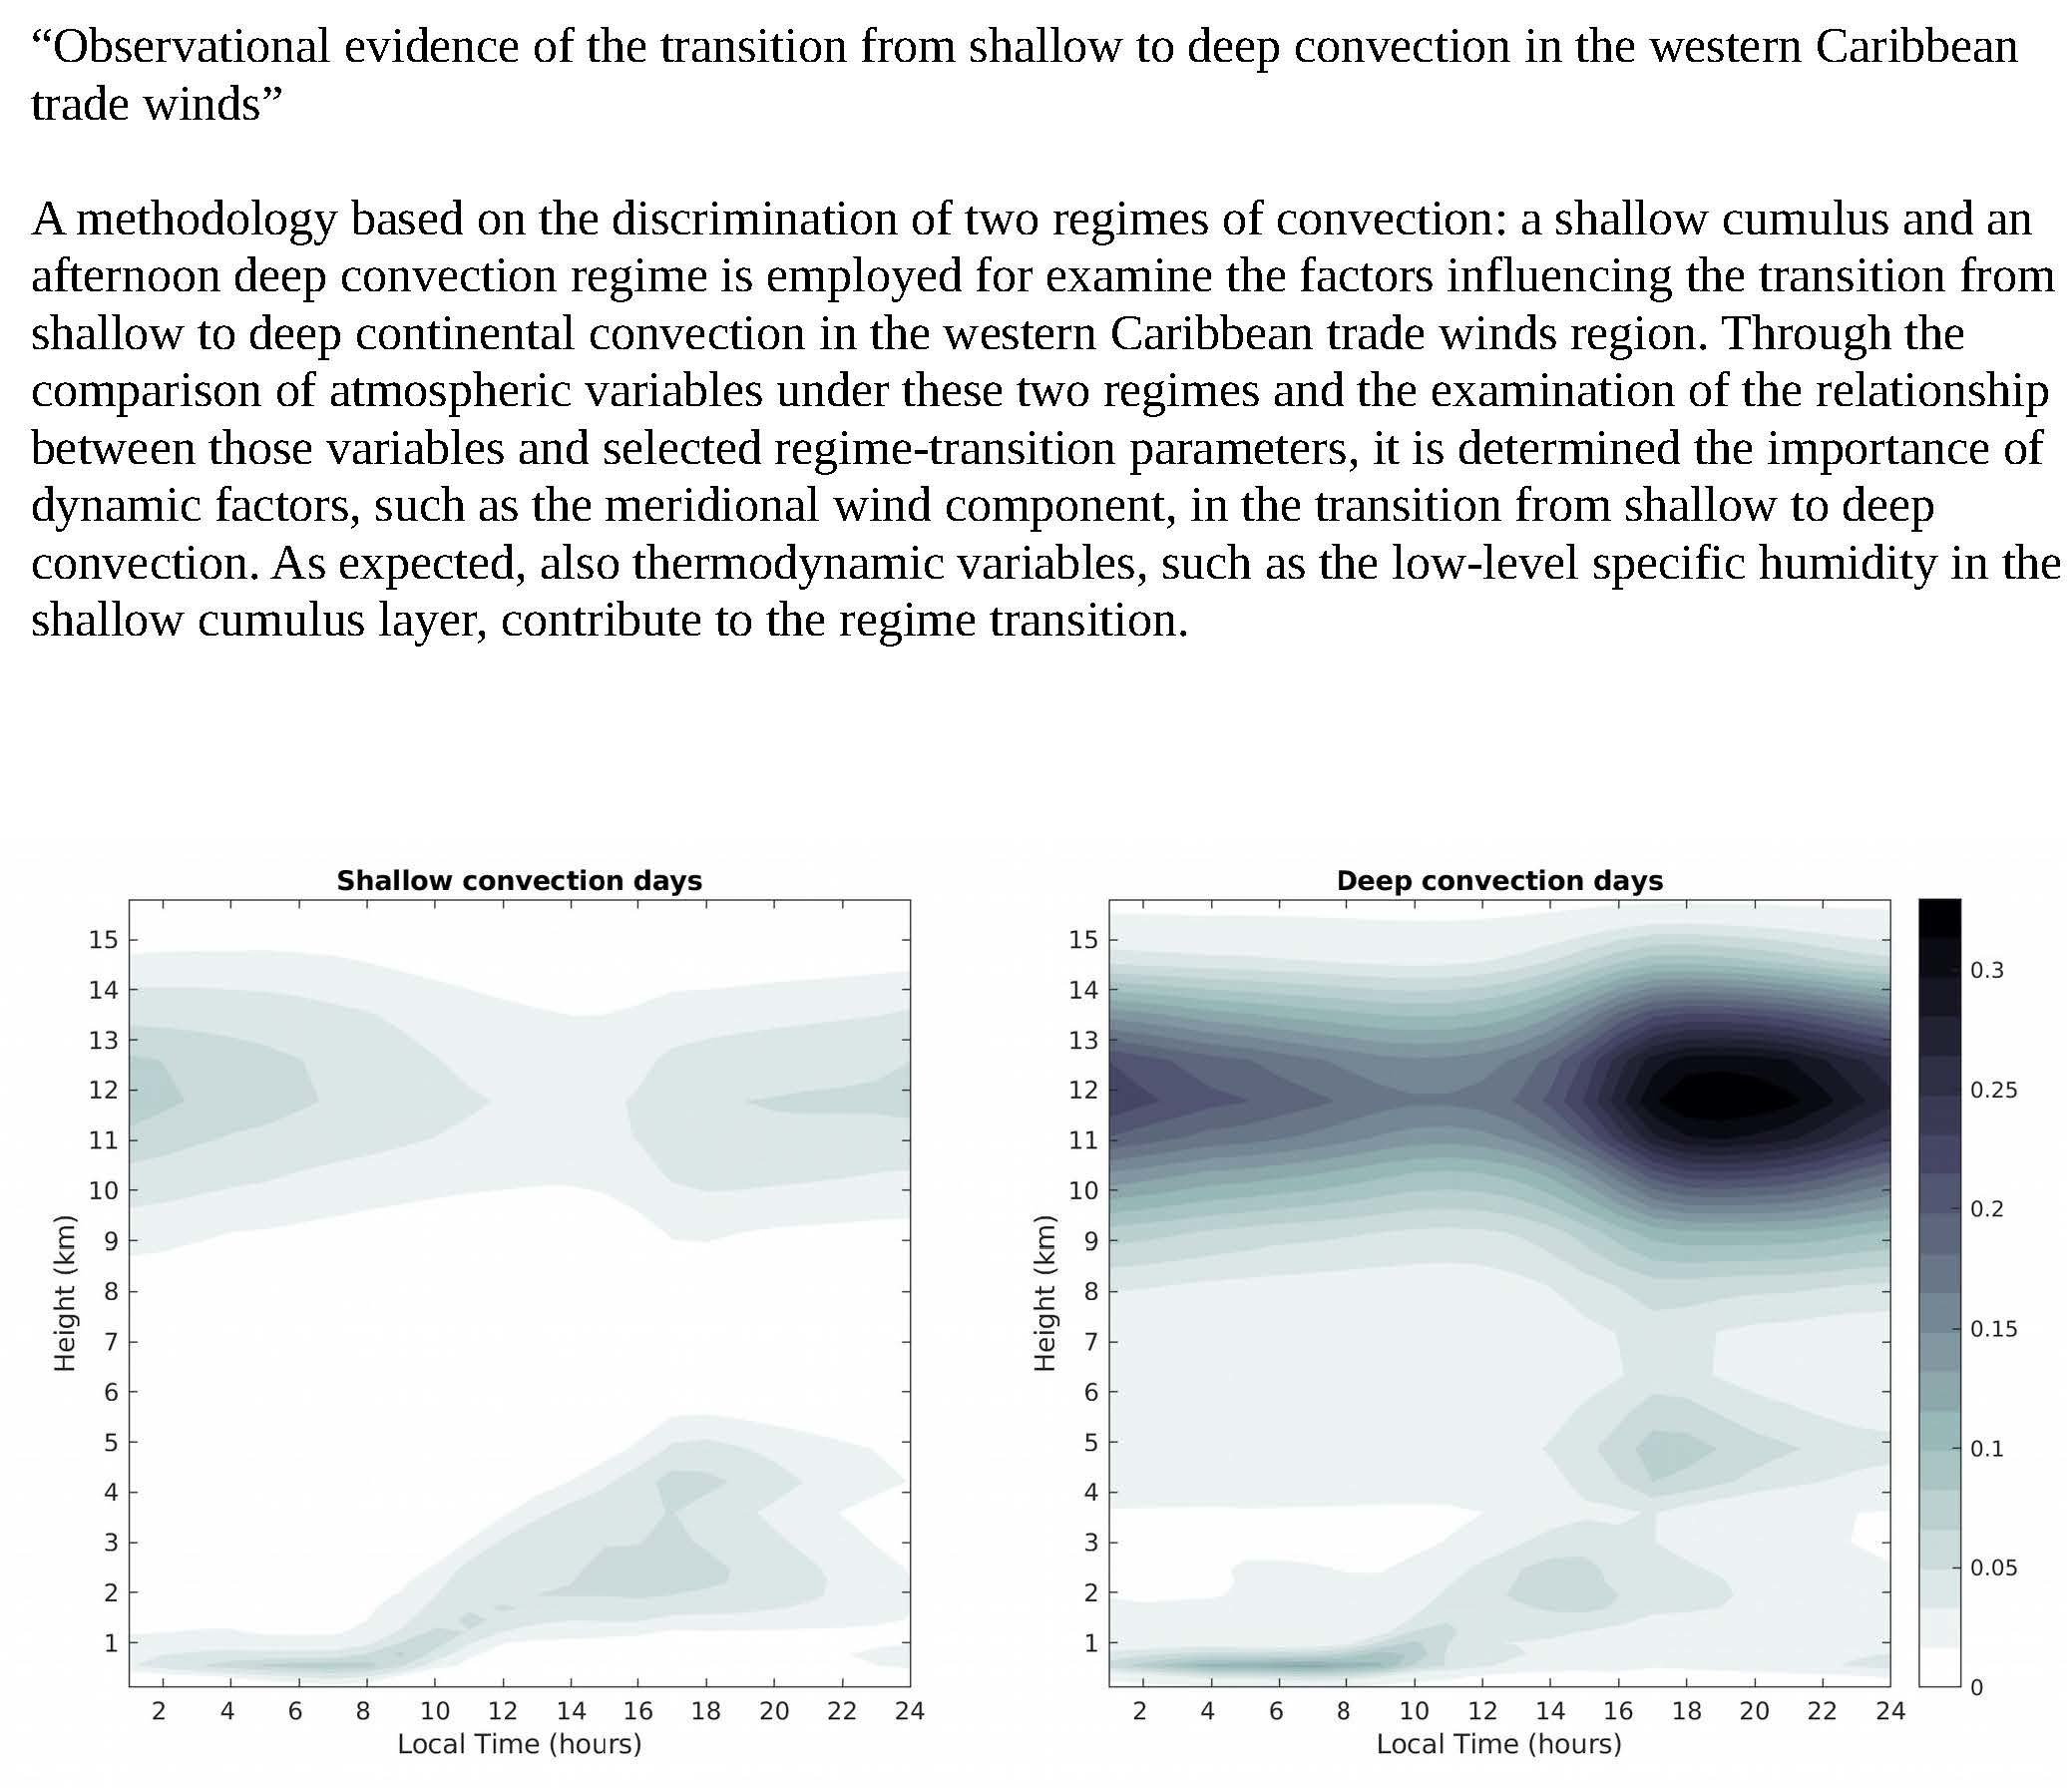
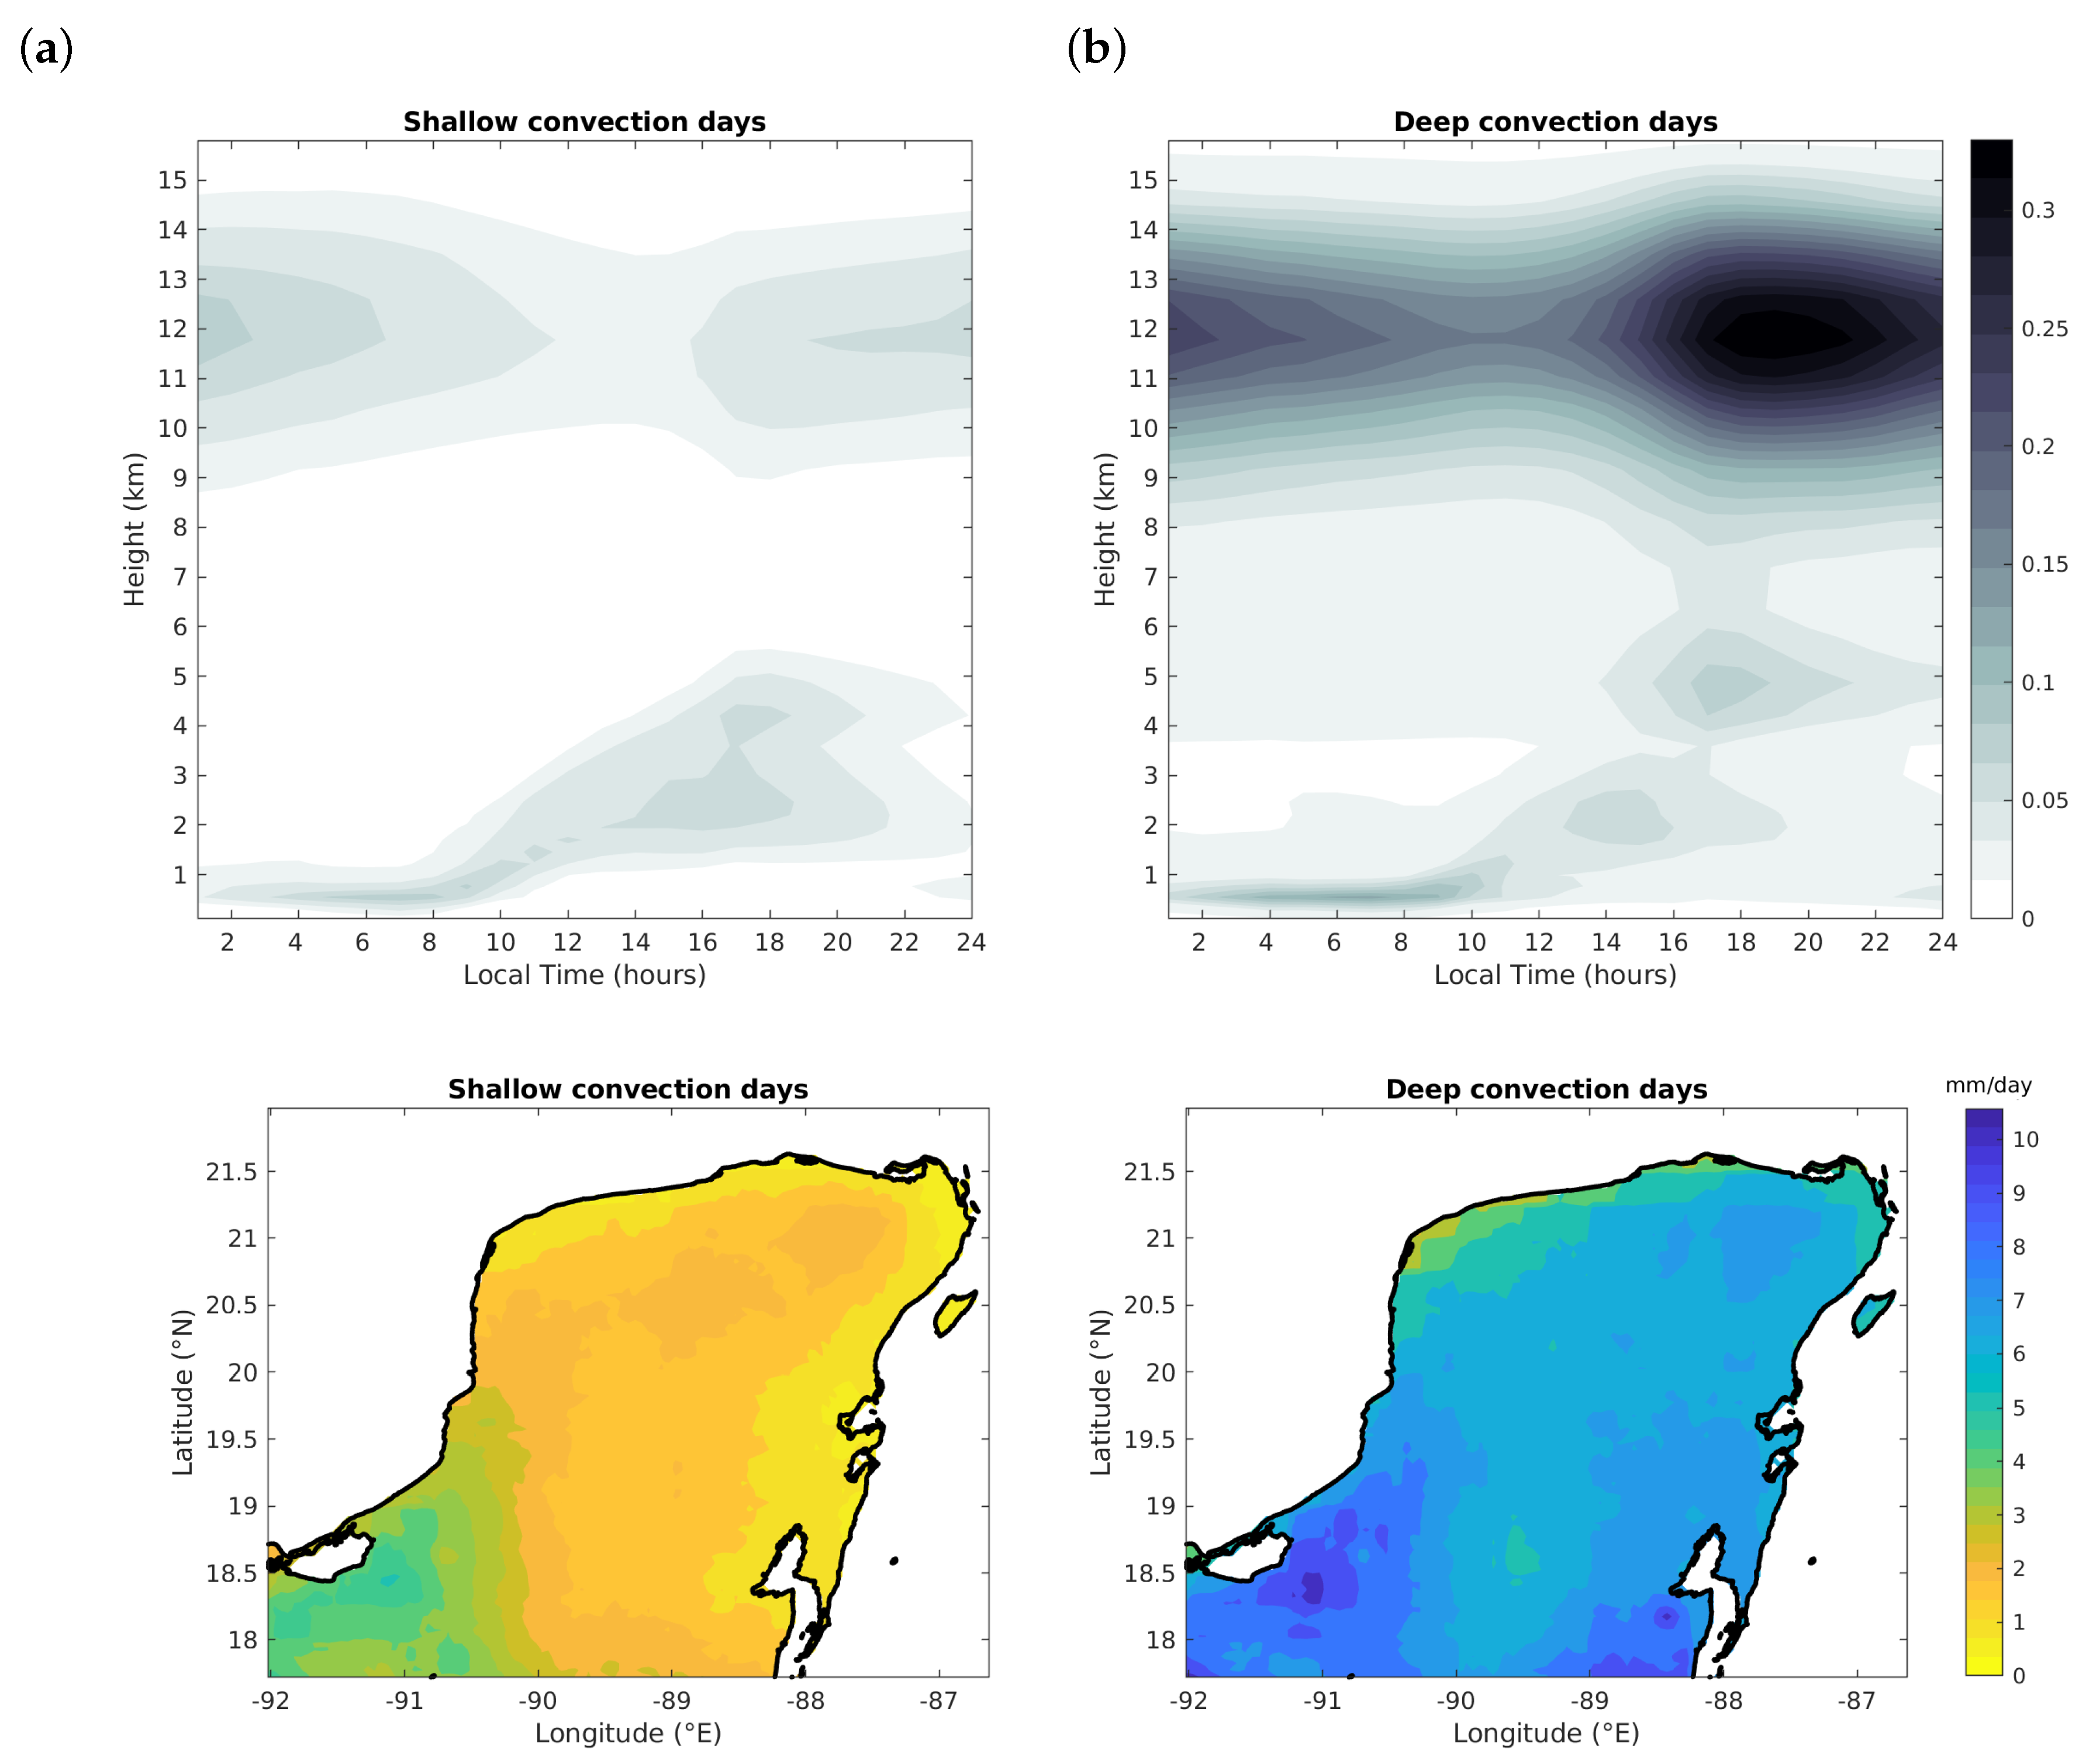
Observational Evidence of the Transition from Shallow to Deep Convection in the Western Caribbean Trade Winds

by
Yanet Díaz-Esteban
1,*,†,‡ and
Graciela B. Raga
2,‡
1
Posgrado en Ciencias de la Tierra, Universidad Nacional Autónoma de México, Ciudad de México 04510, Mexico
2
Centro de Ciencias de la Atmósfera, Universidad Nacional Autónoma de México, Ciudad de México 04510, Mexico
*
Author to whom correspondence should be addressed.
Current address: Av. Universidad 3000, Circuito Exterior S/N Delegación Coyoacán, C.P. l04510 Ciudad Universitaria, Mexico City 04510, Mexico.
These authors contributed equally to this work.
Atmosphere 2019, 10(11), 700; https://doi.org/10.3390/atmos10110700
Submission received: 18 September 2019 / Revised: 4 October 2019 / Accepted: 6 October 2019 / Published: 13 November 2019
(This article belongs to the Special Issue Central America and Caribbean Hydrometeorology and Hydroclimate)

Abstract

:
The present study aims to determine the factors influencing the transition from shallow to deep convection in the trade winds region using an observational approach, with emphasis in the Yucatan Peninsula in eastern Mexico. The methodology is based on a discrimination of two regimes of convection: a shallow cumulus regime, usually with little or no precipitation associated, and an afternoon deep convection regime, with large amounts of precipitation, preceded by a short period of shallow convection. Then, composites of meteorological fields at surface and several vertical levels, for each of the two convection regimes, are compared to infer which meteorological factors are involved in the development of deep convection in this region. Also, the relationship between meteorological variables and selected regime-transition parameters is evaluated only for deep convection regime days. Results indicate the importance of dynamic factors, such as the meridional wind component, in the transition from shallow to deep convection. As expected, thermodynamic variables, such as the low-level specific humidity in the shallow cumulus layer, also contribute to the regime transition. The presence of a southerly component of wind at low- to mid-levels during the early morning in deep convection days provides the shallow cumulus with a more favorable environment so that transition can occur, since abundant moisture from the Caribbean is supplied through this prevailing southern wind. The results can be relevant for reducing uncertainties regarding some important parameters in global and regional models, which could lead to improved simulations of the transition from shallow to deep convection and precipitation.

Graphical Abstract

1. Introduction

Convection over land in tropical regions shows a characteristic pattern throughout the diurnal cycle, presenting shallow cumulus in the morning, which grow during the early afternoon transitioning to deep convective clouds, with the development of precipitation. Under little or no synoptic forcing, the cycle ends in the late afternoon and early evening [1,2]. In contrast, the presence of large-scale forcing will favor the organization of convection and the presence of longer-lived systems.
Understanding the processes involved in the diurnal cycle is crucial, since several authors [3,4,5,6,7,8,9,10] have documented that general circulation models (GCMs) often misrepresent the diurnal cycle of convection and precipitation, in terms of its amplitude as well as its phase, in both tropical and extratropical regions.
In order to reduce the biases present in models there is a need for a deeper understanding of the different convective regimes that can coexist during the rainy season in the tropics. In fact, reference [11] has suggested that the lack of an intermediate stage in convection involving shallow and mid-level topped cumulus and their effects in the atmosphere can contribute significantly to model errors in the diurnal cycle of convective clouds and precipitation.
Several previous studies have addressed issues related to continental convection, and factors that influence the onset of deep convection during the diurnal cycle, both from observational and cloud-resolving modelling perspectives. The most relevant and conclusive studies have identified important factors influencing the transition from shallow to deep convection. For example, references [12,13,14,15,16,17,18] argued that environmental humidity influences the development of deep convective clouds, through its role in parcel buoyancy. Other authors, such as [19,20,21,22,23,24], have highlighted the importance of rain evaporation below cloud base, and associated cold pools that act as an important mechanism for convective organization. Also, references [25,26] have suggested the existence of a critical lapse rate of temperature for the deep convective initiation, which highlights the importance of atmospheric instability in the lower layers. Moreover, reference [13] found that boundary layer inhomogeneity is associated to rain statistics typical of deep convective regimes, while [27,28] emphasized the effects of land surface heterogeneity at various horizontal scales on the transition from shallow to deep convection. Finally, reference [29] has found that for certain continental regions, surface meteorological conditions can determine a buoyancy profile that favors the shallow to deep transition of diurnal convection.
Those previous works have highlighted some parameters that are involved in the development of deep convection, however, there is no consensus on which factors are the most important for the transition. Also, there are few studies that explore the transition of shallow to deep convection in the trade winds region, since most of them have focused on broad continental areas or the deep tropics.
In this study we focus on the transition to deep convection in the Yucatan Peninsula in eastern Mexico, a region of rather flat topography and with small variability in land cover. While rainfall in the tropics may be synoptically-controlled or driven by large-scale dynamics, we concentrate on cases when little (or no) synoptic forcing affects the area of interest, in order to isolate the process and explore the mechanisms that control the transition from shallow to deep convection.
The interest in this region is mainly due to two reasons: (i) Despite the homogeneity of the land surface, the proximity of two important basins (the Caribbean Sea and the Gulf of Mexico) and the different wind regimes add complexity to convection over the peninsula, and (ii) during summertime—under no significant synoptic influence—two regimes of convection coexist: a shallow cumulus regime, mostly with no precipitation associated; and a late afternoon deep convection regime, with large amounts of precipitation associated and a short period of shallow convection preceding it. During the latter, a thermal trough develops over the peninsula, typically oriented in a north–south direction, and shifts westward. However, on some days convection remains shallow, which leads to the question: What are the conditions that prevent the transition to deep convection clouds? Or conversely, what are the factors that favor the development of deep convection in this region?
In order to answer that question, we analyze differences between atmospheric fields in those two regimes, under no significant synoptic-scale forcing. The aim is to understand the factors that influence the transition of convection in the Yucatan Peninsula, which could have important implications for numerical forecast in the area, and can also provide complementary information for this important research topic. Also, the results will be useful in order to improve the understanding of the controls on deep convection in tropical land regions, which is still poorly understood.

2. Materials and Methods

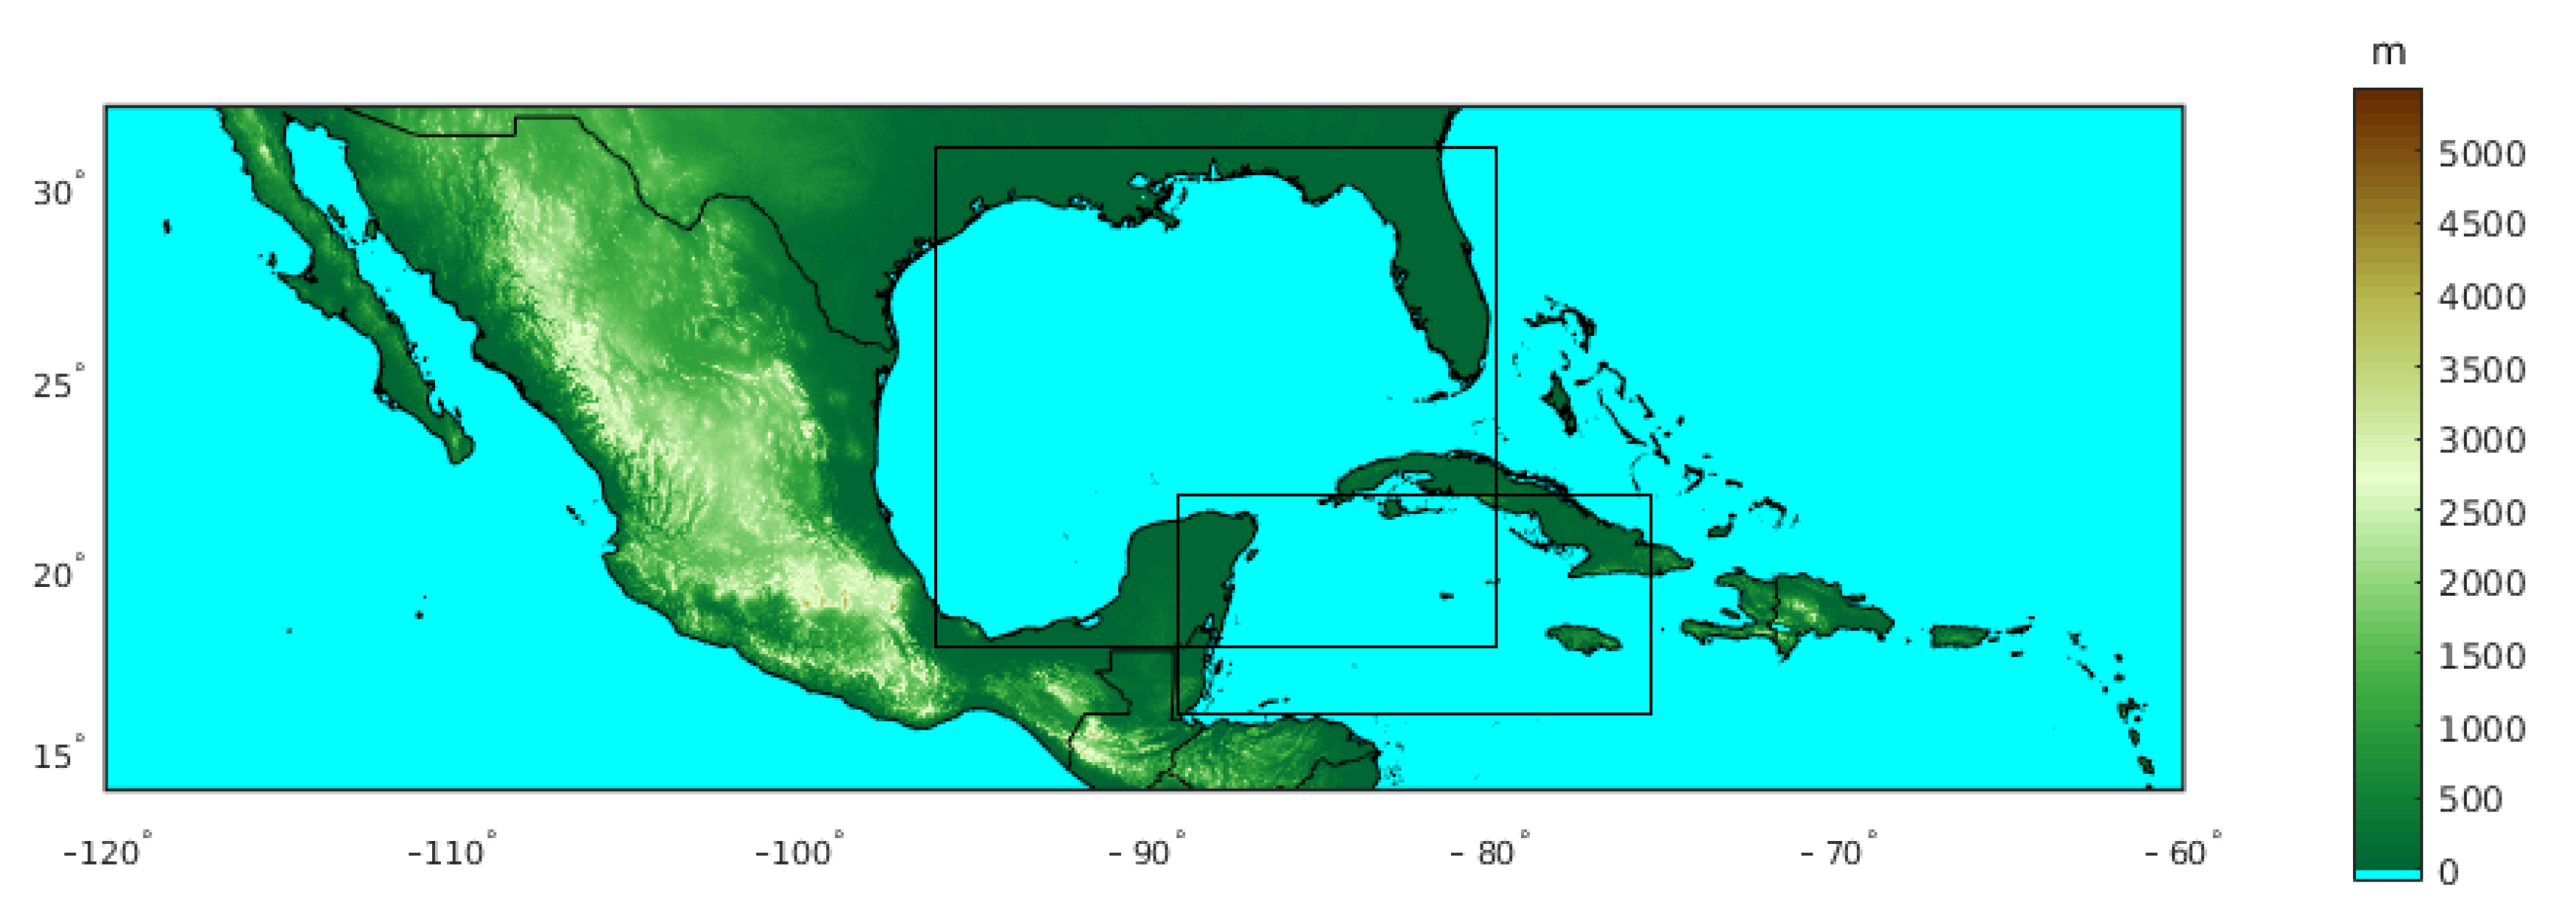
2.1. Data and Study Area

The study focuses on the Yucatan Peninsula, in eastern Mexico, an area encompassed between 17.5 and 21.5° N in latitude and 91.5 and 86.5° W in longitude. As seen in Figure 1 the topography in the peninsula is quite homogeneous.
The dataset employed for the filtering and classification is the reanalysis from the European Center for Weather and Forecasting (ECMWF), ERA5, a new generation of reanalysis that combines large amounts of historical observations (satellite and in-situ) into global estimates using advanced modeling and data assimilation systems [30]. The horizontal resolution used is 0.25 degrees (∼28 km), with 27 pressure levels. In addition, soundings from the University of Wyoming database and ground based GPS network SuomiNet [31] were employed, which provided an estimate of the validity of the reanalysis for this study. We also employed precipitation data from the Climate Hazards Group InfraRed Precipitation with Station (CHIRPS) dataset, which incorporates 0.05 degrees resolution satellite imagery with in-situ station data to create a gridded time series [32].

2.2. Selection of Cases with Small Synoptic Forcing

The analysis focuses on the rainy season in eastern Mexico, from 1 May to 31 October. During this period some synoptic systems can produce precipitation in the region, such as tropical cyclones, easterly waves, low pressure centers as well as mid- and low-level troughs. All of those systems have an associated circulation, typically displaying curvature in the surface isobars. Our methodology filters the daily data at 10:00 Local Time (LT) of 850 hPa relative vorticity ( ζ 850 ) and of the Laplacian of 850 hPa geopotential height ( 2 Φ 850 ), to remove days with appreciable synoptic forcing, based on the following values:
(i)
thresholds for ζ 850 (1) are based on the planetary vorticity (∼1.4586 × 10 4 s 1 )
10 4 s 1 ζ 850 10 4 s 1 ,
(ii)
thresholds for 2 Φ 850 (2) are based on typical values for tropical disturbances in the region:
20 s 2 2 Φ 850 20 s 2 .
In order to select cases for further analysis, thresholds are applied only in areas close to the Yucatan Peninsula (indicated by the two black boxes in Figure 1), taking into account the characteristic scales of tropical disturbances. Since we employ data from 1980 to 2018 (39 years) selecting only days from the rainy season, a total of 7176 days are analyzed, of which only 3145 days passed both filters specified in Equations (1) and (2).

2.3. Classification of Convection Regime

Once days with little or no synoptic forcing are selected, a method was applied to classify them in days when convection remained shallow throughout the diurnal cycle (“SC”) or in days when clouds experienced a transition to deep convection (“DC”). The classification criterion is based on cloud fraction (CF) at 21 UTC (16:00 LT) at different vertical levels, according to the thresholds for maximum values of cloud fraction displayed in Table 1. The analysis is performed at every grid point and only at 21 UTC. Convective events that are generated locally in the peninsula during the rainy season reach their maximum around 21 UTC, justifying our selection. If at least one grid cell is classified as DC (even though all others are SC), then that particular day is said to be a deep convection day (DC). Otherwise if all grid cells are classified as SC (or DC) the day is assigned to the SC category (or DC). A cloud regime classification based on cloud fraction is also used in [17].
The classification yielded a total of 1156 days within the “SC” category and 1570 within the “DC” category. It is worth mentioning that some days were discarded because they did not fall into any of the categories, corresponding, for example, to days with CF only in the upper levels (e.g., cirrus) or days with rain in the late afternoon and evening. However, those are only about 13% of the total population. The next step then was to generate composites of atmospheric parameters at the surface and several vertical levels.

3. Meteorological Conditions during SC and DC Regimes

3.1. Characteristics of SC and DC Regimes

The diurnal cycle of area-averaged cloud fraction, as well as the average daily precipitation, are shown in Figure 2, in which it is clear that the methodology identifies the different patterns of cloud fraction in the two regimes. Note also that days with shallow convection exhibit clouds during the afternoon with tops below 5 km and bases around 1 km. At higher levels, a small fraction of cloud cover, possibly related to cirrus, is observed, and CF is zero in the mid-troposphere throughout the diurnal cycle. The vertical distribution is different on deep convection days, with a maximum in CF at around 12 km between 16 and 21 LT. Note that on those days convection starts with a shallow cumulus phase until approximately 10–11 LT, followed by slightly larger clouds that transition into deep cumulus or cumulonimbus often reaching the tropopause, with a maximum at 18–19 LT. As can be clearly seen, there are marked differences between both regimes, validating this approach for the study of shallow to deep transition of convection. Furthermore, the composites of daily precipitation indicate average values of up to 10 mm/day for deep convection days, with much lower values (<4 mm/day) observed during shallow convection days.
Figure 3 shows the vertical velocity for SC and DC cases, as area-averaged composites and as a function of the diurnal cycle. In SC cases, mostly subsidence prevails throughout the day, particularly in the morning hours and in the mid-troposphere between 5 and 12 km. Vertical ascent is confined to the layer below 4 km where shallow convection occurs. In DC cases, subsidence is also observed during the morning hours, but it is smaller in magnitude than in the SC days, and the ascending air during the afternoon can reach beyond 14 km, indicating large vertical development.

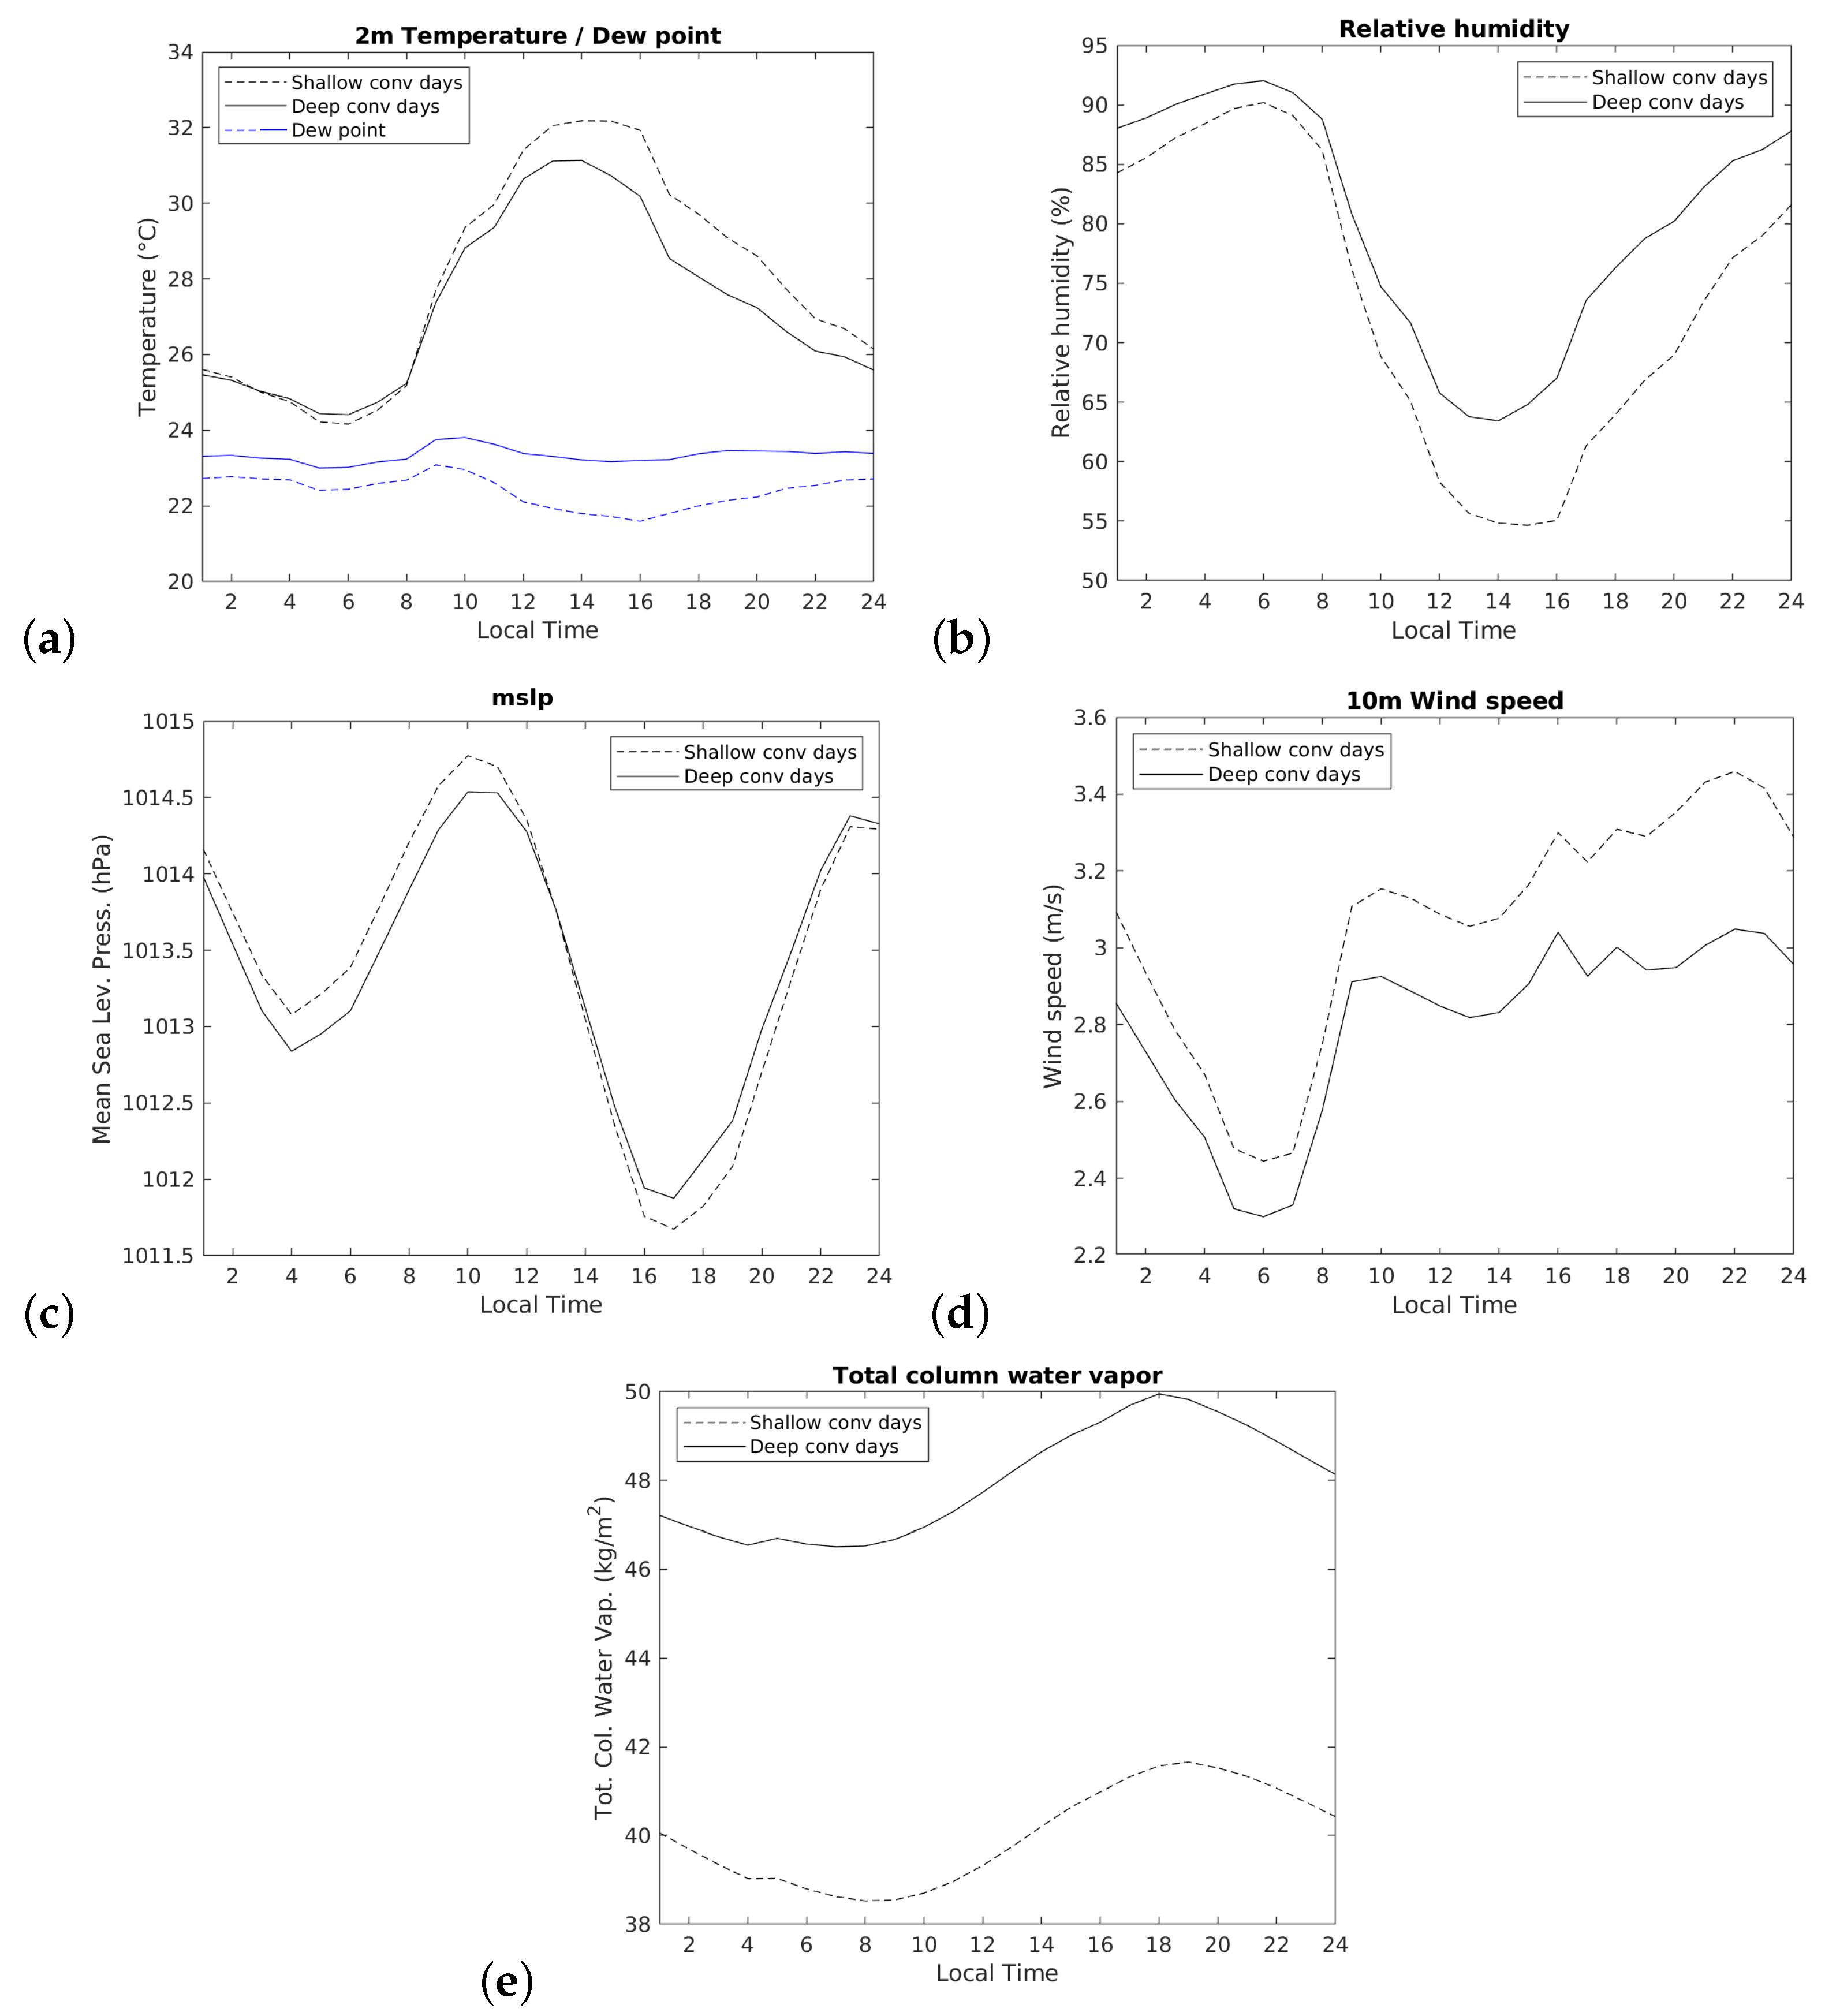
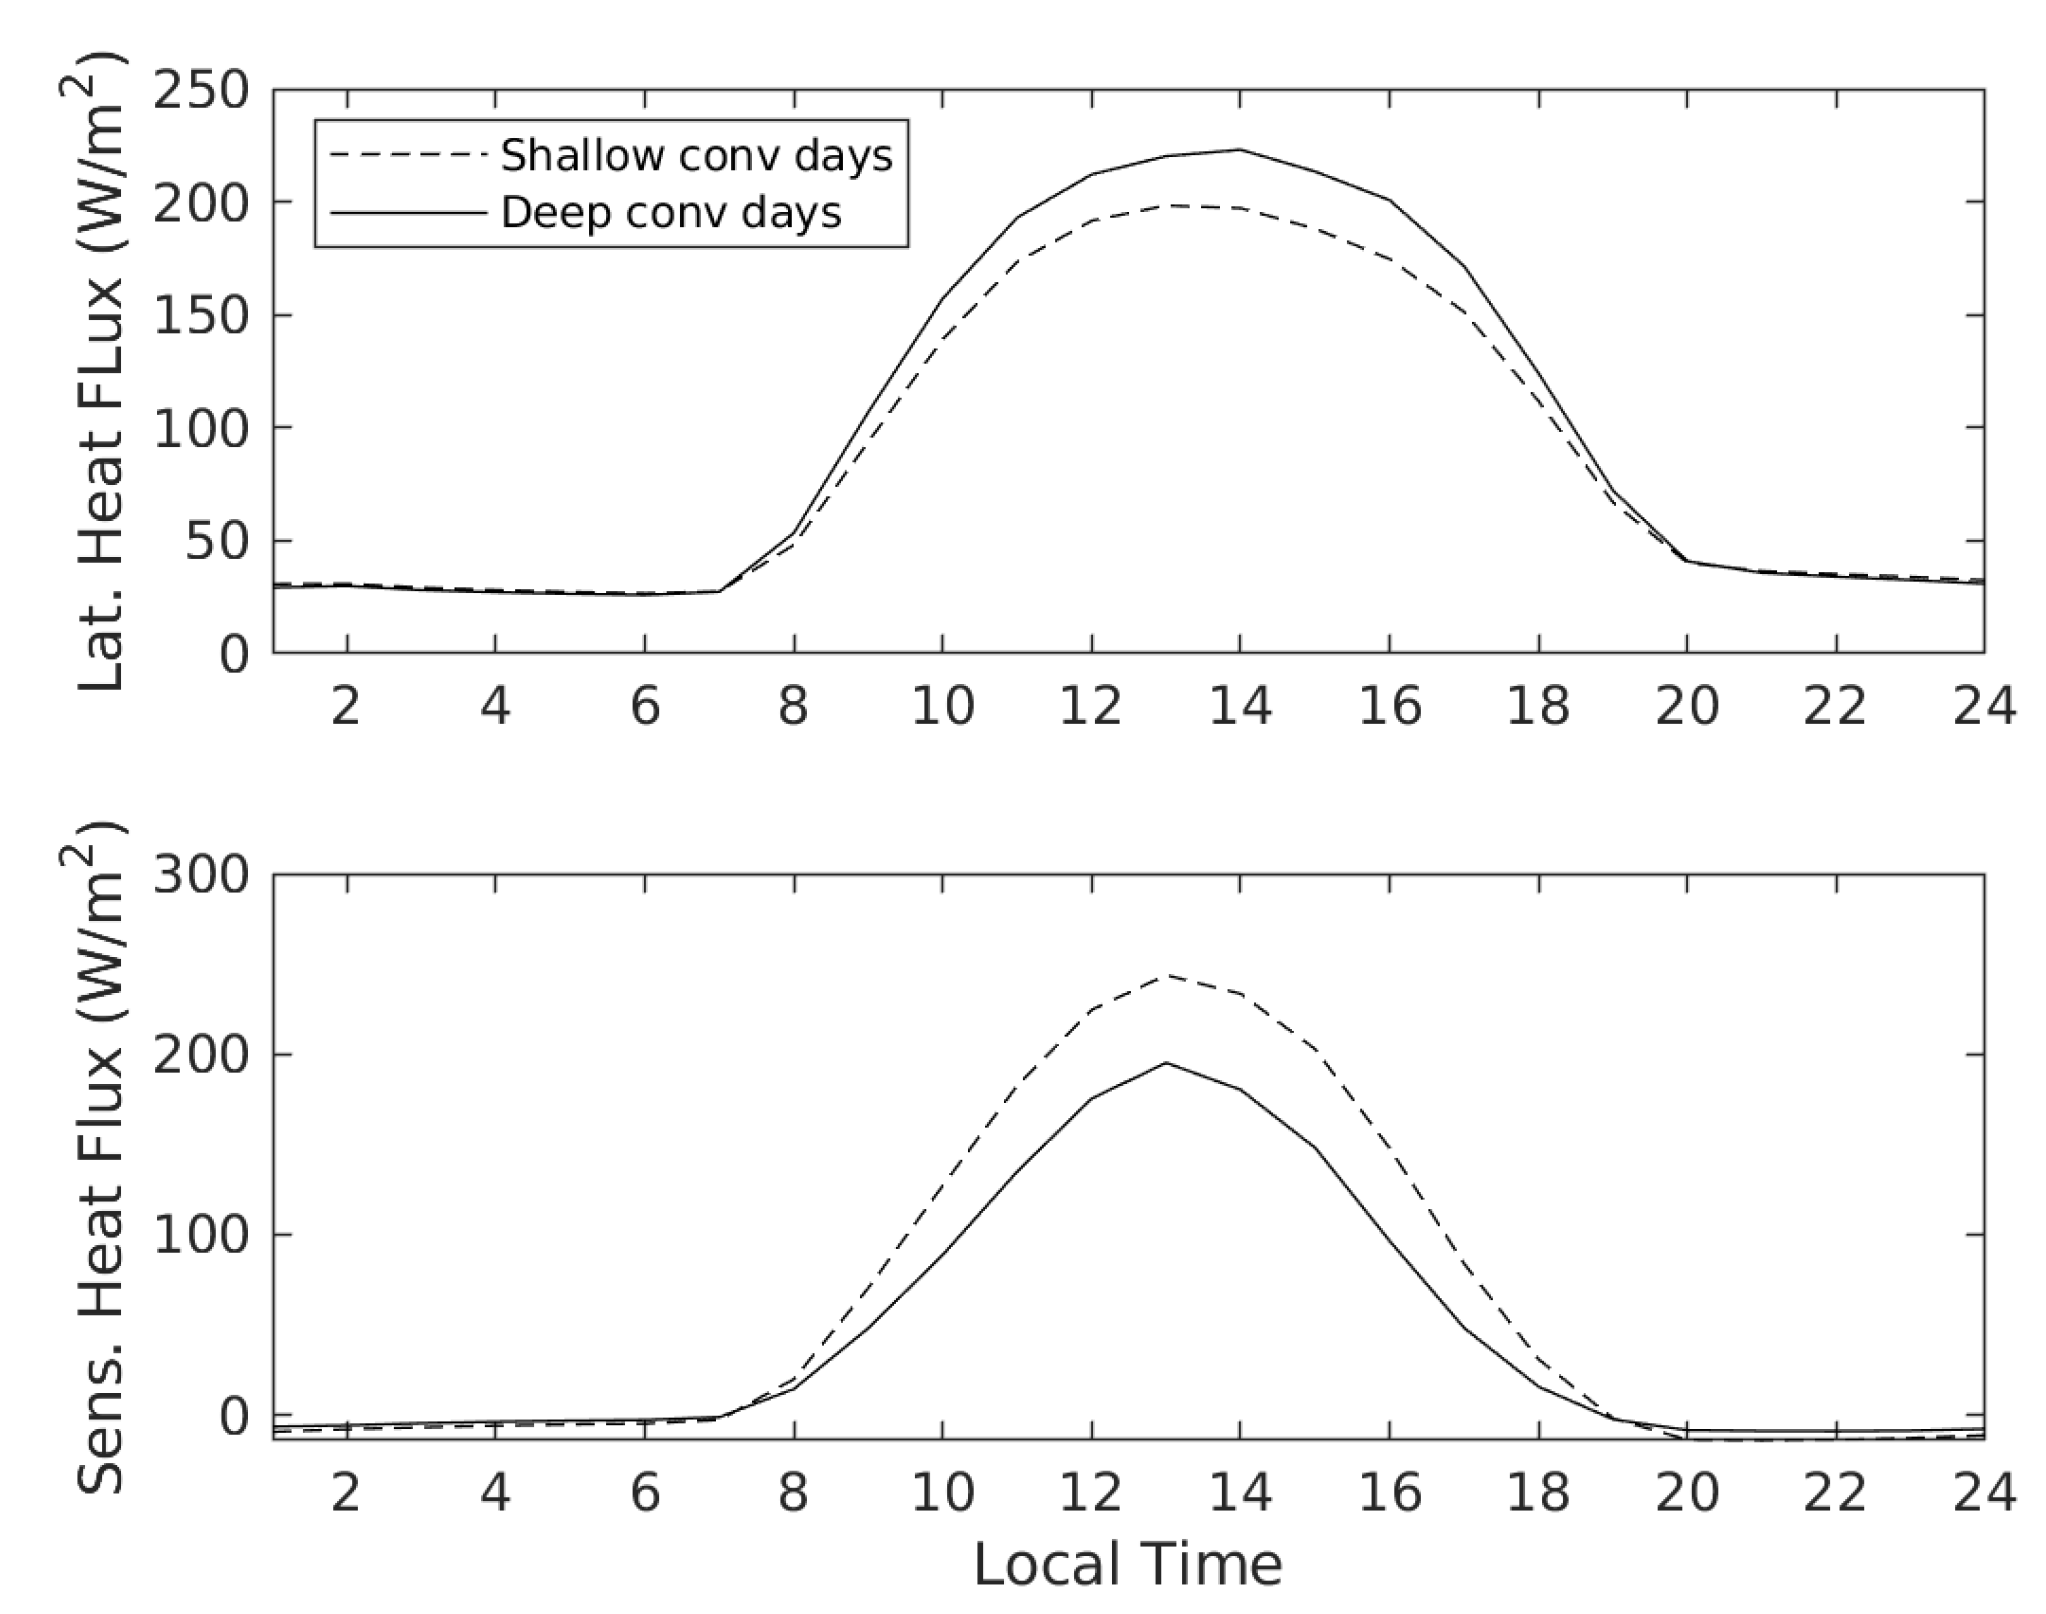
3.2. Surface Conditions

The main surface meteorological variables as a function of the diurnal cycle are shown in Figure 4, which are computed as area-averaged composites for all days in each of the two convection regimes. Note that there are clear differences throughout the diurnal cycle in each regime. The largest differences are found at around 16 and 17 LT, as a result of large differences in convective processes. Nevertheless, our intention is to focus on the behavior of surface meteorological parameters in the morning hours (up to 10 LT), to detect possible factors causing the onset of deep convection. In this regard, there are very small differences in temperature and relative humidity in the early morning, although it is noticeable that surface relative humidity is a bit larger in DC days. Also the dew point temperature is larger in DC than in SC days, while mean sea level pressure (mslp) and 10 m wind speed are smaller in DC than in SC days during the early morning. A large difference is observed in the total column water vapor (tcwv) throughout the diurnal cycle, with DC days about 7 kg/m 2 larger than SC days. This implies that the atmospheric column has about 17.5% more water vapor available in DC days.
The average diurnal cycle for the meteorological variables is also computed using GPS ground-based observations SuomiNet (Figure S1 of Supplementary Material), for the period 2011–2017. As can be easily seen, the relationship between SC and DC regimes is well preserved in ERA5 as well as in observations, particularly for Mérida station, which according to this analysis, is more representative of the behaviour of meteorological variables in the peninsula.
The diurnal cycle of surface latent and sensible heat fluxes for both regimes are displayed in Figure 5. Those fluxes are coupled with the daily cycle of solar radiation, thus exhibiting their maximum around 13–14 LT. Following sunrise, the latent heat flux increases slightly more in DC than in SC days, consistent with the higher humidity and mixing ratio (not shown) present in DC days. As expected, the sensible heat flux is smaller in DC than in SC days, particularly from 10 LT onward, as a result of the temperature decrease associated with reduced solar radiation at the surface due to the larger cloud fraction and precipitation. This behavior of sensible heat flux during diurnal deep convection has been also reported by [13,17] for the southern Great Plains in the US and central Amazonia, respectively.

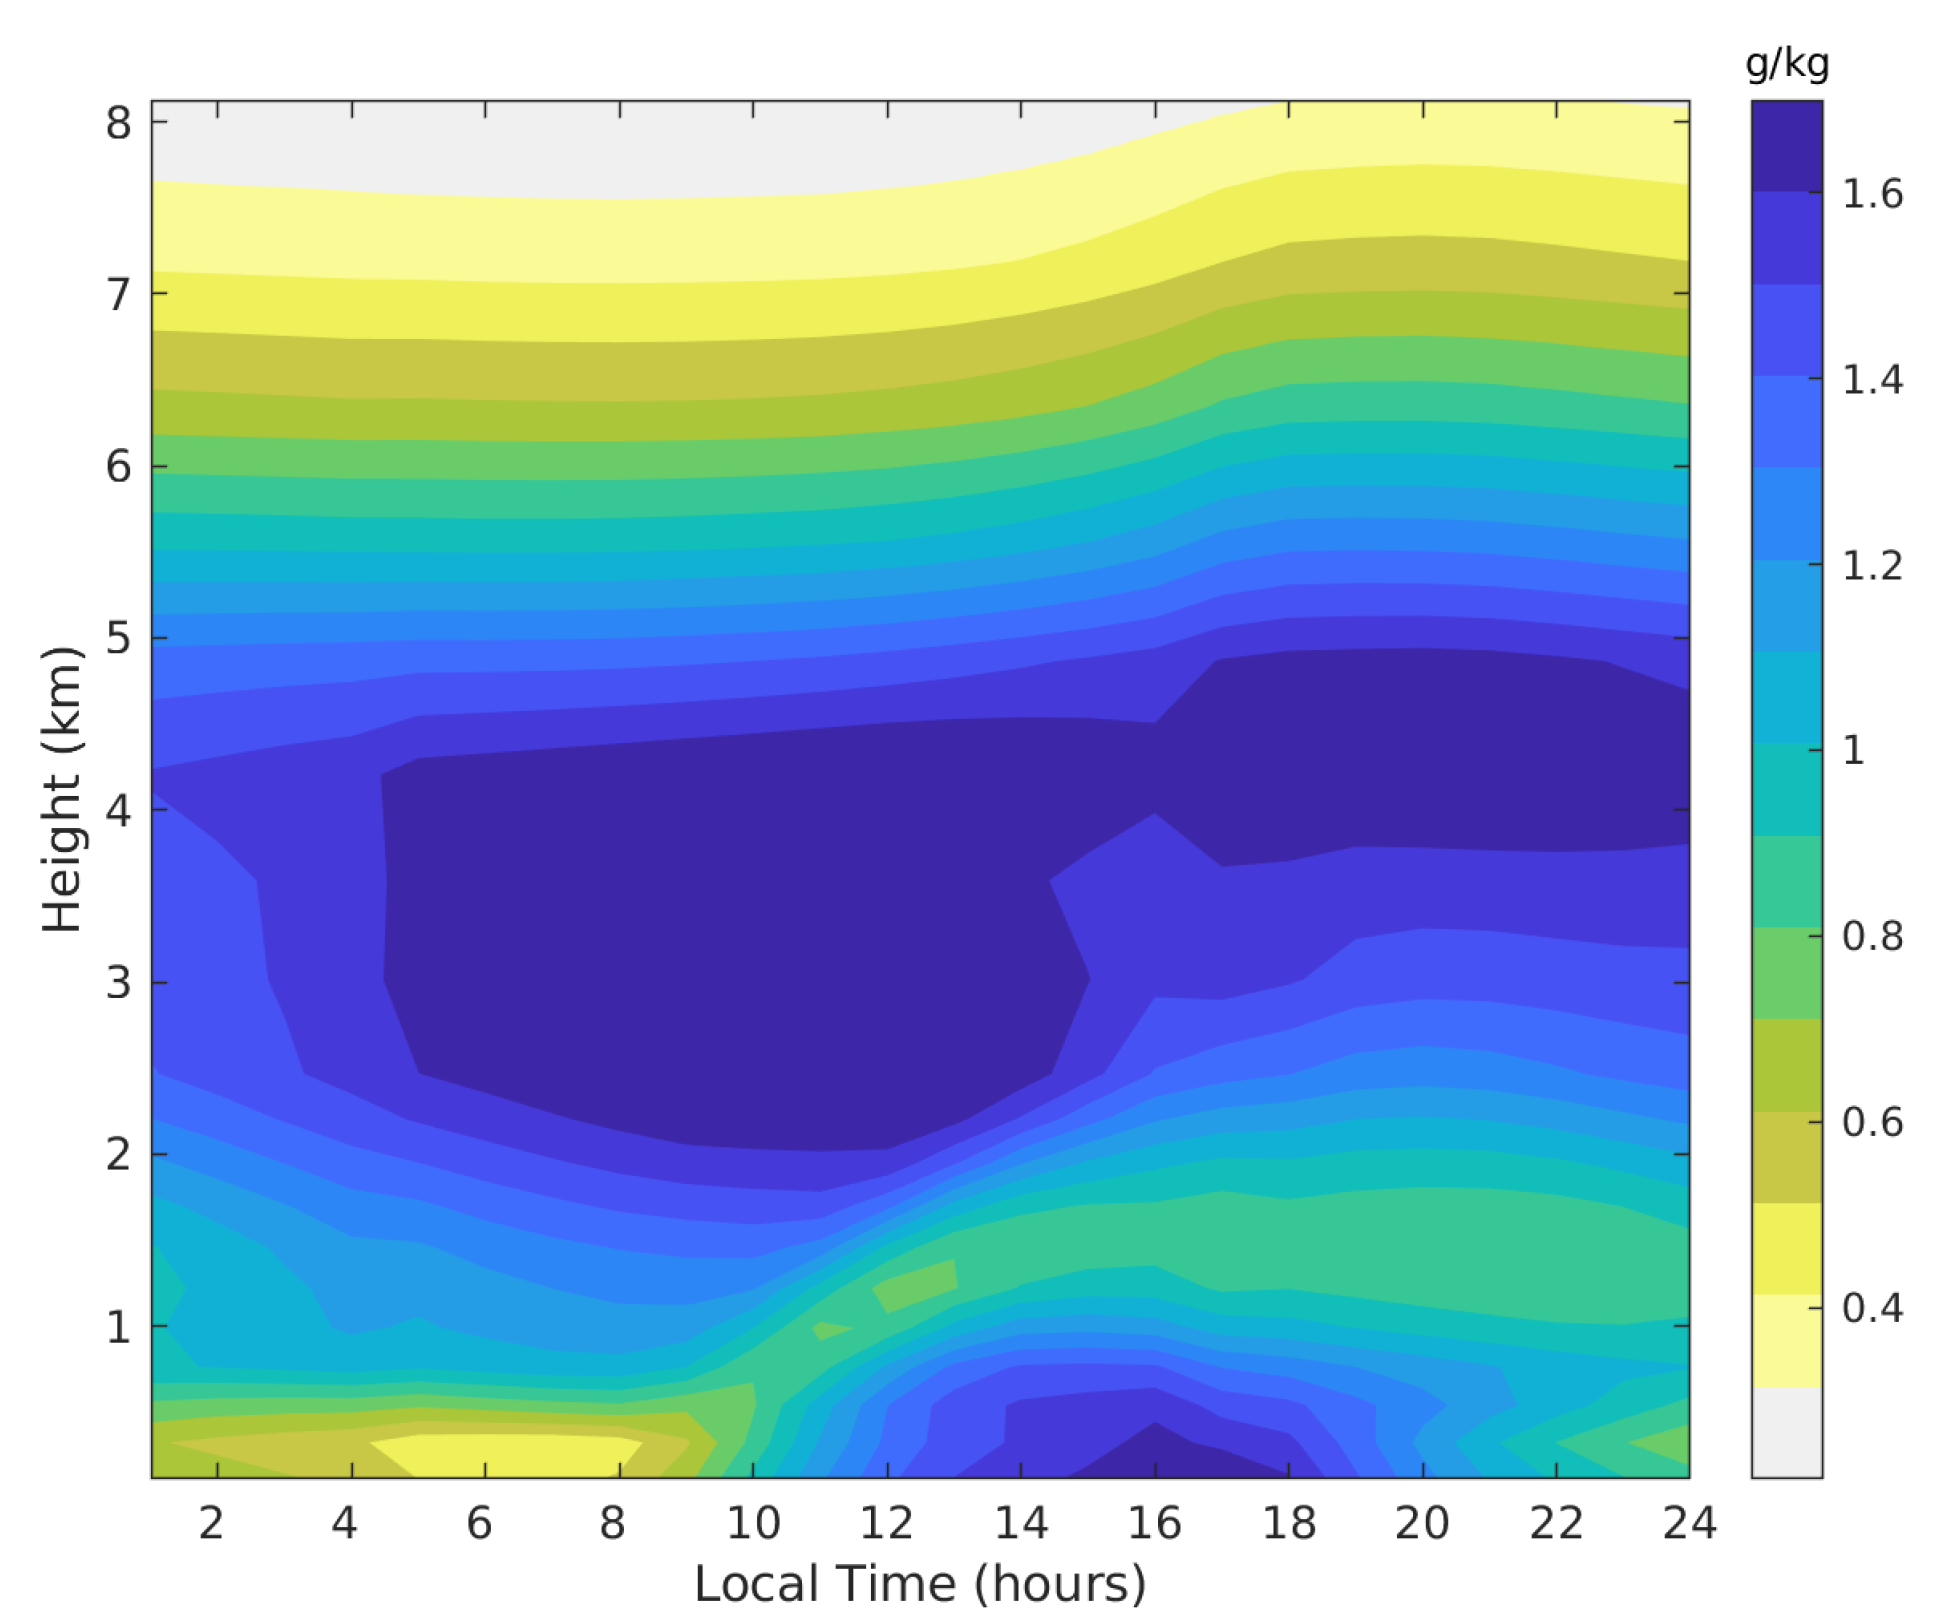
3.3. Tropospheric Humidity Profiles
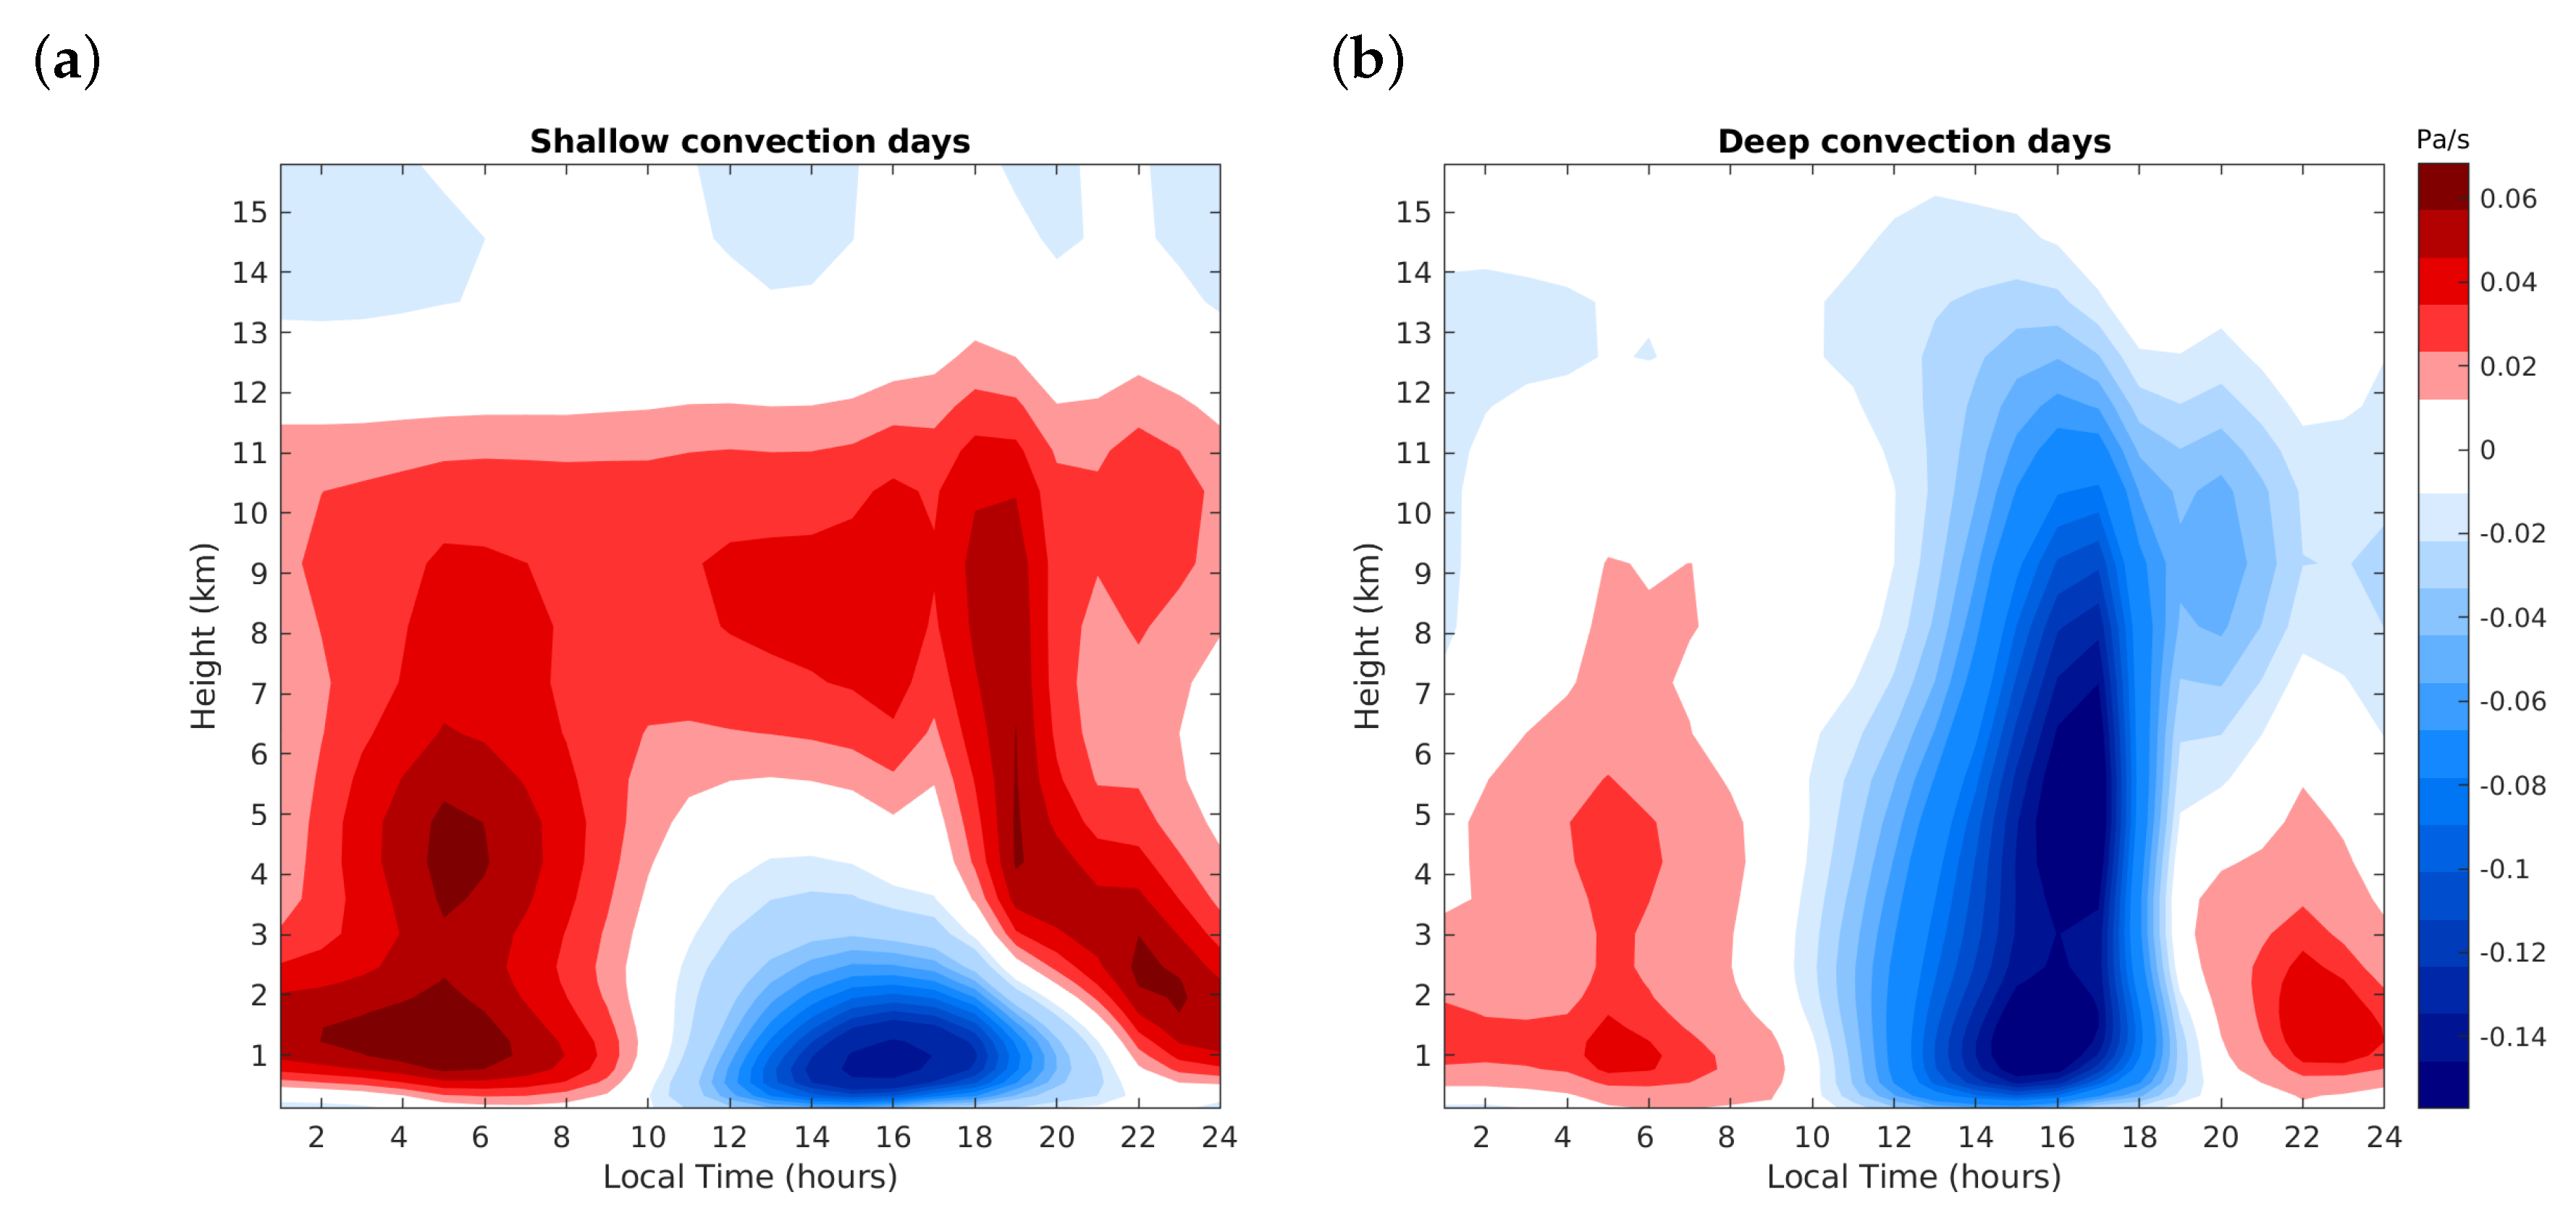
To explore the relevance of tropospheric moisture in regime transition, we present in Figure 6 the difference in specific humidity between DC and SC days as a function of time and height. The vertical profile is displayed only up to 8 km, since differences between both regimes were zero above that level. The largest contrast between DC and SC days is located in a layer from 2 to 4 km, especially from 6 to 14 LT. This indicates that, from sunrise to the time when deep convection initiates, there is more humidity available in DC than in SC days. The specific humidity in DC days in the 2–4 km layer is larger than in SC days, by about 1.6 g/kg on average. This is also observed near the surface, but to a lesser extent, with differences below 1 g/kg.
The spatial distribution of specific humidity differences for the 700 hPa level (∼3 km) at 10 LT is shown in Figure 7. Note that, as in Figure 6 all differences are positive, meaning that moisture is always larger in DC days. Note that 10 LT is selected to highlight the behavior of this variable before the regime transition occurs. As can be seen, the largest differences are concentrated at the center-northern part of the Peninsula. This spatial structure provides also insight of the pattern of convection in the afternoon DC regime in the Peninsula.

3.4. Wind Field

The area-averaged zonal (u) and meridional (v) wind components as a function of time and height are shown in Figure 8. Note that the field for the zonal component is quite similar under both SC and DC regimes, with almost the same pattern throughout the diurnal cycle, which is typical of the trade wind region in summertime. However, the evolution of the meridional component shows important differences between both regimes. Although near the surface there is a layer with a southerly component in both cases, on DC days this layer is deeper than on SC days, reaching up to 5 km. Furthermore, at mid-levels there is a northerly component that is stronger on SC days, from 5 km to the tropopause, with a maximum around 11 km during the early morning, up to 11 LT. In contrast, on DC days northerly winds are observed above 7 km in the early morning and above 10 km after 11 LT, and are much weaker in magnitude. Another noteworthy aspect is that during the early morning the southerly wind is close to zero in the layer around 4 km on SC days, while on DC days there are southerly winds penetrating deep in the troposphere, which may have implications for moisture advection since a major source of moisture, the western Caribbean Sea, is located south of the Yucatan Peninsula. Those southerly winds persist at mid-levels throughout the afternoon, coinciding with the deep convection observed on DC cases.
The vertical wind shear is computed for the layer between 1 and 5 km (Figure 9); note that shear is always larger on SC than on DC days, particularly during the hours prior to regime transition, when the largest differences are observed. For both convection regimes, shear starts decreasing at 6–8 LT before shallow convection initiates and increases back again at ∼18–20 LT, coinciding with the dissipation of the remnants of convection. However, the diurnal cycle on DC days displays its minimum earlier in time (∼13–14 LT) than on SC days (∼15 LT).

3.5. Stability

To illustrate the mechanisms related to atmospheric stability Figure 10a displays the differences in the area-averaged vertical lapse rate of temperature (dT/dz) between the DC and SC regimes. Note that in the shallow layer near the surface there are small differences during the early morning, and from 9 LT onward dT/dz is larger on SC days. However, in the layer between 2 and 4 km, the temperature lapse rate is about 0.4 °C/km larger on DC than on SC days throughout the diurnal cycle. This implicates that the atmosphere in the shallow cumulus layer is on average more unstable in DC days. The fact that the environmental temperature lapse rate has implications for the stability of rising parcels, has been emphasized in previous work by [25,26]. In Figure S2 of the Supplementary Material the diurnal cycles of temperature lapse rate for both SC and DC cases are shown, denoting that, in fact, the most noticeable differences are located in the 2–4 km layer.
As other authors [26,33] have remarked, the convective available potential energy (CAPE) is an important metric for quantifying the intensity of convection. In Figure 10b we present the diurnal pattern of CAPE for the convection regimes. During the early morning and up to 8 LT CAPE evolves similarly in both SC and DC cases, although it is about 200 J/kg larger in the latter. At 10 LT CAPE in SC days decreases largely consistent with a more stratified atmosphere in those days. In contrast, on DC days CAPE increases from 9 LT onwards indicating the availability of convective energy and a more unstable environment.
To determine the significance of some of these parameters during the transition, a Mann–Whitney non parametric test for the difference of the medians was applied to the datasets for SC and DC days. Figure 11 shows the results obtained for some of the parameters evaluated. The differences were evaluated at 10 LT, since the aim was to identify the atmospheric conditions during the morning that could lead to regime transition. Note that the total column water vapor is the most important parameter in terms of the difference between regimes, proving to be much larger for DC than for SC. Other variables, such as specific humidity, CAPE, dT/dz, v-wind at low and mid-levels, and surface latent heat flux are also significantly larger on DC than on SC days. On the other hand, both surface sensible heat flux and temperature at 10 LT are lower on DC days. Also vertical wind shear and 10 m wind speed are lower on DC days. Neither the mean sea level pressure nor the zonal wind component had statistically different medians. The analysis of the parameters at 11 LT yielded similar results to these presented for 10 LT.

4. Relationship of Atmospheric Variables with the Transition

4.1. Definition and Calculation of the Transition

As other authors have noted before [26,34], it is useful to define the transition in terms of the approximate time in the diurnal cycle when deep convection starts to develop. Some arbitrary metrics have been used to define it, such as total cloud condensate, precipitation rate, or cloud top height. Here we will use the concept of the center of mass of the cloud condensate as in [26], but defining instead the cloud condensate C as the sum of cloud liquid water and cloud ice mixing ratios. The center of mass of the cloud condensate is then defined as:
M c ( t ) = j = 1 h C t j z j m a x j = 1 h C t = 1 , j = 1 h C t = 2 , . . . j = 1 h C t = 24
where h is the total number of vertical levels (h = 27 for this study), C is the area-averaged cloud condensate at each vertical level j and time step t, and z is the height of each vertical level, in km. As can be seen, M c is estimated for every time step by multiplying the condensate in each level by its corresponding altitude and adding it for all vertical levels, and finally weighting it by the maximum value observed in the diurnal cycle. In this way, M c provides an estimate of the vertical location of the cloud mass as a whole and not the location of any individual convective tower.
The transition is thus defined based on the computed center of mass. In [26] they considered the rate of growth of the shallow convection as a reference for the transition time ( τ ). Instead, we search for the time within the diurnal cycle of M c when there is a “change point”, by computing the slopes of M c for every one-hour interval. The maximum value of the slope in the interval 12–15 LT is then found, indicating the time when the condensate experiences the largest change in its growth rate. In essence, this assumes that the cloud mass grows at different rates during shallow and deep convection.
This analysis is performed for each DC day in the period considered, in order to determine the time when the transition is observed, e.g., τ = 12, τ = 13, τ = 14, and τ = 15 LT. From the total of DC cases, 13.6% of them transitioned at 12 LT, 16.3% at 13 LT, 29.5% at 14 LT, and 40.6% at 15 LT. The percentages do not add up to exactly 100% because of round-off; nevertheless, it provides insight into the behavior of regime transition in the region in terms of the definition used.
Once the time of transition is noted for each DC day, we estimate the behavior of selected parameters as a function of τ . Figure 12 shows box-plot diagrams for the most relevant meteorological parameters at 10 LT from the previous analysis. These plots show how data are distributed for each τ .
The behavior is similar for the tcwv and the specific humidity at lower levels (Figure 12a,b), showing that for large values of atmospheric moisture the transition from shallow to deep convection tends to occur earlier, while for lower moisture values the transition occurs later. This result is in agreement with several previous studies and in particular, with a couple of recent studies over the Amazon, [16,17,18]. The surface sensible heat flux (Figure 12c) is lower for days where the transition occurs earlier, which may be explained by the larger amount of cloudiness in early hours typical of those days. This fact could evidence that neither the diurnal heating near the surface nor the surface heat flux are factors that trigger the deep convection and therefore, are not influencing the transition. Figure 12d shows the behavior of temperature lapse rate for every transition time. Although dT/dz has similar values for all the transition times, it appears to be slightly larger on days when transition occurs later. This suggests that a more unstable environment is related to a delayed transition. A possible explanation for this behavior is that in an atmosphere with a high amount of moisture, a more stable environment can cause the boundary layer to grow more slowly, and at the same time the accumulation of moisture is produced with more efficiency [33]. Other authors, such as [13], have found that more unstable conditions are associated with a later precipitation onset time in continental convection, in agreement with our results. The last parameter analyzed is the meridional wind component (Figure 12e,f). Even though this variable showed large differences between convective regimes, a well defined relationship with the transition is not evident, since similar values are seen irrespective of transition time. However, it is noticeable how the meridional wind component between 1 and 5 km is mostly positive, indicating that larger southerly winds at lower levels could favor an earlier transition.

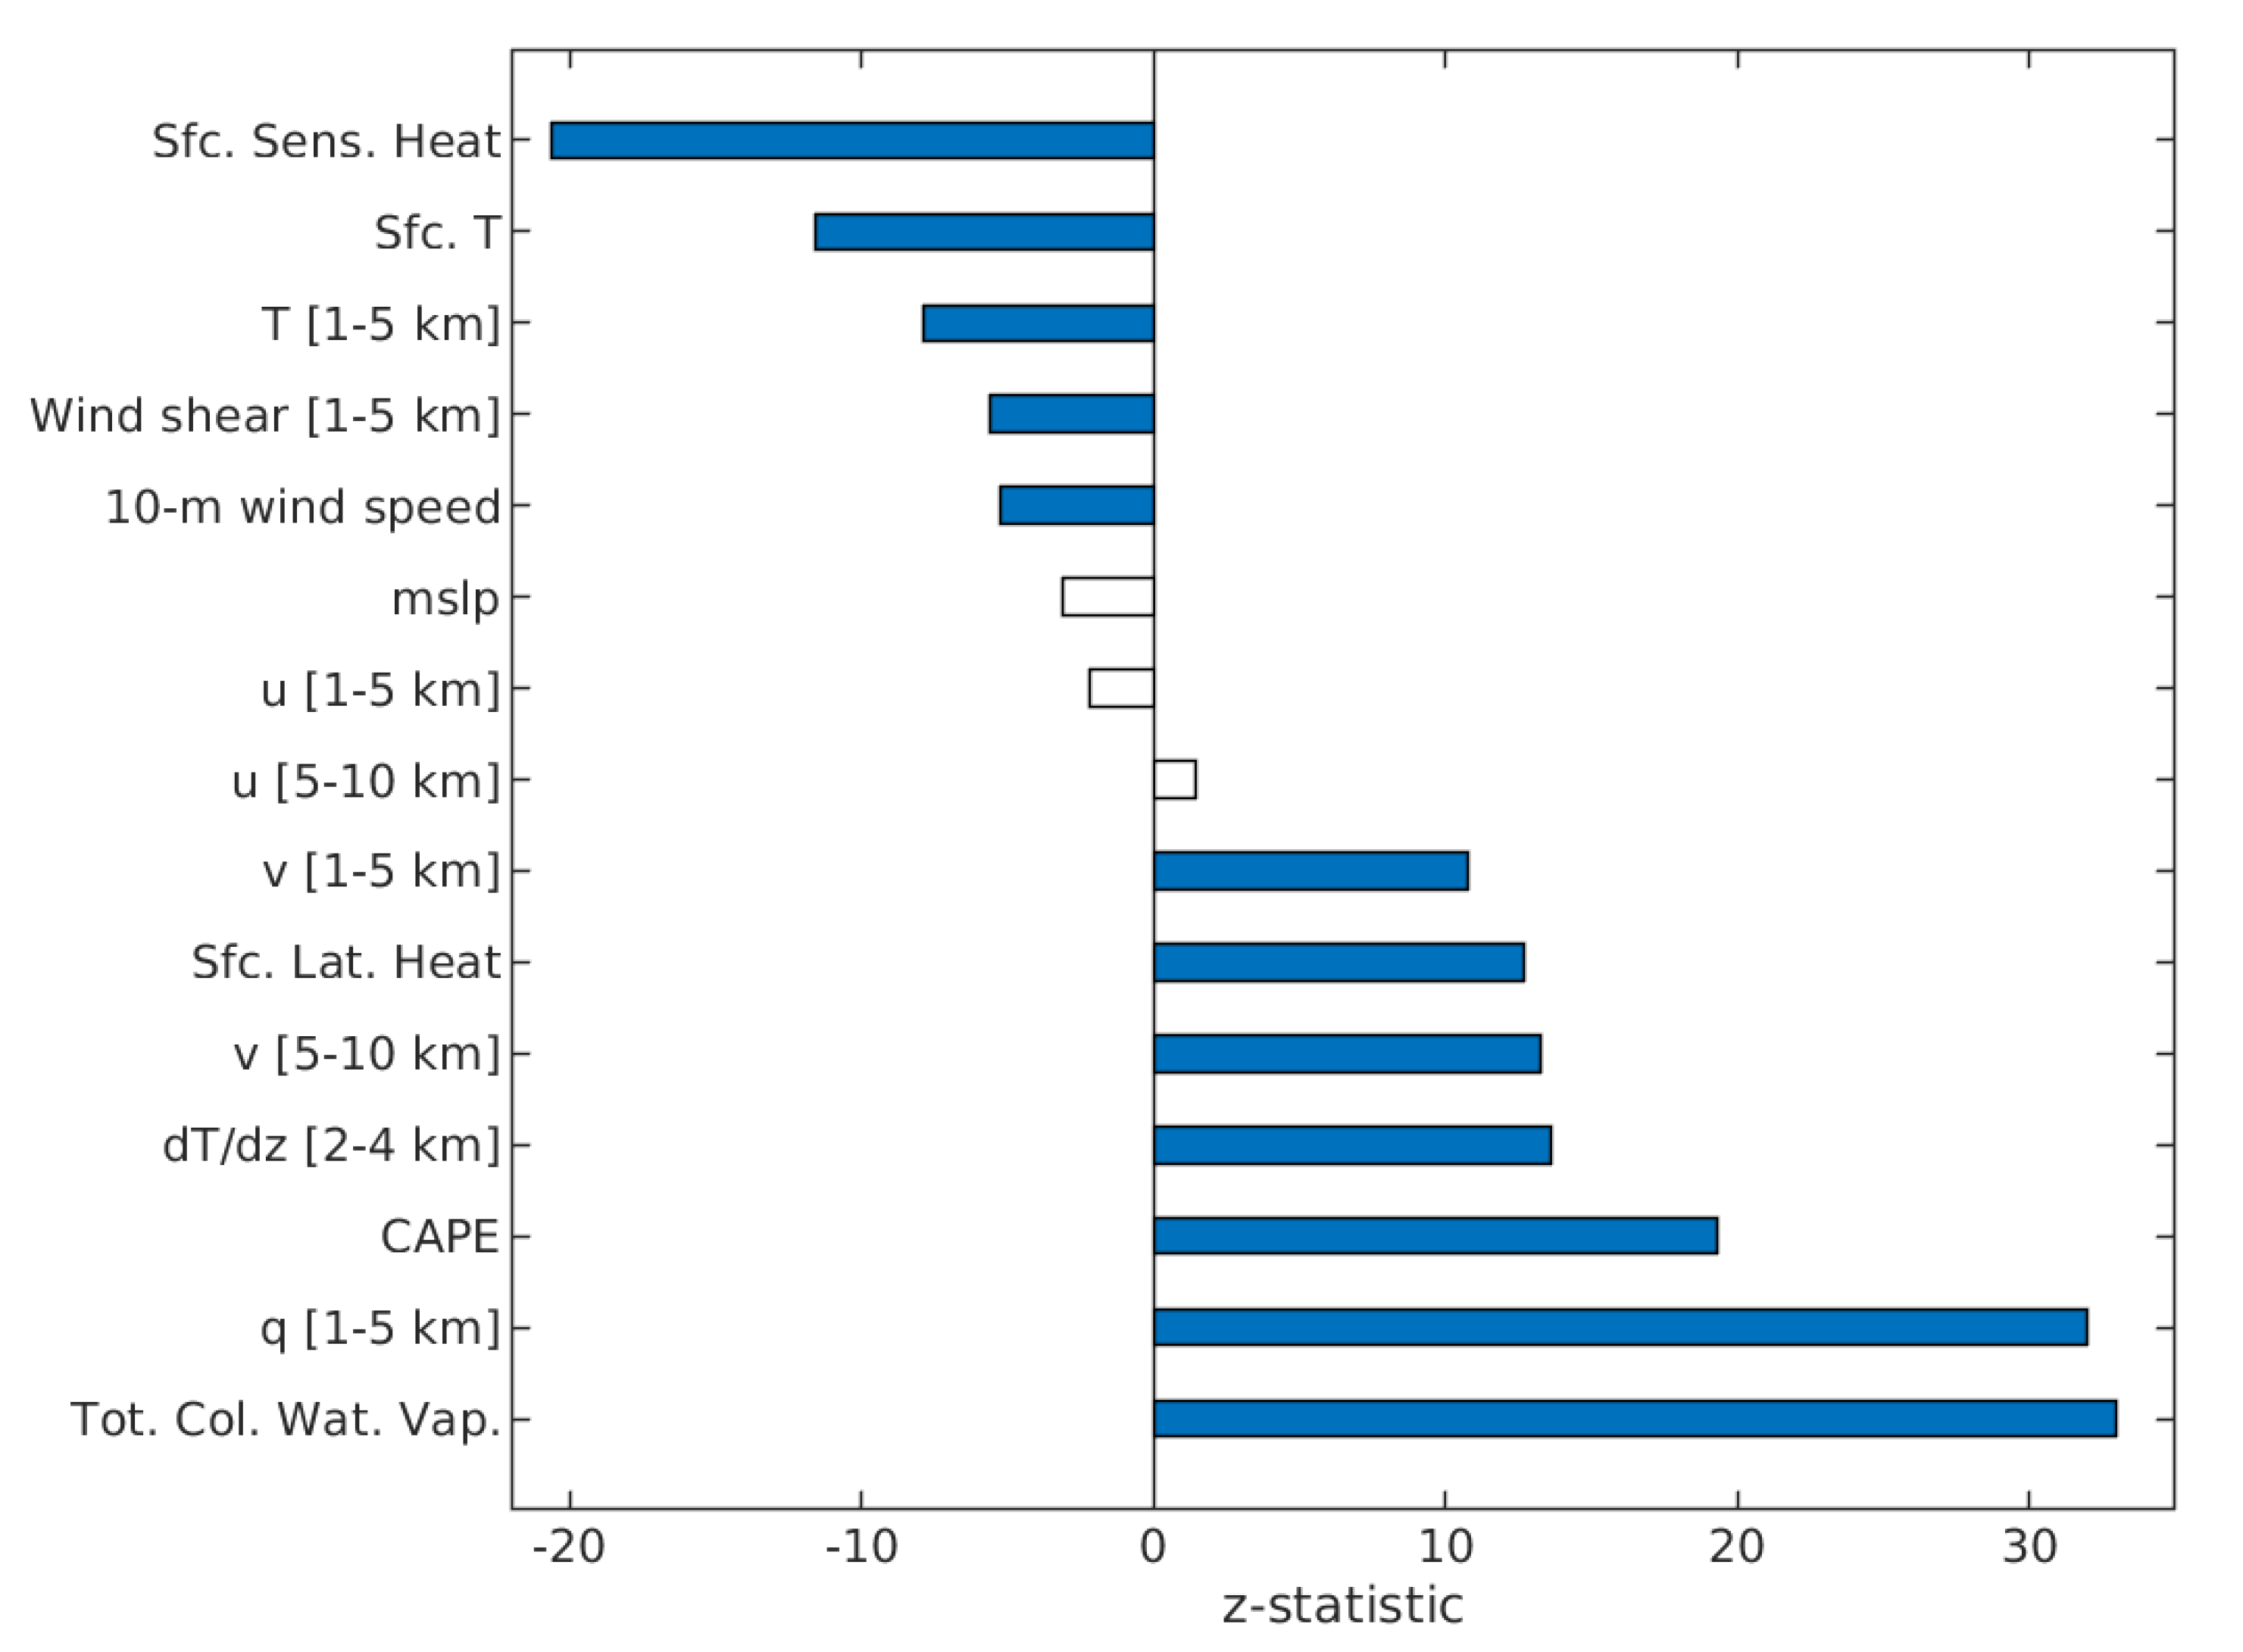
4.2. Convection Parameters

In order to further examine the relationship between atmospheric factors and the transition of shallow to deep convection in our region of interest, the 25th, 50th, 75th and 100th percentiles of the variables that showed the strongest relationship were calculated. Then, the maximum height reached by M c (Equation (3)) corresponding to those percentiles was plotted, as shown in Figure 13. Note that the temperature lapse rate in the 2–4 km layer evidences a positive relationship with the height of M c (Figure 13c), denoting that an increase in the atmospheric instability could lead to a vertical deepening of convection, although as shown before, is also associated with a delayed transition. Large values of CAPE are related to an increase in vertical development of cloud mass (Figure 13d), a result that highlights the importance of environmental instability for the intensity of deep convection. Also, larger humidity in the atmosphere corresponds to a vertical increase in height of M c (Figure 13a,b). The meridional wind at low and mid-levels (between 1 and 5 km) indicate that an increase in the intensity of positive v-component (southern wind) is associated with a deeper vertical ascent (Figure 13e). Similarly, at higher levels (5–10 km), larger negative v-wind correspond to a smaller vertical elevation of the condensate, which suggests that a stronger northerly component of v does not favor deep convection (Figure 13f).
A similar analysis performed for the total precipitation is shown in Figure 14. Note that increasing water vapor in the atmospheric column is associated with larger precipitation amounts (Figure 14a,b). The parameters of atmospheric stability, although showing a positive relationship with the deepening of clouds and with convection development, do not seem to have a relationship with the total precipitation, as evidenced in Figure 14c,d. Regarding the meridional wind component, a subtle behavior is seen, since for different ranges of winds the rainfall only varies by ∼2.5 mm/day. Similarly to the results from the analysis of the transition time and the maximum height of the condensate, large southerly winds (positive values) below 5 km are associated with more rainfall (Figure 14e), while large northerly winds (negative values) above 5 km are linked with less precipitation (Figure 14f).

5. Discussion and Conclusions

The study of deep convection and particularly the transition from shallow cumulus to deep cumulonimbus has received renewed attention recently, since some aspects have not been fully understood, affecting the quality of numerical forecasts. We address here the problem of the transition from shallow to deep convection over the Yucatan Peninsula from an observational point of view.
First, the full dataset was filtered (see Section 2) to select only days in which the synoptic forcing was small, to focus on local forcing of convection. The following step was to classify those selected days into two convective regimes: shallow convection versus deep convection. The results presented in the previous section indicate that there are some clear differences in surface and tropospheric meteorological variables in the morning between the two convective regimes. This comparison revealed large differences in low- and mid-level moisture at 10 LT, as expected, but more surprisingly, in the meridional wind component. Many observational and modeling studies have reported that the presence of low-level specific humidity favors deep convective development. A more humid troposphere not only benefits cloud processes by positively affecting buoyancy of rising parcels, but also it reduces evaporation of cloud droplets due to entrainment of sub-saturated air at different levels. However, there is less evidence discussing the relevance of the early morning behavior of the meridional wind component in the process of the transition from shallow to deep convection in tropical regions. This factor appears to be key in the region of interest.
The Yucatan Peninsula in eastern Mexico, located in the trade wind region has a fairly uniform and flat topography that prevents orographic forcing of convection. Moreover, it is near two major sources of moisture: the western Caribbean Sea and the Gulf of Mexico. The preferential flow over this region is the easterly trade wind regime, so that between May and October the humidity source is the Caribbean Sea. Our analysis indicates that a strengthening of the low- and mid-level meridional wind component can trigger the vertical development of the summertime shallow clouds and then favor the transition to a deep convective regime.
The near surface layer has a southerly component during the early morning, which is the typical pattern during summertime in this region. However, on deep convection days the southerly winds are observed in a deeper layer and are also more intense in magnitude. This fact has implications for convective development since the southerly flow advects moisture and heat from the western Caribbean Sea and from lower latitudes. To further explore this idea, the atmospheric moisture flux through the southern and eastern boundary of the Peninsula was computed ( q n , Equation (4)). Here Q is the vertically integrated moisture flux between two layers, which is given by Equation (5), where g is the acceleration of gravity, q is the specific humidity, V is the vector of horizontal wind, and P i n f and P s u p are the surface pressure of the inferior and superior layers, respectively. In Equation (4), L is the length of the boundary and n is the outward-pointing normal vector of the boundaries of the region [35,36].
q n = L Q · n d l
Q = 1 g P s u p P i n f q V d p .
We estimate q n for two layers: below and above 5 km, following from the previous analysis, to explore the importance of the humidity advection in each layer. Figure 15 shows that moisture transport is always larger in the eastern boundary for both layers, although with an order of magnitude of difference between the two layers. As expected, the humidity that enters the Peninsula is always larger on DC days. However, a more surprising result is that on SC days the humidity entering through the southern boundary in the 5–10 km layer is near zero during the morning and up to 10 LT (Figure 15b, top panel). This indicates that an important source for convective development—moisture advection from the Caribbean Sea—is missing; in contrast, in DC days there is a strong moisture flux through the southern boundary in this layer, with values up to 2 × 10 6 kg s 1 . This moisture flux is an important element to trigger deep convection, since low- to mid-levels during the early morning are more humid providing shallow convection with a more favorable environment for the transition.
In addition, our results reveal that the importance of the meridional wind component is not confined only to near surface layers. There appears to be also a modulation of the transition and convection characteristics by the meridional component at upper levels. As shown in Figure 8, the magnitude of meridional wind component around 10 km is smaller on days that experience deep convection. In fact, when analyzing the relationship of convection parameters with the meridional wind component between 5 and 10 km, the strong northerly component flow (negative v-wind) was associated with less precipitation and—although less clear—with a slightly later transition. This strong upper level northerly wind, which comes from continental North America is cooler and drier. Therefore, the presence of these intense winds prevents the preconditioning of the upper troposphere through the evaporation of cloudy parcels at the congestus stage. This behavior of the meridional wind in the upper troposphere could be an important factor in determining that developing convective clouds cannot transition into deep cumulonimbus.
Furthermore, the vertical wind shear was much stronger in shallow convection days than in deep convection days. However, it did not show any significant relationship with the transition and with convection parameters (not shown). This may be due to the fact that for the latter analysis we only selected deep convection days, when wind shear has small values, and less data dispersion.
It should be noted that there are feedback effects between winds and convection, and we are not ignoring the fact that the onset of deep convection affects wind behavior. However, in this work, emphasis has been made in the behavior of wind in the early morning (up to 10 LT), so it is ensured that, as far as this analysis concerns, winds are affecting the transition, and not the opposite way.
Future work should focus on a modeling approach to evaluate the sensitivity of convection in the region to the parameters that we have determined as relevant for the transition. This study validated the ERA5 database against the available observations (not explicitly shown here) in order to perform the analysis, but it would be also interesting to assess the sensitivity of the regime classification to other reanalysis databases such as North American Regional Reanalysis (NARR) or Modern-Era Retrospective analysis for Research and Applications (MERRA).

Supplementary Materials

The following are available at https://www.mdpi.com/2073-4433/10/11/700/s1, Figure S1 and Figure S2.

Author Contributions

Conceptualization, Y.D.-E. and G.B.R.; Methodology, Y.D.-E. and G.B.R.; Software, Y.D.-E.; Formal Analysis, Y.D.-E. and G.B.R.; Writing—Original Draft Preparation, Y.D.-E.; Writing—Review & Editing, G.B.R.; Supervision, G.B.R.; Funding Acquisition, G.B.R.

Funding

This research was partially funded by grant IN102818 from PAPIIT at UNAM. Also, Y.D.-E. acknowledges the support of CONACYT in Mexico.

Acknowledgments

The authors acknowledge the availability of the public data sets of the European Centre for Medium-Range Weather Forecasts (ECMWF), which was highly helpful for this work. Also, other freely available databases such as the ground based GPS network SuomiNet, the atmospheric soundings from the University of Wyoming and CHIRPS were greatly important to conduct this research. The comments and suggestions of the reviewers helped to improve the manuscript.

Conflicts of Interest

The authors declare no conflict of interest.

References

  1. Nesbitt, S.W.; Zipser, E.J. The diurnal cycle of rainfall and convective intensity according to three years of TRMM measurements. J. Clim. 2003, 16, 1456–1475. [Google Scholar] [CrossRef]
  2. Hohenegger, C.; Stevens, B. Controls on and impacts of the diurnal cycle of deep convective precipitation. J. Adv. Model. Earth Syst. 2013, 5, 801–815. [Google Scholar] [CrossRef]
  3. Dai, A.; Trenberth, K.E. The Diurnal Cycle and Its Depiction in the Community Climate System Model. J. Clim. 2004, 17, 930–951. [Google Scholar] [CrossRef]
  4. Collier, J.C.; Bowman, K.P. Diurnal cycle of tropical precipitation in a general circulation model. J. Geophys. Res. 2004, 109, D17105. [Google Scholar] [CrossRef]
  5. Bechtold, P.; Chaboureau, J.P.; Beljaars, A.; Betts, A.K.; Köhler, M.; Miller, M.; Redelsperger, J.L. The simulation of the diurnal cycle of convective precipitation over land in a global model. Q. J. R. Meteorol. Soc 2004, 130, 3119–3137. [Google Scholar] [CrossRef]
  6. Dai, A. Precipitation Characteristics in Eighteen Coupled Climate Models. J. Clim. 2006, 19, 4605–4630. [Google Scholar] [CrossRef]
  7. Lee, M.I.; Schubert, S.; Suarez, M.J.; Held, I.M.; Lau, N.C.; Ploshay, J.J.; Kumar, A.; Kim, H.K.; Schemm, J.K.E. An analysis of the warm-season diurnal cycle over the continental United States and northern Mexico in general circulation models. J. Hydrometeorol. 2007, 8, 344–366. [Google Scholar] [CrossRef]
  8. Stephens, G.L.; LEcuyer, T.; Forbes, R.; Gettlemen, A.; Golaz, J.C.; Bodas-Salcedo, A.; Suzuki, K.; Gabriel, P.; Haynes, J. Dreary state of precipitation in global models. J. Geophys. Res. 2010, 115, D24211. [Google Scholar] [CrossRef]
  9. Hannak, L.; Knippertz, P.; Fink, A.H.; Kniffka, A.; Pante, G. Why Do Global Climate Models Struggle to Represent Low-Level Clouds in the West African Summer Monsoon? J. Clim. 2017, 30, 1665–1687. [Google Scholar] [CrossRef]
  10. Yin, J.; Porporato, A. Diurnal cloud cycle biases in climate models. Nat. Commun. 2017, 8. [Google Scholar] [CrossRef]
  11. Guichard, F.; Petch, J.; Redelsperger, J.L.; Bechtold, P.; Chaboureau, J.P.; Cheinet, S.; Grabowski, W.; Greiner, H.; Jones, C.; Köhler, M.; et al. Modelling the diurnal cycle of deep precipitating convection over land with cloud-resolving models and single-column models. Q. J. R. Meteorol. Soc. 2004, 130, 3139–3172. [Google Scholar] [CrossRef]
  12. Derbyshire, S.H.; Beau, I.; Bechtold, P.; Grandpeix, J.Y.; Piriou, J.M.; Redelsperger, J.L.; Soares, P.M.M. Sensitivity of moist convection to environmental humidity. Q. J. R. Meteorol. Soc. 2004, 130, 3055–3079. [Google Scholar] [CrossRef]
  13. Zhang, Y.; Klein, S.A. Mechanisms Affecting the Transition from Shallow to Deep Convection over Land: Inferences from Observations of the Diurnal Cycle Collected at the ARM Southern Great Plains Site. J. Atmos. Sci. 2010, 67, 2943–2959. [Google Scholar] [CrossRef]
  14. Kirshbaum, D.J. Cloud-Resolving Simulations of Deep Convection over a Heated Mountain. J. Atmos. Sci. 2011, 68, 361–378. [Google Scholar] [CrossRef]
  15. Hagos, S.; Feng, Z.; Landu, K.; Long, C.N. Advection, moistening, and shallow-to-deep convection transitions during the initiation and propagation of Madden-Julian Oscillation. J. Adv. Model. Earth Syst. 2014, 6, 938–949. [Google Scholar] [CrossRef]
  16. Schiro, K.A.; Neelin, J.D.; Adams, D.K.; Lintner, B.R. Deep Convection and Column Water Vapor over Tropical Land versus Tropical Ocean: A Comparison between the Amazon and the Tropical Western Pacific. J. Atmos. Sci. 2016, 73, 4043–4063. [Google Scholar] [CrossRef]
  17. Zhuang, Y.; Fu, R.; Marengo, J.A.; Wang, H. Seasonal variation of shallow-to-deep convection transition and its link to the environmental conditions over the Central Amazon. J. Geophys. Res. Atmos. 2017, 122, 2649–2666. [Google Scholar] [CrossRef]
  18. Schiro, K.A.; Neelin, J.D. Deep Convective Organization, Moisture Vertical Structure, and Convective Transition Using Deep-Inflow Mixing. J. Atmos. Sci. 2019, 76, 966–987. [Google Scholar] [CrossRef]
  19. Tompkins, A.M. Organization of Tropical Convection in Low Vertical Wind Shears: The Role of Cold Pools. J. Atmos. Sci. 2001, 58, 1650–1672. [Google Scholar] [CrossRef]
  20. Khairoutdinov, M.; Randall, D. High-Resolution Simulation of Shallow-to-Deep Convection Transition over Land. J. Atmos. Sci. 2006, 63, 3421–3436. [Google Scholar] [CrossRef]
  21. Böing, S.J.; Jonker, H.J.J.; Siebesma, A.P.; Grabowski, W.W. Influence of the Subcloud Layer on the Development of a Deep Convective Ensemble. J. Atmos. Sci. 2012, 69, 2682–2698. [Google Scholar] [CrossRef]
  22. Schlemmer, L.; Hohenegger, C. The formation of wider and deeper clouds as a result of cold-pool dynamics. J. Atmos. Sci. 2014, 71, 2842–2858. [Google Scholar] [CrossRef]
  23. Torri, G.; Kuang, Z.; Tian, Y. Mechanisms for convection triggering by cold pools. Geophys. Res. Lett. 2015, 42, 1943–1950. [Google Scholar] [CrossRef]
  24. Kurowski, M.J.; Suselj, K.; Grabowski, W.W.; Teixeira, J. Shallow-to-Deep Transition of Continental Moist Convection: Cold Pools, Surface Fluxes, and Mesoscale Organization. J. Atmos. Sci. 2018, 75, 4071–4090. [Google Scholar] [CrossRef]
  25. Houston, A.L.; Niyogi, D. The Sensitivity of Convective Initiation to the Lapse Rate of the Active Cloud-Bearing Layer. Mon. Weather Rev. 2007, 135, 3013–3032. [Google Scholar] [CrossRef]
  26. Wu, C.M.; Stevens, B.; Arakawa, A. What Controls the Transition from Shallow to Deep Convection? J. Atmos. Sci. 2009, 66, 1793–1806. [Google Scholar] [CrossRef]
  27. Rieck, M.; Hohenegger, C.; Heerwaarden, C.C.v. The Influence of Land Surface Heterogeneities on Cloud Size Development. Mon. Weather Rev. 2014, 142, 3830–3846. [Google Scholar] [CrossRef]
  28. Lee, J.M.; Zhang, Y.; Klein, S. The Effect of Land Surface Heterogeneity and Background Wind on Shallow Cumulus Clouds and the Transition to Deeper Convection. J. Atmos. Sci. 2019, 76, 401–419. [Google Scholar] [CrossRef]
  29. Zhuang, Y.; Fu, R.; Wang, H. How Do Environmental Conditions Influence Vertical Buoyancy Structure and Shallow-to-Deep Convection Transition across Different Climate Regimes? J. Atmos. Sci. 2018, 75, 1909–1932. [Google Scholar] [CrossRef]
  30. ERA5: Fifth Generation of ECMWF Atmospheric Reanalyses of the Global Climate. Available online: https://www.ecmwf.int/en/forecasts/datasets/reanalysis-datasets/era5 (accessed on 1 May 2019).
  31. Ware, R.; Fulker, D.W.; Stein, S.A.; Anderson, D.N.; Avery, S.K.; Clark, R.D.; Droegemeier, K.; Kuettner, J.P.; Minster, J.B. Suominet: A real-time national GPS network for atmospheric research and education. Bull. Am. Meteorol. Soc. 2000, 87, 677–694. [Google Scholar] [CrossRef]
  32. Funk, C.; Peterson, P.; Landsfeld, M.; Pedreros, D.; Verdin, J.; Shukla, S.; Husak, G.; Rowland, J.; Harrison, L.; Hoell, A.; et al. The climate hazards infrared precipitation with stations—A new environmental record for monitoring extremes. Sci. Data 2015, 2, 150066. [Google Scholar] [CrossRef] [PubMed] [Green Version]
  33. Yin, Y.; Albertson, J.D.; Rigby, J.R.; Porporato, A. Land and atmospheric controls on initiation and intensity of moist convection: CAPE dynamics and LCL crossings. Water Resour. Res. 2015, 51, 8476–8493. [Google Scholar] [CrossRef]
  34. Yin, J.; Porporato, A. Response and Feedback of Cloud Diurnal Cycle to Rising Temperatures. arXiv 2017, arXiv:1703.08727. [Google Scholar]
  35. Schmitz, J.T.; Mullen, S.L. Water Vapor Transport Associated with the Summertime North American Monsoon as Depicted by ECMWF Analyses. J. Clim. 1996, 9, 1621–1634. [Google Scholar] [CrossRef]
  36. Lin, X.; Wen, Z.; Zhou, W.; Wu, R.; Chen, R. Effects of Tropical Cyclone Activity on the Boundary Moisture Budget over the Eastern China Monsoon Region. Adv. Atmos. Sci. 2017, 34, 700–712. [Google Scholar] [CrossRef]
Figure 1. Topography of the study region. Black boxes represent areas where synoptic forcing is filtered (See Section 2.2).
Atmosphere 10 00700 g001
Figure 2. Diurnal cycle of cloud fraction (top panel) and daily precipitation composites (bottom panel) for convection regimes: (a) SC and (b) DC.
Atmosphere 10 00700 g002
Figure 3. Diurnal cycle of vertical velocity for convection regimes: (a) SC and (b) DC.
Atmosphere 10 00700 g003
Figure 4. Diurnal cycle of surface variables for convection regimes SC and DC: (a) temperature and dew point, (b) relative humidity, (c) sea level pressure, (d) wind speed, and (e) total column water vapor.
Atmosphere 10 00700 g004
Figure 5. Diurnal cycle of the surface latent flux (top panel) and the surface sensible heat flux (bottom panel) for convection regimes SC and DC.
Atmosphere 10 00700 g005
Figure 6. Vertical distribution of the diurnal cycle of the difference (DC–SC) in specific humidity between the DC and SC regimes.
Atmosphere 10 00700 g006
Figure 7. Spatial distribution of the difference (DC–SC) in specific humidity between the DC and SC regimes at 700 hPa over the region of study, at 10 LT.
Atmosphere 10 00700 g007
Figure 8. Vertical distribution of the diurnal cycle of the zonal wind component (u) (top panel) and the meridional wind component (v) (bottom panel), for convection regimes: (a) SC and (b) DC.
Atmosphere 10 00700 g008
Figure 9. Diurnal cycle of the wind shear calculated between mid- (5 km) and low- (1 km) levels.
Atmosphere 10 00700 g009
Figure 10. (a) Vertical distribution of the diurnal cycle of the difference (DC–SC) in vertical temperature lapse rate, (b) diurnal cycle of CAPE for convection regimes SC and DC.
Atmosphere 10 00700 g010
Figure 11. The Mann-Whitney test for the difference of the medians. The value of the z-statistic for the 99% confidence level is shown; positive values indicate that the median of the DC datasets is significantly larger than the median of the SC datasets, and negative values indicate the opposite. Unfilled bars correspond to parameters that are not significant at the 99% level.
Atmosphere 10 00700 g011
Figure 12. Box-plots of meteorological parameters for different transition times (12, 13, 14 and 15 LT): (a) total column water vapor, (b) specific humidity between 1 and 5 km, (c) surface sensible heat flux, (d) temperature lapse rate, (e) meridional wind component (v) between 1 and 5 km, and (f) between 5 and 10 km.
Atmosphere 10 00700 g012
Figure 13. Maximum height reached by the centers of mass of the cloud condensate observed for different percentile ranges of atmospheric variables. The abscissa axis shows the average values of the intervals in terms of the percentiles: 1th ≤ x ≤ 25th; 25th < x ≤ 50th; 50th < x ≤ 75th; and 75th < x ≤ 100th, respectively.
Atmosphere 10 00700 g013
Figure 14. Total precipitation observed for different percentile ranges of atmospheric variables. The abscissa axis shows the average values of the intervals in terms of the percentiles: 1th ≤ x ≤ 25th; 25th < x ≤ 50th; 50th < x ≤ 75th; and 75th < x ≤ 100th, respectively.
Atmosphere 10 00700 g014
Figure 15. Atmospheric moisture transport in Yucatan Peninsula via the: (a) eastern and (b) southern boundary, for DC and SC days integrated in the 5–10 km layer (top panel) and the 1–5 km layer (bottom panel).
Atmosphere 10 00700 g015
Table 1. Thresholds of the maximum values of cloud fraction (max C F ) at different altitudes to discriminate between convection regime: shallow (SC) versus deep (DC).
Vertical Intervals
Convection Regime0.5–4 km4–8 km8–13 km
SCmax C F 0 . 2 max C F < 0 . 05 max C F < 0 . 05
DCmax C F 0 . 2 max C F > 0 max C F 0 . 2

