Evaluating Forecast Skills of Moisture from Convective-Permitting WRF-ARW Model during 2017 North American Monsoon Season
Abstract
1. Introduction
2. Data and Model Description
2.1. Overview of the Data Collection and Ground Reference
2.2. Convective-Permitting Model Configuration
3. Analysis Methods
3.1. Classifying IV and Non-IV Days
3.2. Forecast Skill Evaluation
3.3. Sensitivity Analysis
4. WRF Performance Evaluation
4.1. PWV and Precipitation Diurnal Cycles
4.2. Precipitation Diurnal Cycle in the Domain
4.3. Model Precipitation Skill Analysis
4.4. Sensitivity Analysis
5. Conclusions
Supplementary Materials
Author Contributions
Funding
Acknowledgments
Conflicts of Interest
References
- Castro, C.L.; McKee, T.B.; Pielke, R.A., Sr. The relationship of the North American monsoon to tropical and North Pacific sea surface temperatures as revealed by observational analyses. J. Clim. 2001, 14, 4449–4473. [Google Scholar] [CrossRef]
- Ray, A.J.; Garfin, G.M.; Wilder, M.; Vásquez-León, M.; Lenart, M.; Comrie, A.C. Applications of monsoon research: Opportunities to inform decision making and reduce regional vulnerability. J. Clim. 2007, 20, 1608–1627. [Google Scholar] [CrossRef]
- Willingham, K.M.; Thompson, E.J.; Howard, K.W.; Dempsey, C.L. Characteristics of Sonoran desert microbursts. Weather Forecast. 2011, 26, 94–108. [Google Scholar] [CrossRef]
- Adams, D.K.; Comrie, A.C. The North American monsoon. Bull. Am. Meteorol. Soc. 1997, 78, 2197–2213. [Google Scholar] [CrossRef]
- Douglas, M.W.; Maddox, R.A.; Howard, K. The Mexican monsoon. J. Clim. 1993, 6, 1665–1677. [Google Scholar] [CrossRef]
- Vivoni, E.R.; Gutiérrez-Jurado, H.A.; Aragón, C.A.; Méndez-Barroso, L.A.; Rinehart, A.J.; Wyckoff, R.L.; Rodríguez, J.C.; Watts, C.J.; Bolten, J.D.; Lakshmi, V.; et al. Variation of hydrometeorological conditions along a topographic transect in Northwestern Mexico during the North American monsoon. J. Clim. 2007, 20, 1792–1809. [Google Scholar] [CrossRef]
- Serra, Y.L.; Adams, D.K.; Minjarez-Sosa, C.; Moker, J.M., Jr.; Arellano, A.F.; Castro, C.L.; Quintanar, A.I.; Alatorre, L.; Granados, A.; Vazquez, G.E.; et al. The North American monsoon GPS transect experiment 2013. Bull. Am. Meteorol. Soc. 2016, 97, 2103–2115. [Google Scholar] [CrossRef]
- Moker, J.M.; Castro, C.L.; Arellano, A.F.; Serra, Y.L.; Adams, D.K. Convective-permitting hindcast simulations during the North American Monsoon GPS Transect Experiment 2013: Establishing baseline model performance without data assimilation. J. Appl. Meteorol. Climatol. 2018, 57, 1683–1710. [Google Scholar] [CrossRef]
- Gochis, D.J.; Jimenez, A.; Watts, C.J.; Garatuza-Payan, J.; Shuttleworth, W.J. Analysis of 2002 and 2003 warm-season precipitation from the North American Monsoon Experiment event rain gauge network. Mon. Weather Rev. 2004, 132, 2938–2953. [Google Scholar] [CrossRef]
- Nesbitt, S.W.; Gochis, D.J.; Lang, T.J. The diurnal cycle of clouds and precipitation along the Sierra Madre Occidental observed during NAME-2004: Implications for warm season precipitation estimation in complex terrain. J. Hydrometeorol. 2008, 9, 728–743. [Google Scholar] [CrossRef]
- Fuller, R.D.; Stensrud, D.J. The Relationship between tropical easterly waves and surges over the Gulf of California during the North American monsoon. Mon. Weather Rev. 2000, 128, 2983–2989. [Google Scholar] [CrossRef]
- Higgins, R.W.; Shi, W.; Hain, C. Relationships between Gulf of California moisture surges and precipitation in the Southwestern United States. J. Clim. 2004, 17, 2983–2997. [Google Scholar] [CrossRef]
- Higgins, W.; Gochis, D. Synthesis of results from the North American Monsoon Experiment (NAME) process study. J. Clim. 2007, 20, 1601–1607. [Google Scholar] [CrossRef]
- Zehnder, J.A. Dynamic mechanisms of the gulf surge. J. Geophys. Res. 2004, 109, D10107. [Google Scholar] [CrossRef]
- Bohn, T.J.; Vivoni, E.R. Process-based characterization of evapotranspiration sources over the North American monsoon region. Water Resour. Res. 2016, 52, 358–384. [Google Scholar] [CrossRef]
- Hu, H.; Dominguez, F. Evaluation of oceanic and terrestrial sources of moisture for the North American monsoon using numerical models and precipitation stable isotopes. J. Hydrometeorol. 2015, 16, 19–35. [Google Scholar] [CrossRef]
- Johnson, R.H.; Ciesielski, P.E.; L’Ecuyer, T.S.; Newman, A.J. Diurnal Cycle of Convection during the 2004 North American Monsoon Experiment. J. Clim. 2010, 23, 1060–1078. [Google Scholar] [CrossRef]
- Farfán, L.M.; Zehnder, J.A. Moving and stationary mesoscale convective systems over Northwest Mexico during the Southwest Area Monsoon Project. Weather Forecast. 1994, 9, 630–639. [Google Scholar] [CrossRef]
- Finch, Z.O.; Johnson, R.H. Observational analysis of an upper-level inverted trough during the 2004 North American Monsoon Experiment. Mon. Weather Rev. 2010, 138, 3540–3555. [Google Scholar] [CrossRef]
- Janowiak, J.E.; Dagostaro, V.J.; Kousky, V.E.; Joyce, R.J. An examination of precipitation in observations and model forecasts during NAME with emphasis on the diurnal cycle. J. Clim. 2007, 20, 1680–1692. [Google Scholar] [CrossRef]
- Pytlak, E.; Goering, M.; Bennett, A. Upper tropospheric troughs and their interaction with the North American monsoon. In Proceedings of the 19th American Meteorological Society Conference on Hydrology, San Diego, CA, USA, 9–13 January 2005; Available online: https://ams.confex.com/ams/Annual2005/techprogram/paper_85393.htm (accessed on 8 November 2018).
- Douglas, A.V.; Englehart, P.J. A climatological perspective of transient synoptic features during NAME 2004. J. Clim. 2007, 20, 1947–1954. [Google Scholar] [CrossRef]
- Adams, D.K.; Souza, E.P. CAPE and convective events in the Southwest during the North American monsoon. Mon. Weather Rev. 2009, 137, 83–98. [Google Scholar] [CrossRef]
- Bieda, S.W., III; Castro, C.L.; Mullen, S.L.; Comrie, A.C.; Pytlak, E. The relationship of transient upper-level troughs to variability of the North American monsoon system. J. Clim. 2009, 22, 4213–4227. [Google Scholar] [CrossRef]
- Mo, K.C.; Schemm, J.K.; Juang, H.M.H.; Higgins, R.W. Impact of model resolution on the prediction of summer precipitation over the United States and Mexico. J. Clim. 2005, 18, 3910–3927. [Google Scholar] [CrossRef]
- Gutzler, D.S.; Long, L.N.; Schemm, J.; Baidya Roy, S.; Bosilovich, M.; Collier, J.C.; Kanamitsu, M.; Kelly, P.; Lawrence, D.; Lee, M.-I.; et al. Simulations of the 2004 North American monsoon: NAMAP2. J. Clim. 2009, 22, 6716–6740. [Google Scholar] [CrossRef]
- Prein, A.F.; Langhans, W.; Fosser, G.; Ferrone, A.; Ban, N.; Goergen, K.; Keller, M.; Tölle, M.; Gutjahr, O.; Feser, F.; et al. A review on regional convection-permitting climate modeling: Demonstrations, prospects, and challenges. Rev. Geophys. 2015, 53, 323–361. [Google Scholar] [CrossRef] [PubMed]
- Kursinski, E.R.; Adams, D.K.; Leuthold, M. GPS observations of precipitable water and implications for the predictability of precipitation during the North American monsoon. CLIVAR Exch. 2008, 45, 19–21. [Google Scholar]
- Bevis, M.; Businger, S.; Herring, T.A.; Rocken, C.; Anthes, R.A.; Ware, R.H. GPS meteorology: Remote sensing of atmospheric water vapor using the Global Positioning System. J. Geophys. Res. 1992, 97, 15787–15801. [Google Scholar] [CrossRef]
- Moore, A.W.; Small, I.J.; Gutman, S.I.; Bock, Y.; Dumas, J.L.; Fang, P.; Haase, J.S.; Jackson, M.E.; Laber, J.L. National Weather Service forecasters use GPS precipitable water vapor for enhanced situational awareness during the Southern California summer monsoon. Bull. Am. Meteorol. Soc. 2015, 96, 1867–1877. [Google Scholar] [CrossRef]
- Rocken, C.; Ware, R.; Van Hove, T.; Solheim, F.; Alber, C.; Johnson, J. Sensing atmospheric water vapor with the Global Positioning System. Geophys. Res. Lett. 1993, 20, 2631–2634. [Google Scholar] [CrossRef]
- Fernandes, R.M.S.; Bastos, L.; Miranda, J.M.; Lourenço, N.; Ambrosius, B.A.C.; Noomen, R.; Simons, W. Defining the plate boundaries in the Azores region. J. Volcanol. Geotherm. Res. 2006, 156, 1–9. [Google Scholar] [CrossRef]
- Adams, D.K.; Fernandes, R.M.S.; Maia, J.M.F. GNSS precipitable water vapor from an Amazonian rain forest flux tower. J. Atmos. Ocean. Tech. 2011, 28, 1192–1198. [Google Scholar] [CrossRef]
- Adams, D.K.; Fernandes, R.M.S.; Holub, K.L.; Gutman, S.I.; Barbosa, H.M.J.; Machado, L.A.T.; Calheiros, A.J.P.; Bennett, R.A.; Kursinski, E.R.; Sapucci, L.F.; et al. The Amazon dense GNSS meteorological network: A new approach for examining water vapor and deep convection interactions in the tropics. Bull. Am. Meteorol. Soc. 2015, 96, 2151–2165. [Google Scholar] [CrossRef]
- Adams, D.K.; Barbosa, H.M.J.; De Los Ríos, K.P.G. A spatiotemporal water vapor–deep convection correlation metric derived from the Amazon dense GNSS meteorological network. Mon. Weather Rev. 2017, 145, 279–288. [Google Scholar] [CrossRef]
- Huffman, G.J.; Bolvin, D.T.; Braithwaite, D.; Hsu, K.; Joyce, R.; Kidd, C.; Nelkin, E.J.; Sooroshian, S.; Tan, J.; Xie, P. Algorithm Theoretical Basis Document Version 5.1. NASA Global Precipitation Measurement (GPM) Integrated Multi-Satellite Retrievals for GPM (IMERG); NASA: Greenbelt, MD, USA, 2017.
- Hou, A.Y.; Kakar, R.K.; Neeck, S.; Azabarzin, A.A.; Kummerow, C.D.; Kojima, M.; Oki, R.; Nakamura, K.; Iguchi, T. The global precipitation measurement mission. Bull. Am. Meteorol. Soc. 2014, 99, 701–722. [Google Scholar] [CrossRef]
- Joyce, R.J.; Janowiak, J.E.; Arkin, P.A.; Xie, P. CMORPH: A method that produces global precipitation estimates from passive microwave and infrared data at high spatial and temporal resolution. J. Hydrometeorol. 2004, 5, 487–503. [Google Scholar] [CrossRef]
- Sorooshian, S.; Gao, X.; Hsu, K.; Maddox, R.A.; Hong, Y.; Imam, B.; Gupta, H.V. Diurnal variability of tropical rainfall retrived from combined GOES and TRMM satellite information. J. Clim. 2002, 15, 983–1001. [Google Scholar] [CrossRef]
- Dinku, T.; Ceccato, P.; Connor, S.J. Challenges of satellite rainfall estimation over mountainous and arid parts of east Africa. Int. J. Remote Sens. 2011, 32, 5965–5979. [Google Scholar] [CrossRef]
- Mei, Y.; Anagnostou, E.N.; Nikolopoulos, E.I.; Borga, M. Error analysis of satellite precipitation products in mountainous basins. J. Hydrometeorol. 2014, 15, 1778–1793. [Google Scholar] [CrossRef]
- Zhang, C.; Chen, X.; Shao, H.; Chen, S.; Liu, T.; Chen, C.; Ding, Q.; Du, H. Evaluation and intercomparison of high-resolution satellite precipitation estimates—GPM, TRMM, and CMORPH in the Tianshan mountain area. Remote Sens. 2018, 10, 1543. [Google Scholar] [CrossRef]
- Kim, K.; Park, J.; Baik, J.; Choi, M. Evaluation of topographical and seasonal feature using GPM IMERG and TRMM 3B42 over Far-East Asia. Atmos. Res. 2017, 187, 95–105. [Google Scholar] [CrossRef]
- Tan, M.L.; Duan, Z. Assessment of GPM and TRMM precipitation products over Singapore. Remote Sens. 2017, 9, 720. [Google Scholar] [CrossRef]
- Zhou, T.; Yu, R.; Chen, H.; Dai, A.; Pan, Y. Summer precipitation frequency, intensity, and diurnal cycle over China: A comparison of satellite data with rain gauge observations. J. Clim. 2008, 21, 3997–4010. [Google Scholar] [CrossRef]
- Skamarock, W.C.; Klemp, J.B. A time-split nonhydrostatic atmospheric model for weather research and forecasting applications. J. Comp. Phys. 2008, 227, 3465–3485. [Google Scholar] [CrossRef]
- Hong, S.-Y.; Lim, J.-O.J. The WRF single-moment 6-class microphysics scheme (WSM6). J. Korean Meteorol. Soc. 2006, 42, 129–151. [Google Scholar]
- Iacono, M.J.; Dalemere, S.; Mlawer, E.J.; Shephard, M.W.; Clough, S.A.; Collins, W.D. Radiative forcing by long-lived greenhouse gases: Calculations with the AER radiative transfer models. J. Geophys. Res. 2008, 113, D13103. [Google Scholar] [CrossRef]
- Chou, M.-D.; Suarez, M.J. A Solar Radiation Parameterization for Atmospheric Studies. In Technical Report Series on Global Modeling and Data Assimilation; NASA/TM-1999-104606; NASA: Washington, DC, USA, 1999; Volume 15. Available online: https://ntrs.nasa.gov/archive/nasa/casi.ntrs.nasa.gov/19990060930.pdf (accessed on 4 April 2018).
- Niu, G.-Y.; Yang, Z.-L.; Mitchell, K.E.; Chen, F.; Ek, M.B.; Barlage, M. The community Noah land surface model with multiparameterization options (Noah-MP): 1. Model description and evaluation with local-scale measurements. J. Geophys. Res. Atmos. 2011, 116, D12. [Google Scholar] [CrossRef]
- Hong, S.Y.; Noh, Y.; Dudhia, J. A new vertical diffusion package with an explicit treatment of entrainment processes. Mon. Weather Rev. 2006, 134, 2318–2341. [Google Scholar] [CrossRef]
- Donaldson, R.J.; Dyer, R.M.; Krauss, M.J. An objective evaluator of techniques for predicting severe weather events. In Proceedings of the American Meteorological Society 9th Conference on Severe Local Storms, Norman, OK, USA, 21–23 October 1975; pp. 321–326. [Google Scholar]
- Wilks, D.S. Statistical Methods in the Atmospheric Sciences, 2nd ed.; Academic Press: Burlington, MA, USA, 2006; pp. 262–265. [Google Scholar]
- Livezey, R.E.; Chen, W.Y. Statistical field significance and its determination by Monte Carlo techniques. Mon. Weather. Rev. 1983, 111, 46–59. [Google Scholar] [CrossRef]
- Torn, R.D.; Hakim, G.J. Ensemble-based sensitivity analysis. Mon. Weather. Rev. 2008, 136, 663–677. [Google Scholar] [CrossRef]
- Torn, R.D.; Romine, G.S.; Galarneau, T.J., Jr. Sensitivity of dryline convection forecasts to upstream forecast errors two weakly forced MPEX cases. Mon. Weather Rev. 2017, 145, 1831–1852. [Google Scholar] [CrossRef]
- Barker, D.; Huang, X.-Y.; Liu, Z.; Auligné, T.; Zhang, X.; Rugg, S.; Ajjaji, R.; Bourgeois, A.; Bray, J.; Chen, Y.; et al. The weather research and forecasting model’s community variational/ensemble data assimilation system: WRFDA. Bull. Am. Meteorol. Soc. 2012, 93, 831–843. [Google Scholar] [CrossRef]
- Saslo, S.; Greybush, S.J. Prediction of lake-effect snow using convection-allowing ensemble forecasts and regional data assimilation. Weather Forecast. 2017, 32, 1727–1744. [Google Scholar] [CrossRef]
- Banacos, P.C.; Schultz, D.M. The use of moisture flux convergence in forecasting convective initiation: Historical and operational perspectives. Weather Forecast. 2005, 20, 351–366. [Google Scholar] [CrossRef]
- Falvey, M.; Garreaud, R. Wintertime precipitation episodes in central Chile: Associated meteorological conditions and orographic influences. J. Hydrometeorol. 2007, 8, 171–193. [Google Scholar] [CrossRef]
- Barret, B.S.; Garreaud, R.D.; Falvey, M. Effect of the Andes cordillera on precipitation from a midlatitude cold front. Mon. Weather Rev. 2009, 137, 3092–3109. [Google Scholar] [CrossRef]
- Massmann, A.K.; Minder, J.R.; Garreaud, R.D.; Kingsmill, D.E.; Valenzuela, R.A.; Montecinos, A.; Fults, S.L.; Snider, J.R. The Chilean coastal orographic precipitation experiment: Observing the influence of microphysical rain regimes on coastal orographic precipitation. J. Hydrometeorol. 2017, 18, 2723–2743. [Google Scholar] [CrossRef]
- Barry, R.G. Mountain Weather and Climate, 3rd ed.; Cambridge University Press: New York, NY, USA, 2008; p. 2. [Google Scholar]
- Luong, T.M.; Castro, C.L.; Nguyen, T.M.; Cassell, W.W.; Chang, H.-I. Improvement in the modeled representation of North American Monsoon precipitation using a modified Kain-Fritsch convective parameterization scheme. Atmosphere 2018, 9, 31. [Google Scholar] [CrossRef]
- Vincent, C.L.; Lane, T.P. Evolution of diurnal precipitation cycle with the passage of a Madden-Julian Oscillation event through the Maritime Continent. Mon. Weather Rev. 2016, 144, 1983–2005. [Google Scholar] [CrossRef]
- Hassim, M.E.E.; Lane, T.P.; Grabowski, W.W. The diurnal cycle of rainfall over New Guinea in convection-permitting WRF simulations. Amos. Chem. Phys. 2016, 16, 161–175. [Google Scholar] [CrossRef]
- Kunz, M.; Kottmeier, C. Orographic enhancement of precipitation over low mountain ranges. Part I: Model formulation and idealized simulations. J. Appl. Meteorol. Climatol. 2006, 45, 1025–1040. [Google Scholar] [CrossRef]
- Watson, C.D.; Lane, T.P. Sensitivities of orographic precipitation to terrain geometry and upstream conditions in idealized simulations. J. Atmos. Sci. 2012, 69, 1208–1231. [Google Scholar] [CrossRef]
- Mölg, T.; Chiang, J.C.H.; Gohm, A.; Cullen, N.J. Temporal precipitation variability versus altitude on a tropical high mountain: Observations and mesoscale atmospheric modeling. Q. J. R. Meteorol. Soc. 2009, 135, 1439–1455. [Google Scholar] [CrossRef]
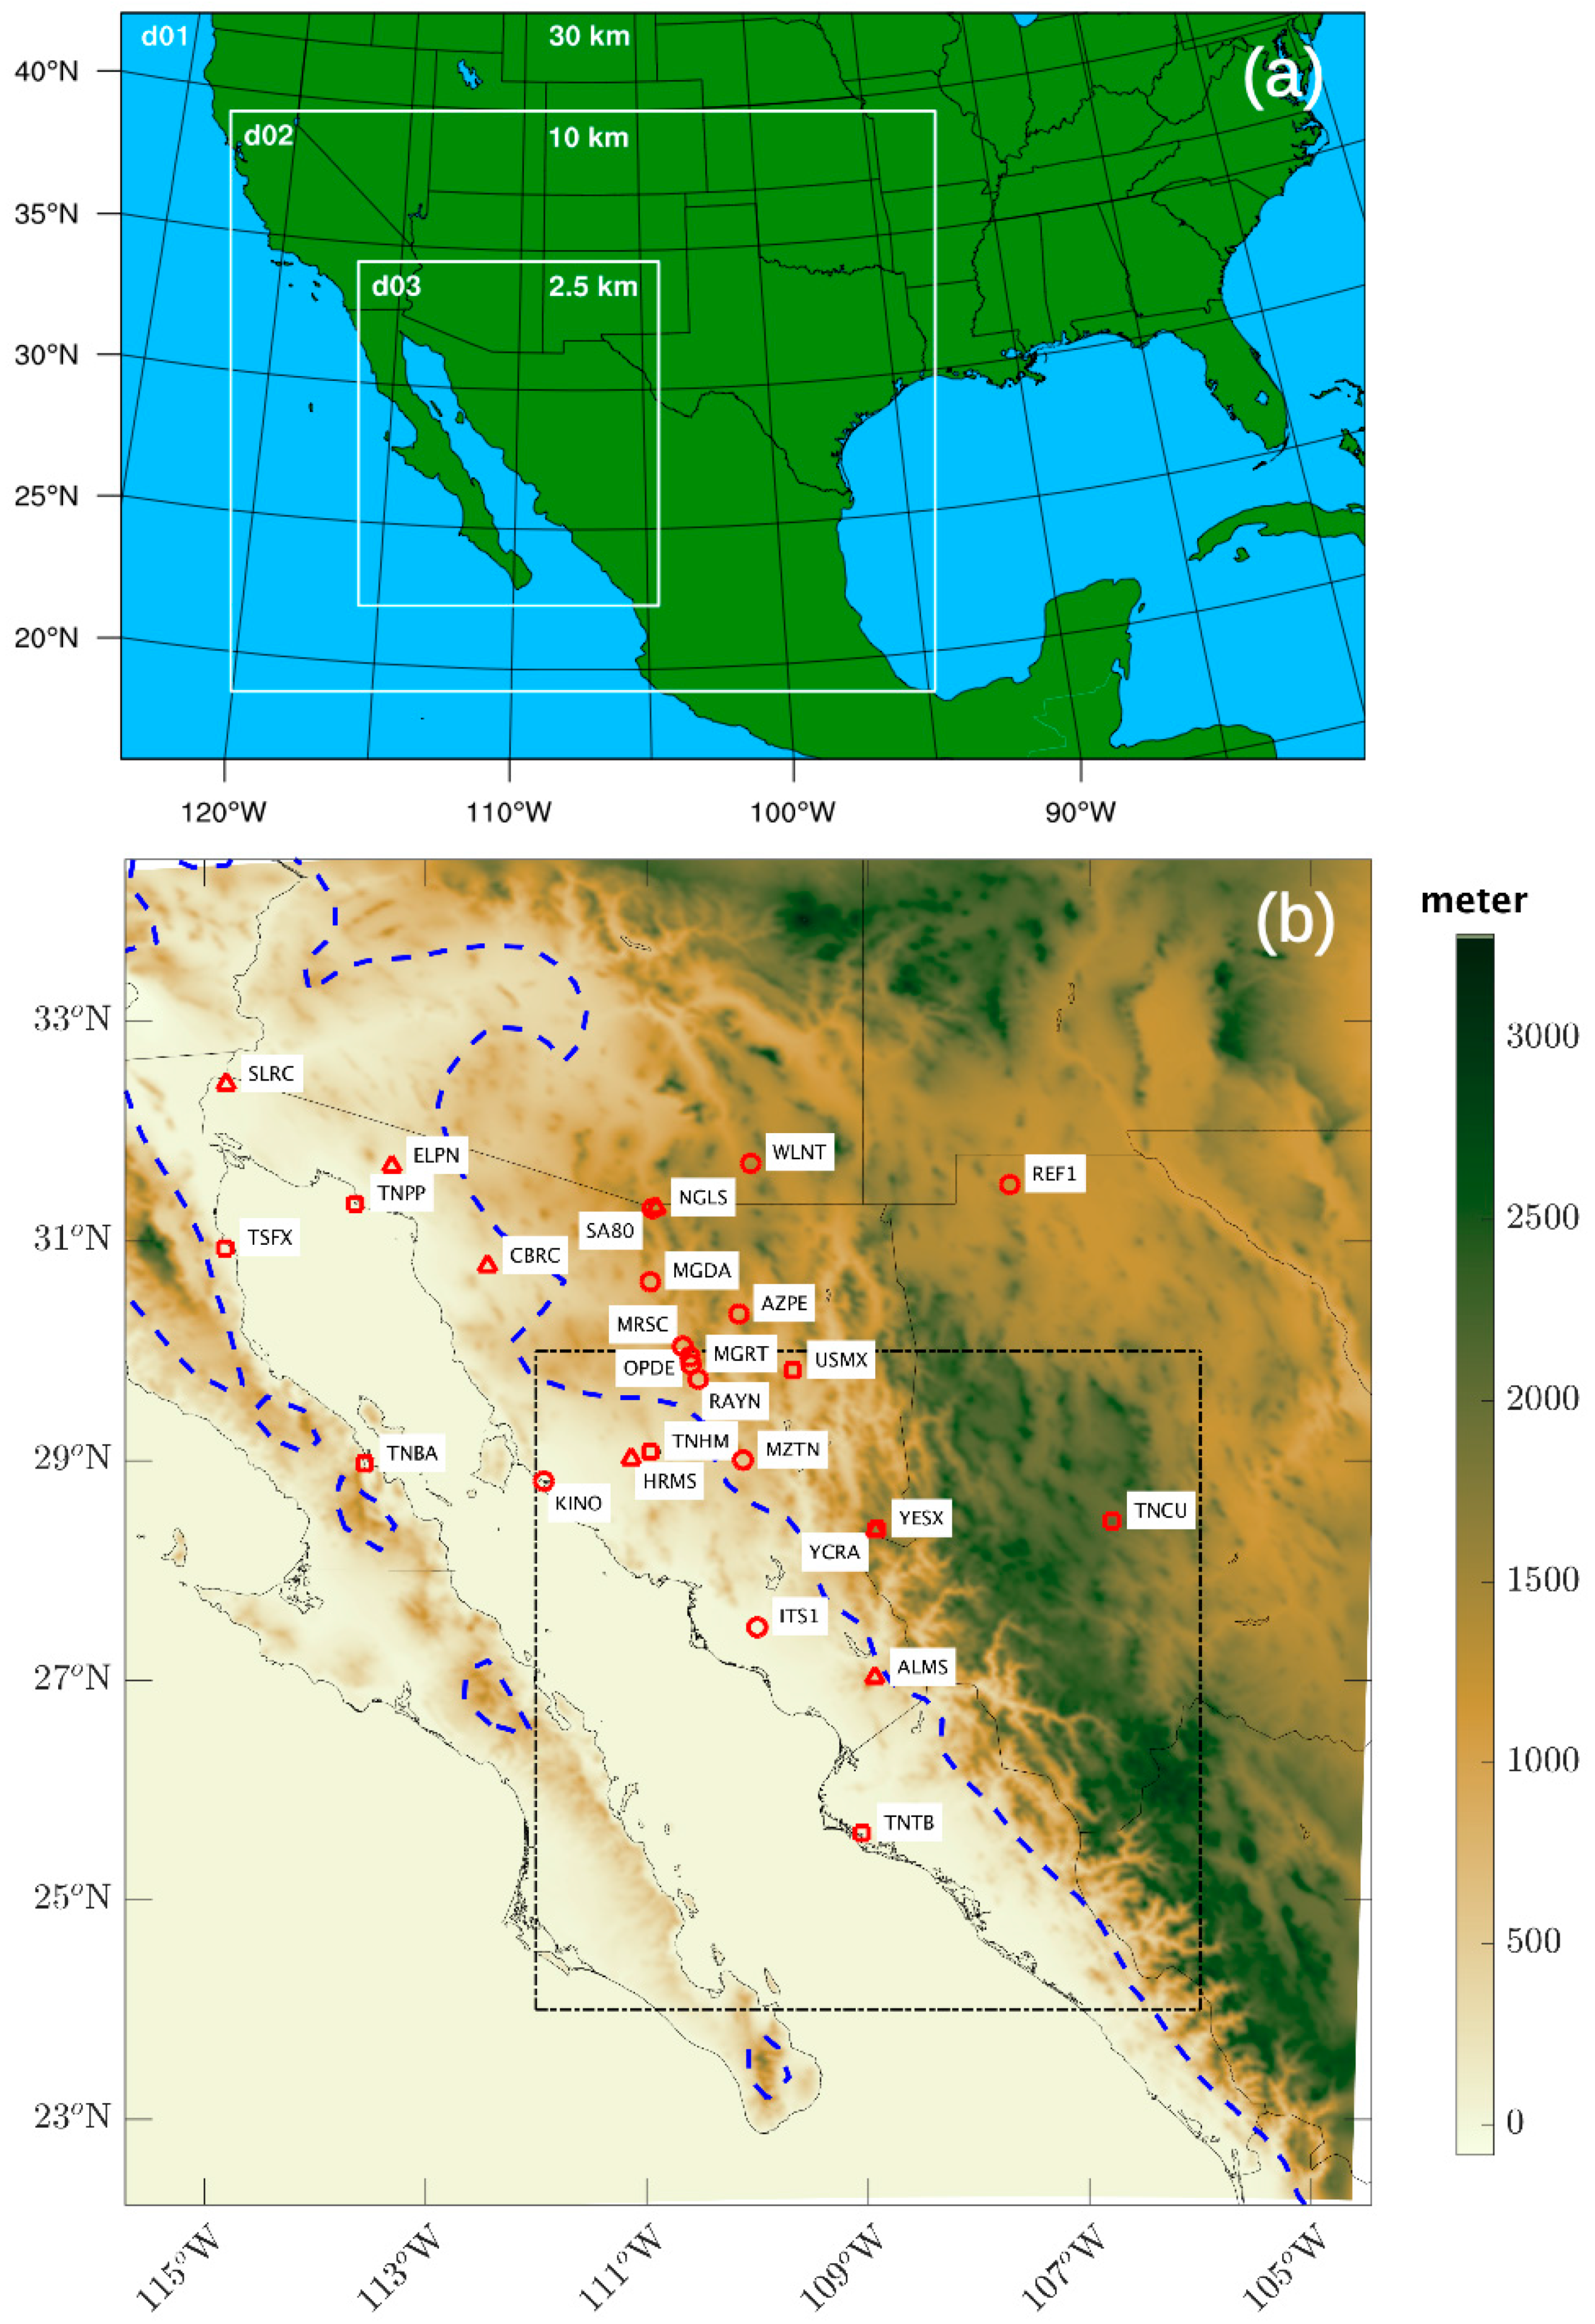
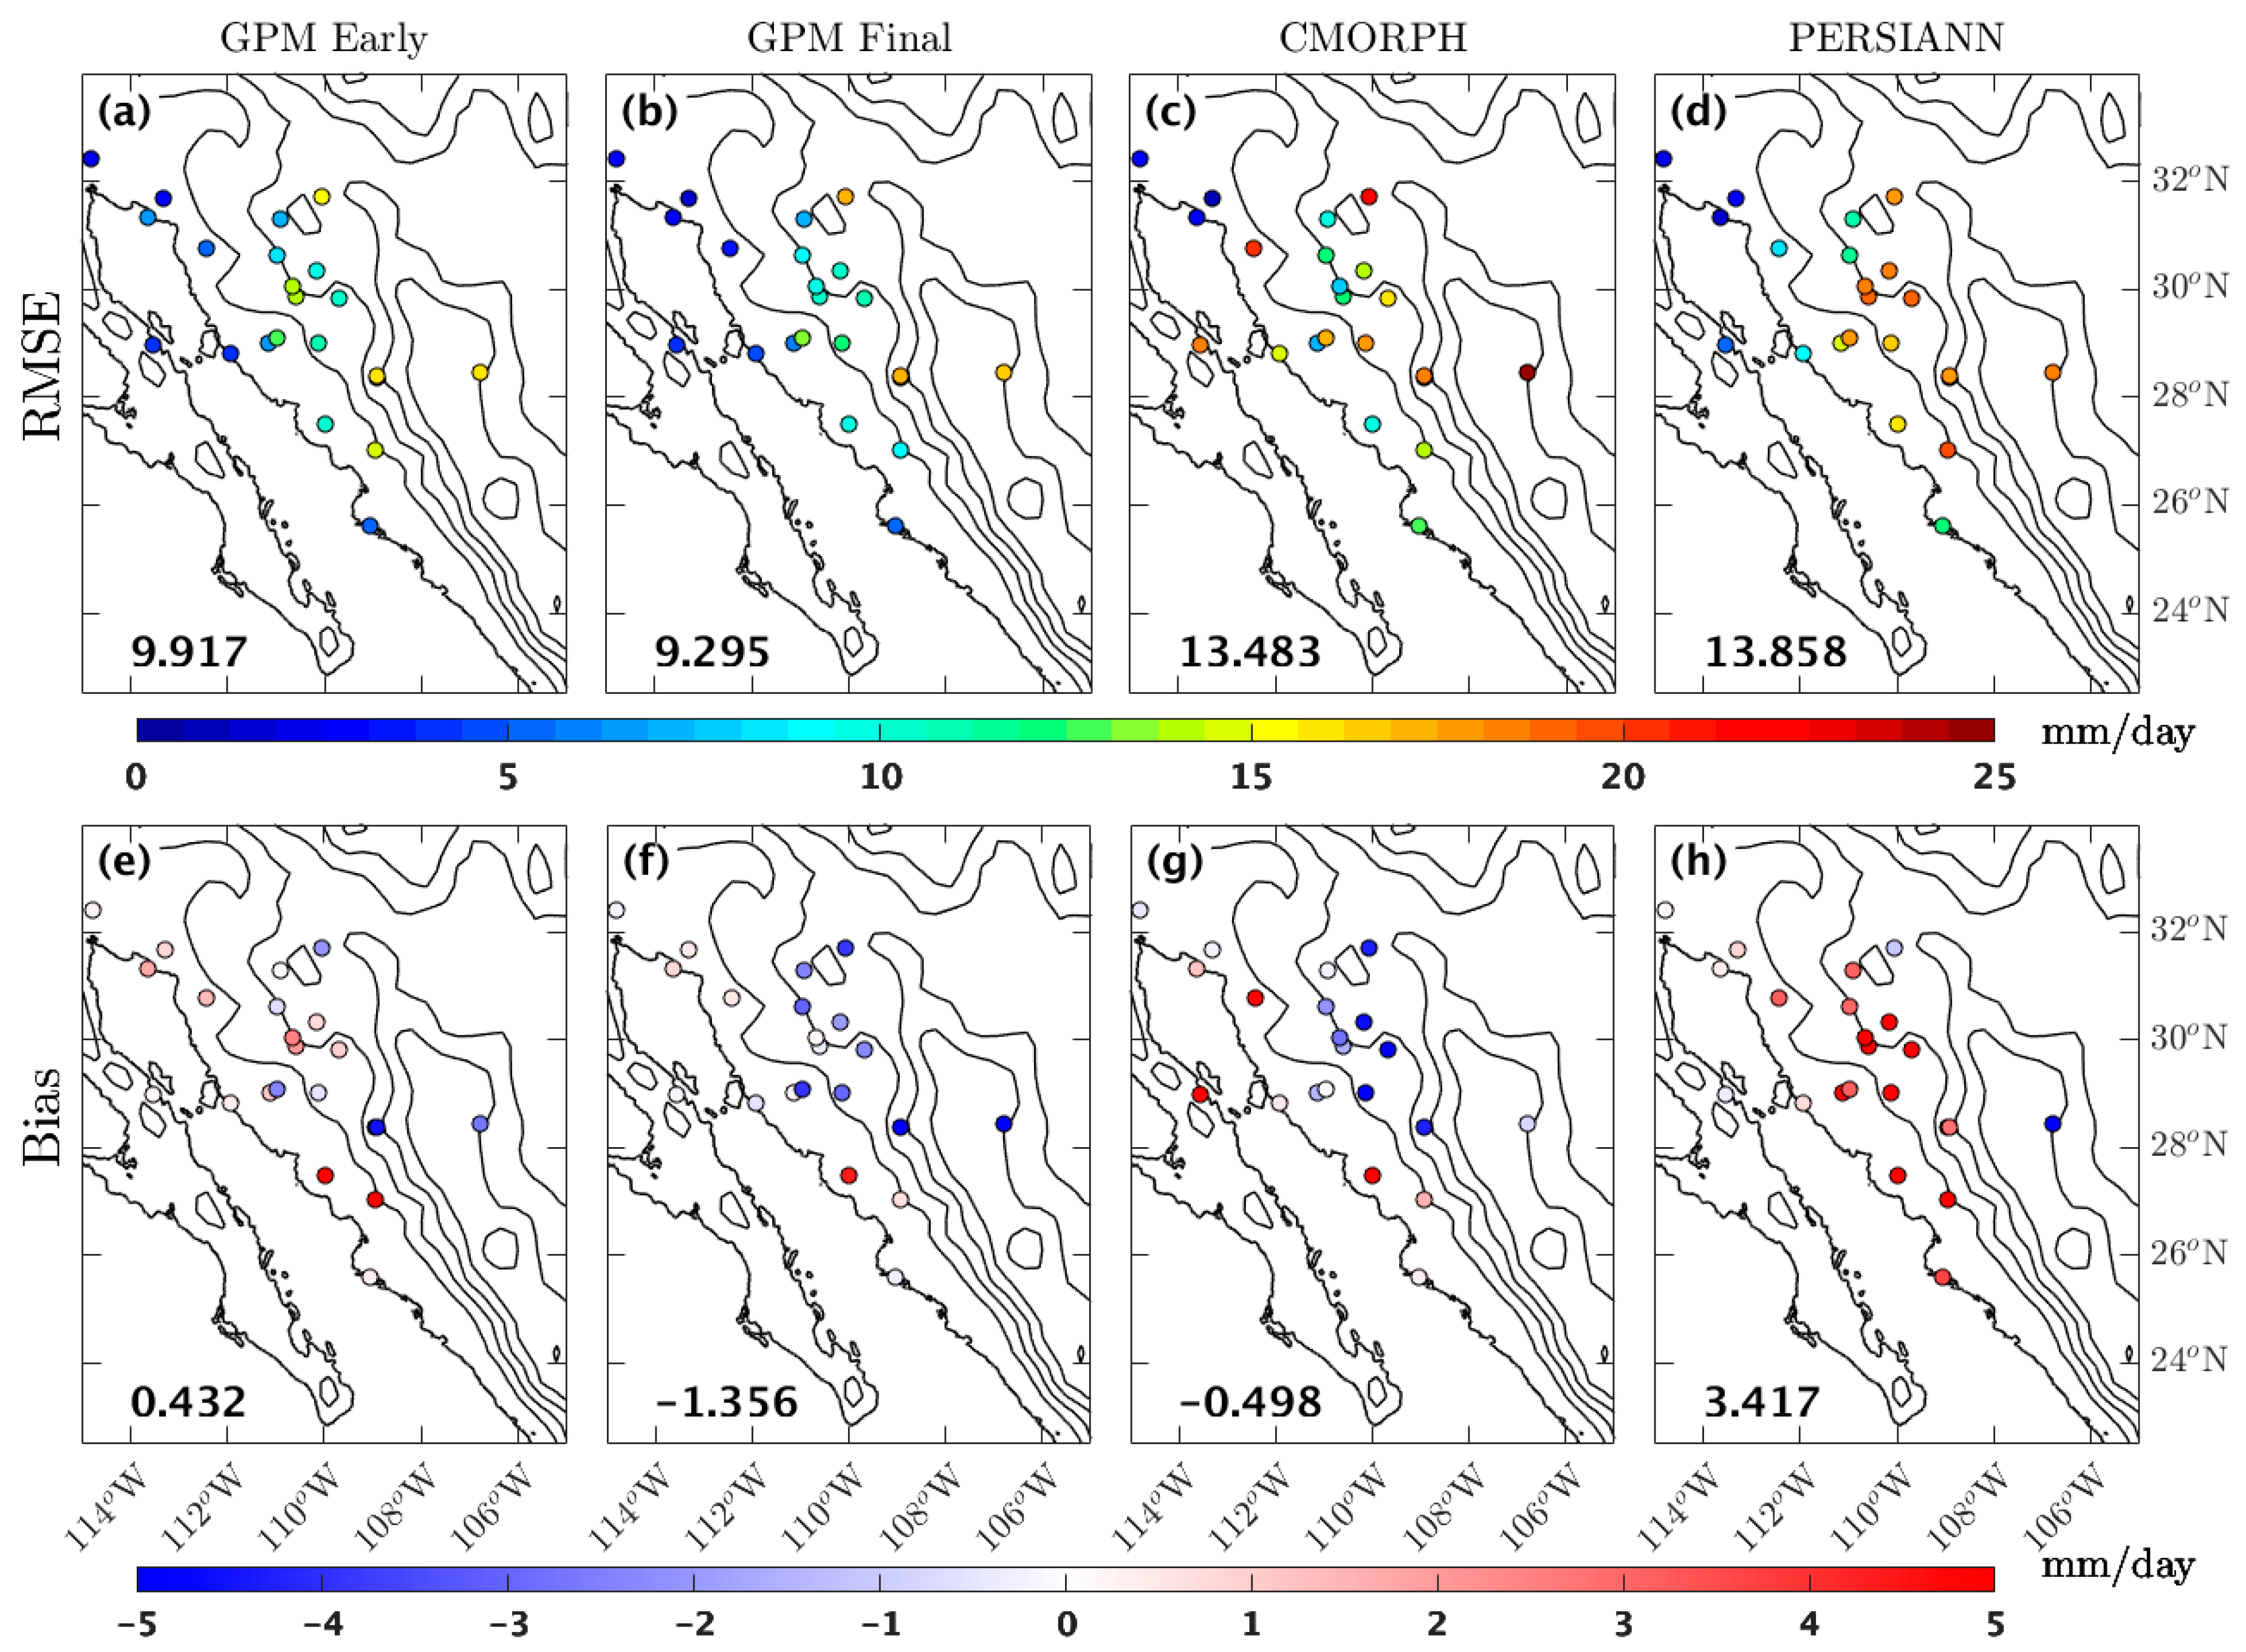
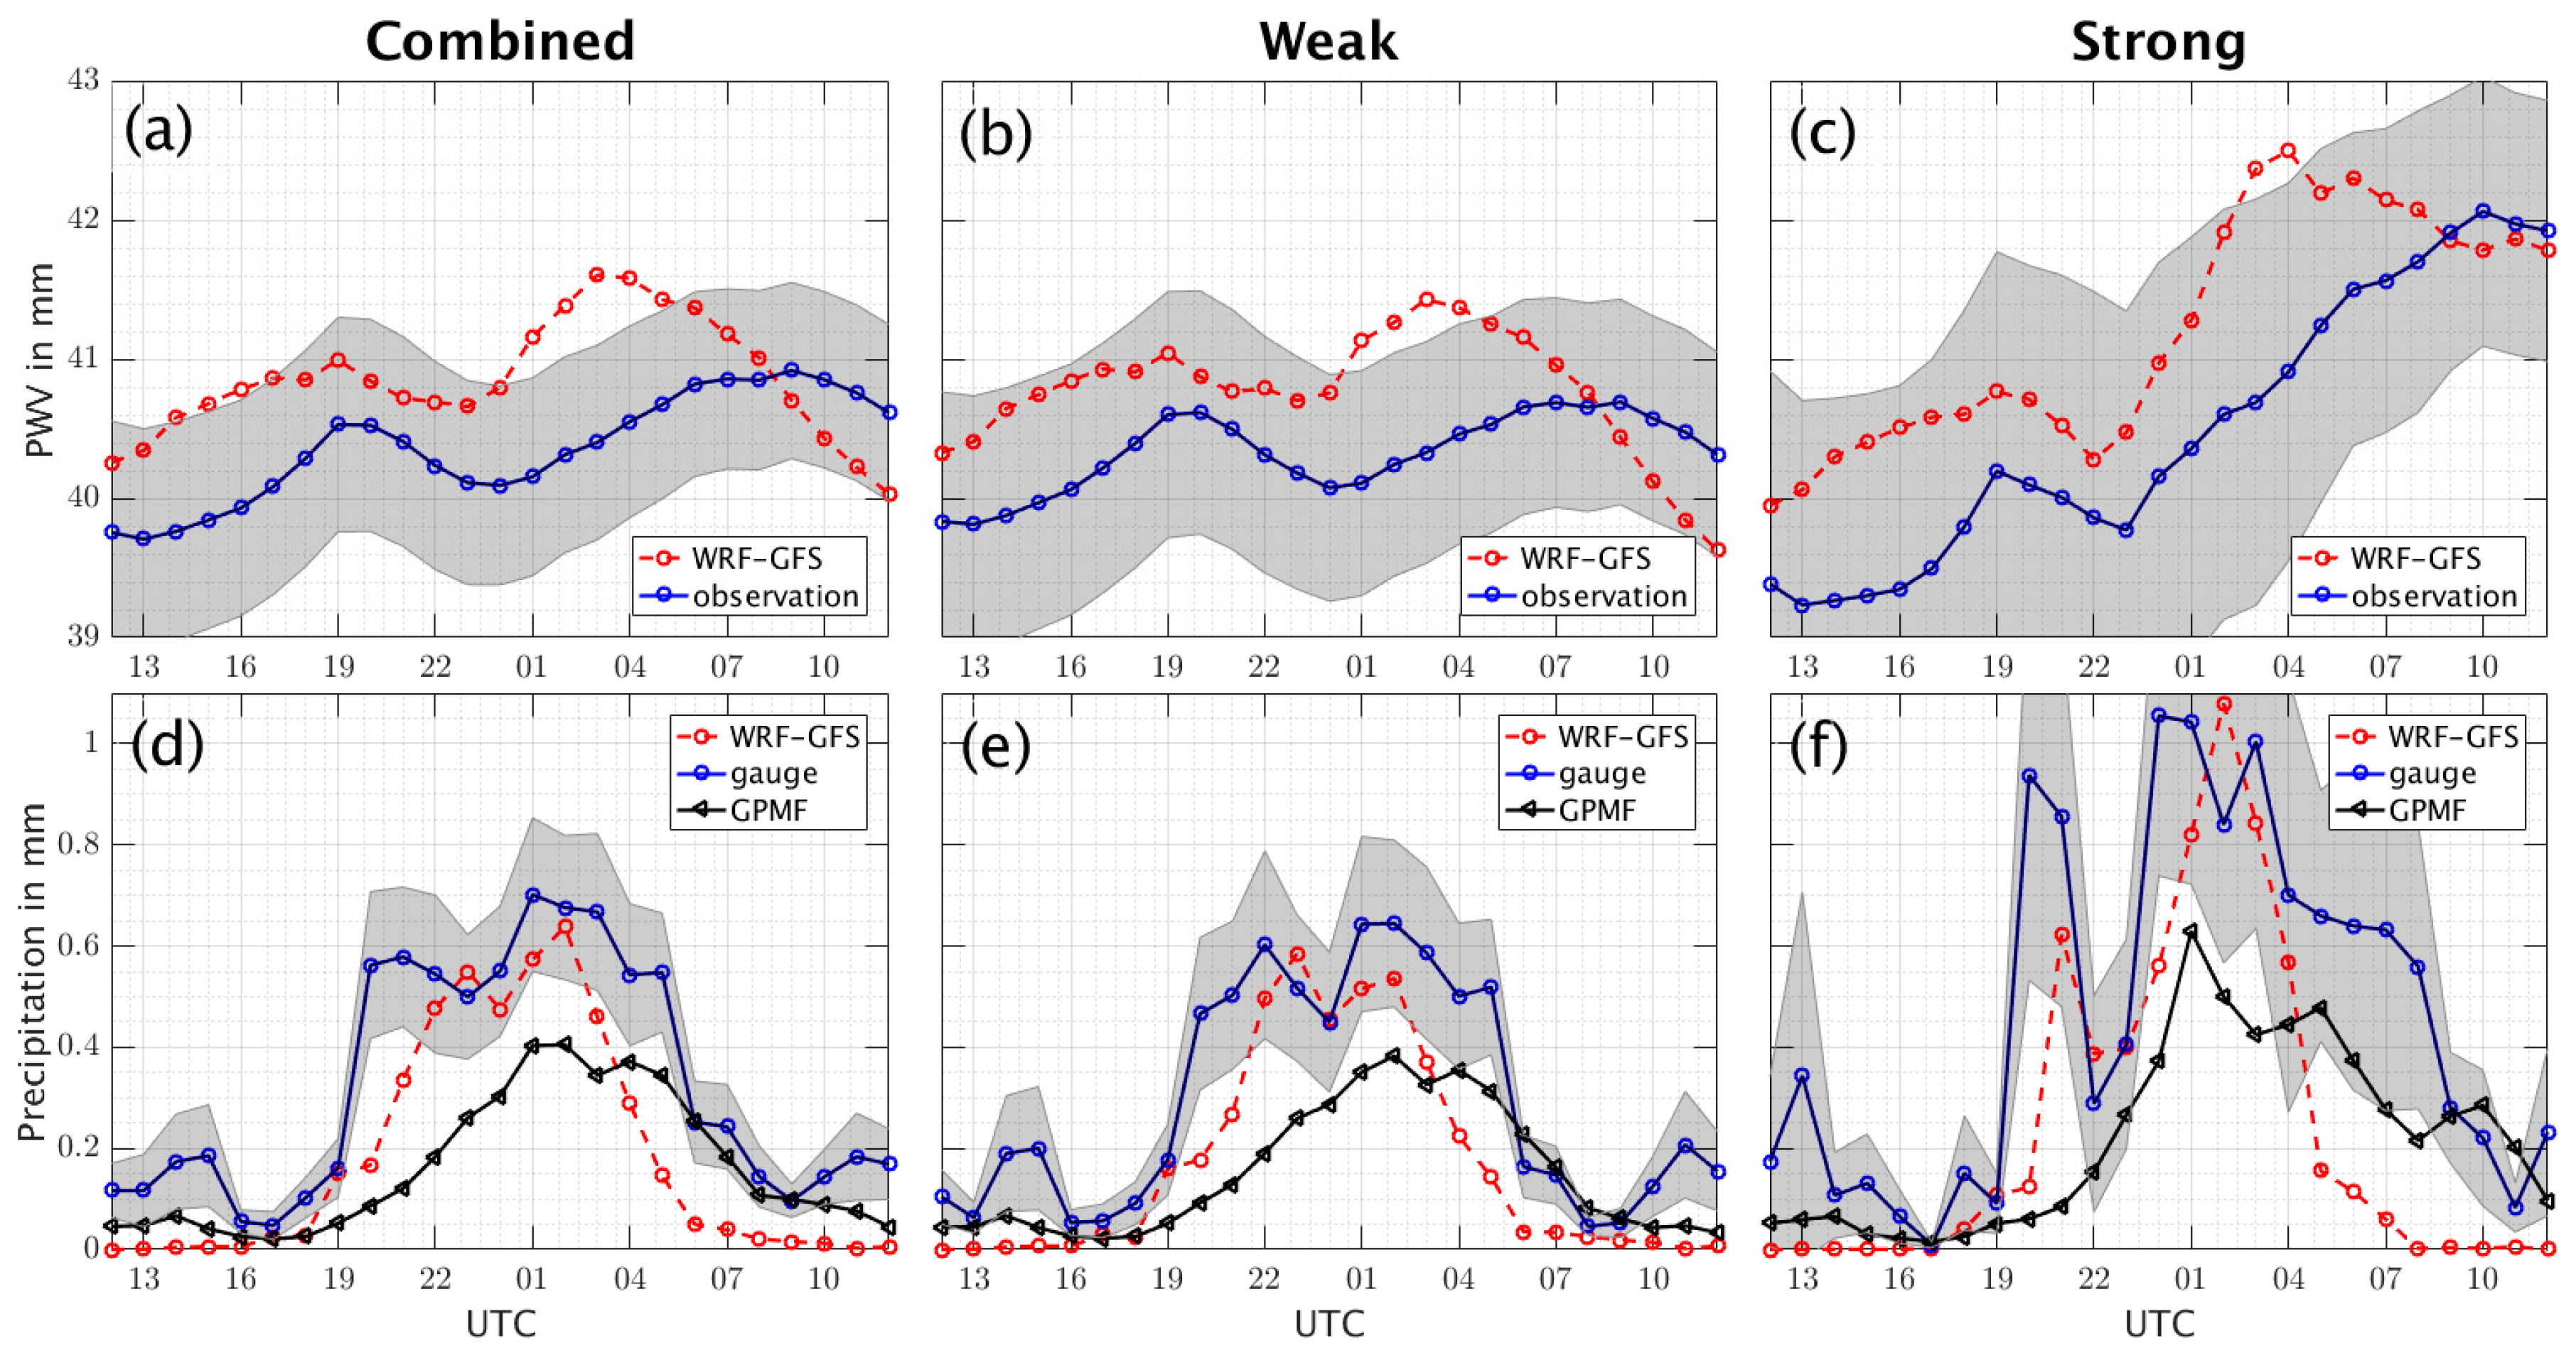
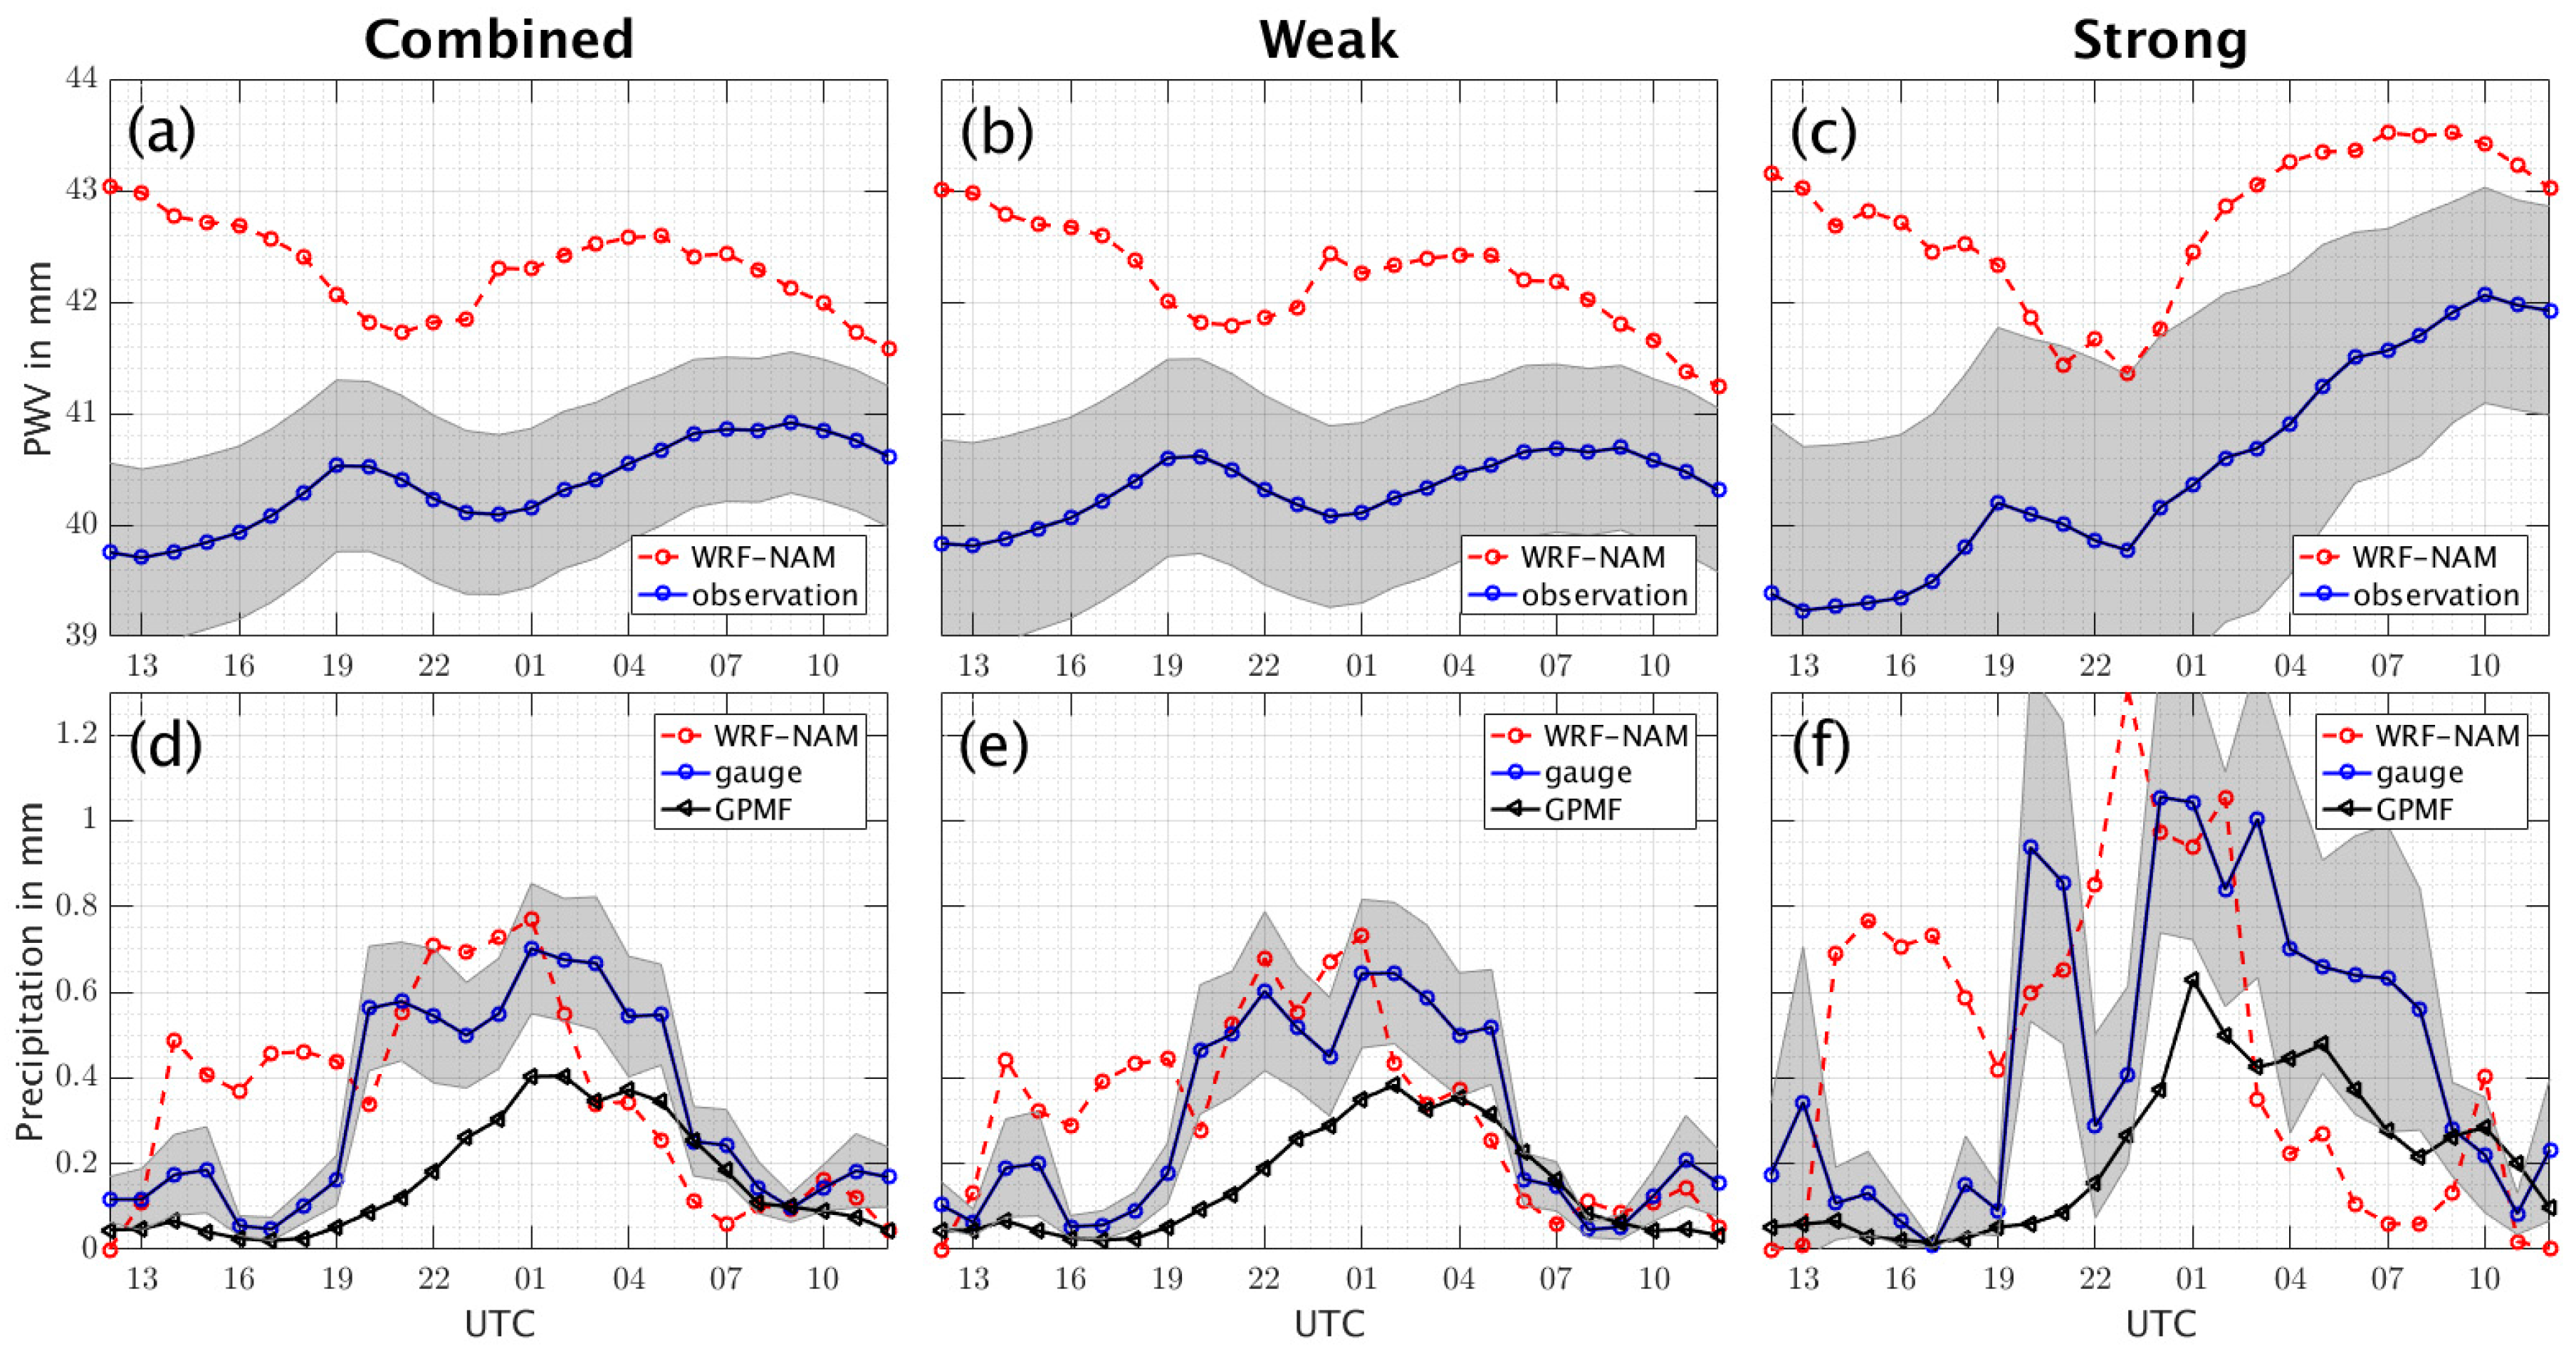
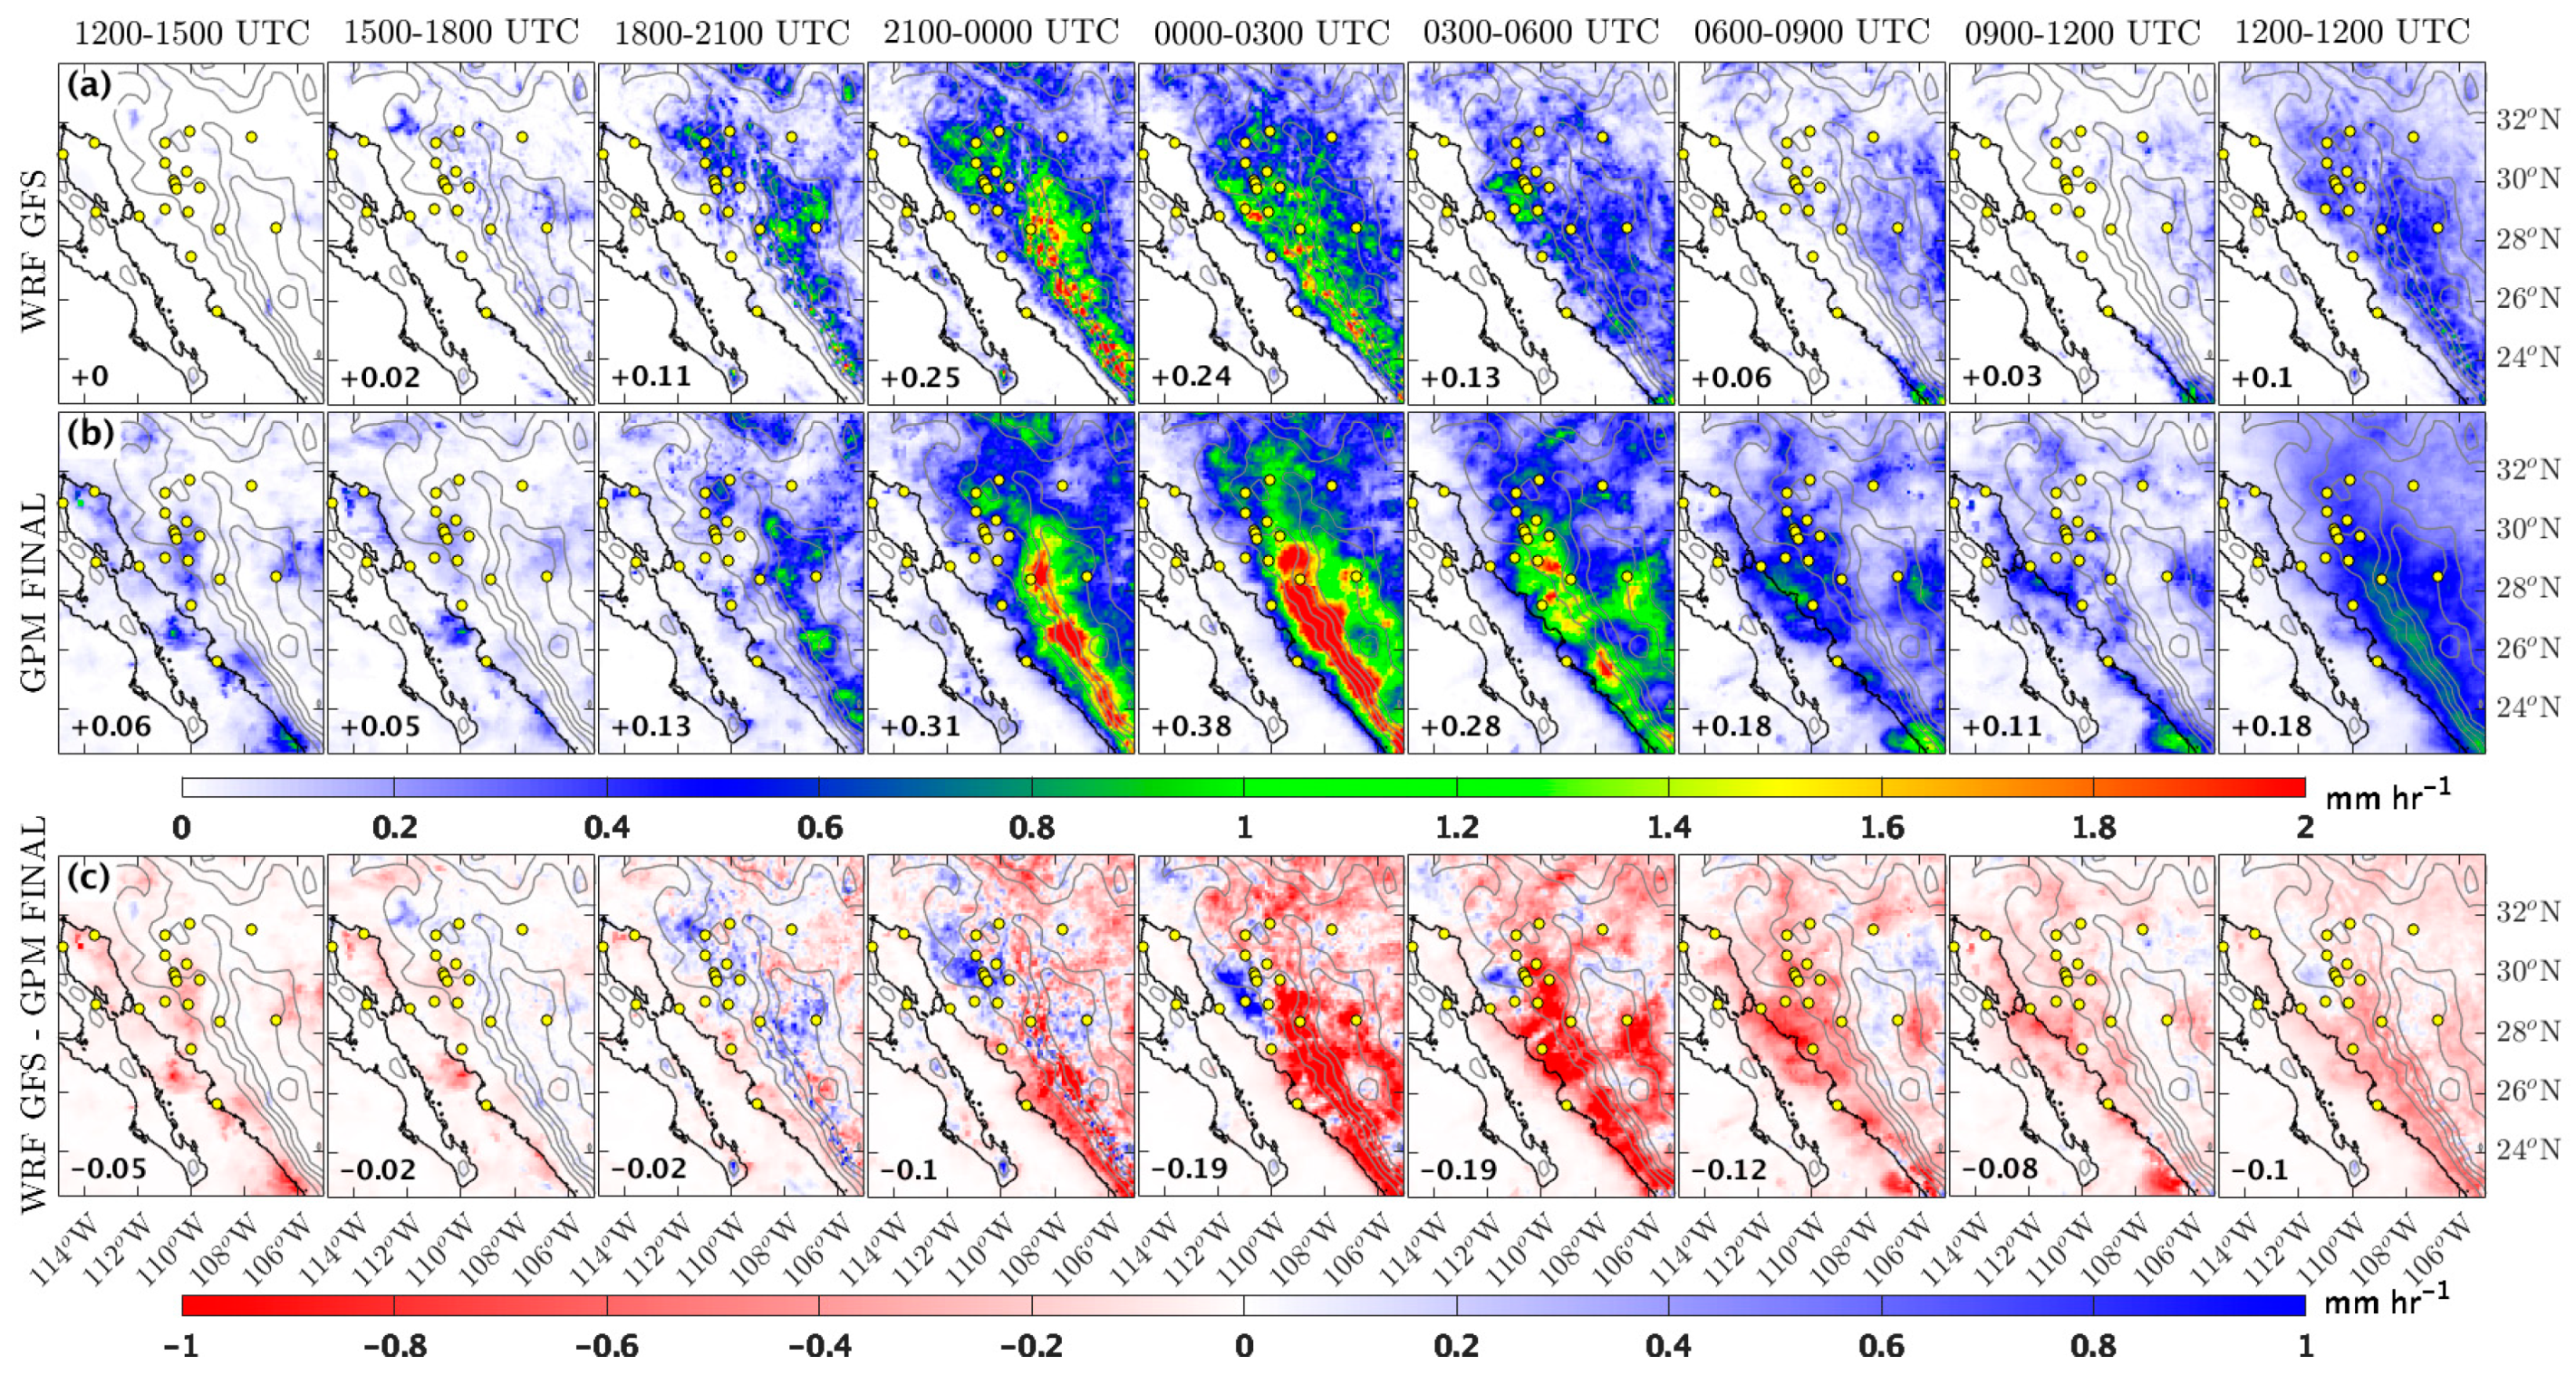
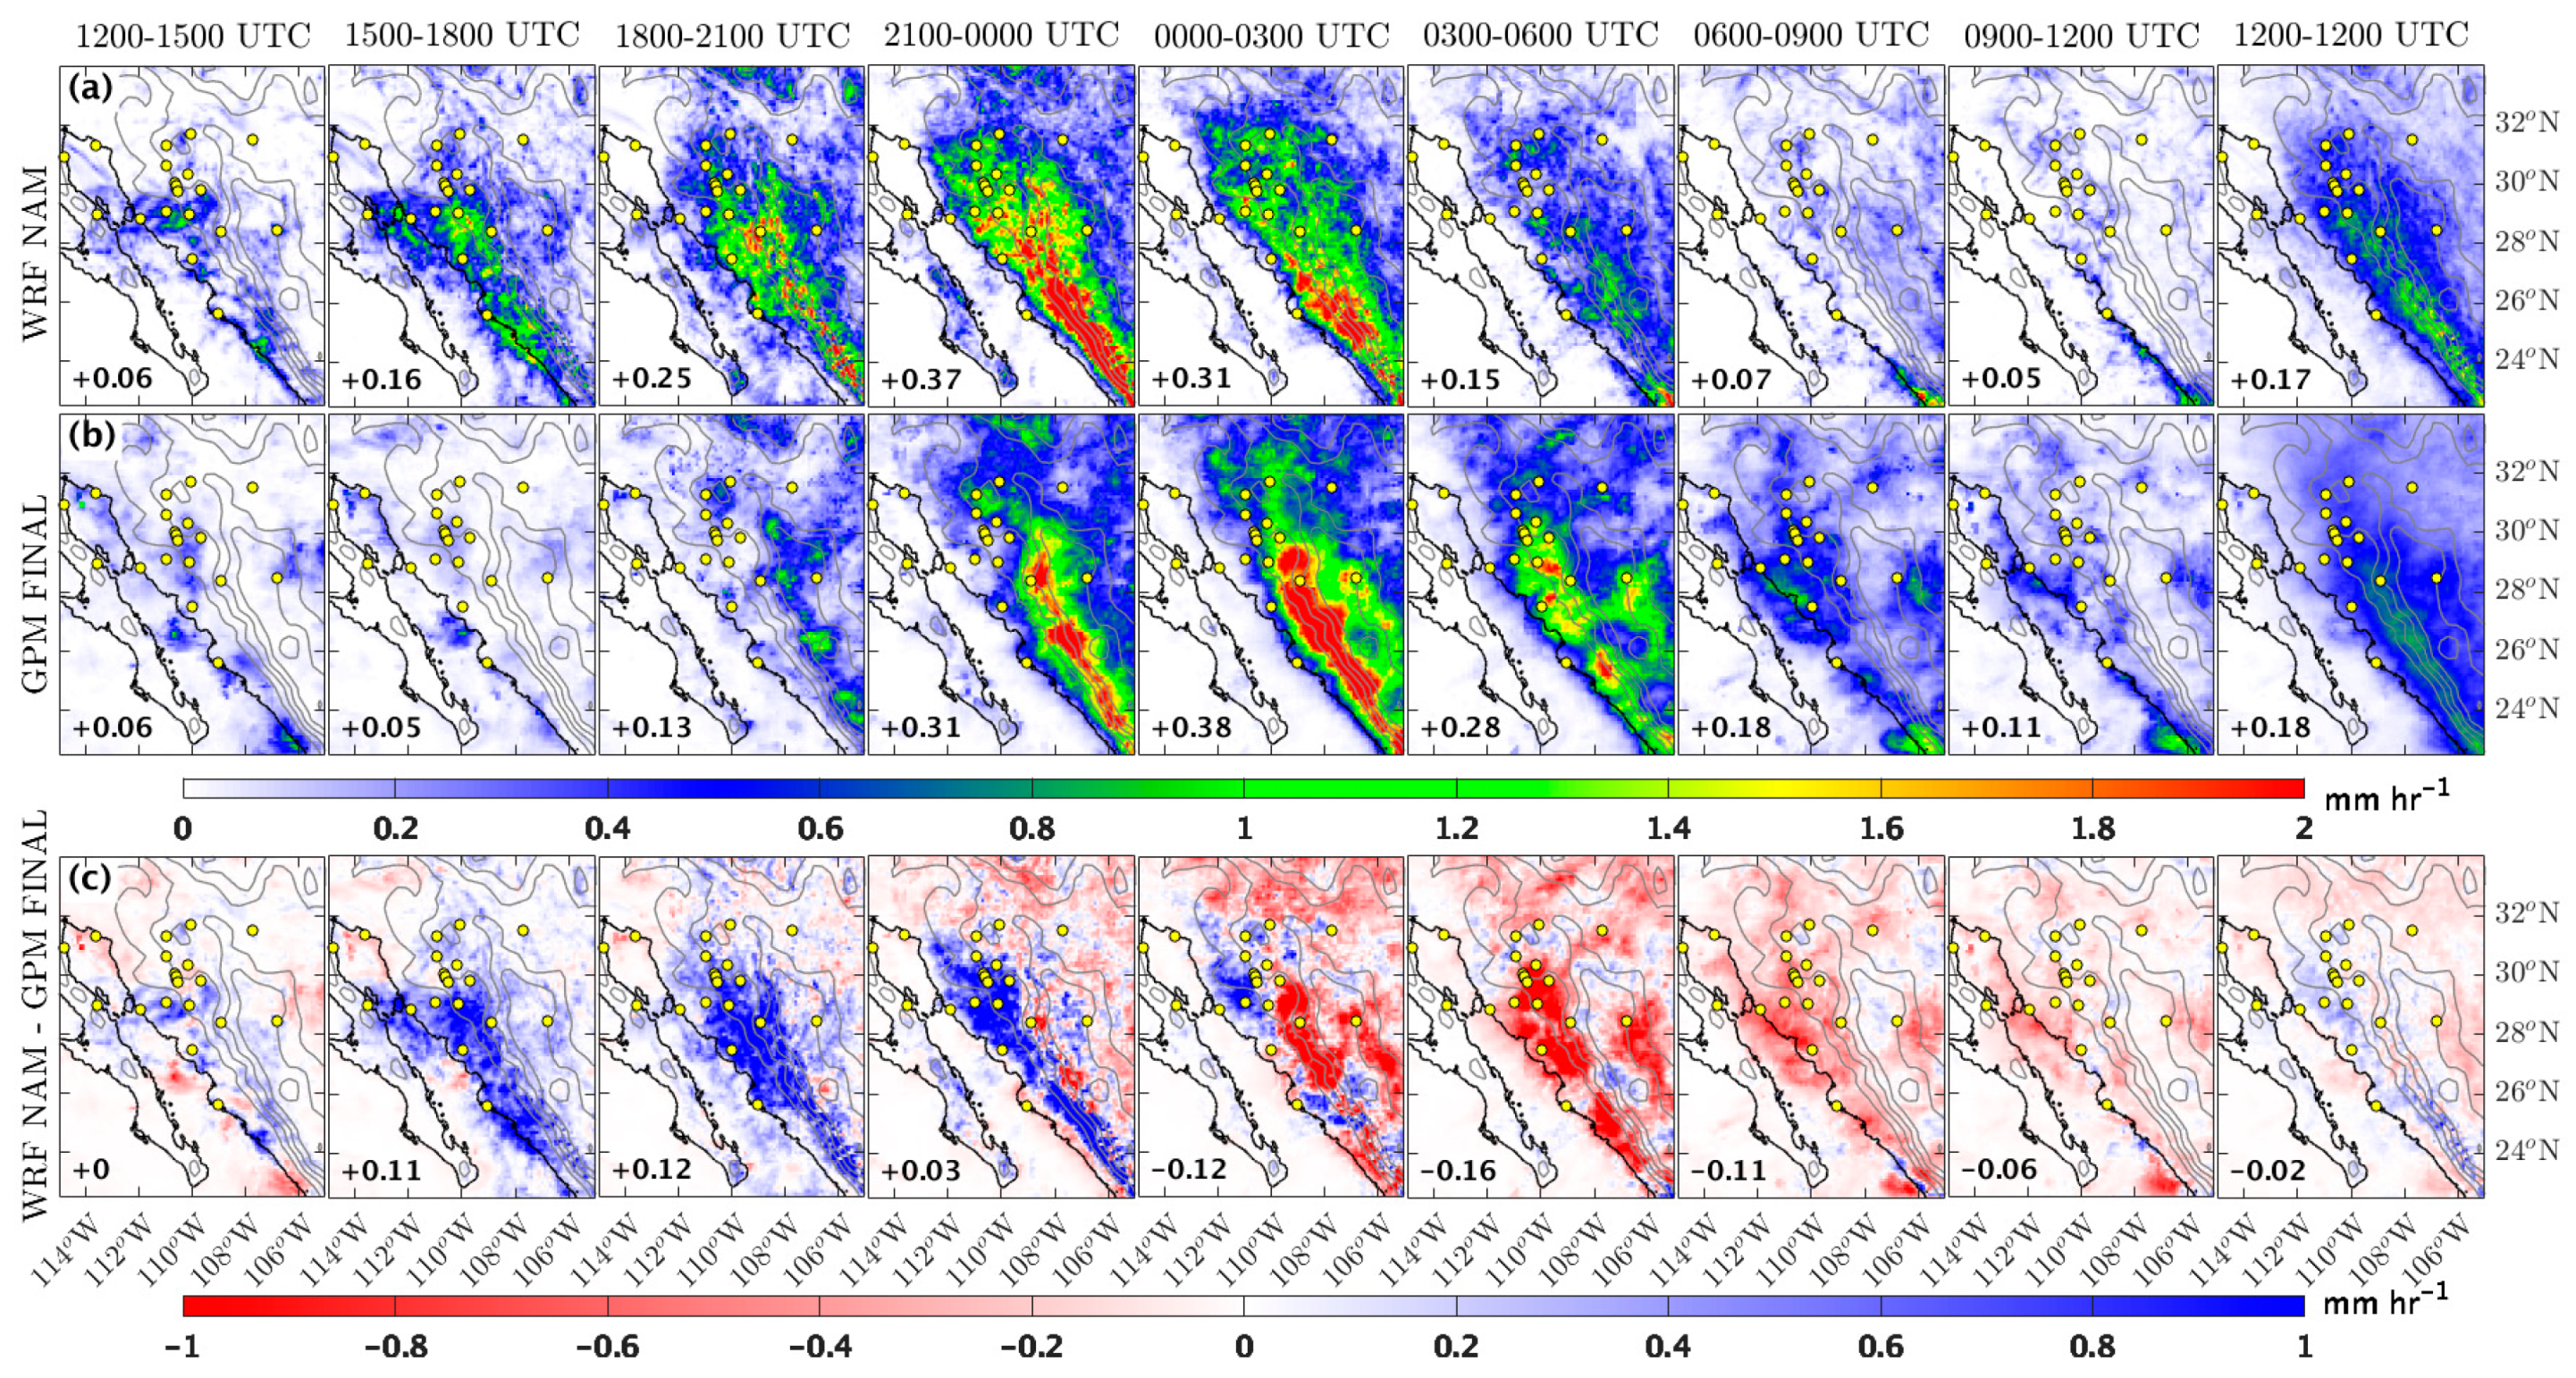
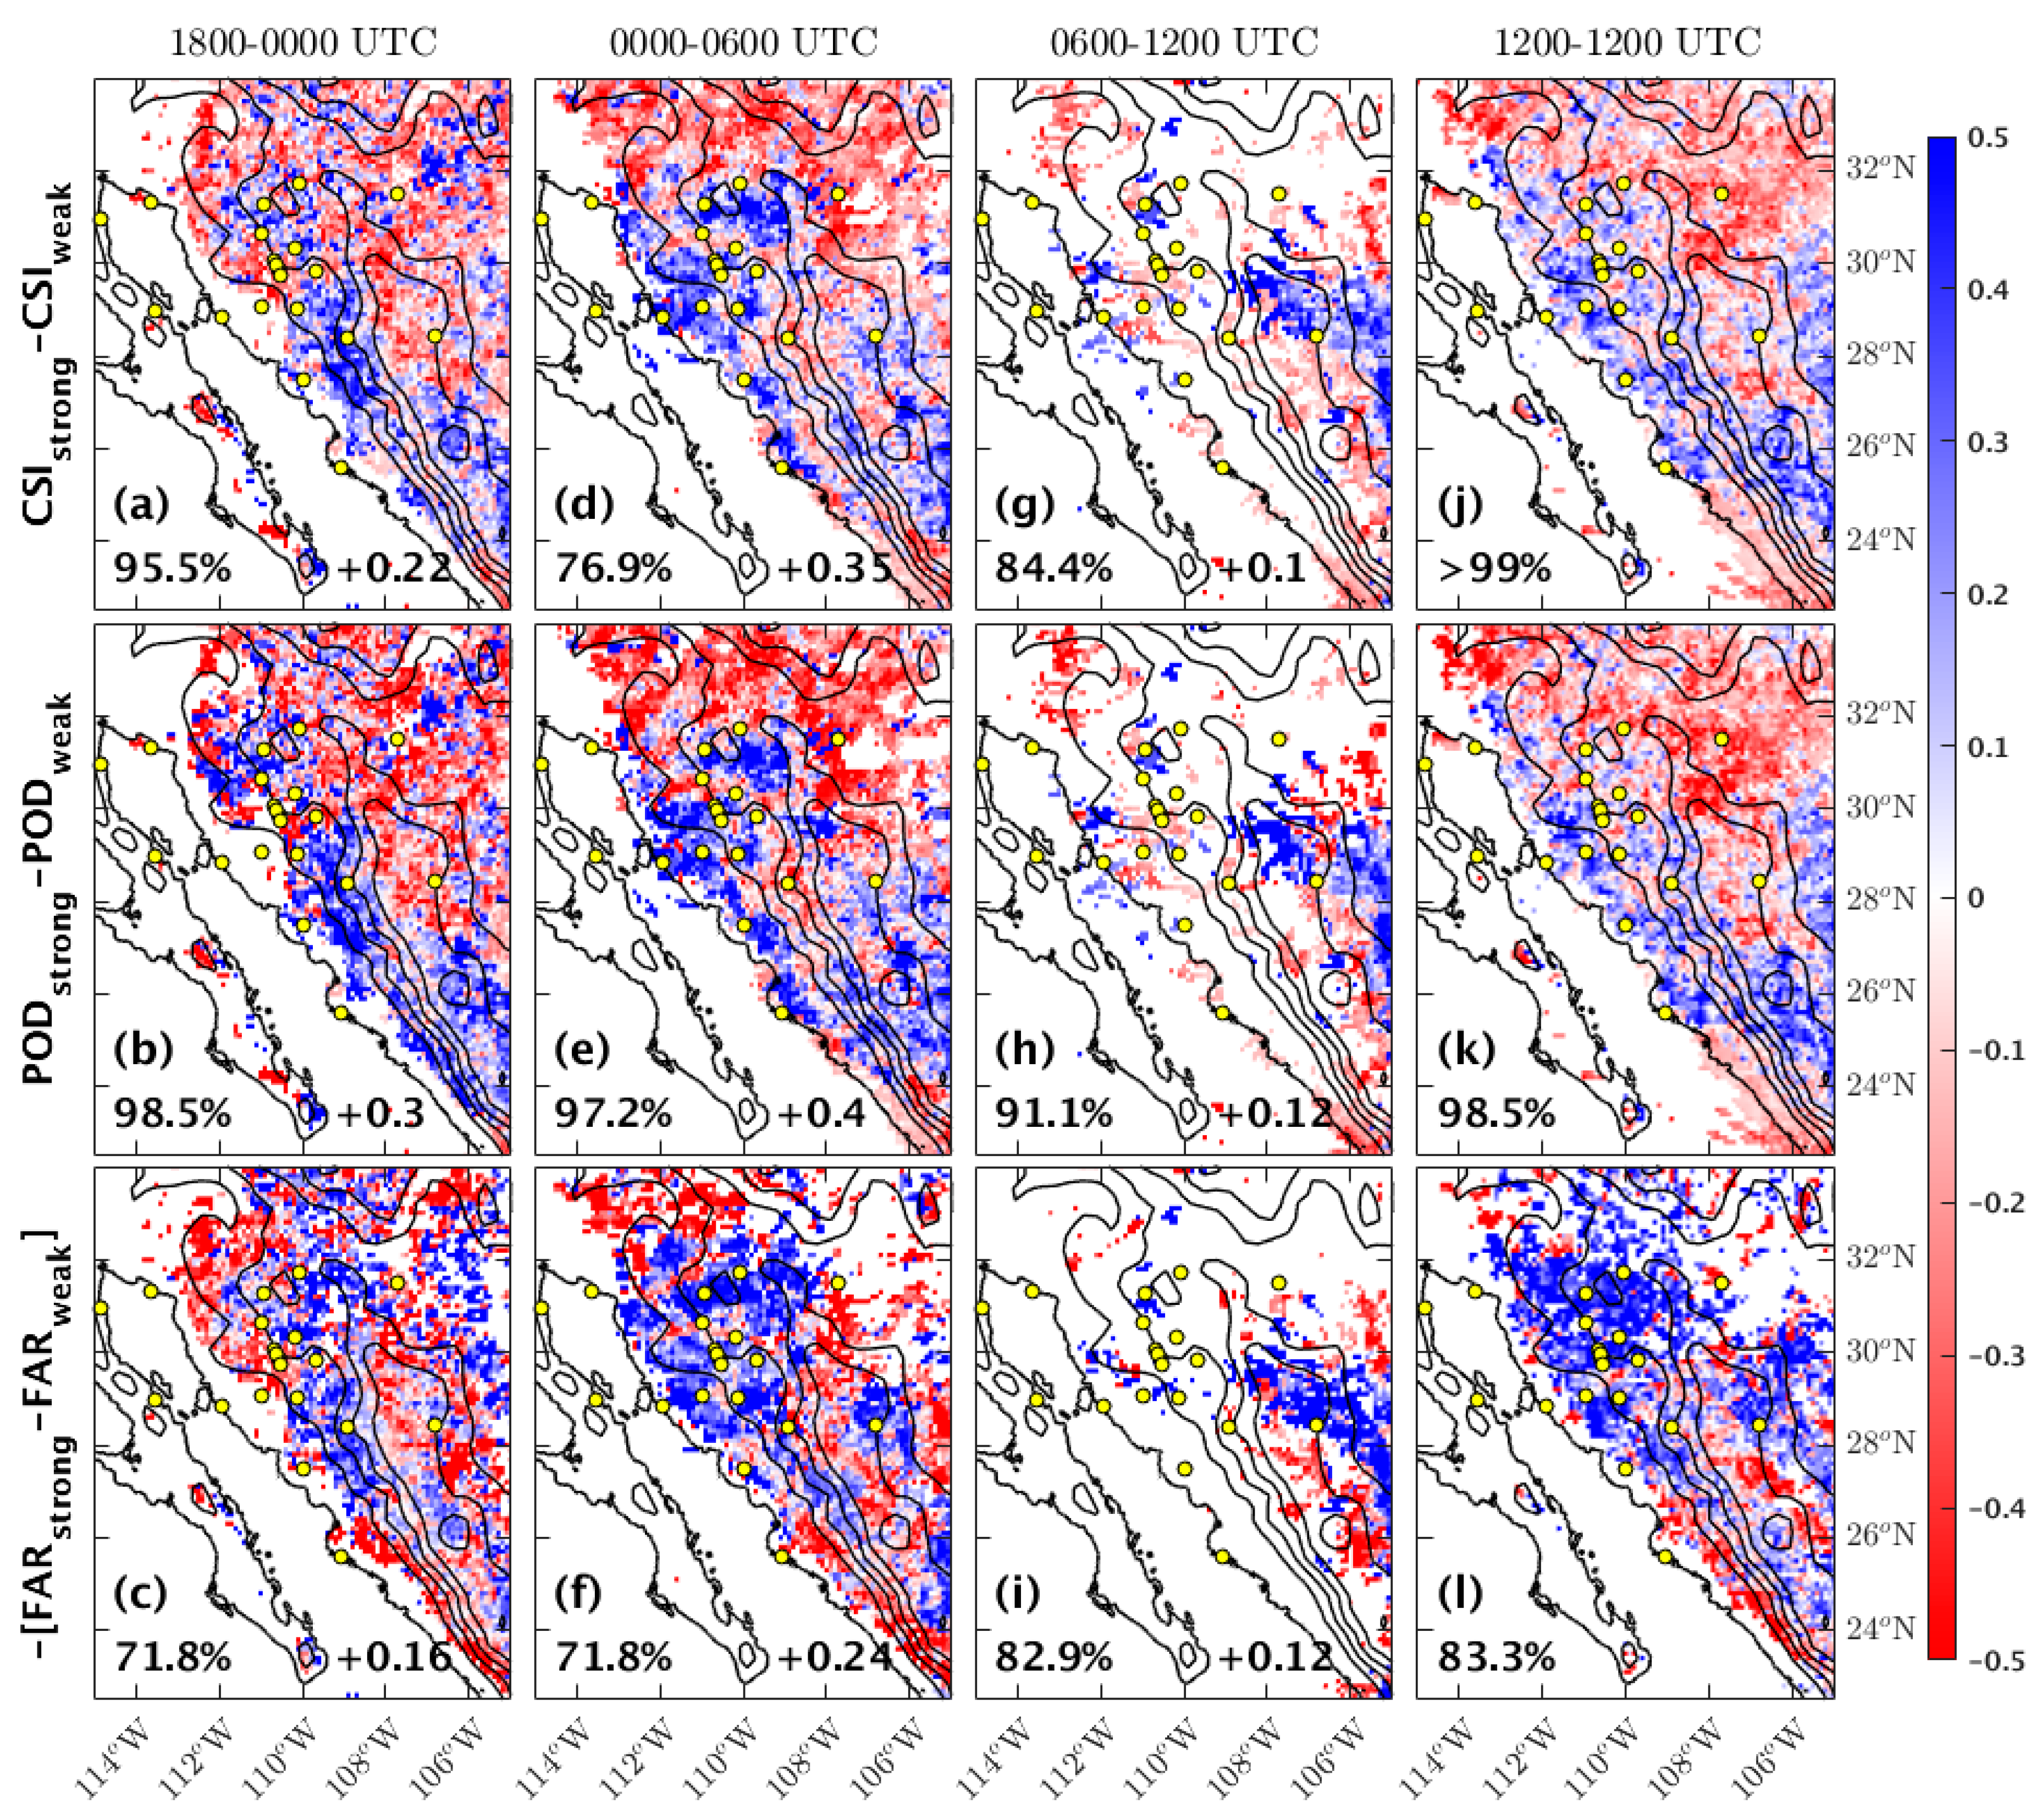
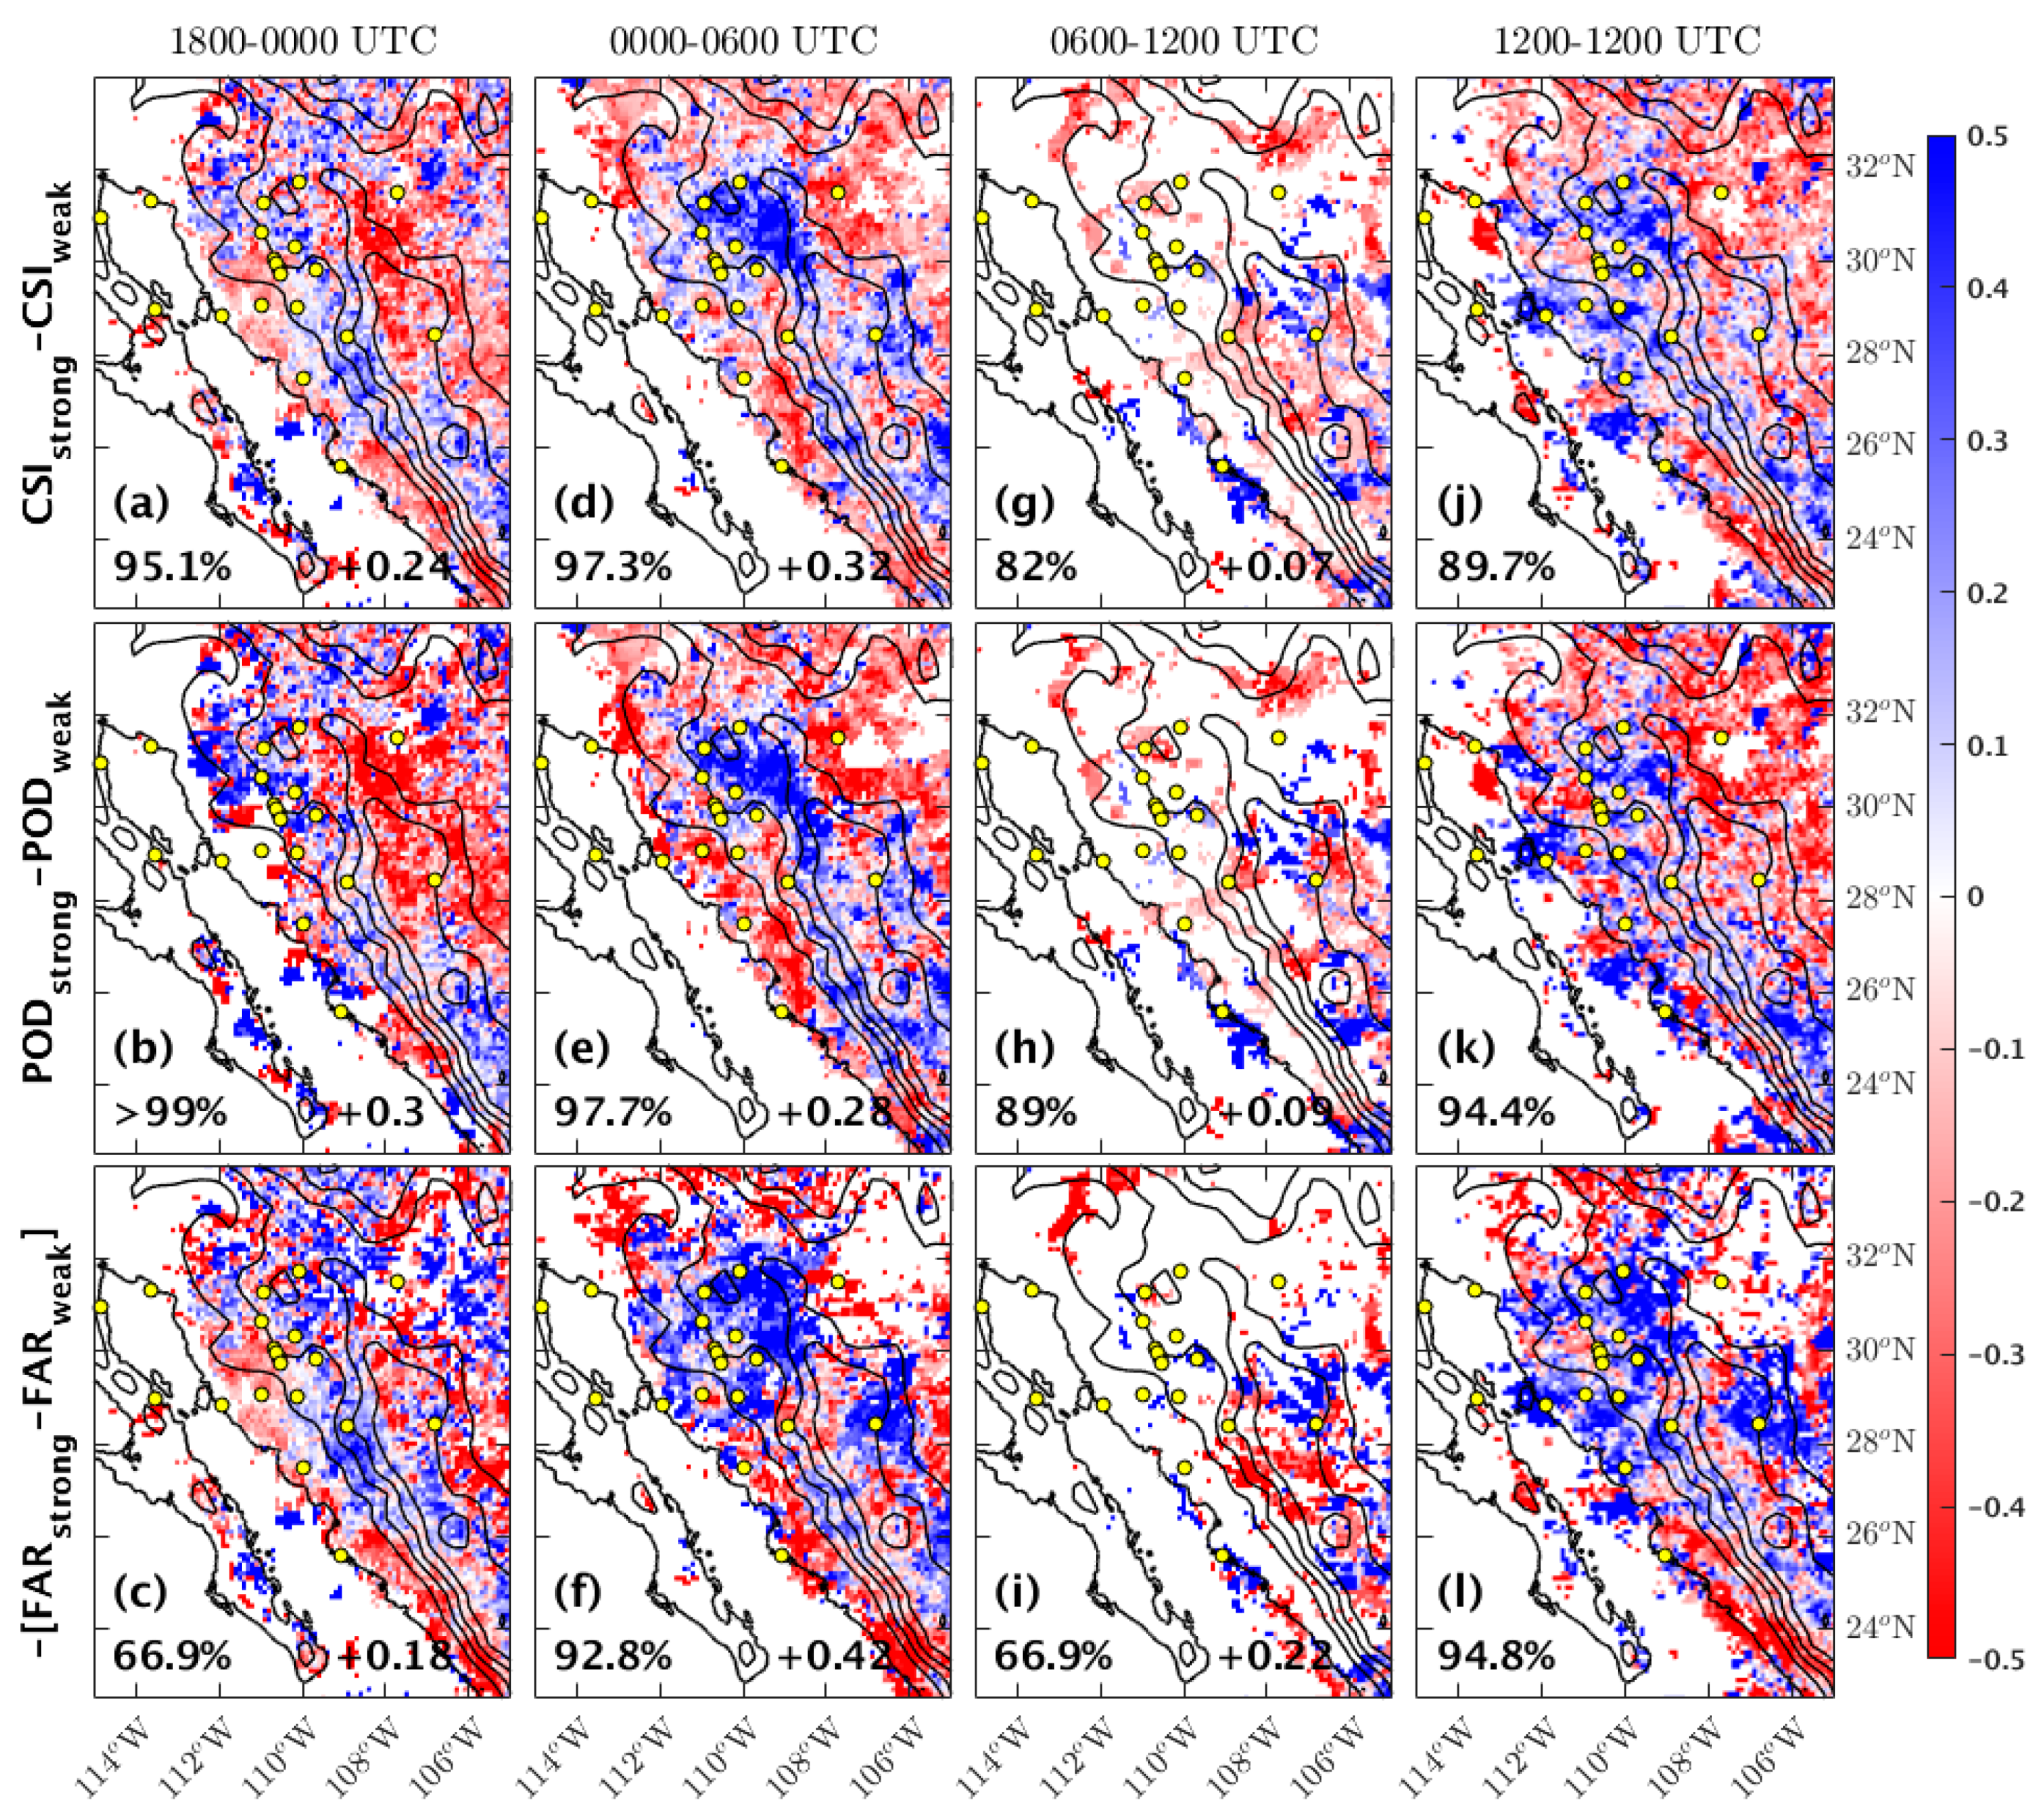
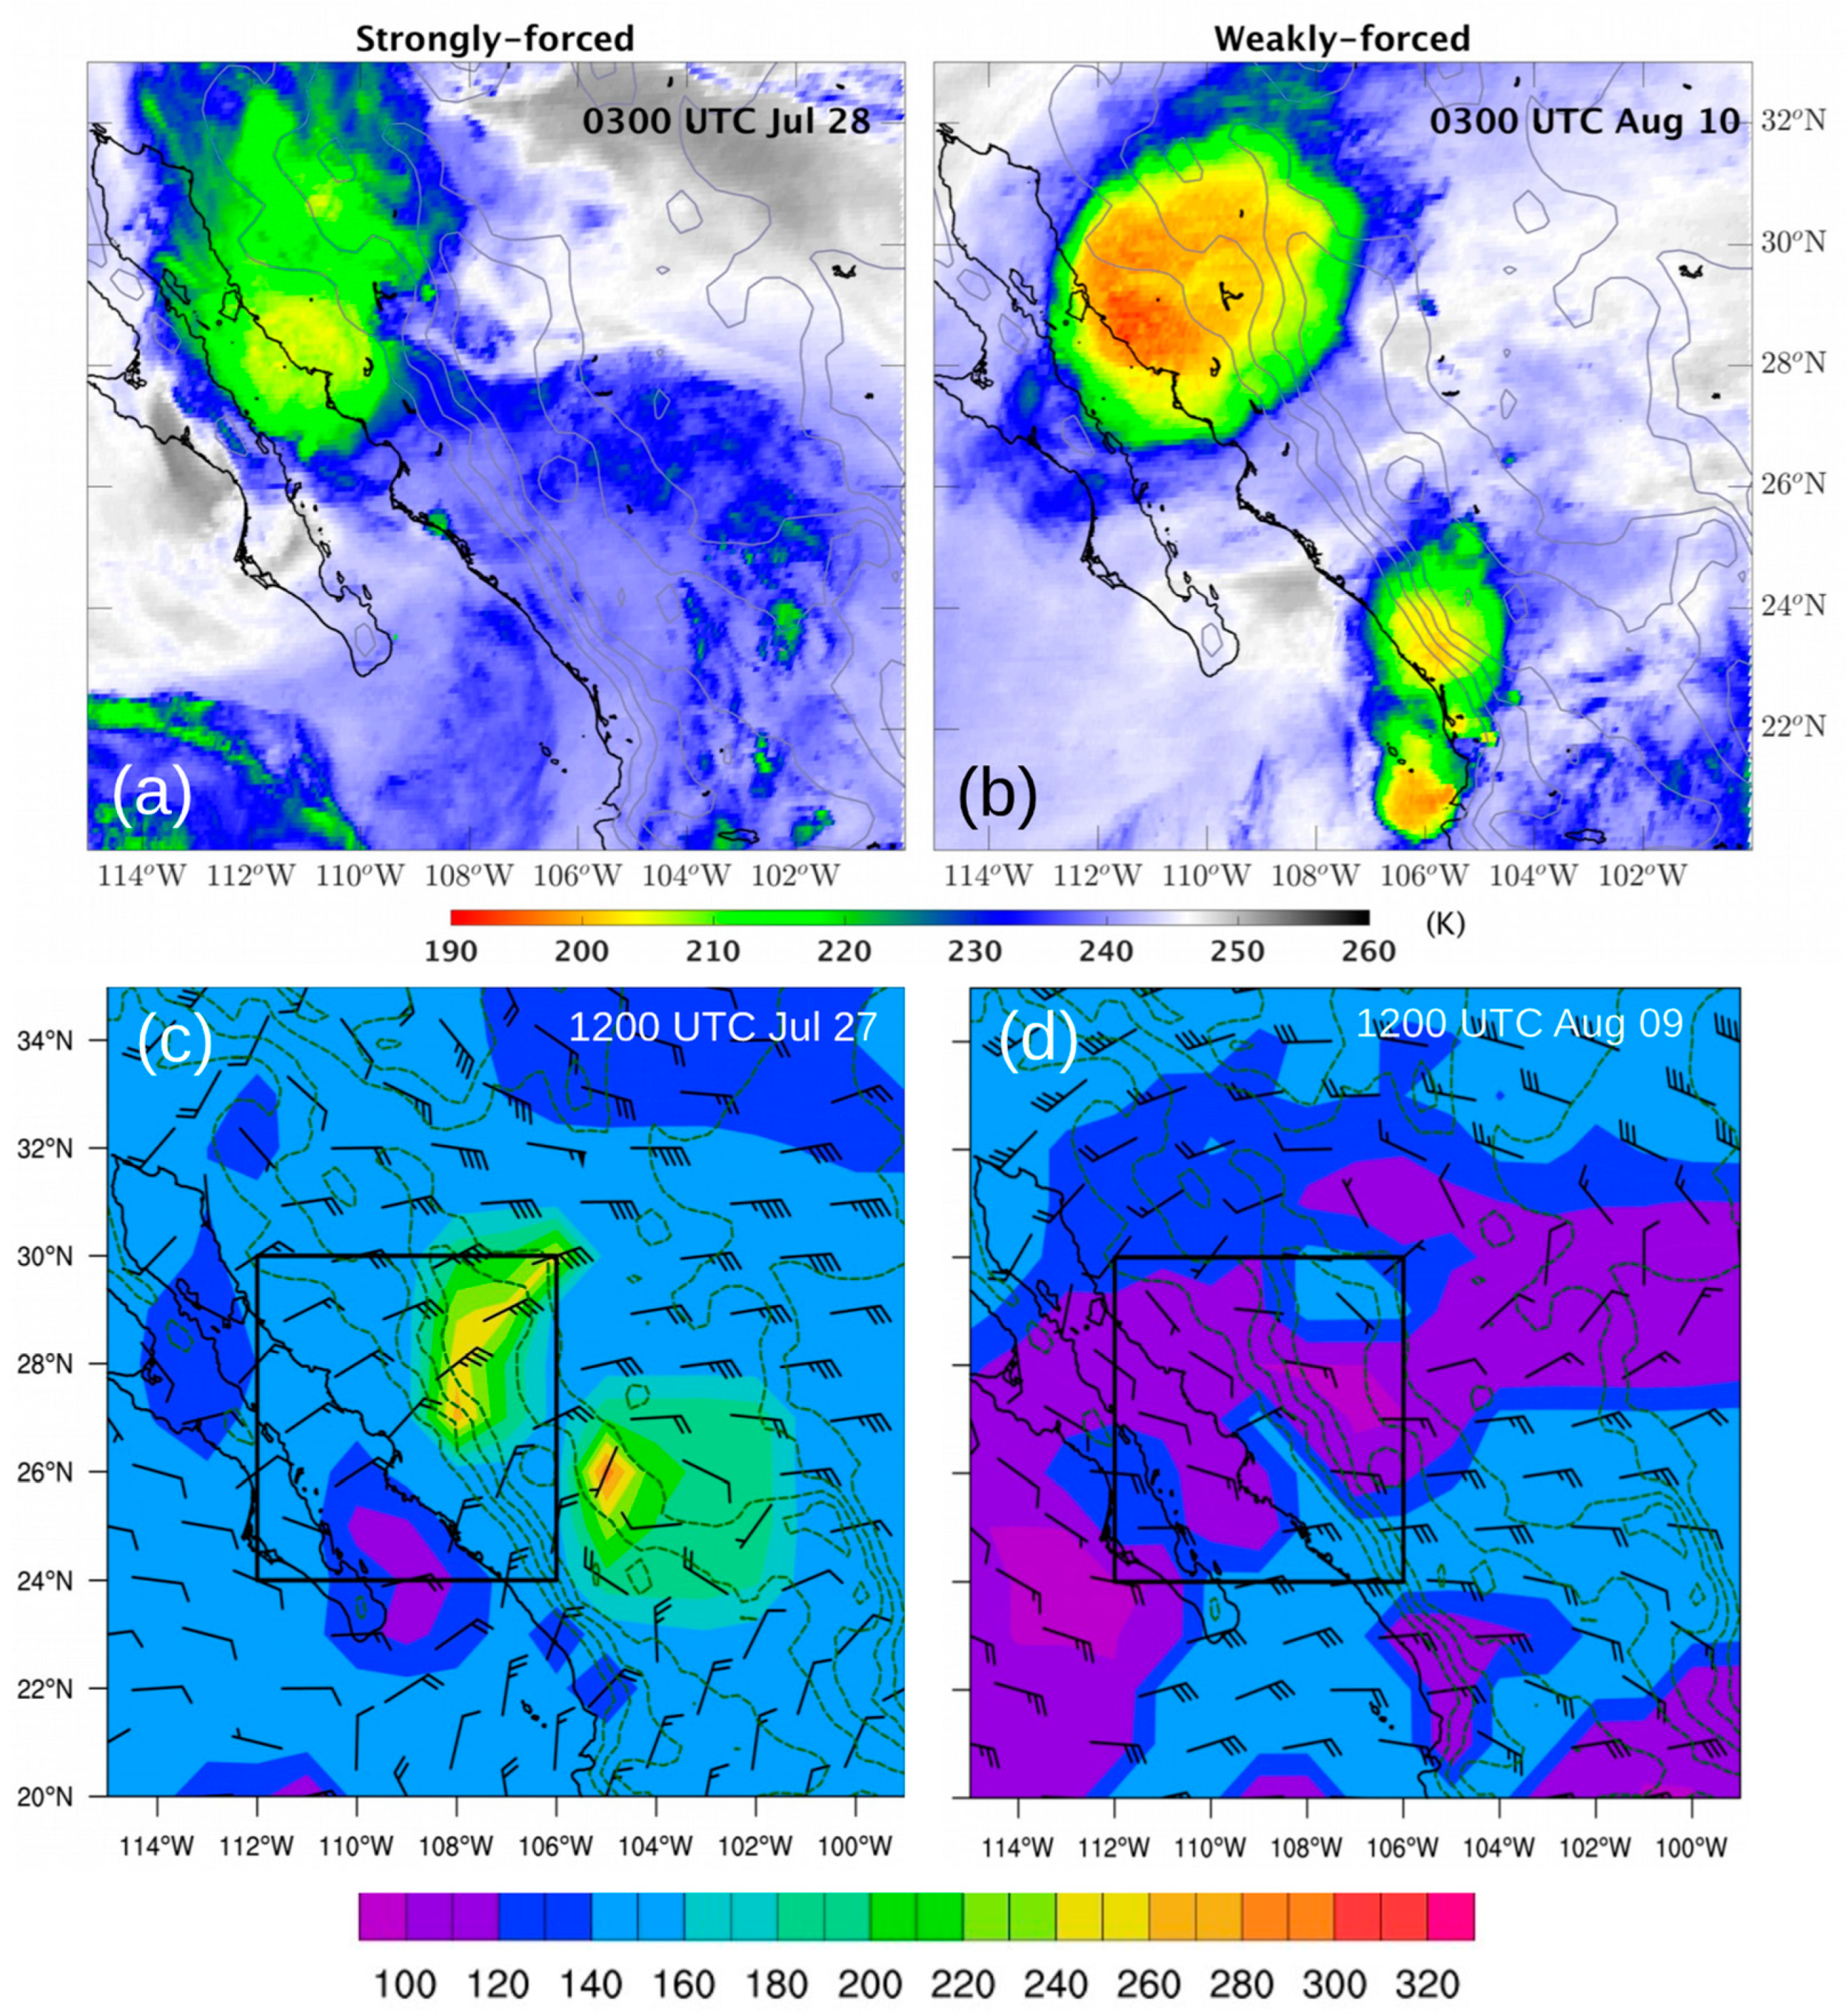
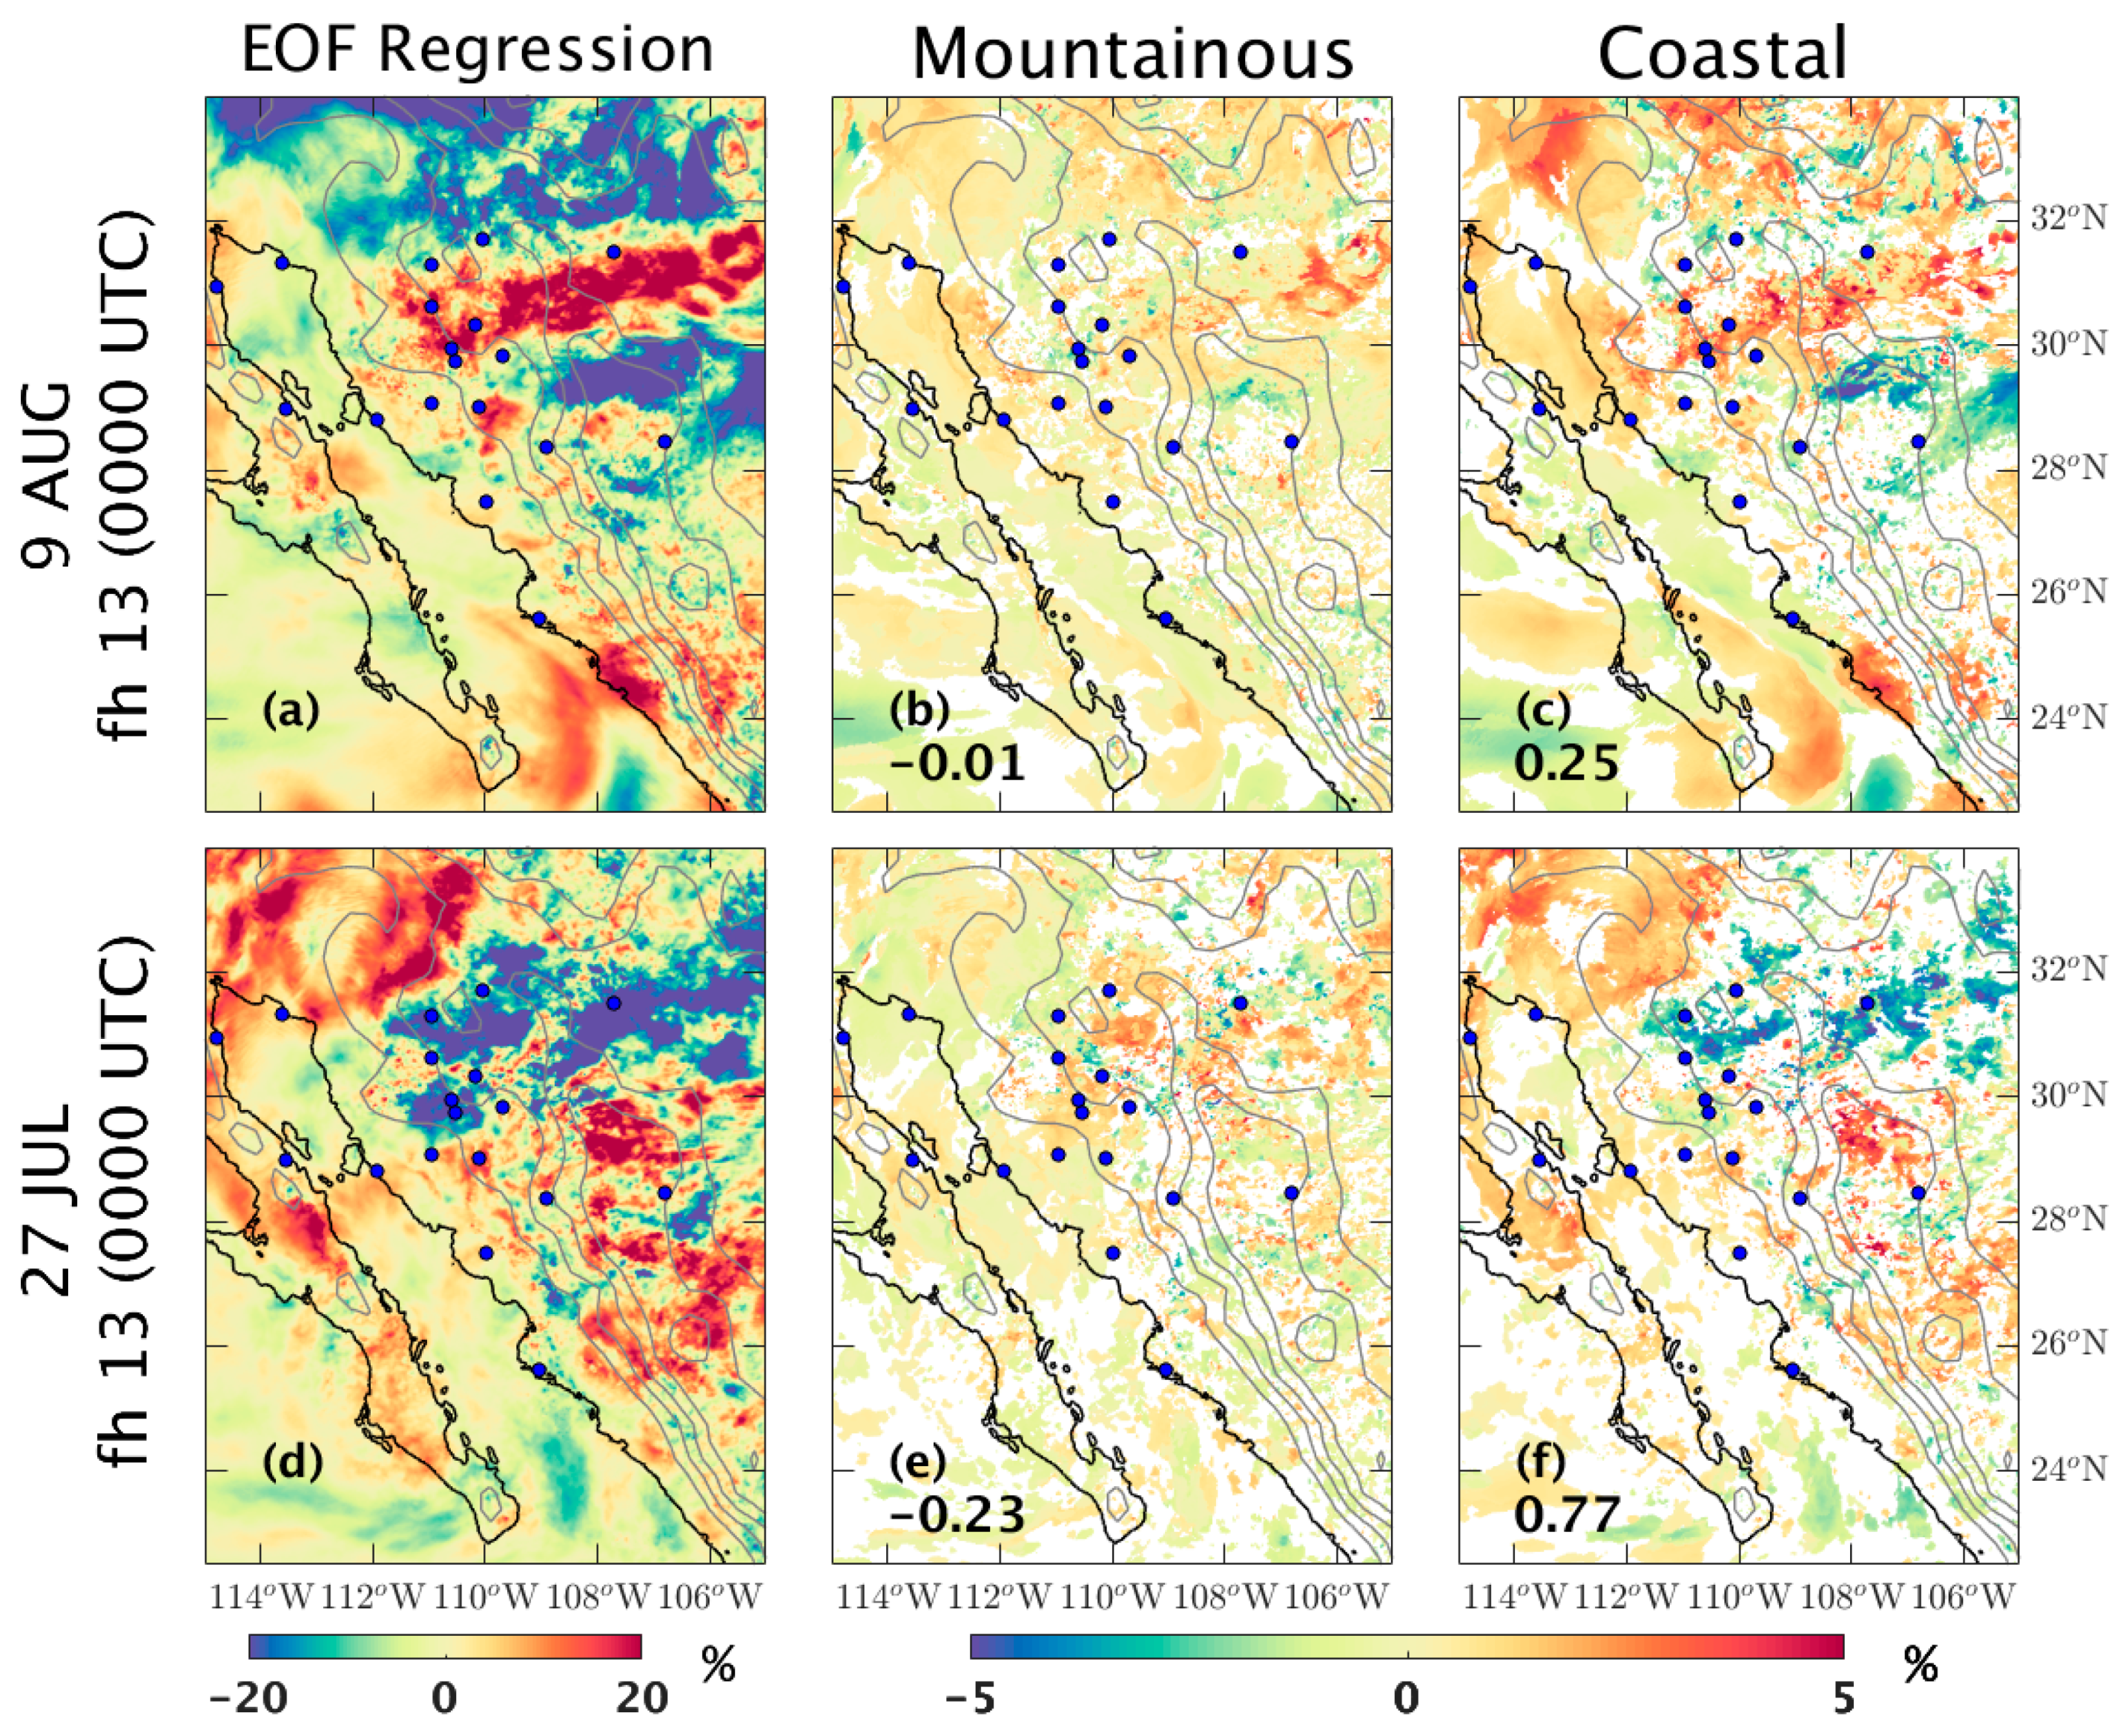
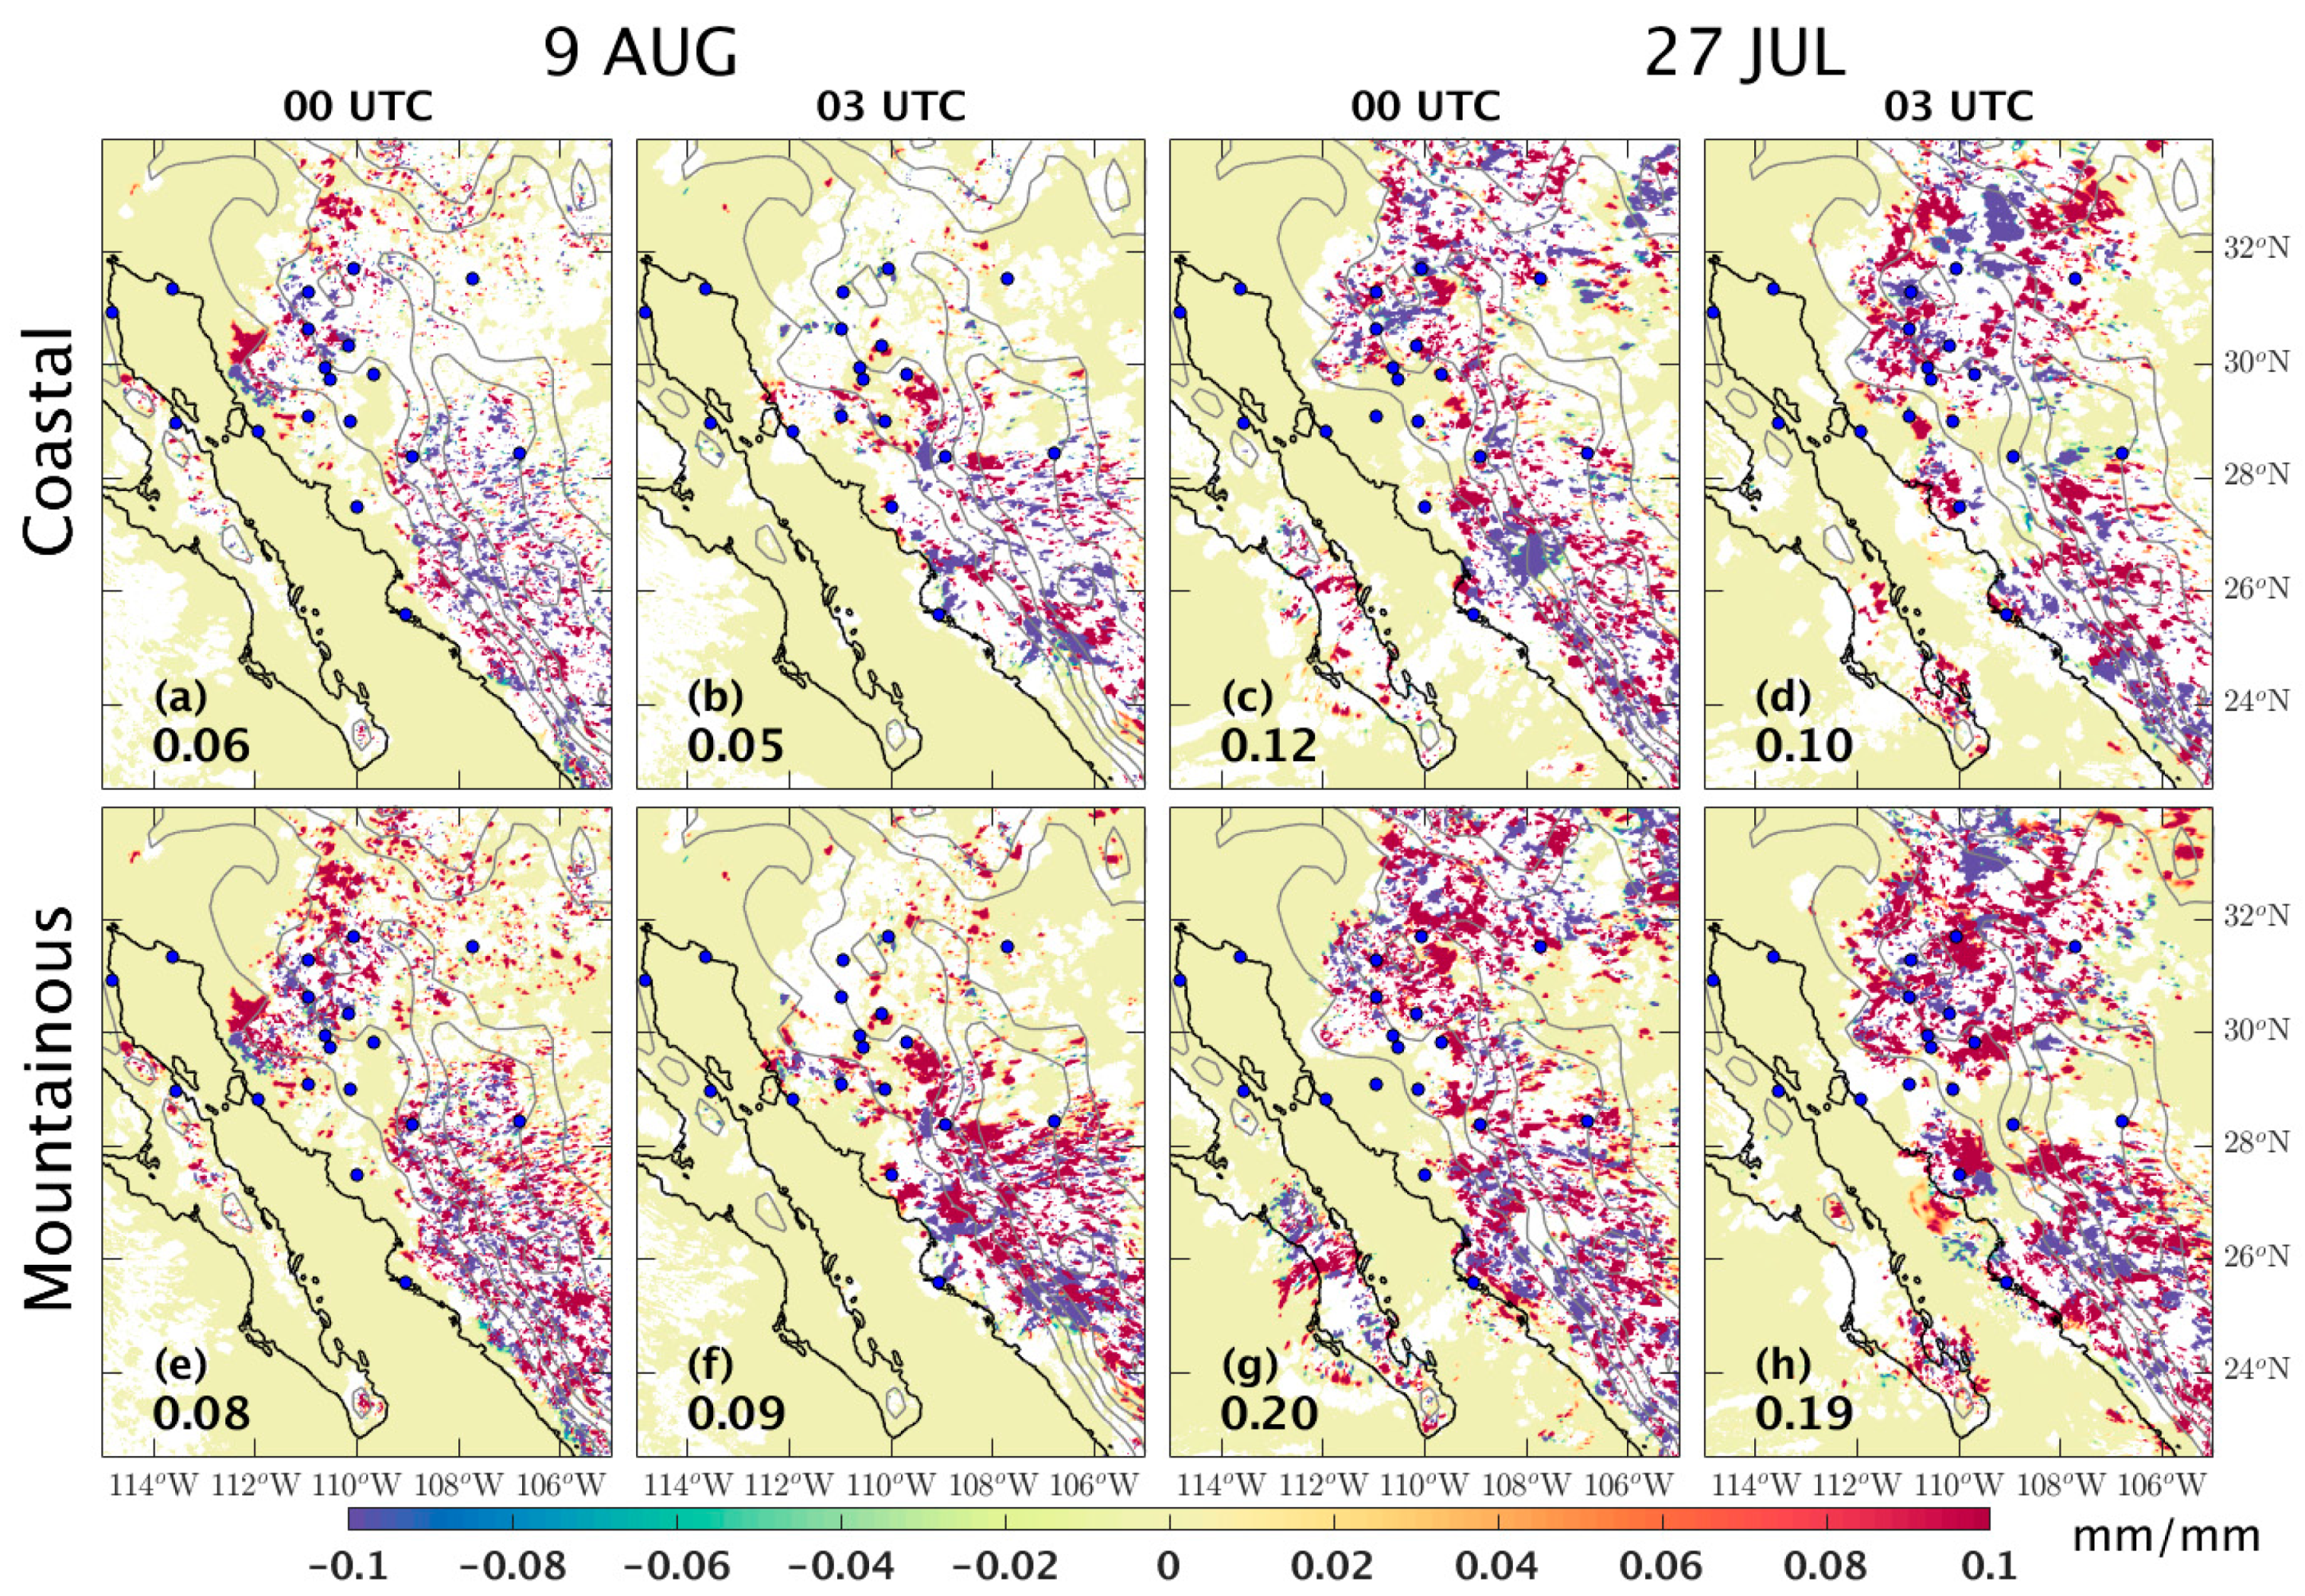
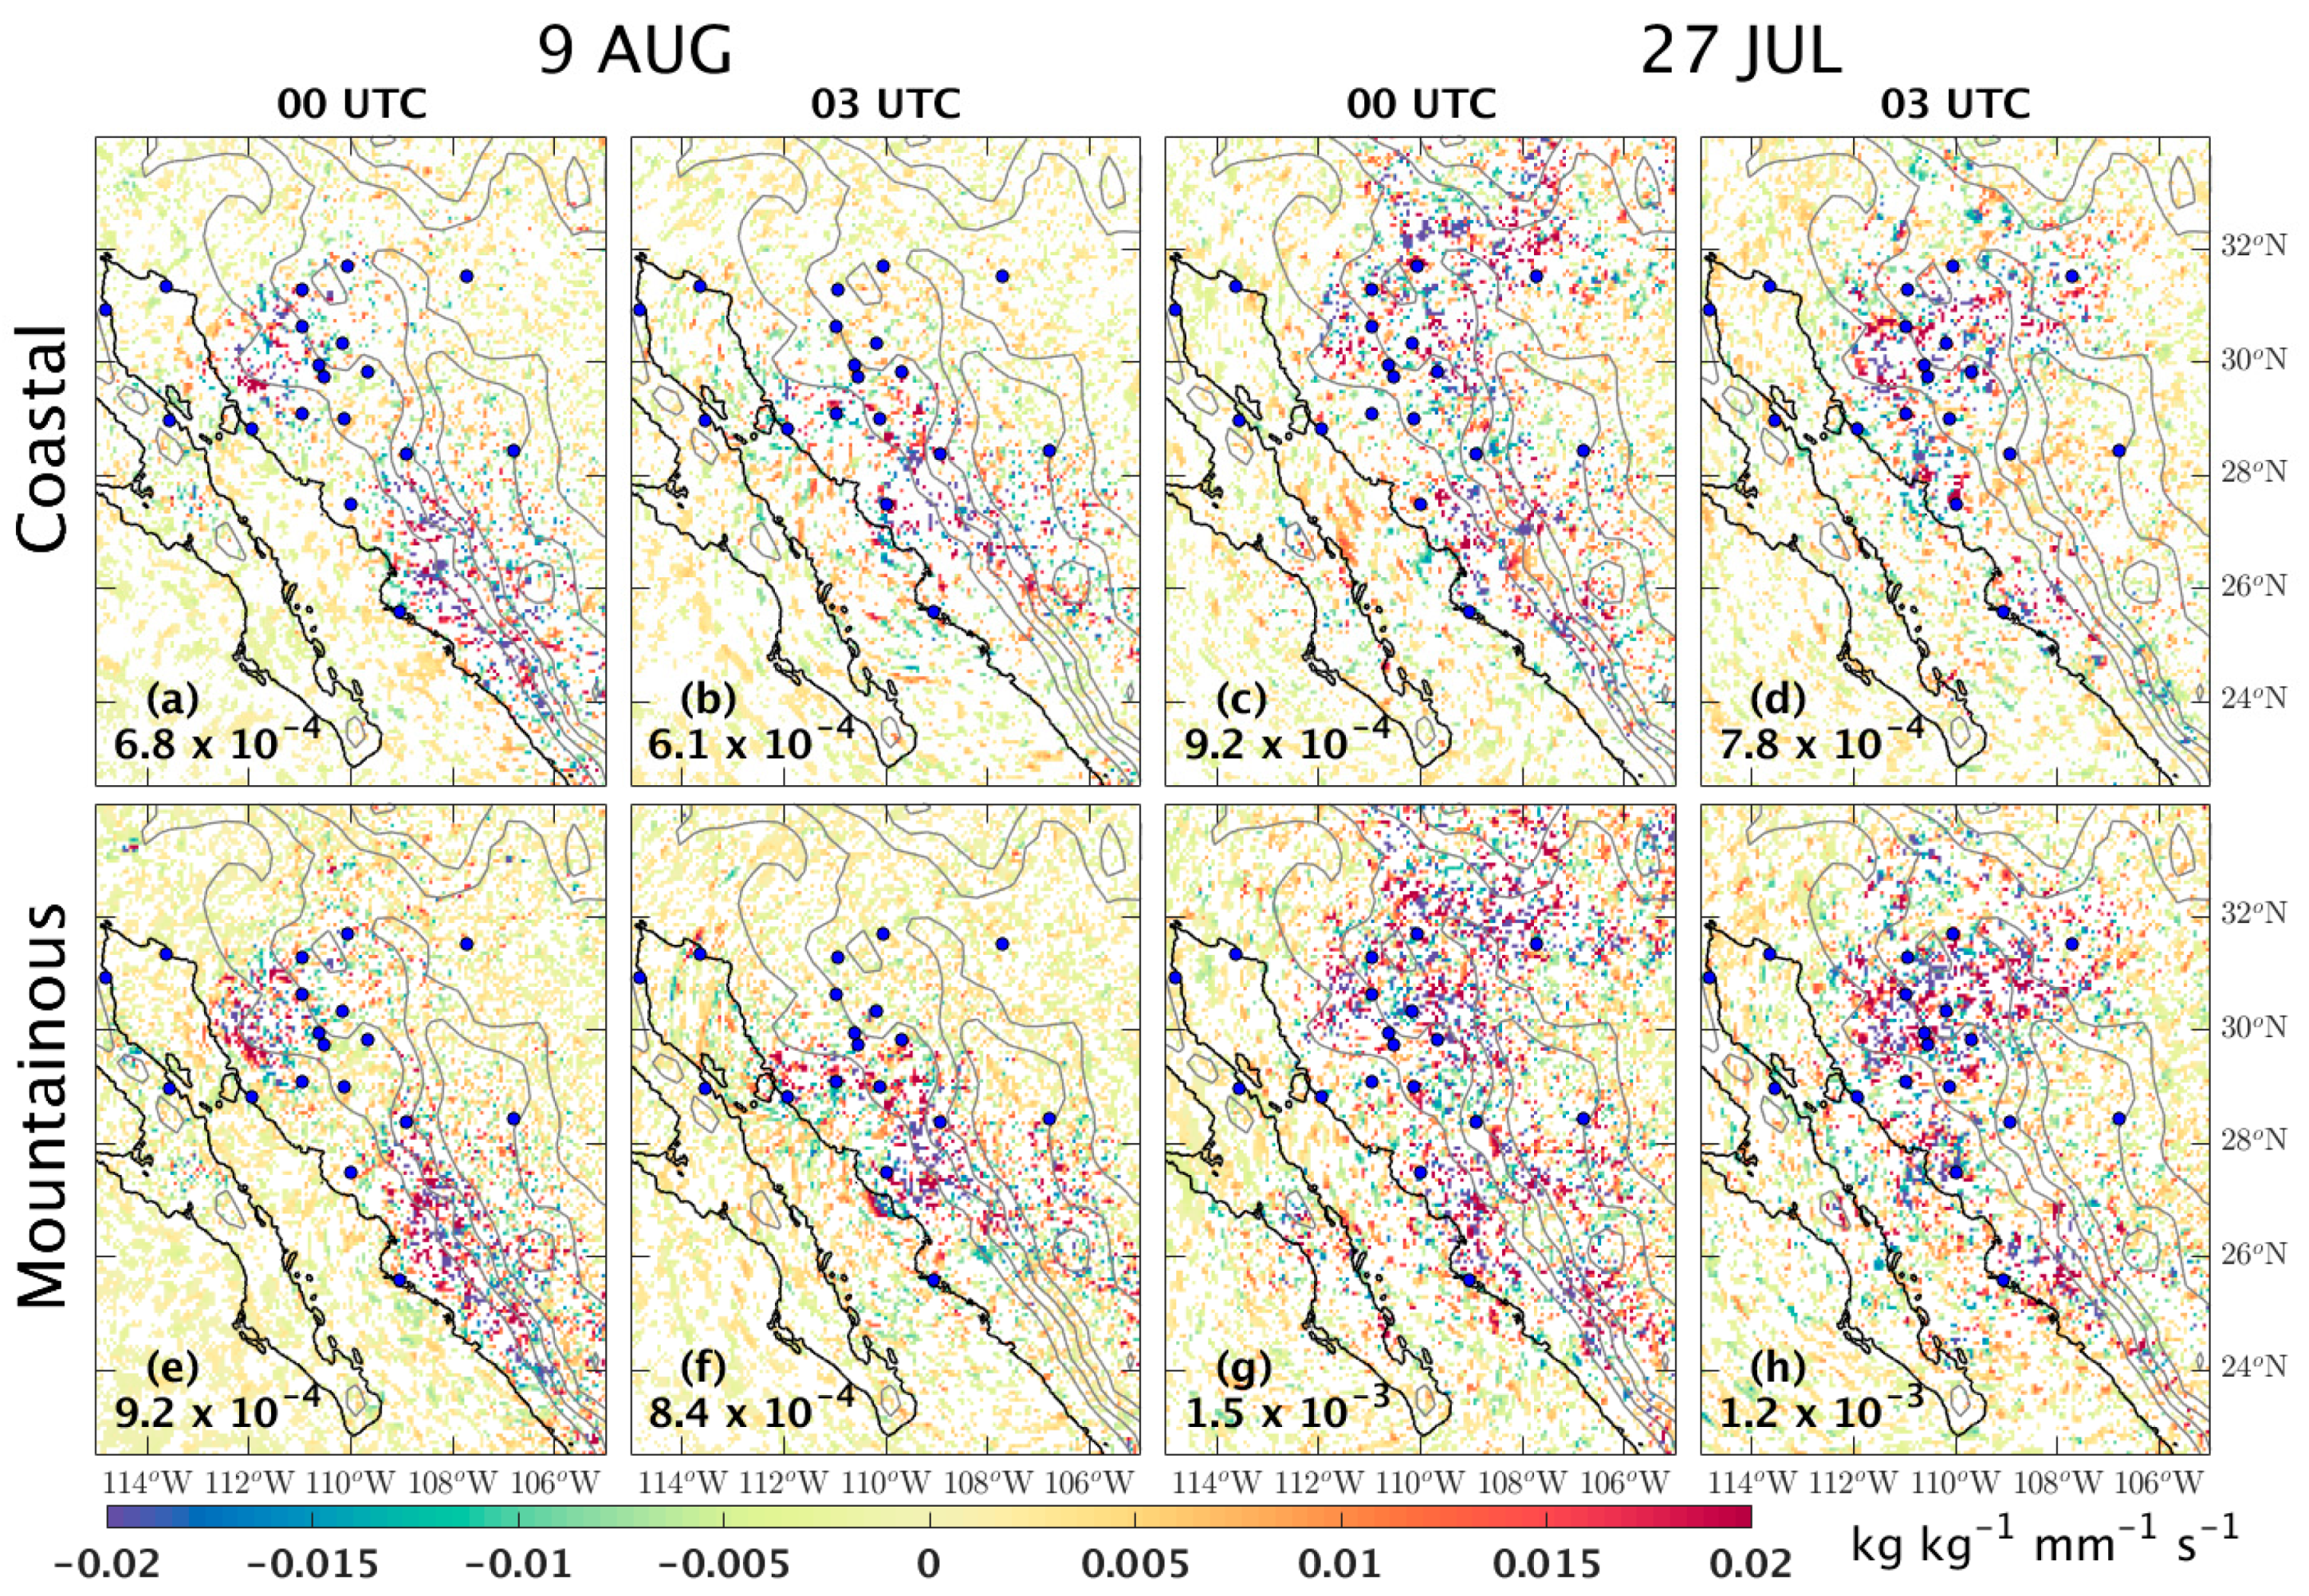
| Station | Lat (N) | Lon (W) | Elev (m msl) | Institution | PWV | Precipitation |
|---|---|---|---|---|---|---|
| ALMS | 27.0217 | 108.9378 | 407.00 | CONAGUA | no | yes |
| AZPE | 30.3369 | 110.1663 | 838.00 | temporary | yes | yes |
| CBRC | 30.7719 | 112.4353 | 201.00 | CONAGUA | no | yes |
| ELPN | 31.6800 | 113.3047 | 131.00 | CONAGUA | no | yes |
| HRMS | 29.0133 | 111.1369 | 150.00 | CONAGUA | no | yes |
| ITS1 | 27.4845 | 110.0000 | 31.00 | temporary | yes | yes |
| KINO | 28.8149 | 111.9287 | 0.00 | temporary | yes | yes |
| MGDA | 30.6321 | 110.9676 | 755.00 | temporary | yes | yes |
| MGRT | 29.8762 | 110.5964 | 625.00 | temporary | no | yes |
| MRSC | 30.0404 | 110.6737 | 721.00 | temporary | no | yes |
| MZTN | 29.0030 | 110.1300 | 544.00 | temporary | yes | yes |
| NGLS | 31.2978 | 110.9139 | 1291.00 | CONAGUA | no | yes |
| OPDE | 29.9444 | 110.6121 | 690.00 | temporary | yes | no |
| RAYN | 29.7410 | 110.5366 | 635.00 | temporary | yes | no |
| REF1 | 31.5112 | 107.7173 | 1227.00 | temporary | yes | no |
| SA80 | 31.2934 | 110.9465 | 1274.00 | temporary | yes | yes |
| SLRC | 32.4239 | 114.7978 | 37.00 | CONAGUA | no | yes |
| TNBA | 28.9719 | 113.5473 | 5.00 | TLALOCNet | yes | yes |
| TNCU | 28.4506 | 106.7940 | 2111.00 | TLALOCNet | yes | yes |
| TNHM | 29.0813 | 110.9703 | 202.00 | TLALOCNet | yes | yes |
| TNPP | 31.3355 | 113.6316 | 39.00 | TLALOCNet | yes | yes |
| TNTB | 25.6059 | 109.0527 | 78.00 | TLALOCNet | yes | yes |
| TSFX | 30.9339 | 114.8106 | 28.00 | TLALOCNet | yes | no |
| USMX | 29.8217 | 109.6810 | 656.00 | TLALOCNet | yes | yes |
| WLNT | 31.7057 | 110.0575 | 1411.00 | temporary | yes | yes |
| YCRA | 28.3667 | 108.9333 | 1551.00 | CONAGUA | no | yes |
| YESX | 28.3783 | 108.9196 | 1537.00 | TLALOCNet | yes | yes |
| Product | Source | Spatial Resolution | Temporal Resolution | References |
|---|---|---|---|---|
| GPM Early | NASA | 0.1° | Half-hourly | Huffman (2017) [36] Hou et al. (2014) [37] |
| GPM Final | NASA | 0.1° | Half-hourly | Huffman (2017) [36] Hou et al. (2014) [37] |
| CMORPH | NOAA | 8 km | Half-hourly | Joyce et al. (2004) [38] |
| PERSIANN | UCI | 0.25° | 1 hourly | Sorooshian et al. (2002) [39] |
| Dataset | Sources | Purpose |
|---|---|---|
| Surface Meteorological data | http://mesowest.utah.edu | To identify the rainfall |
| GOES-15 Water Vapor | NASA Langley Cloud and Radiation Research Group (http://www-angler.larc.nasa.gov) | To identify upper-level atmospheric dynamics and inverted troughs (IVs) with convective development |
| GFS Analysis (0.5°/6-hourly, 31 vertical levels) | NCDC https://www.ncdc.noaa.gov/ | To identify the wind patterns at 300 hPa and the PV anomaly at 2-PVU layer |
| CONUS GOES 4-km water vapor imagery | https://mesonet.agron.iastate.edu/GIS/goes.phtml | To identify IVs with convective development |
| Surface analysis and GOES-West IR imagery | https://www.wpc.ncep.noaa.gov/#page=ovw | To identify early convective organization |
| WRF-ARW Experiments | d01 | d02 | d03 |
|---|---|---|---|
| WRF-GFS | 30 km | 10 km | 2.5 km * |
| WRF-NAM | 10 km | 2.5 km * |
| Category | Scheme | Reference |
|---|---|---|
| Microphysics | WRF single-moment 6-class | Hong and Lim (2006) [47] |
| Longwave radiation | Rapid Radiative Transfer Model | Iacono et al. (2008) [48] |
| Shortwave radiation | Goddard | Chou and Suarez (1999) [49] |
| Land Surface | Noah-MP (multi physics) | Niu et al. (2011) [50] |
| Planetary boundary layer | Yonsei University | Hong et al. (2006) [51] |
| Weakly Forced Days | Strongly Forced Days | Light Convection | Break | TC |
|---|---|---|---|---|
| 1 Jul to 5 Jul | 7 Jul to 9 Jul | 30 Jun | 17 Jul | 1 Sep |
| 10 Jul to 12 Jul | 13 Jul | 6 Jul | 21 Jul | 2 Sep |
| 15 Jul | 14 Jul | 15 Aug | 30 Jul | |
| 16 Jul | 18 Jul | 20 Aug | 5 Aug | |
| 19 Jul | 27 Jul | 21 Aug | 6 Aug | |
| 20 Jul | 28 Jul | 24 Aug | 13 Aug | |
| 22 Jul to 26 Jul | 18 Aug | 10 Sep to 12 Sep | 14 Aug | |
| 29 Jul | 17 Aug | |||
| 31 Jul | 28 Aug to 31 Aug | |||
| 1 Aug to 4 Aug | 5 Sep | |||
| 7 Aug to 12 Aug | 6 Sep | |||
| 16 Aug | 8 Sep | |||
| 19 Aug | 9 Sep | |||
| 22 Aug | ||||
| 23 Aug | ||||
| 25 Aug to 27 Aug | ||||
| 3 Sep | ||||
| 4 Sep | ||||
| 7 Sep |
© 2019 by the authors. Licensee MDPI, Basel, Switzerland. This article is an open access article distributed under the terms and conditions of the Creative Commons Attribution (CC BY) license (http://creativecommons.org/licenses/by/4.0/).
Share and Cite
Risanto, C.B.; Castro, C.L.; Moker, J.M., Jr.; Arellano, A.F., Jr.; Adams, D.K.; Fierro, L.M.; Minjarez Sosa, C.M. Evaluating Forecast Skills of Moisture from Convective-Permitting WRF-ARW Model during 2017 North American Monsoon Season. Atmosphere 2019, 10, 694. https://doi.org/10.3390/atmos10110694
Risanto CB, Castro CL, Moker JM Jr., Arellano AF Jr., Adams DK, Fierro LM, Minjarez Sosa CM. Evaluating Forecast Skills of Moisture from Convective-Permitting WRF-ARW Model during 2017 North American Monsoon Season. Atmosphere. 2019; 10(11):694. https://doi.org/10.3390/atmos10110694
Chicago/Turabian StyleRisanto, Christoforus Bayu, Christopher L. Castro, James M. Moker, Jr., Avelino F. Arellano, Jr., David K. Adams, Lourdes M. Fierro, and Carlos M. Minjarez Sosa. 2019. "Evaluating Forecast Skills of Moisture from Convective-Permitting WRF-ARW Model during 2017 North American Monsoon Season" Atmosphere 10, no. 11: 694. https://doi.org/10.3390/atmos10110694
APA StyleRisanto, C. B., Castro, C. L., Moker, J. M., Jr., Arellano, A. F., Jr., Adams, D. K., Fierro, L. M., & Minjarez Sosa, C. M. (2019). Evaluating Forecast Skills of Moisture from Convective-Permitting WRF-ARW Model during 2017 North American Monsoon Season. Atmosphere, 10(11), 694. https://doi.org/10.3390/atmos10110694


