Interannual Variability of Spring Extratropical Cyclones over the Yellow, Bohai, and East China Seas and Possible Causes


Abstract
1. Introduction
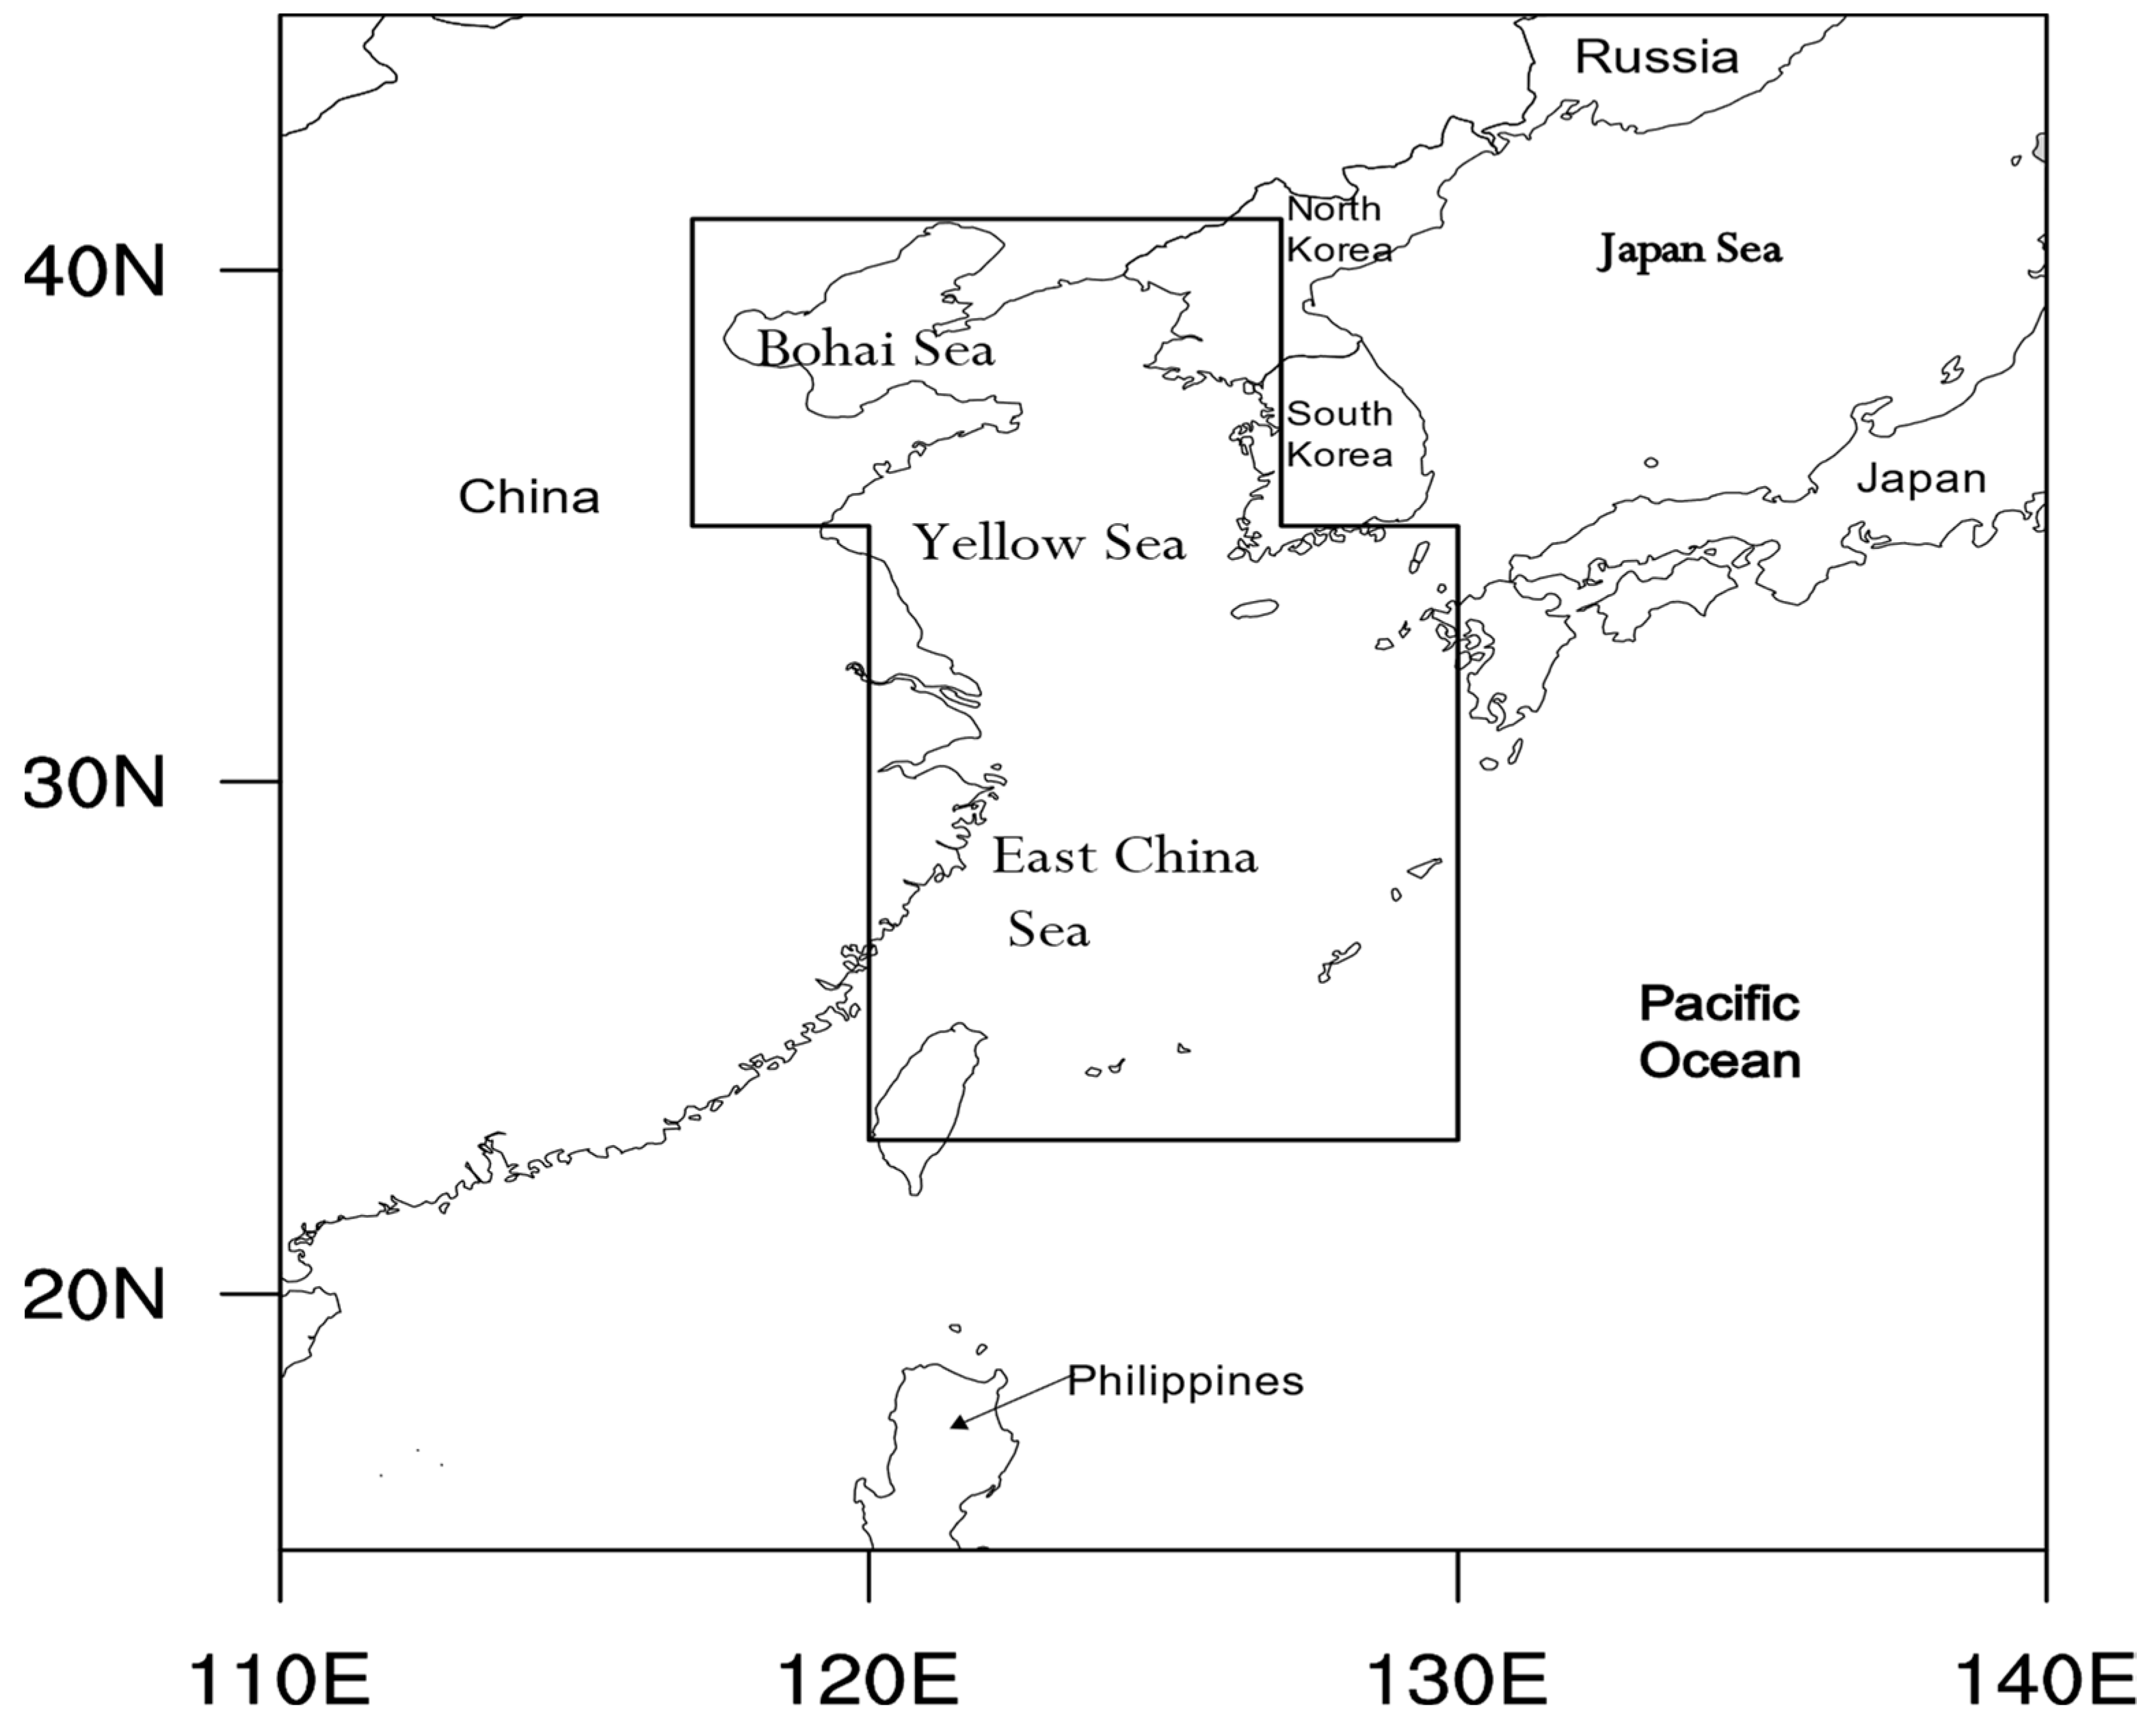
2. Data and Methods
2.1. Data
2.2. Methods
2.2.1. Cyclone Tracking
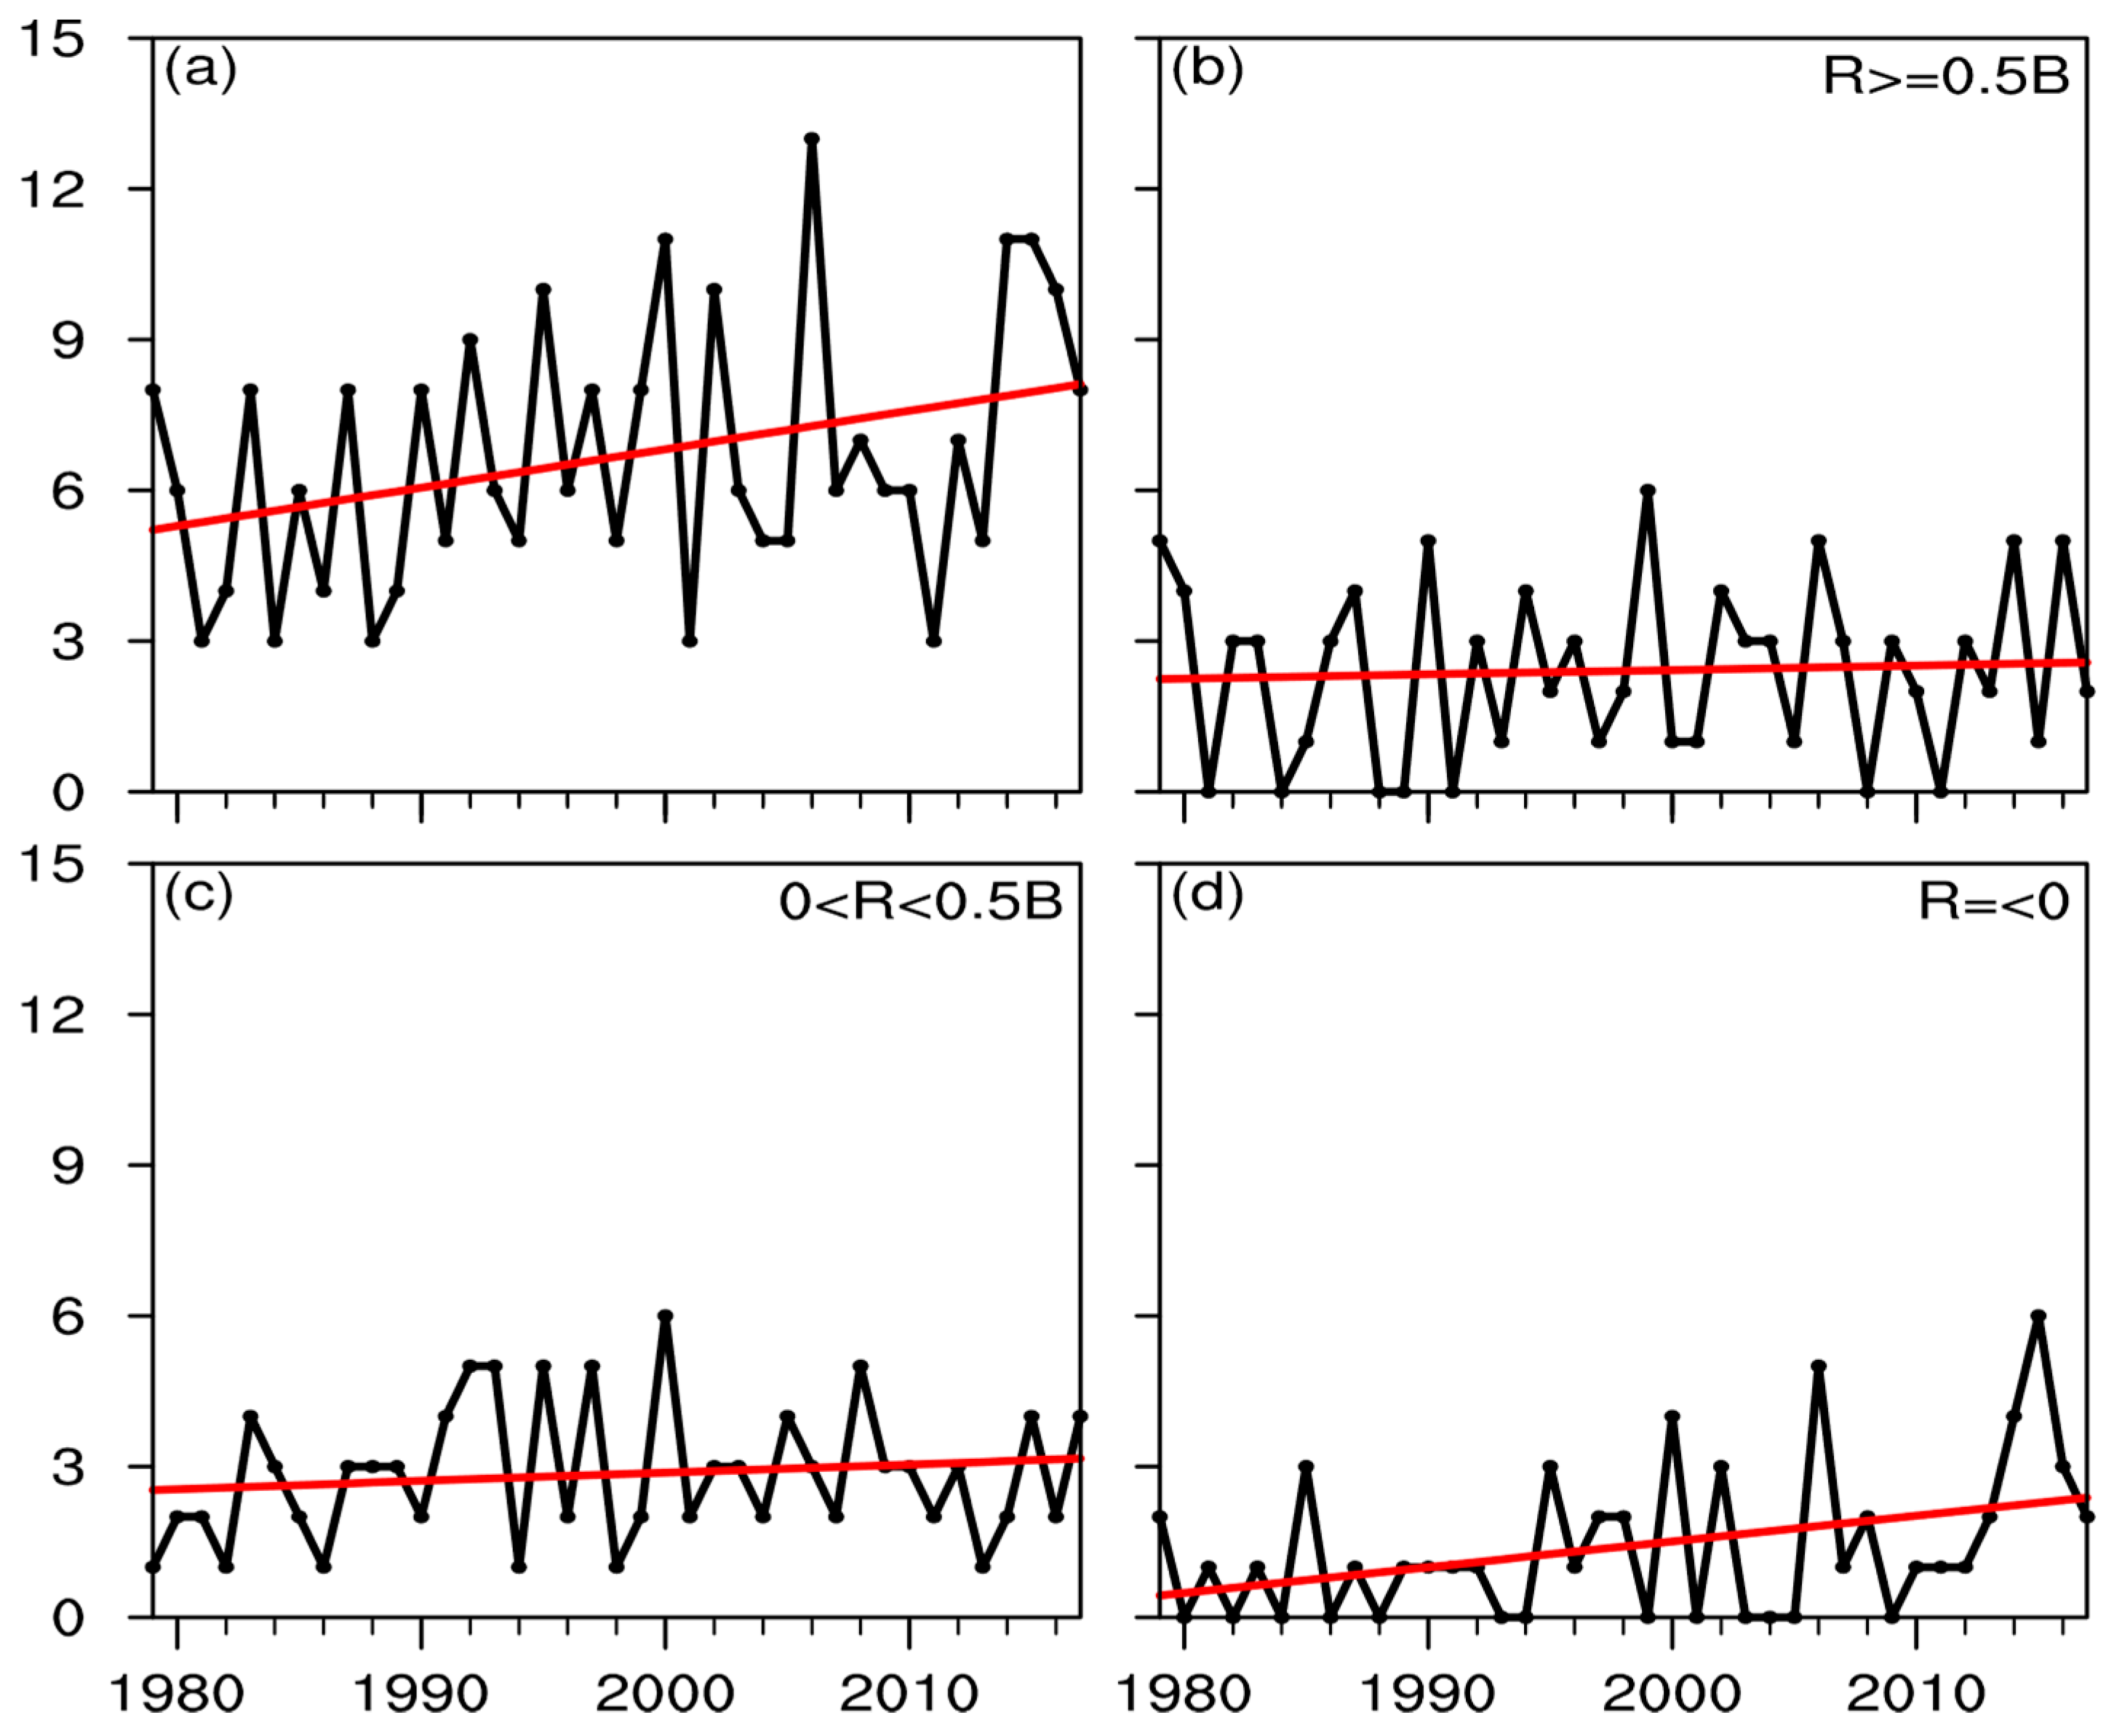
2.2.2. Selection and Classification of Cyclones
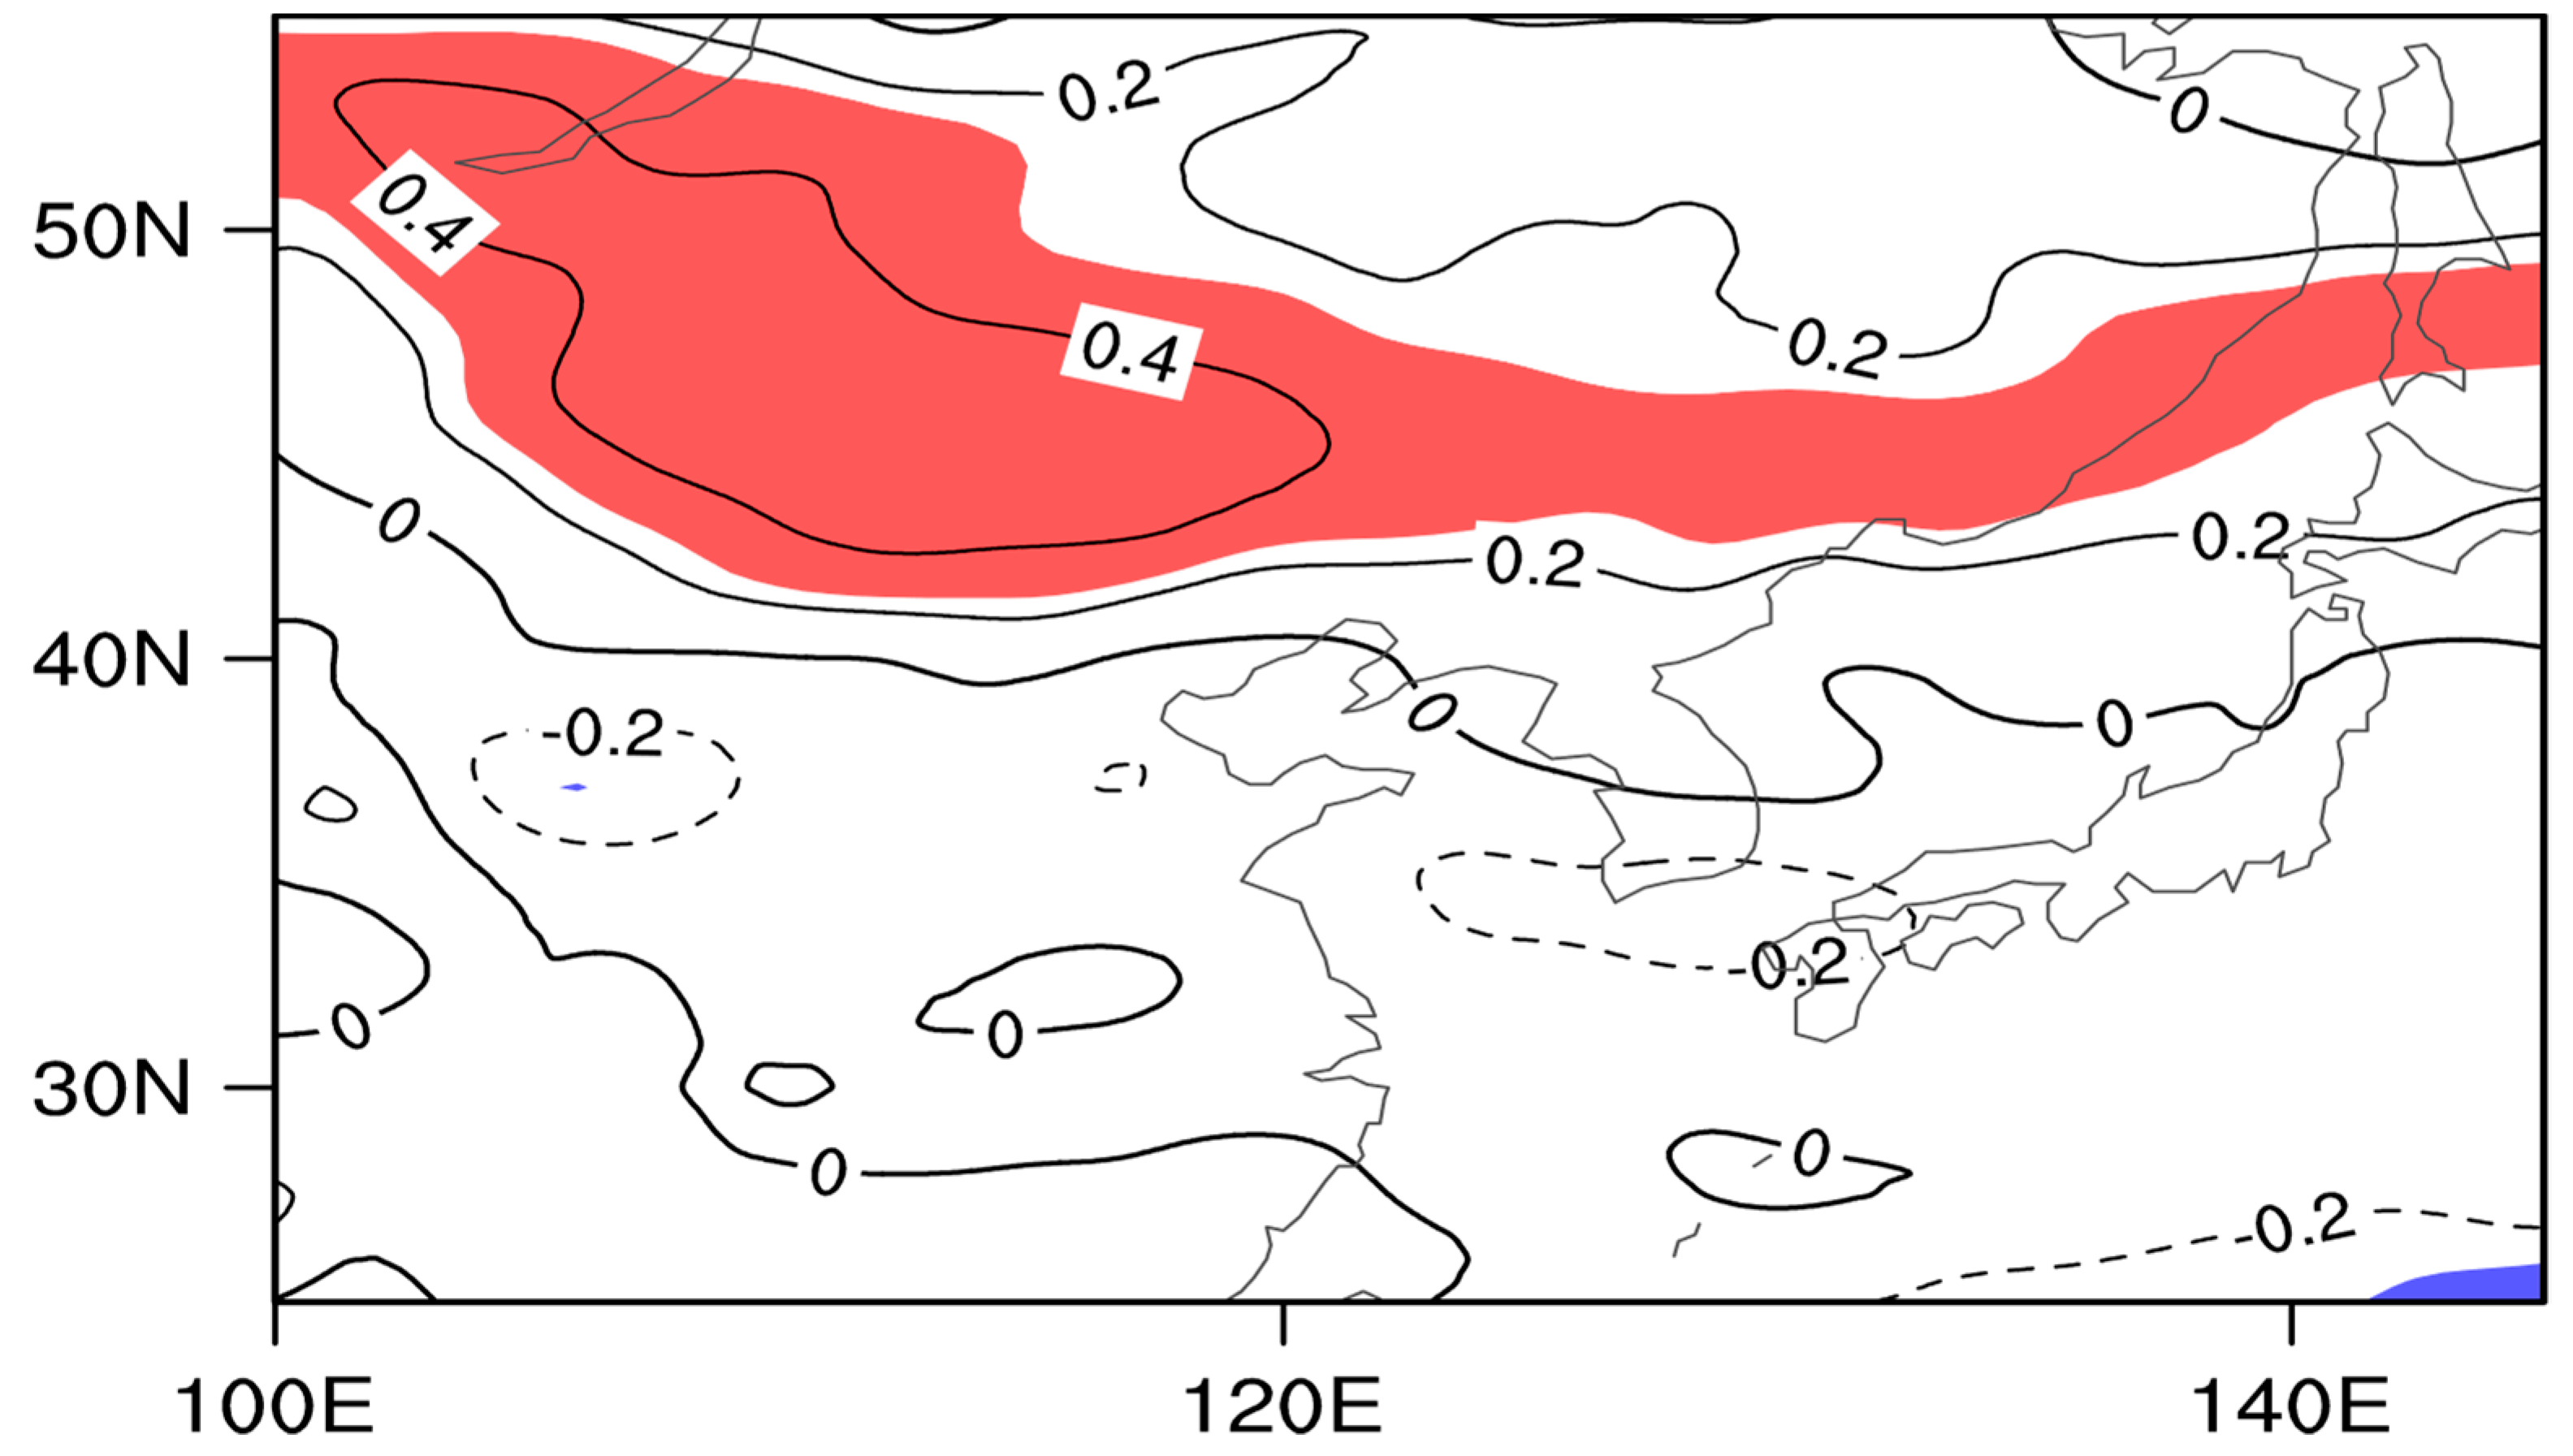
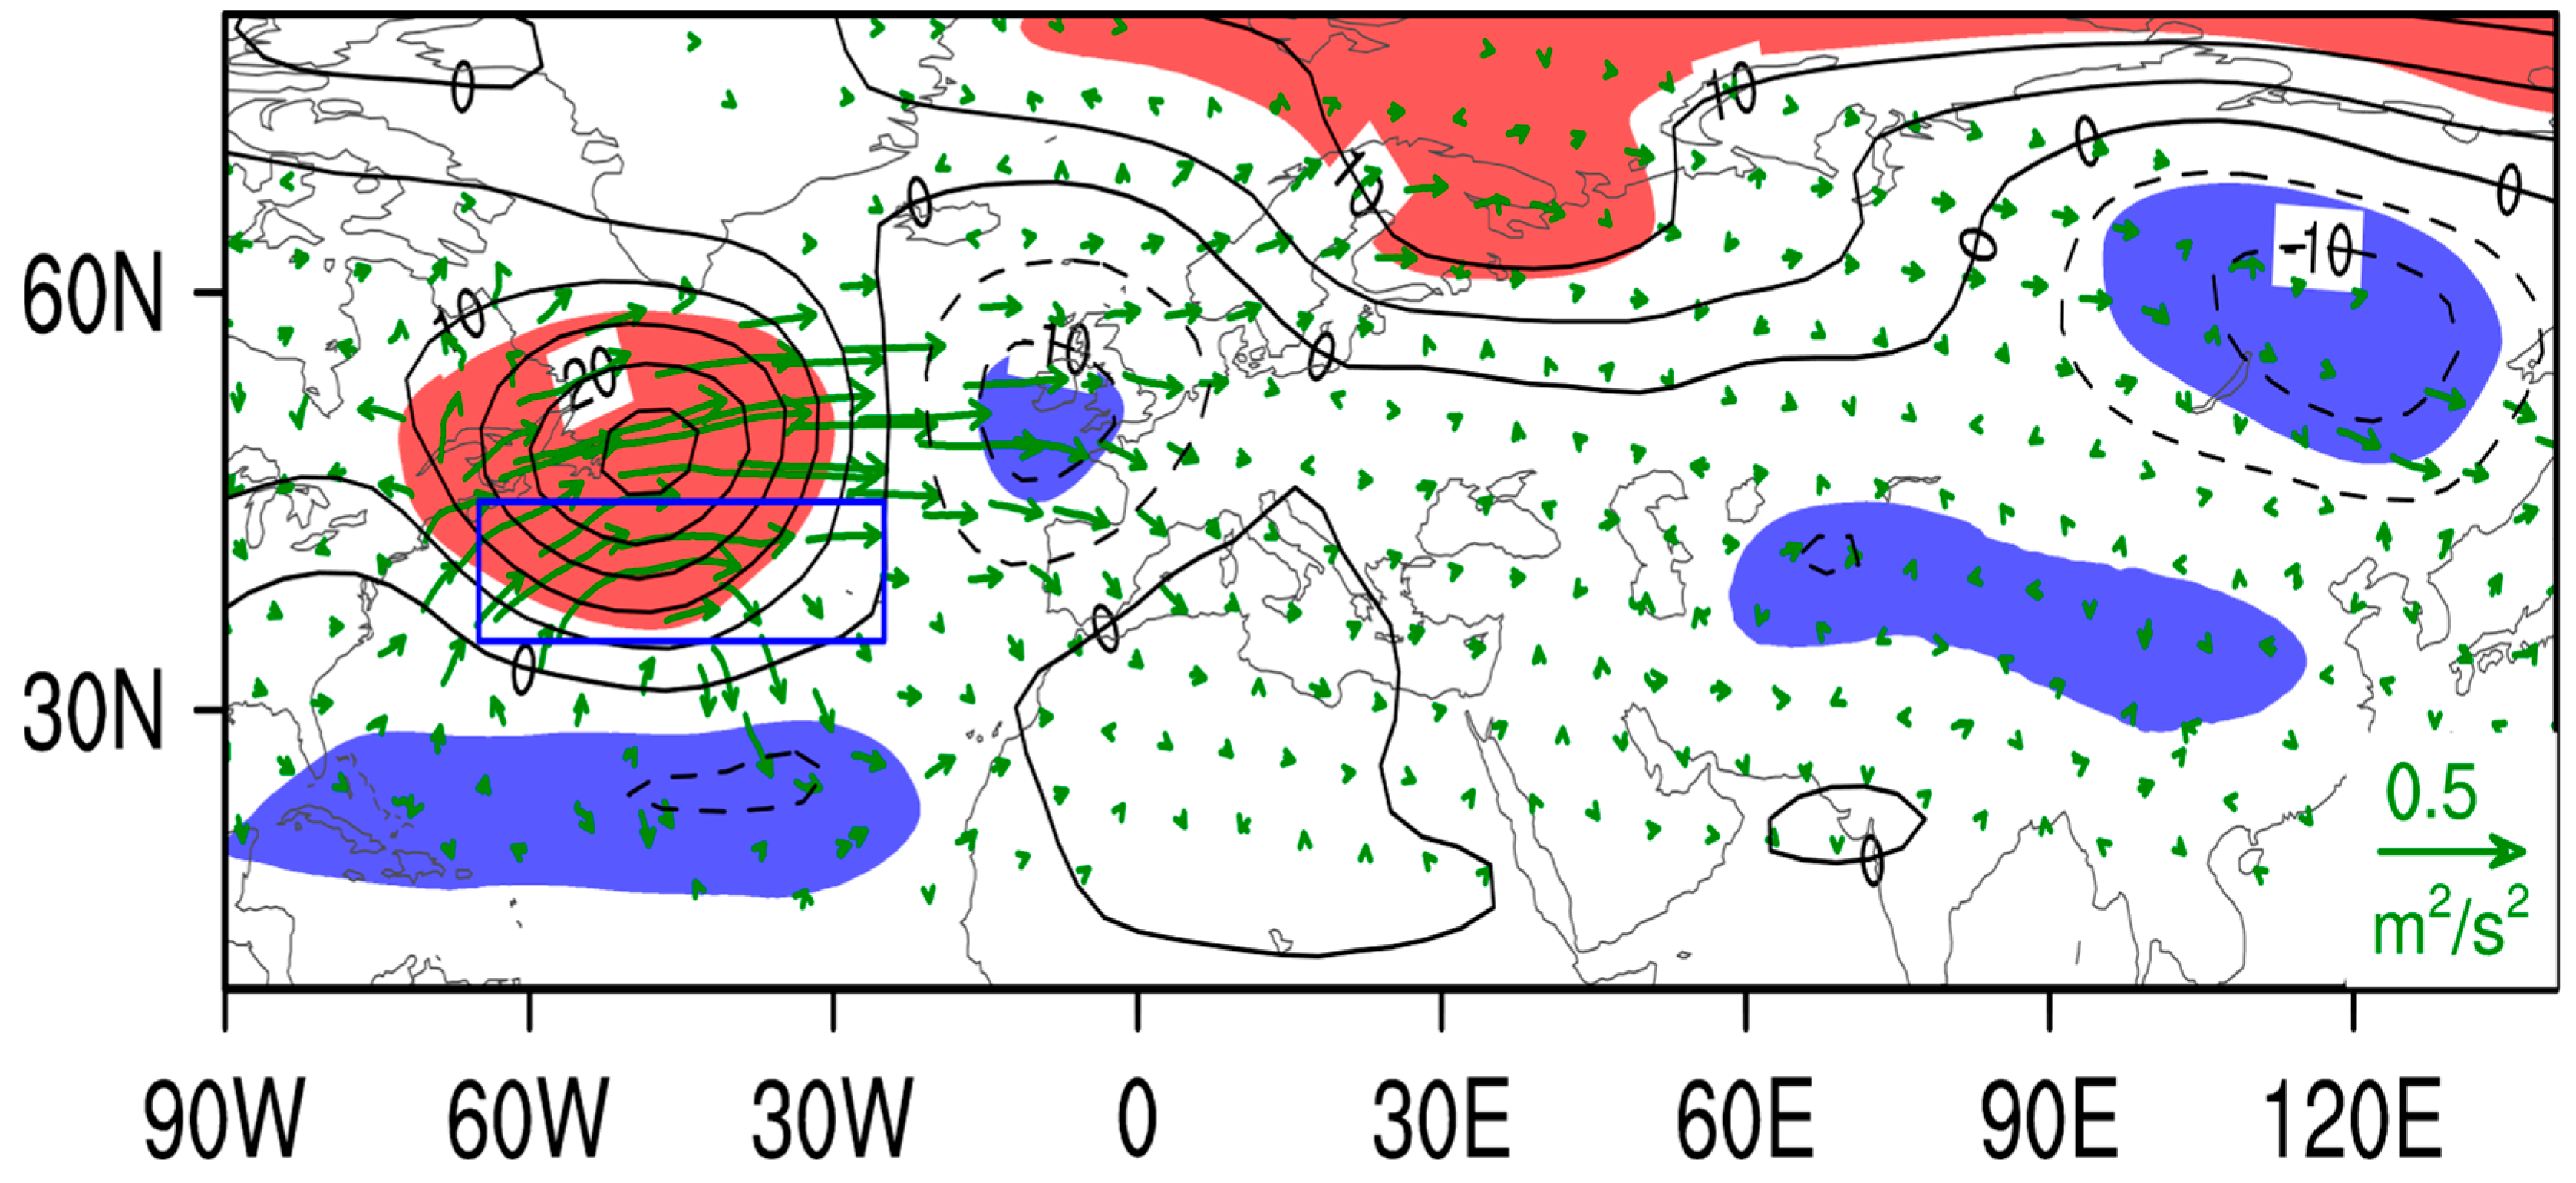
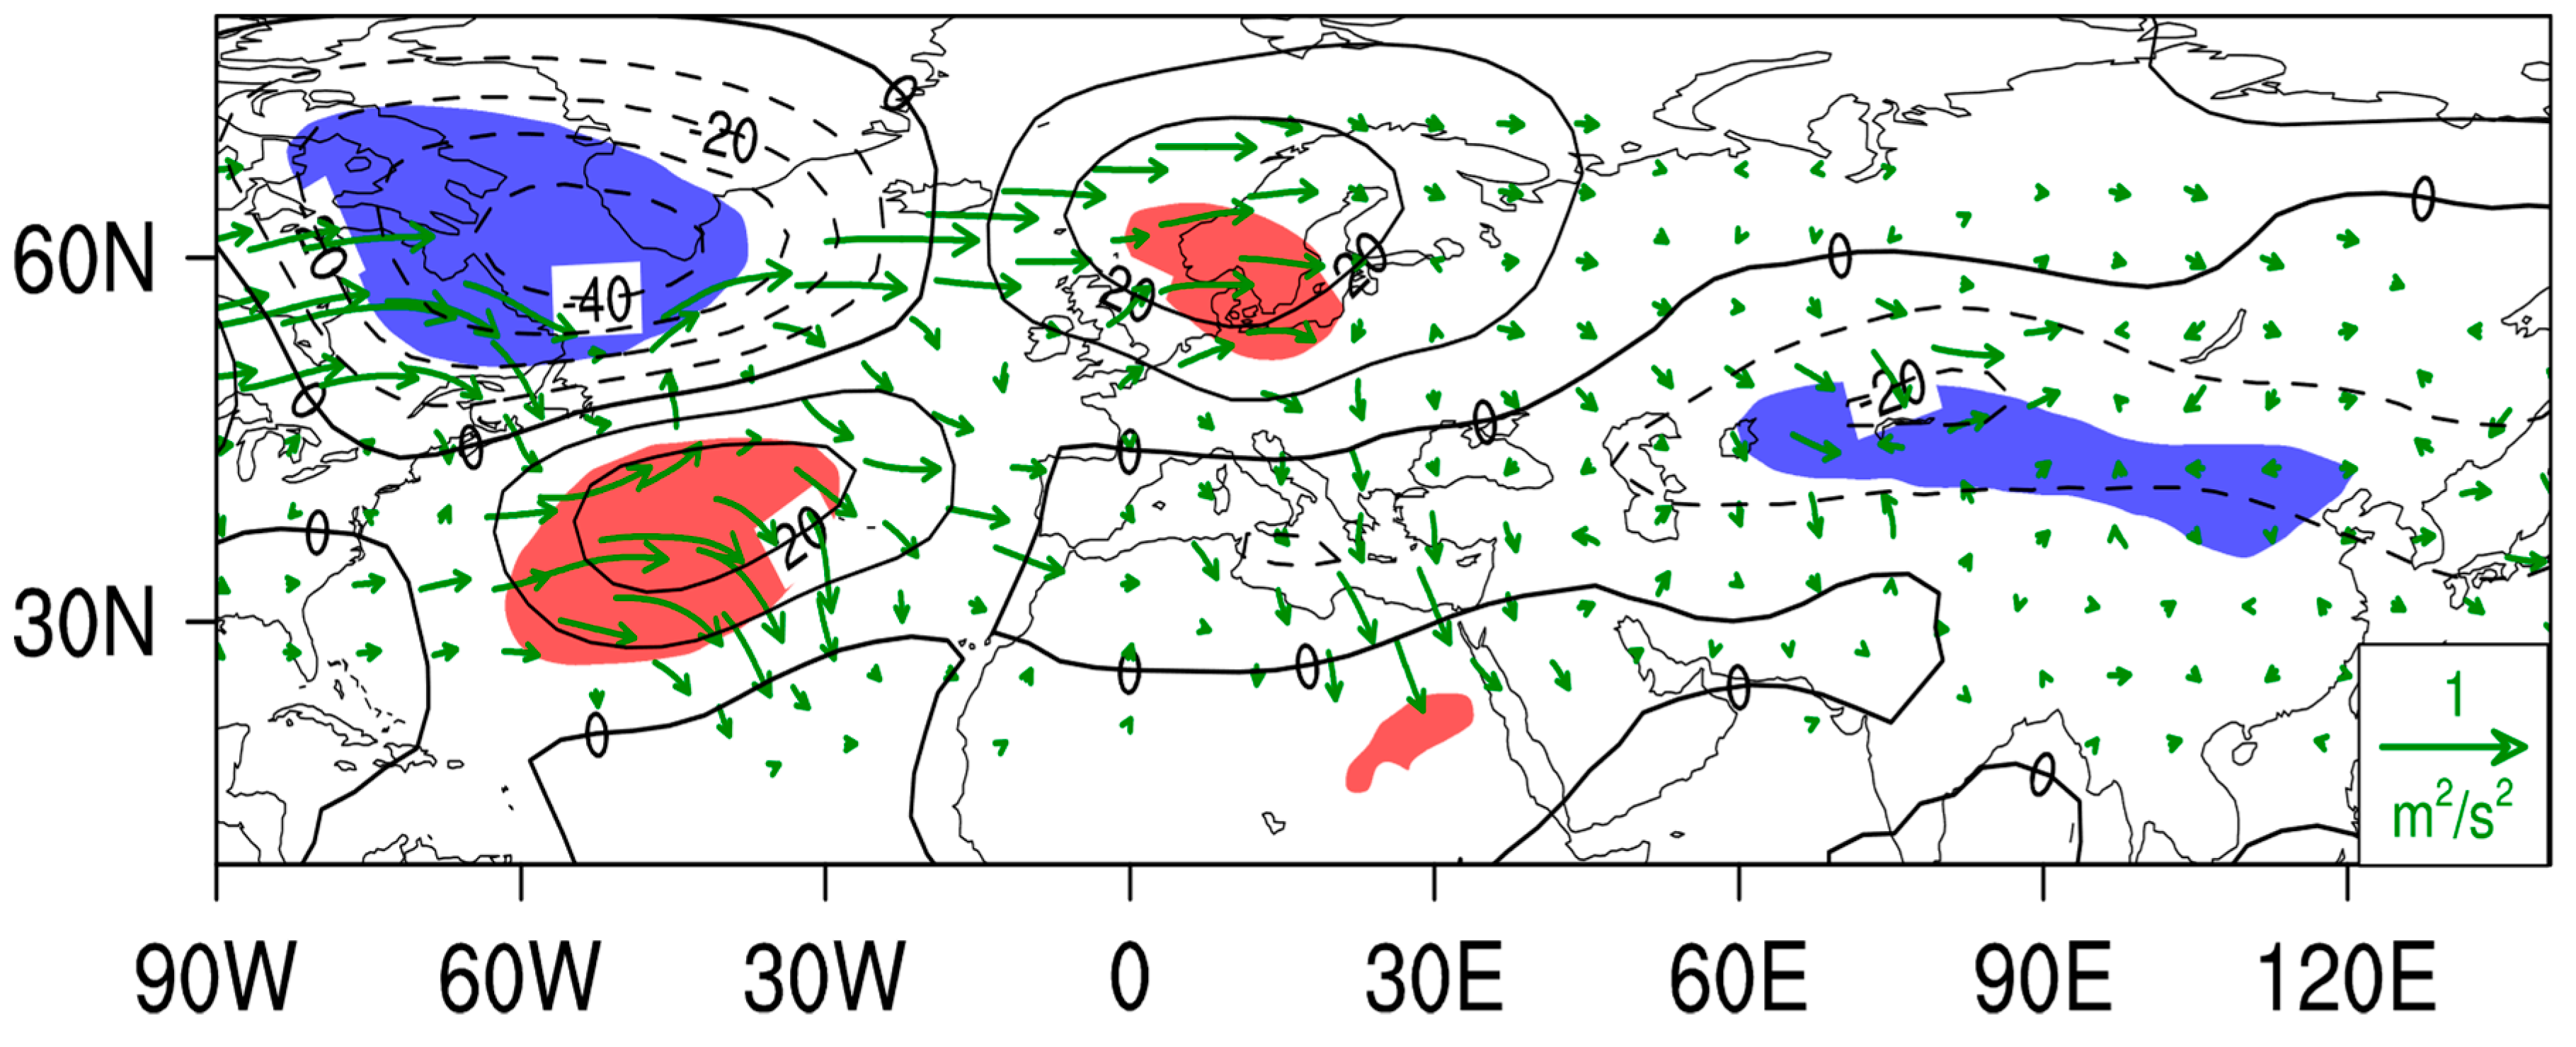
2.2.3. Wave Activity Fluxes
2.2.4. Atmospheric Baroclinicity
2.3. Model
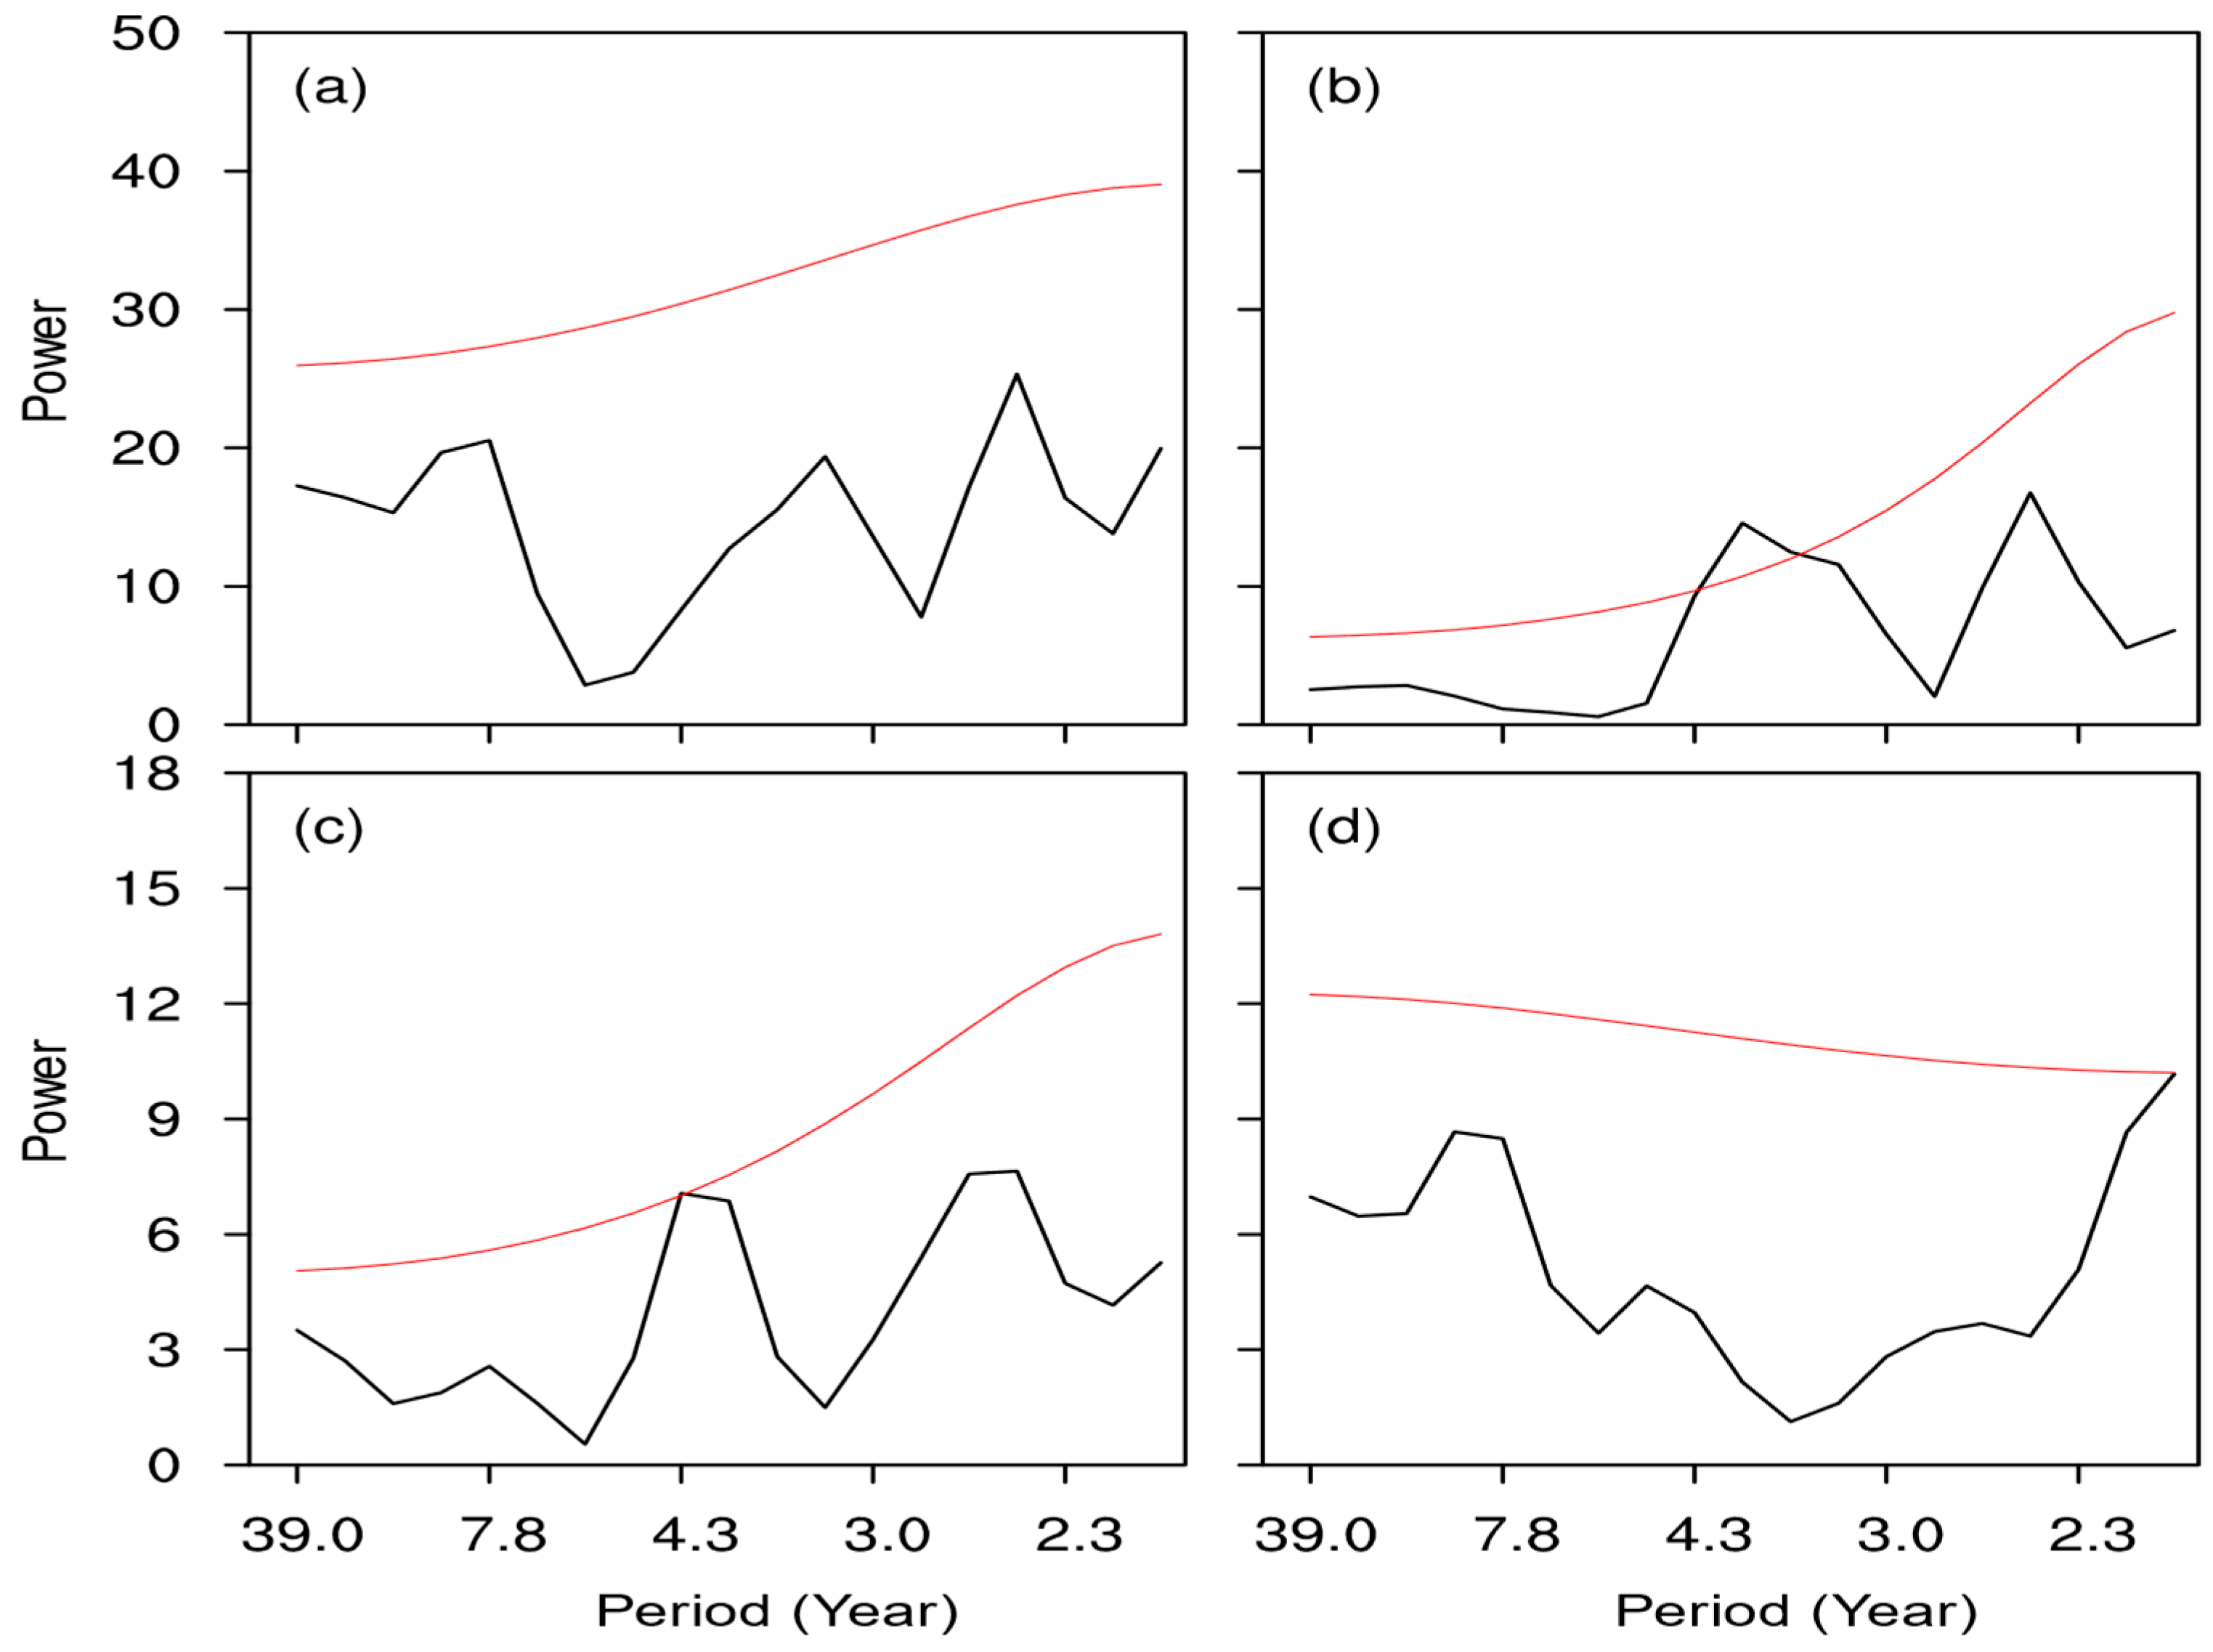
3. Characteristics of Spring YBE Cyclones
4. Possible Mechanisms for the Interannual Variability of Rapidly and Slowly Developing Cyclone Numbers
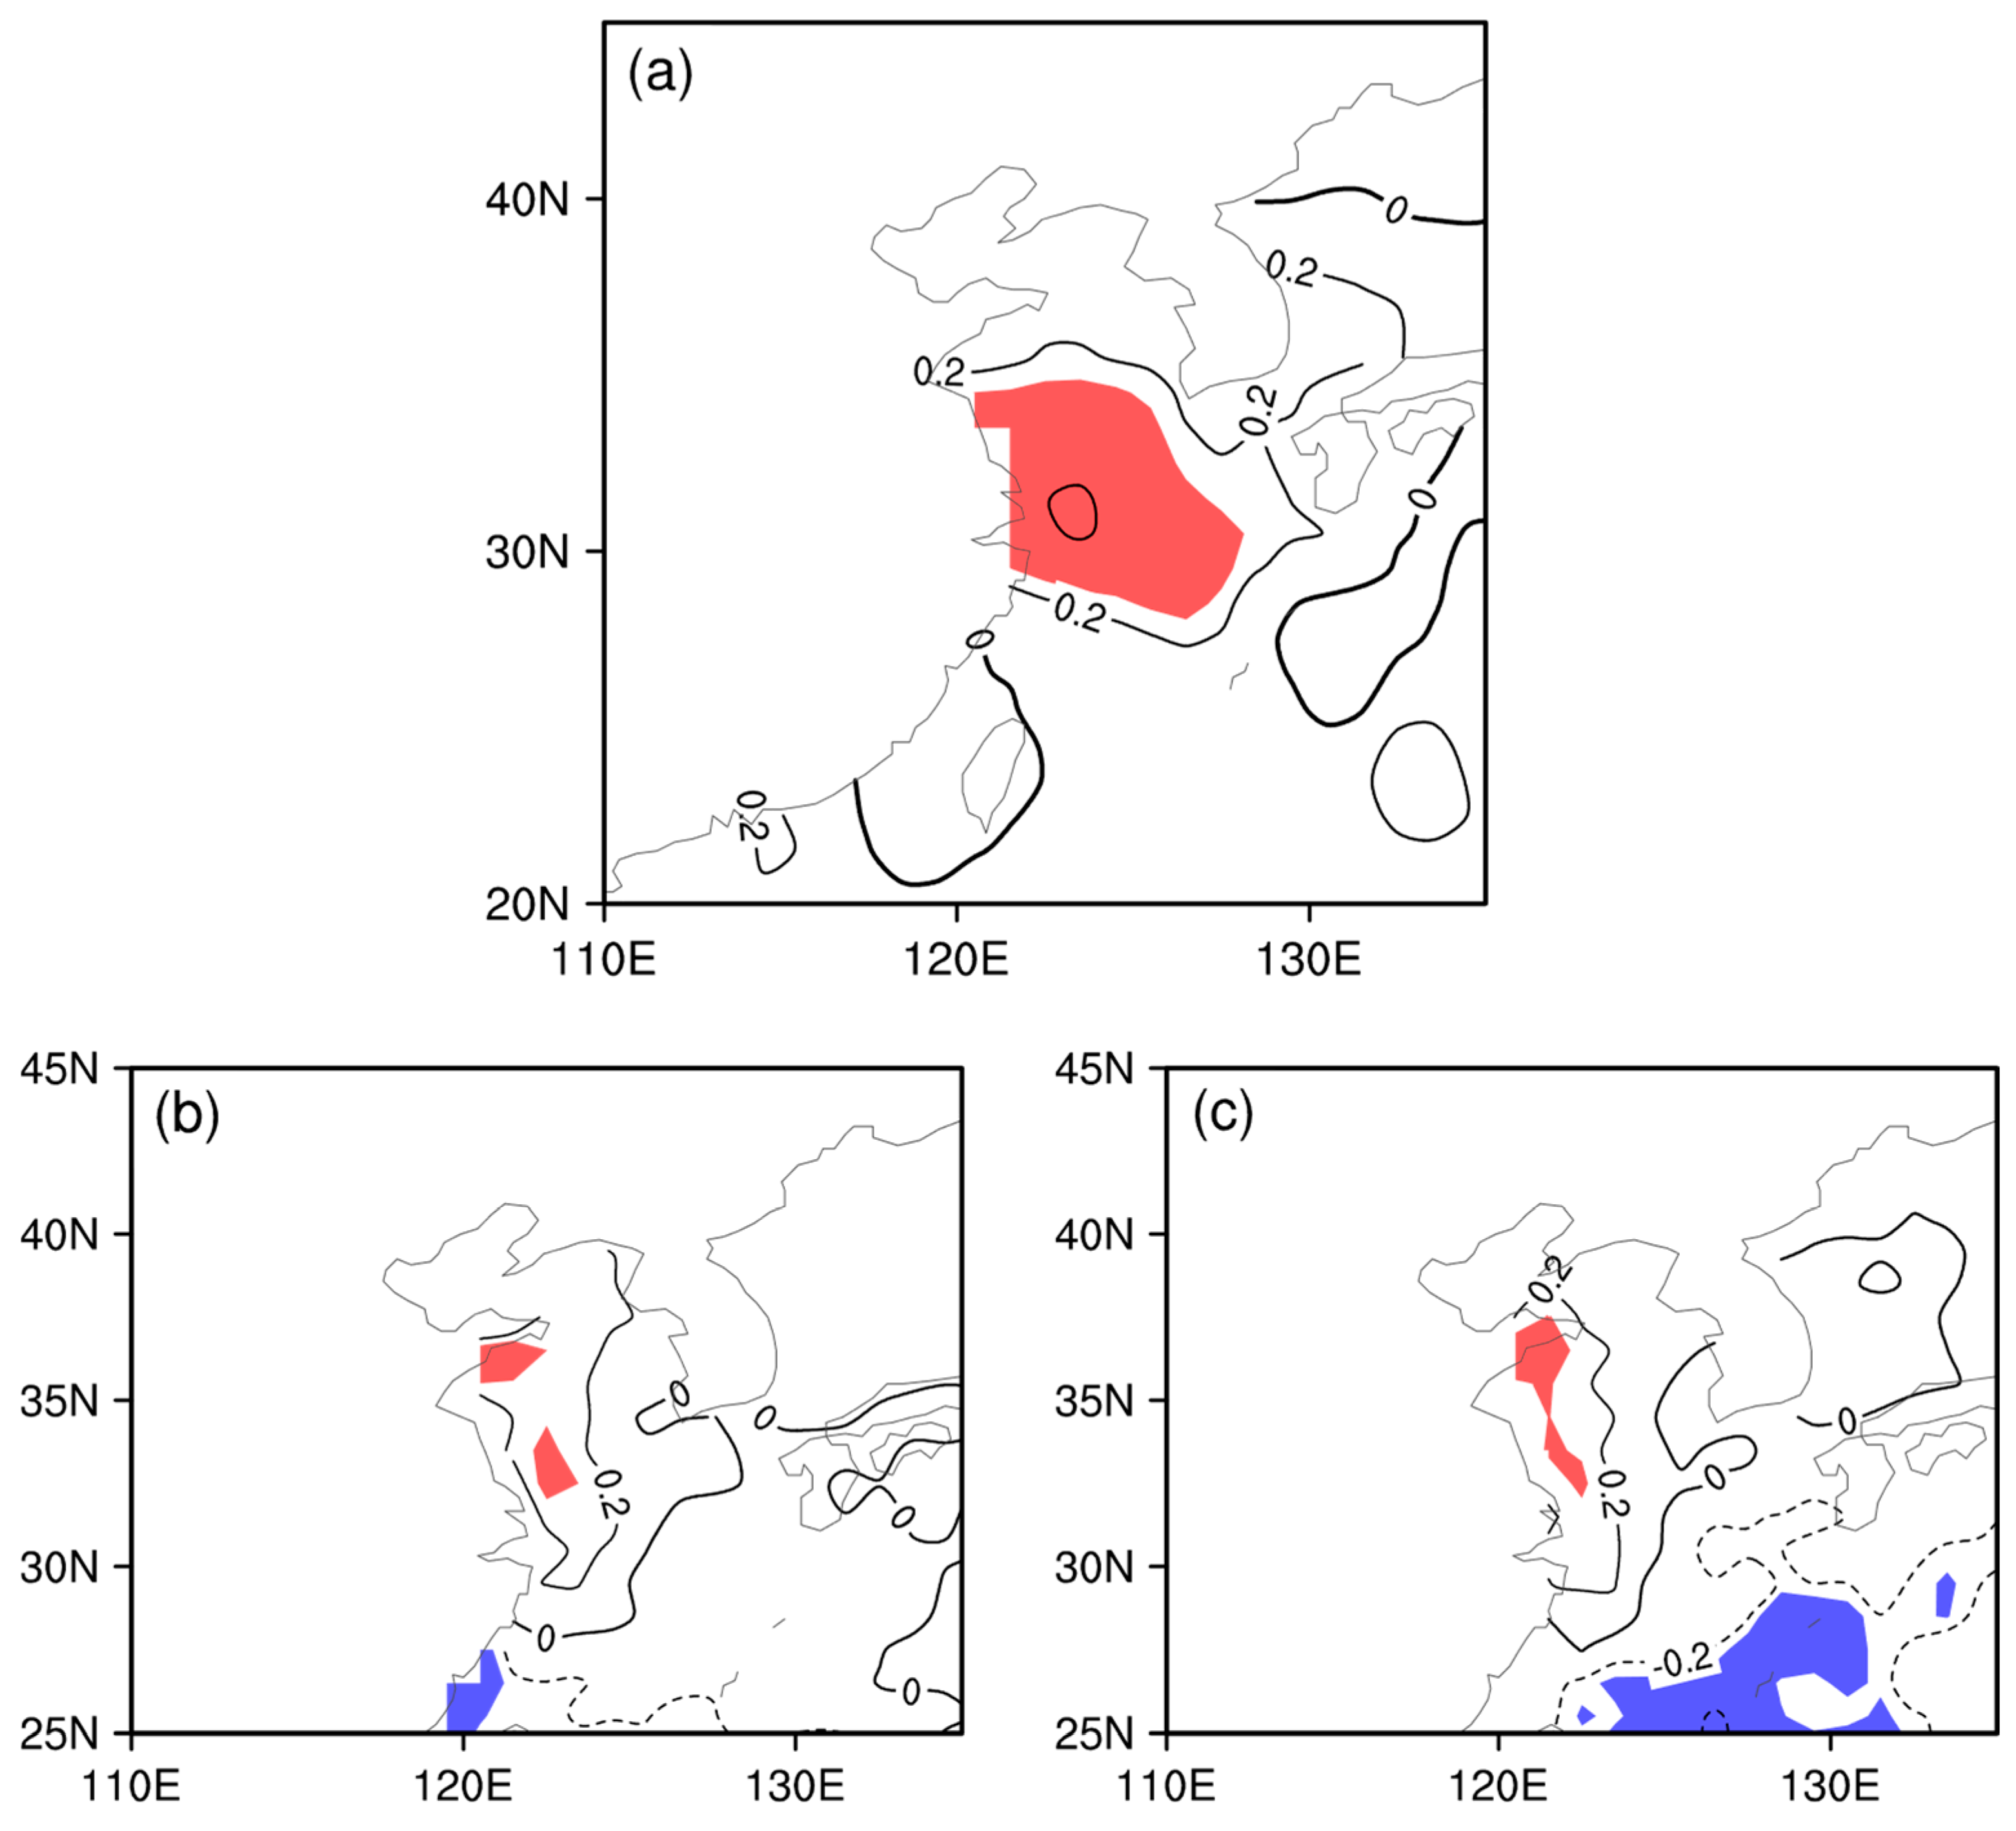
4.1. Rapidly Developing Cyclones
4.2. Slowly Developing Cyclones
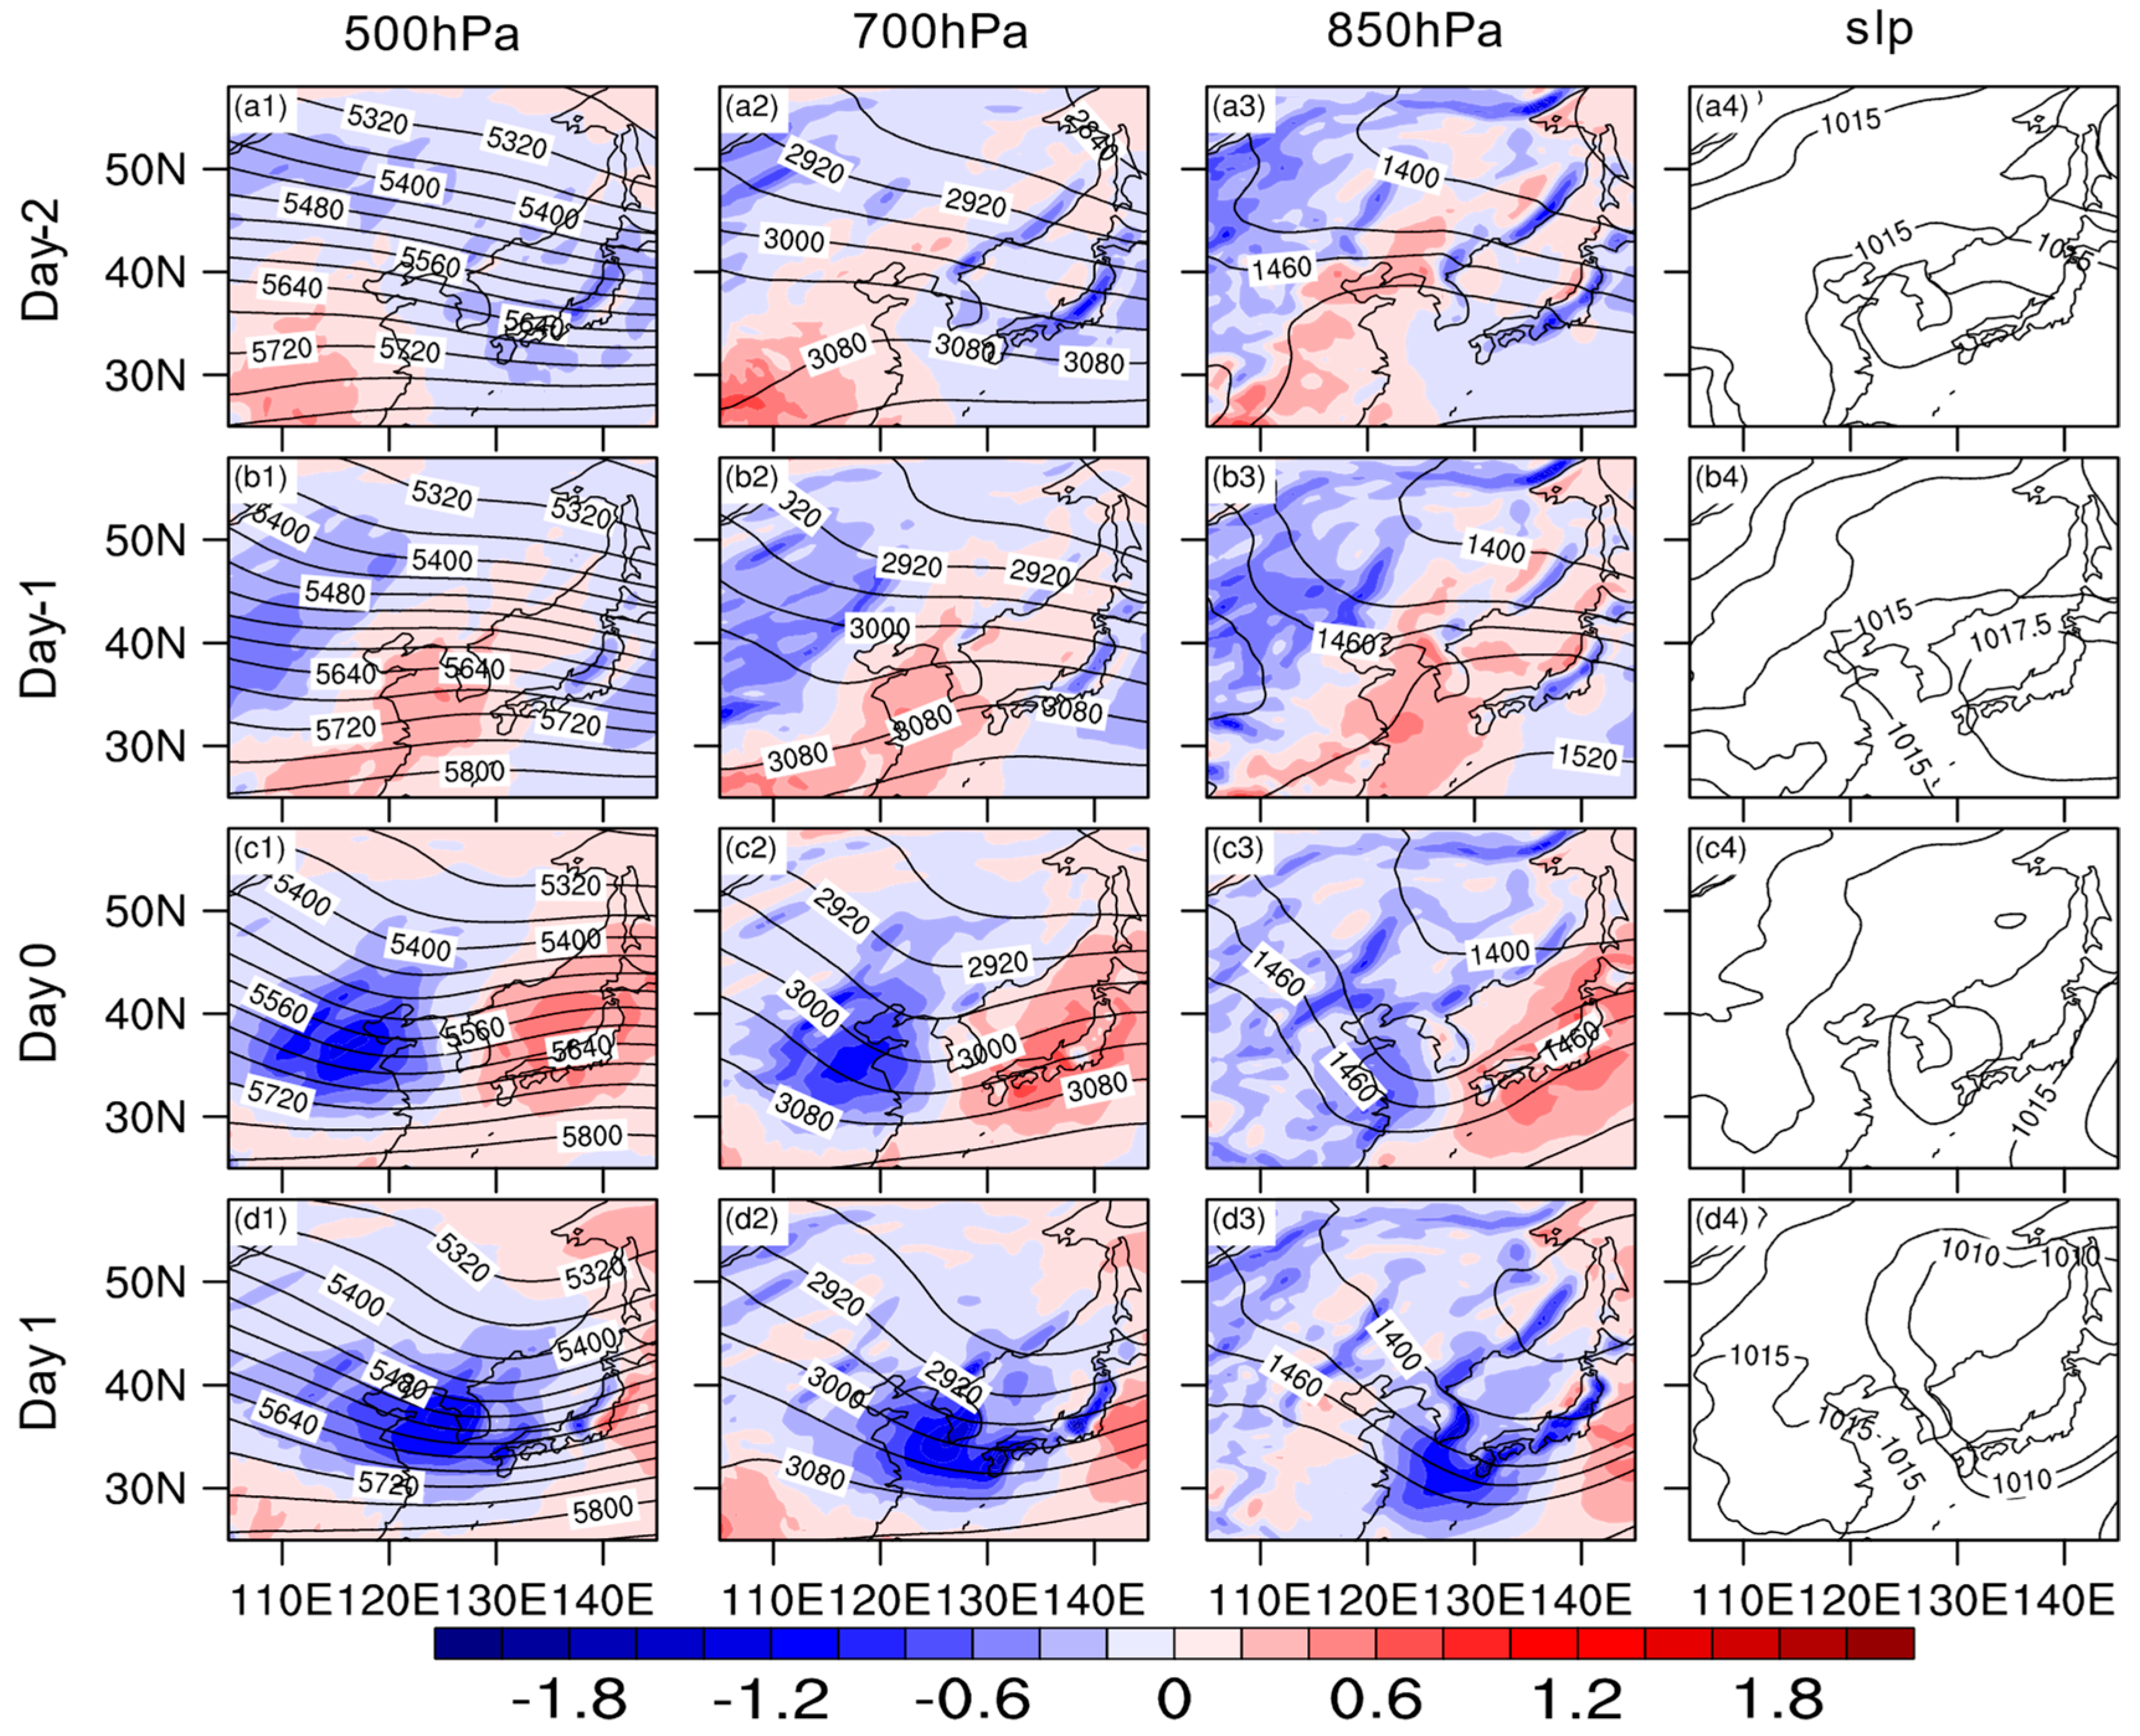
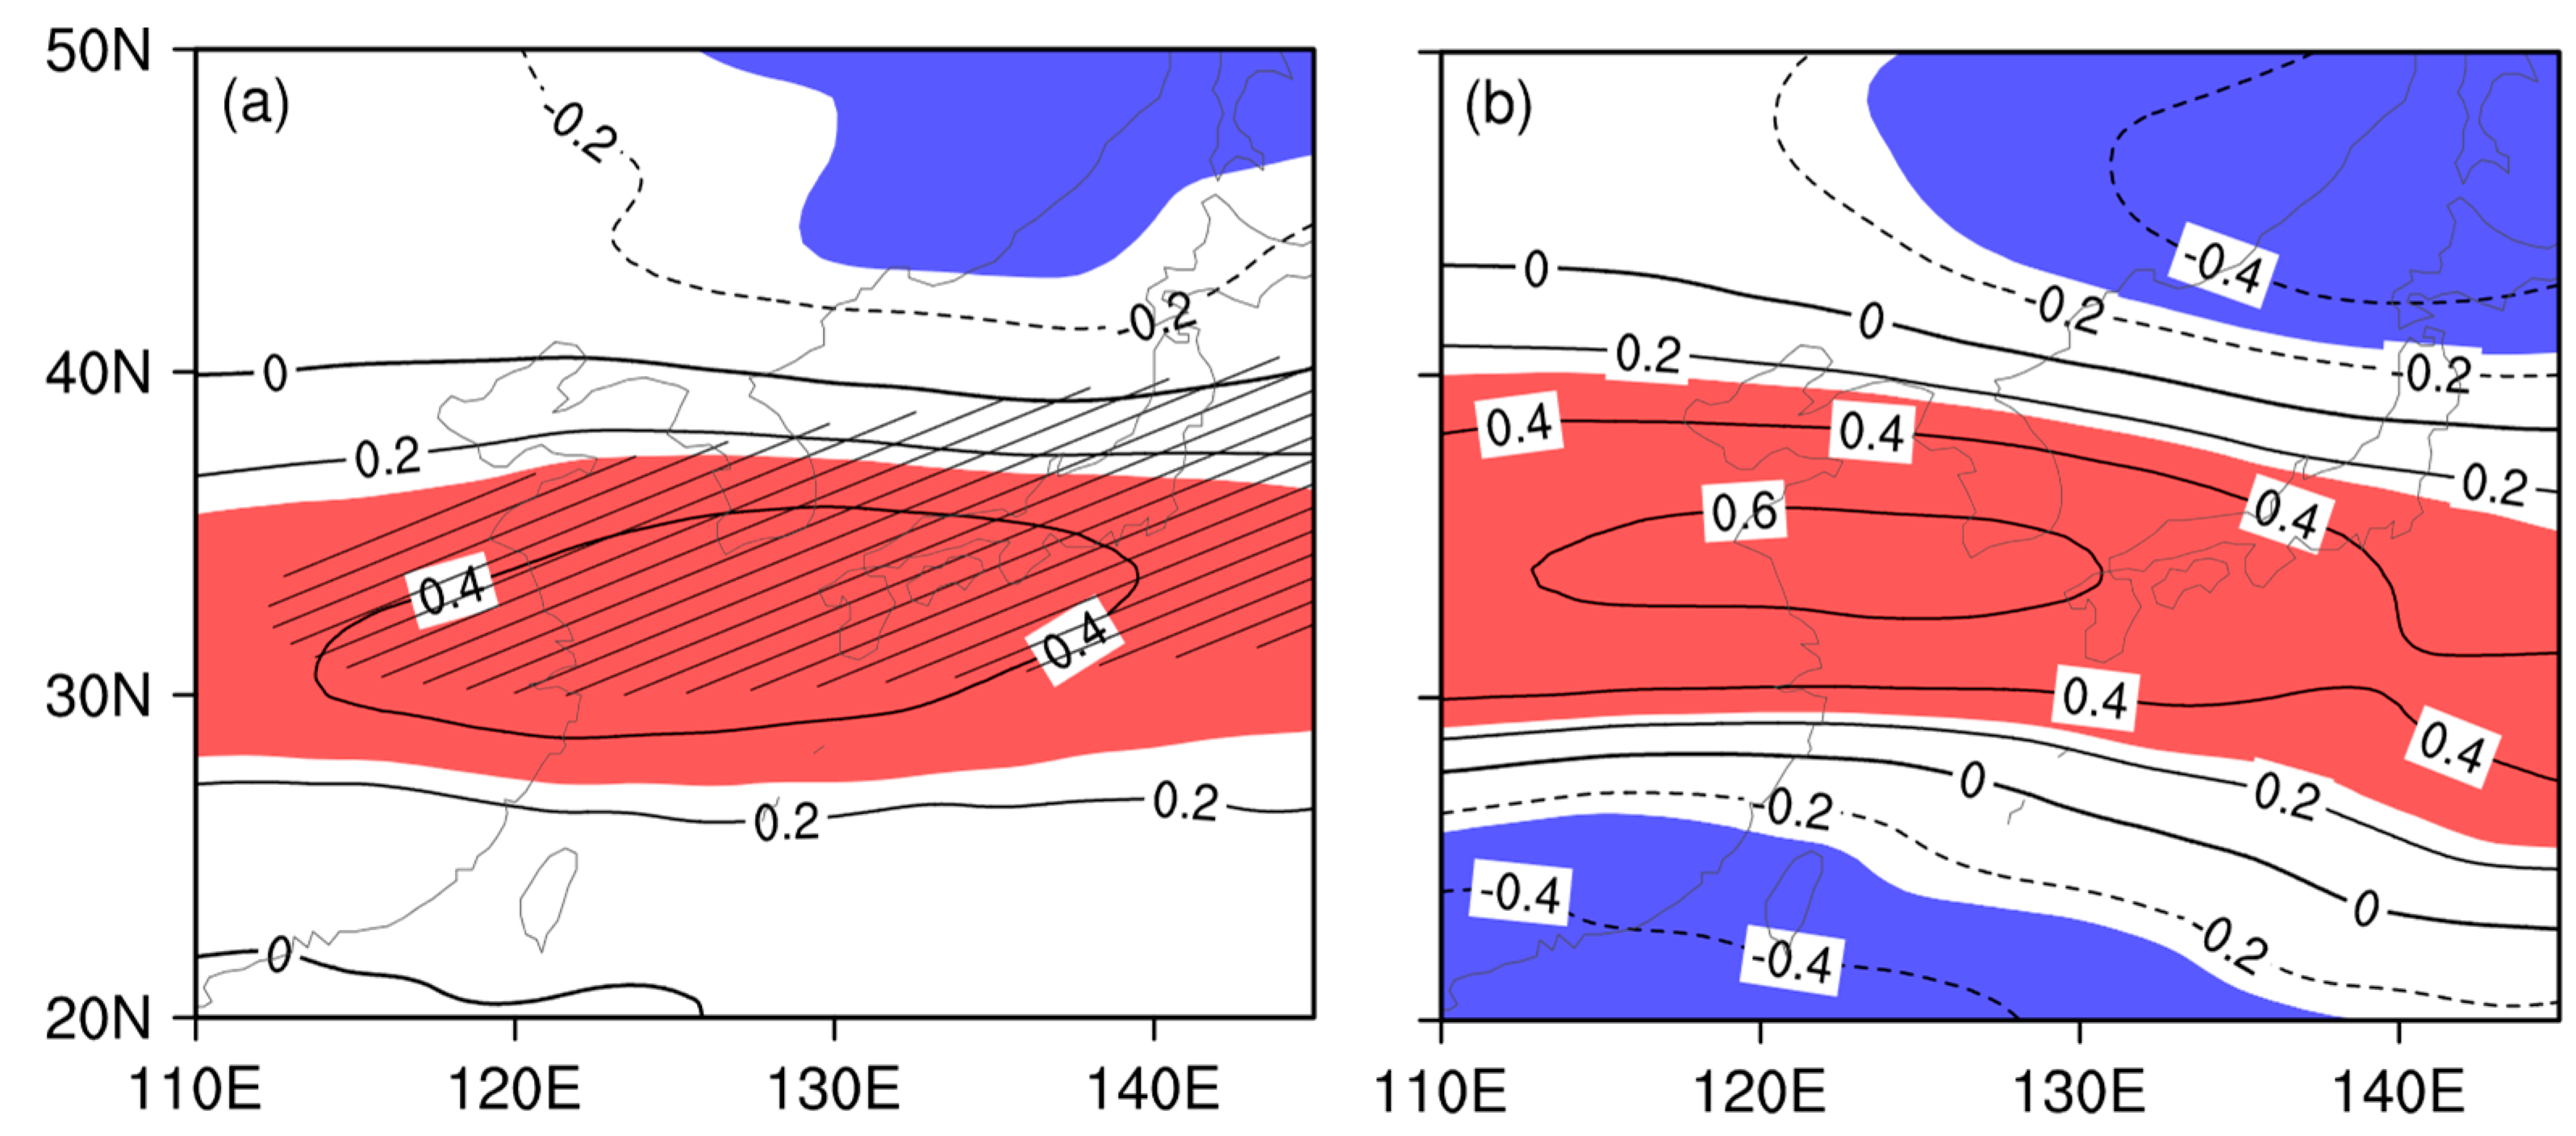
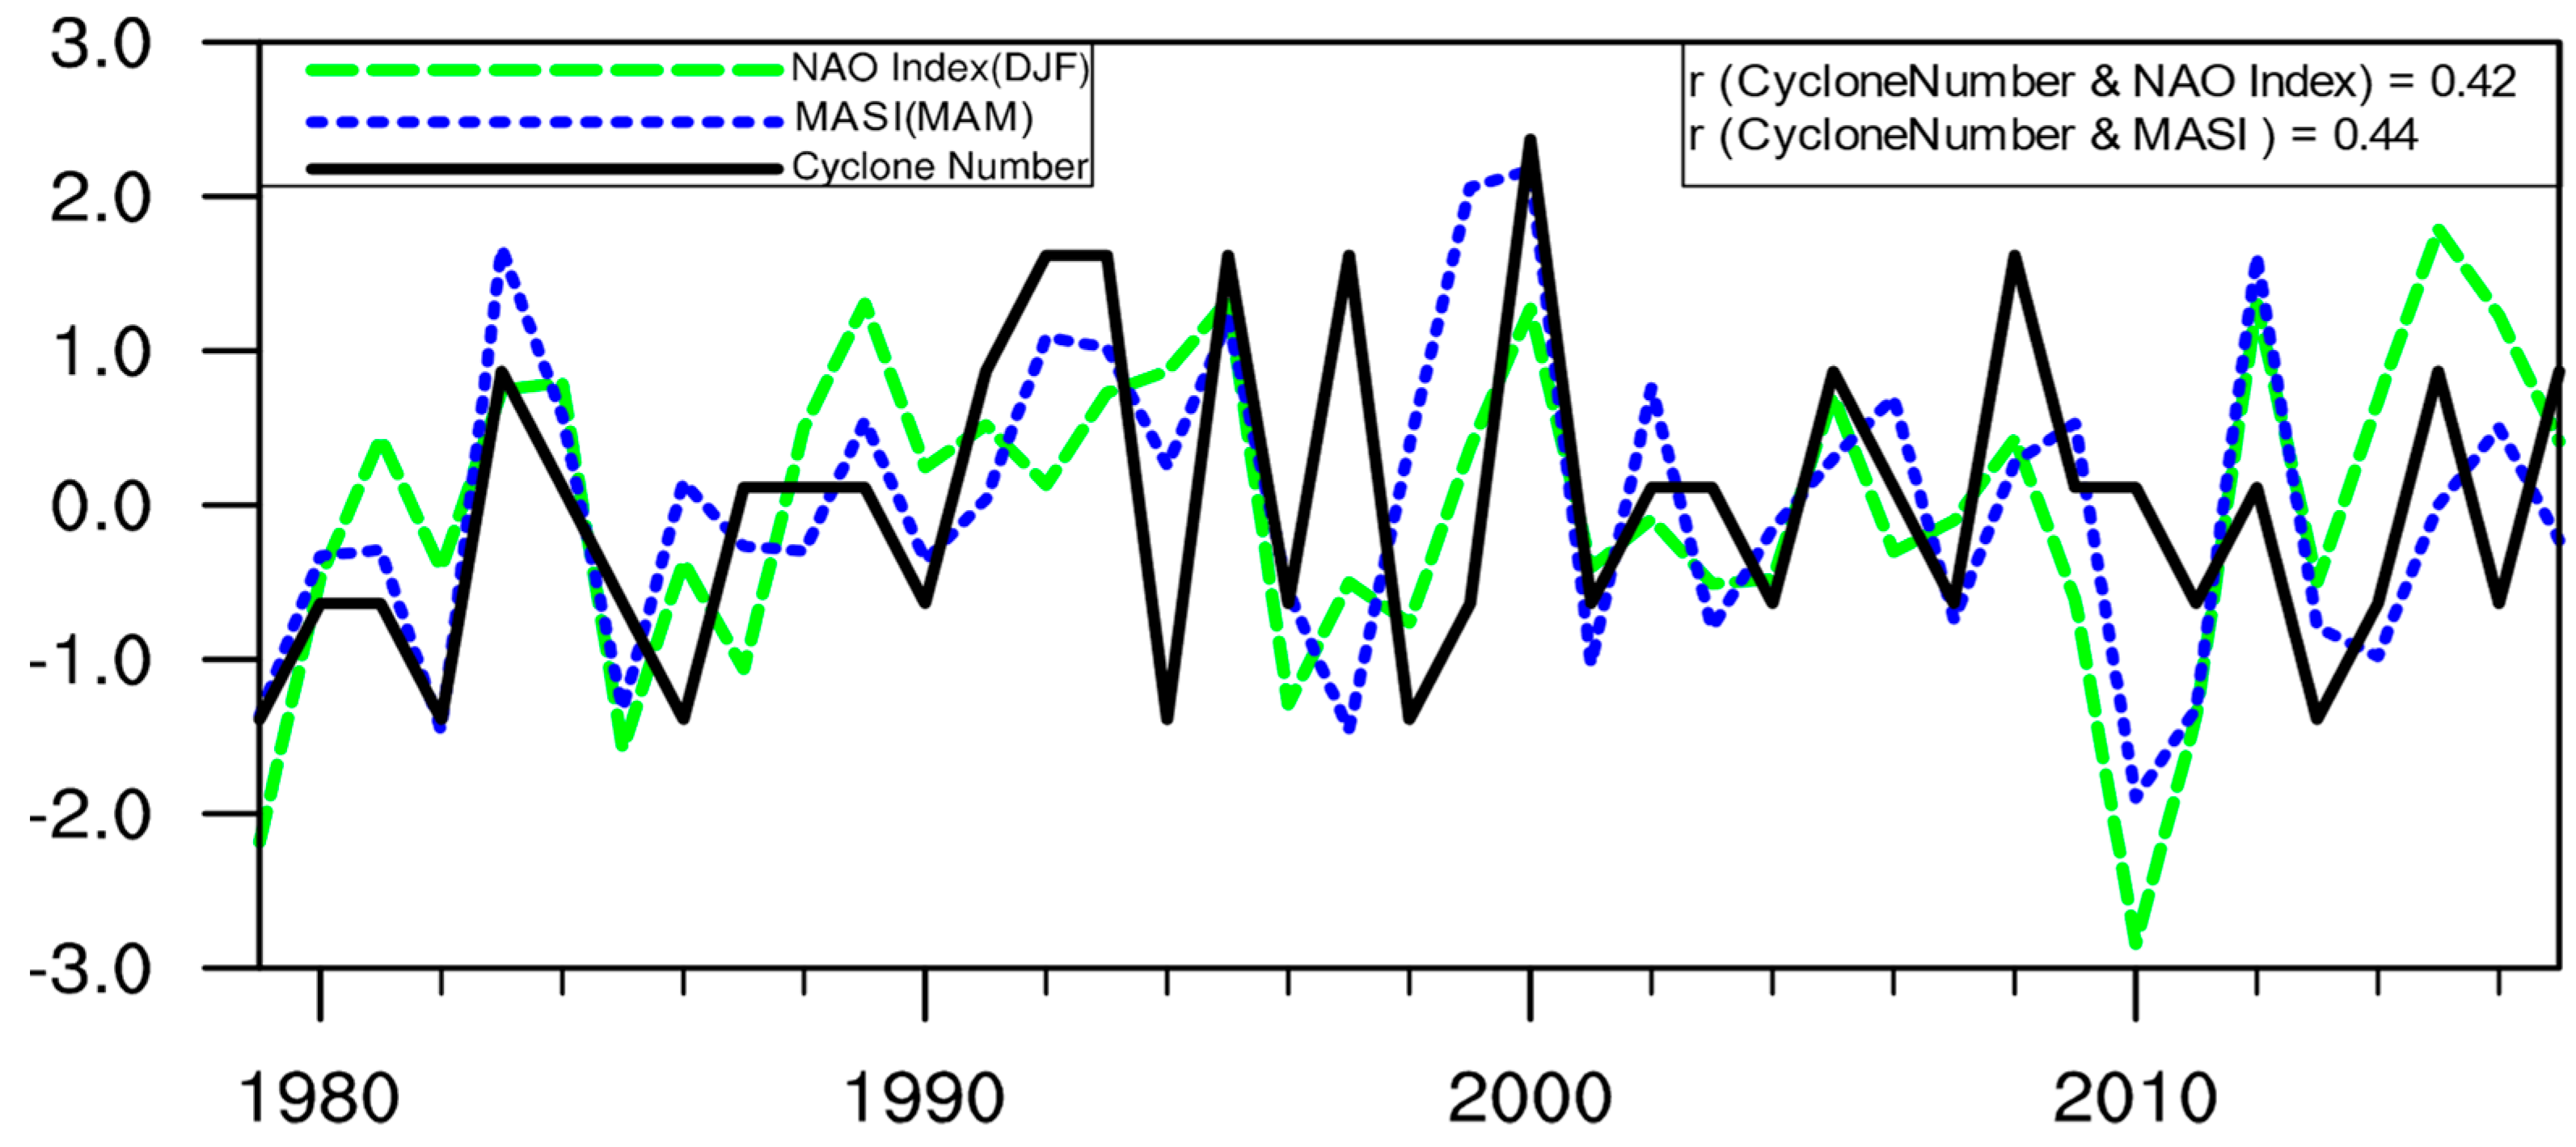
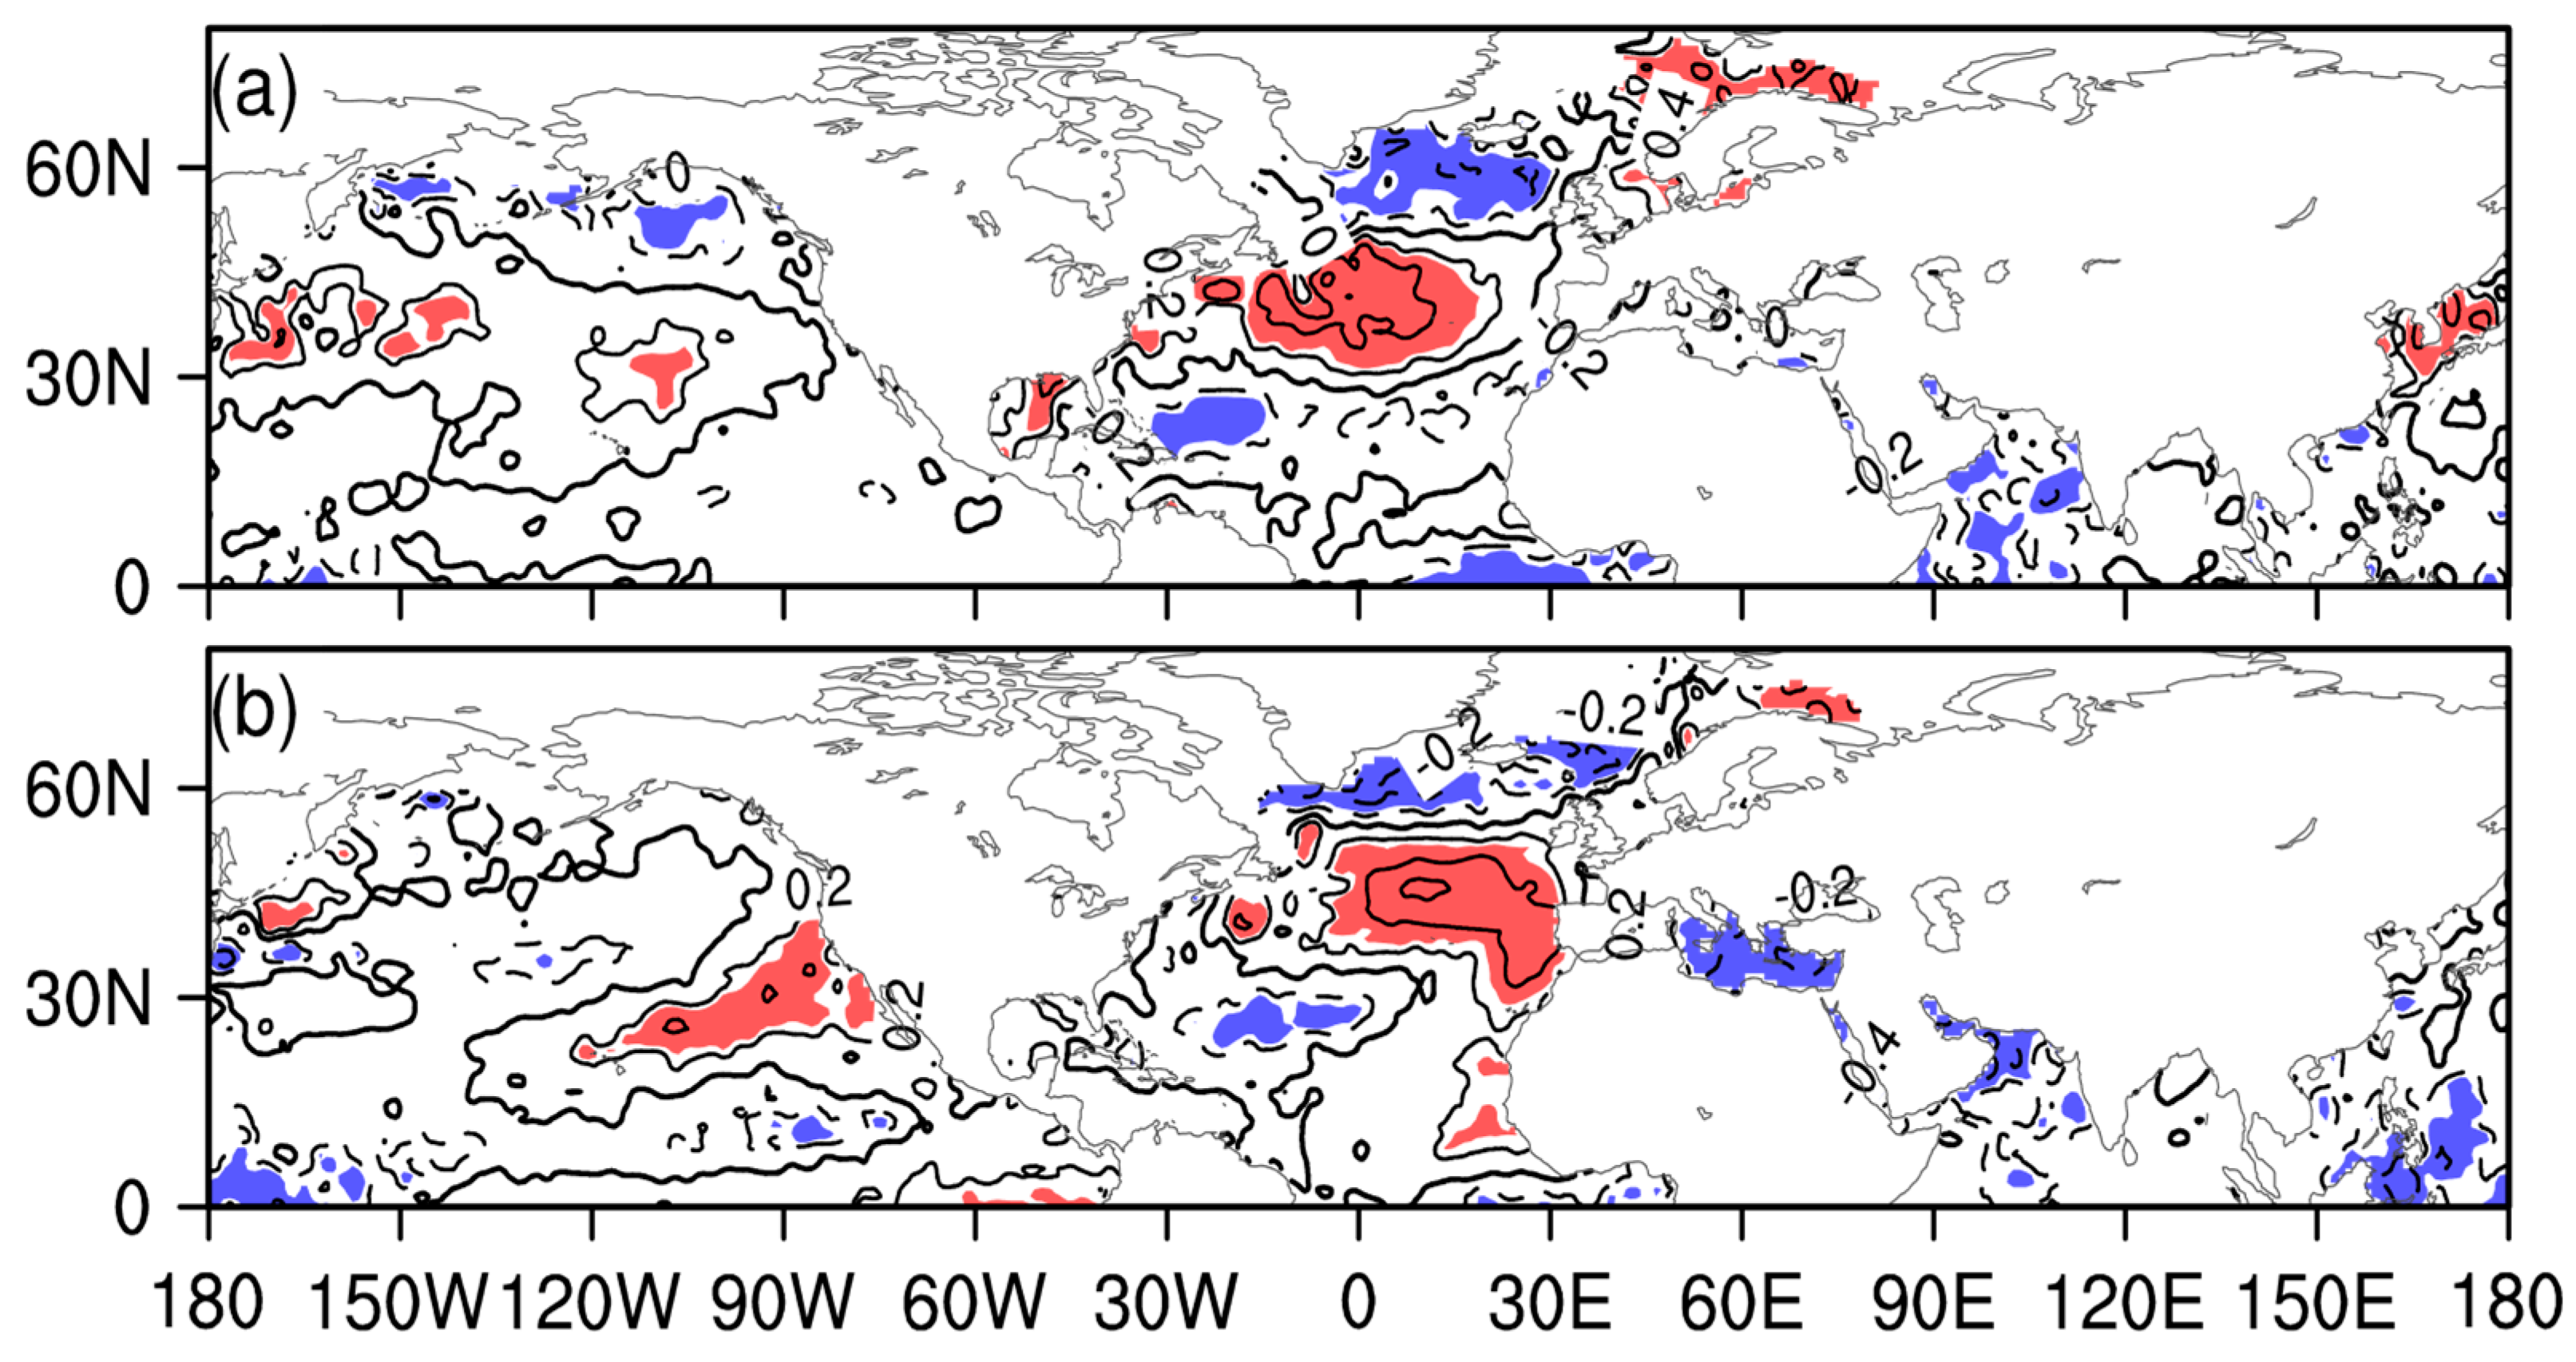
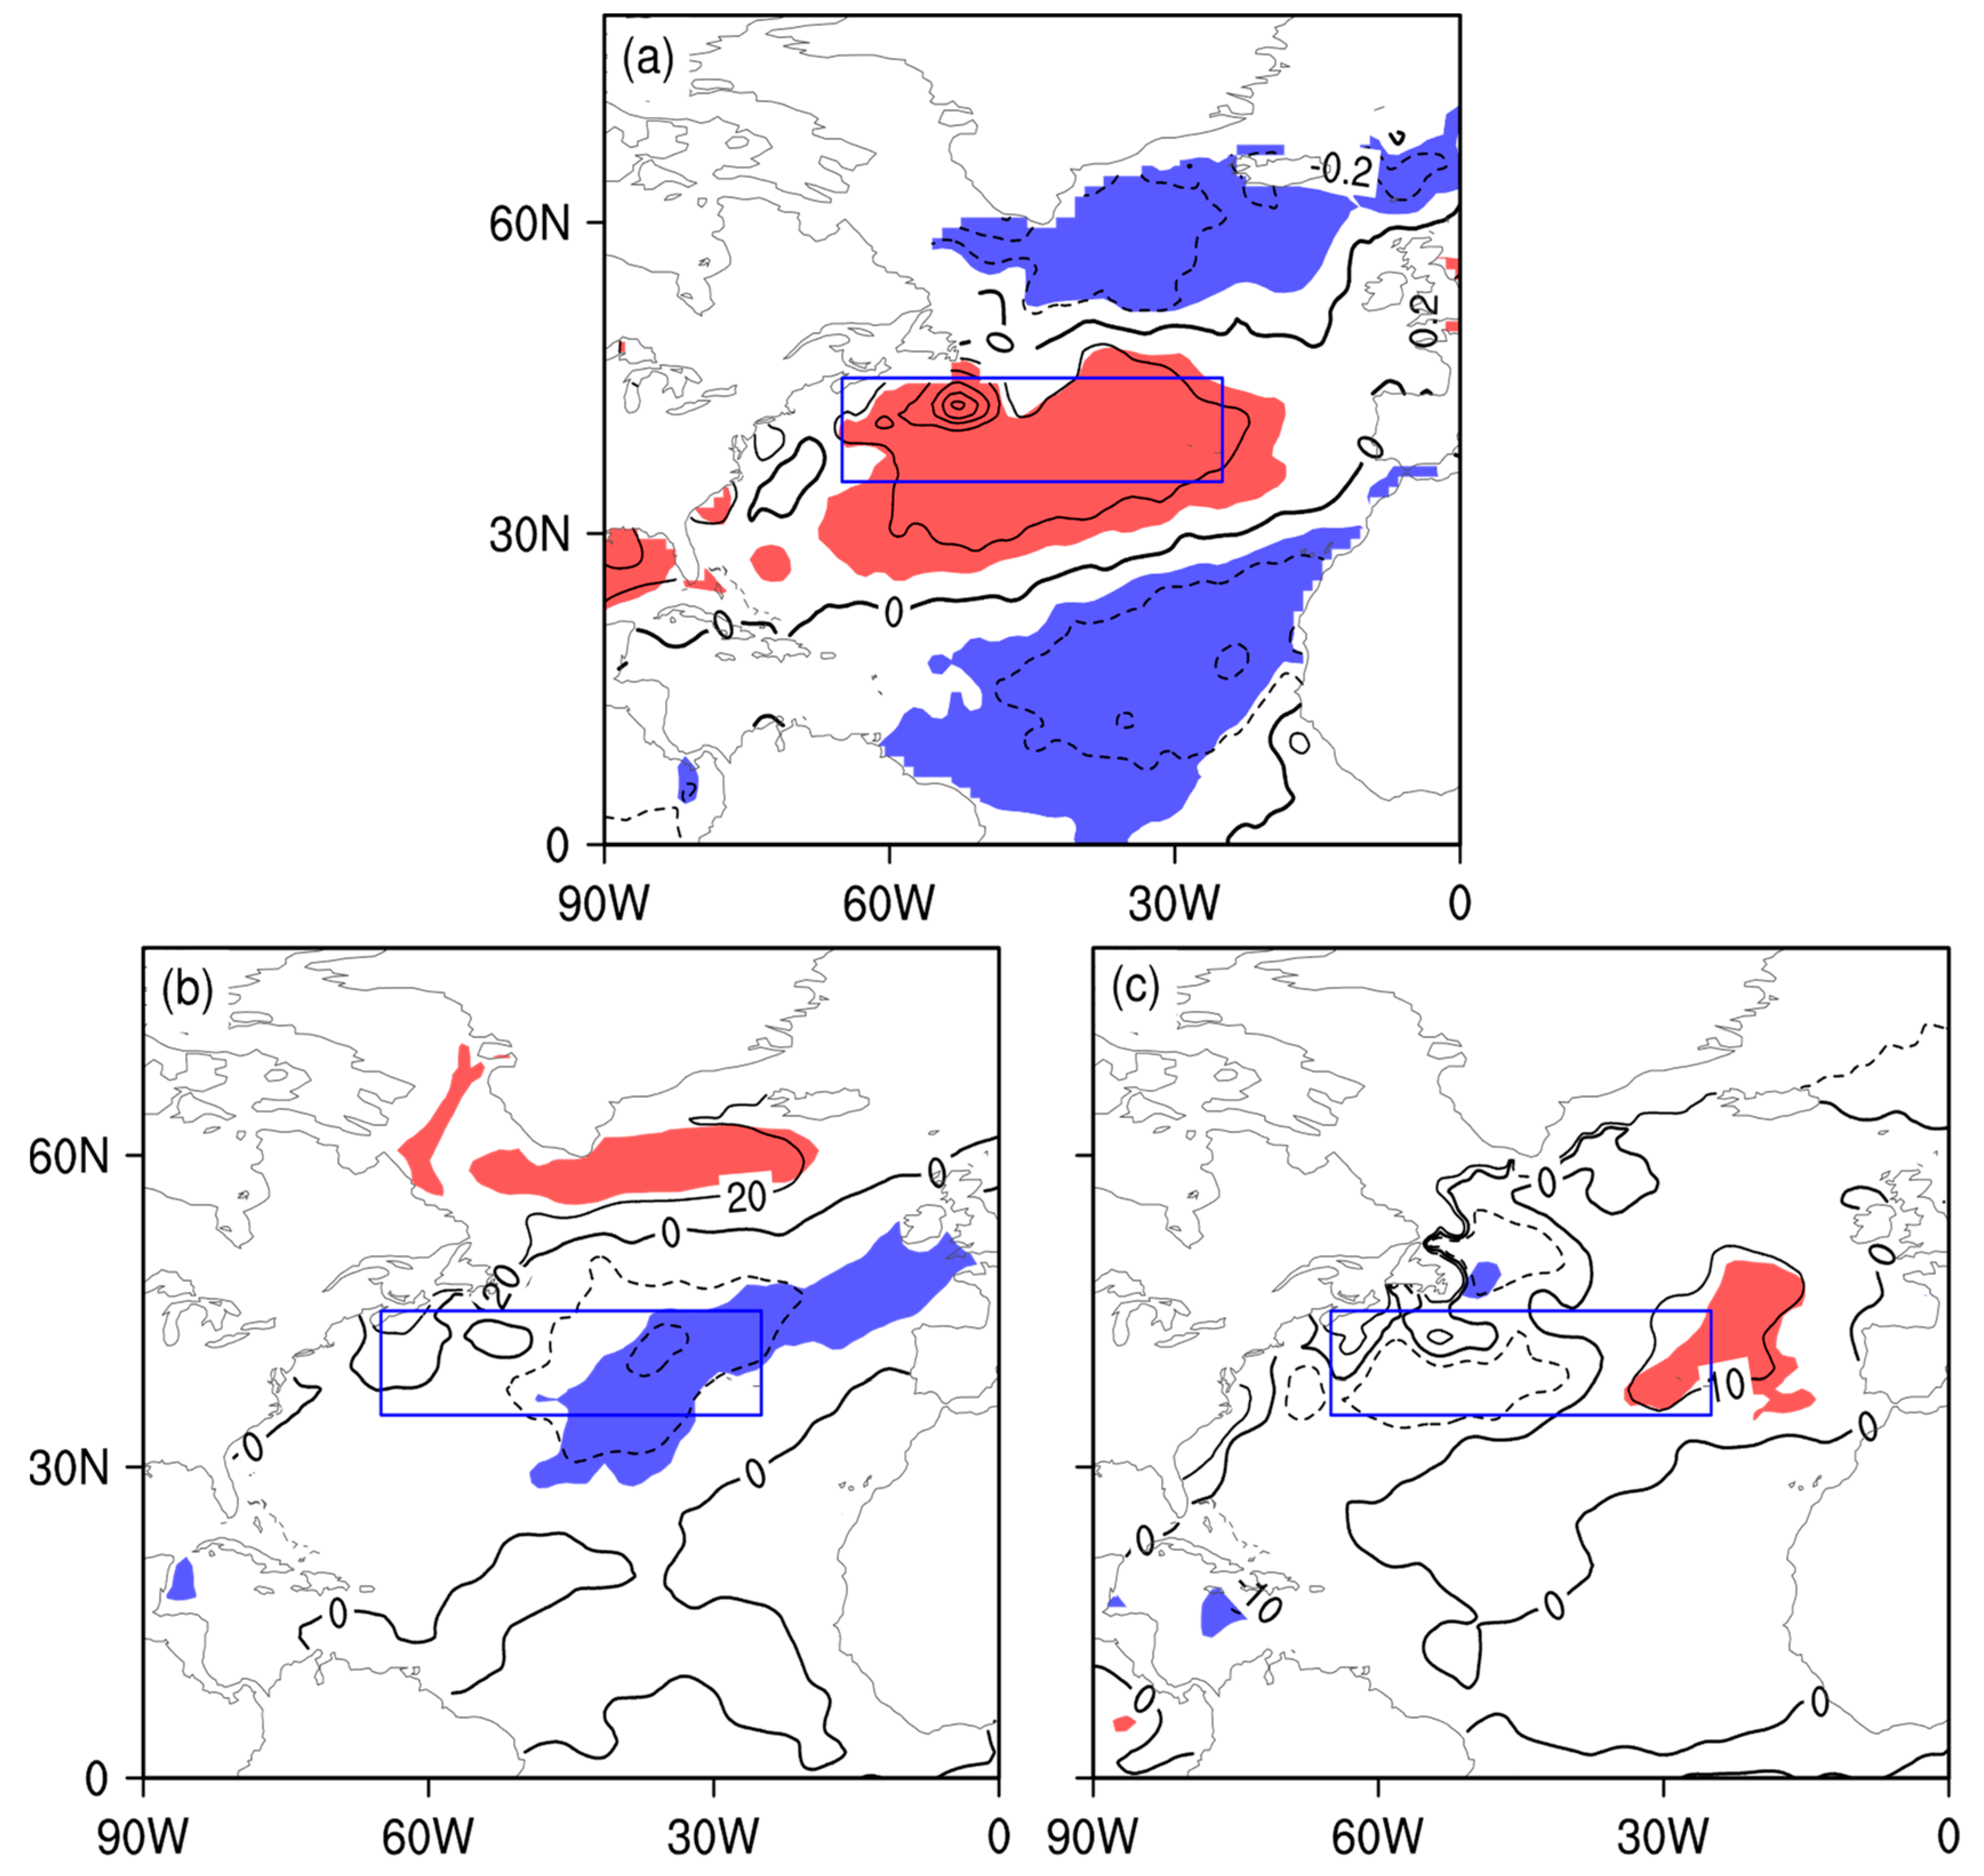
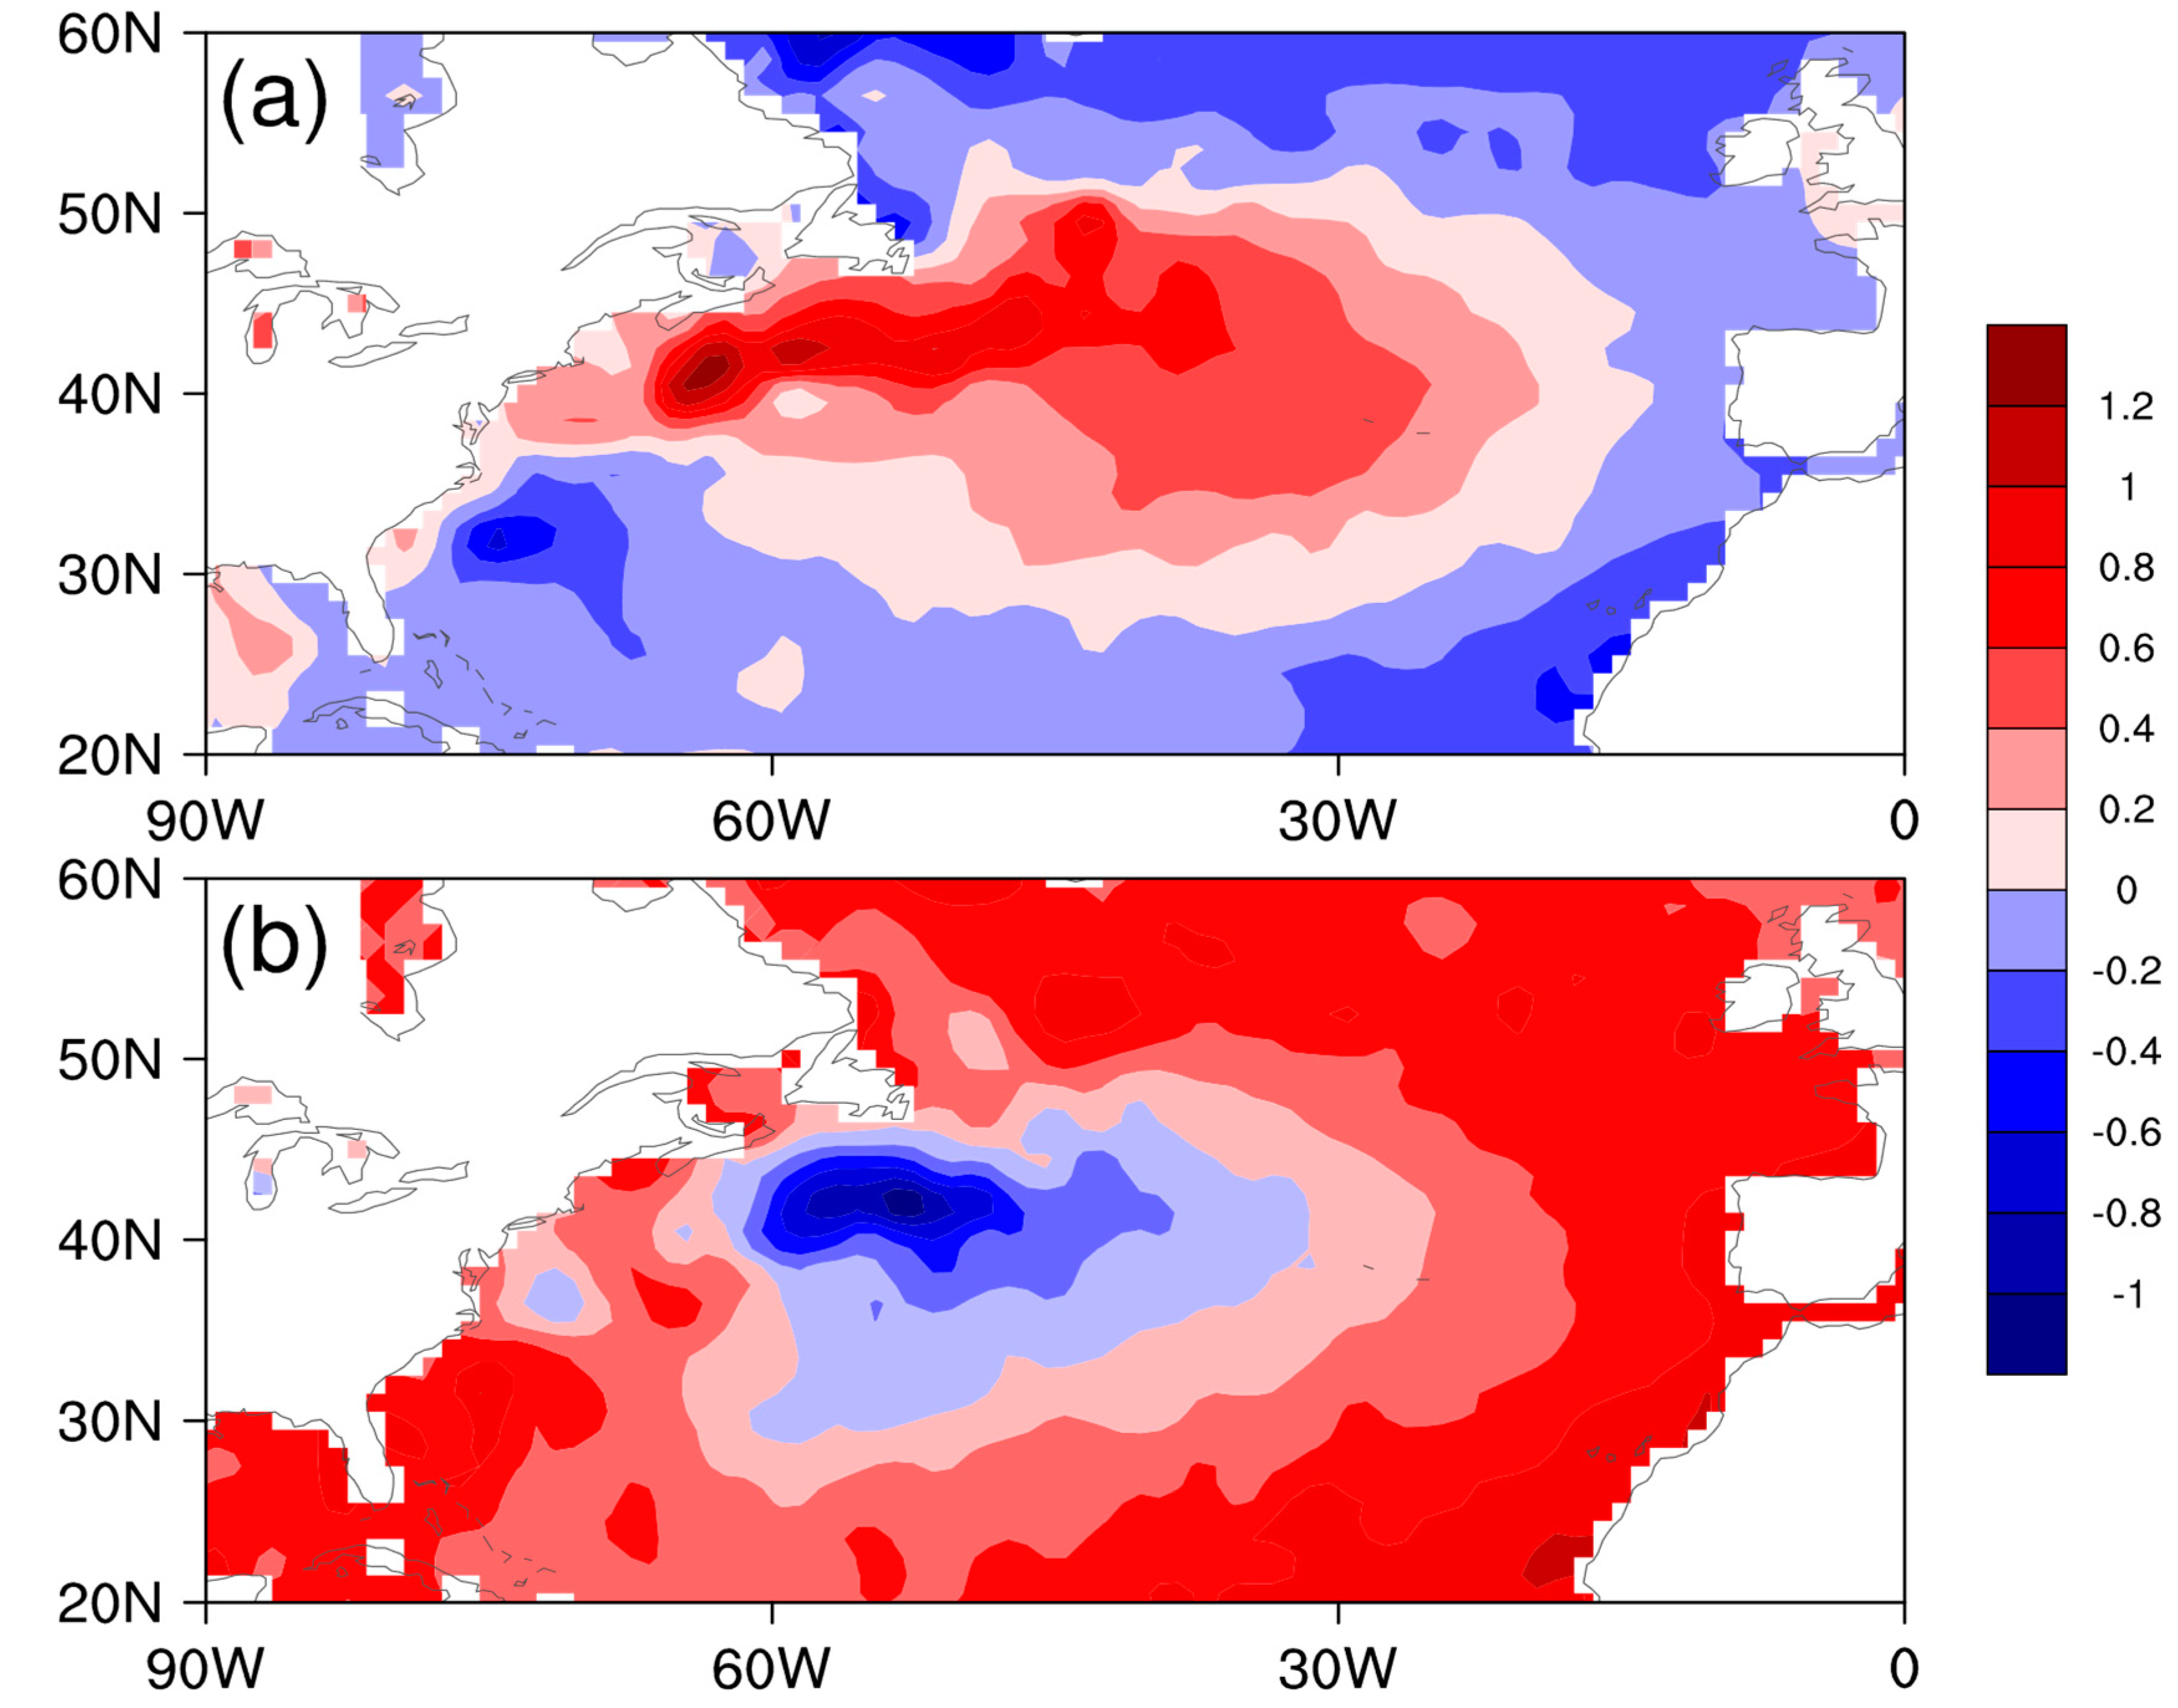
4.2.1. Observational Results
4.2.2. Model Results
5. Summary
Author Contributions
Funding
Conflicts of Interest
References
- Zhang, Y.C.; Rossow, W.B. Estimating meridional energy transports by the atmospheric and oceanic general circulations using boundary fluxes. J. Clim. 1997, 10, 2358–2373. [Google Scholar] [CrossRef]
- Gulev, S.K.; Zolina, O.; Grigoriev, S. Extratropical cyclone variability in the Northern Hemisphere winter from the NCEP/NCAR reanalysis data. Clim. Dyn. 2001, 17, 795–809. [Google Scholar] [CrossRef]
- Geng, Q.; Sugi, M. Variability of the North Atlantic Cyclone Activity in Winter Analyzed from NCEP–NCAR Reanalysis Data. J. Clim. 2001, 14, 3863–3873. [Google Scholar] [CrossRef]
- Zhang, Y.X.; Ding, Y.H.; Li, Q.P. Interdecadal Variations of Extratropical Cyclone Activities and Storm Tracks in the Northern Hemisphere. Chin. J. Atmos. Sci. 2012, 36, 912–928. [Google Scholar] [CrossRef]
- Zhang, Y.; Wang, W. Model-Simulated Northern Winter Cyclone and Anticyclone Activity under a Greenhouse Warming Scenario. J. Clim. 1997, 10, 1616–1634. [Google Scholar] [CrossRef]
- Wang, X.L.; Feng, Y.; Chan, R.; Isaac, V. Inter-comparison of extra-tropical cyclone activity in nine reanalysis datasets. Atmos. Res. 2016, 181, 133–153. [Google Scholar] [CrossRef]
- Wang, X.L.; Feng, Y.; Compo, G.P.; Swail, V.R.; Zwiers, F.W.; Allan, R.J.; Sardeshmukh, P.D. Trends and low frequency variability of extra-tropical cyclone activity in the ensemble of twentieth century reanalysis. Clim. Dyn. 2013, 40, 2775–2800. [Google Scholar] [CrossRef]
- McDonald, R.E. Understanding the impact of climate change on Northern Hemisphere extra-tropical cyclones. Clim. Dyn. 2011, 37, 1399–1425. [Google Scholar] [CrossRef]
- Mizuta, R.; Matsueda, M.; Endo, H.; Yukimot, S. Future change in extratropical cyclones associated with change in the upper troposphere. J. Clim. 2011, 24, 6456–6470. [Google Scholar] [CrossRef]
- Eichler, T.P.; Gaggini, N.; Pan, Z. Impacts of global warming on Northern Hemisphere winter storm tracks in the CMIP5 model suite. J. Geophys. Res. 2013, 118, 3919–3932. [Google Scholar] [CrossRef]
- Catto, J.L.; Shaffrey, L.C.; Hodges, K.I. Northern Hemisphere extratropical cyclones in a warming climate in the HiGEM high-resolution climate model. J. Clim. 2011, 24, 5336–5352. [Google Scholar] [CrossRef]
- Wang, X.L.; Swail, V.R.; Zwiers, F.W. Climatology and Changes of Extratropical Cyclone Activity: Comparison of ERA-40 with NCEP–NCAR Reanalysis for 1958–2001. J. Clim. 2006, 19, 3145–3166. [Google Scholar] [CrossRef]
- Chang, E.K. Projected Significant Increase in the Number of Extreme Extratropical Cyclones in the Southern Hemisphere. J. Clim. 2017, 30, 4915–4935. [Google Scholar] [CrossRef]
- Bengtsson, L.; Hodges, K.I.; Keenlyside, N. Will Extratropical Storms Intensify in a Warmer Climate? J. Clim. 2009, 22, 2276–2301. [Google Scholar] [CrossRef]
- Chen, S.J.; Kuo, Y.H.; Zhang, P.Z.; Bai, Q.F. Climatology of explosive cyclones off the east Asian coast. Mon. Weather Rev. 1992, 120, 3029–3035. [Google Scholar] [CrossRef]
- Qin, T.; Wei, L.X. The statistic and variance of cyclones entering coastal waters of China in 1979-2012. Chin. Acta Oceanol. Sin. 2015, 37, 43–52. [Google Scholar] [CrossRef]
- Yi, Q.J.; Ding, Y.H. Climatology of the Explosive Cyclogenesis over East Asia and the West Pacific. Chin. J. Atmos. Sci. 1993, 17, 302–309. [Google Scholar] [CrossRef]
- Yoshida, A.; Asuma, Y. Structures and environment of explosively developing extratropical cyclones in the northwestern Pacific region. Mon. Weather Rev. 2004, 132, 1121–1142. [Google Scholar] [CrossRef]
- Qin, Z.H.; Yong, L.I.; Huang, L.W. Climatology of the extratropical cyclones over the East China Sea and the West Pacific. Chin. Acta Oceanol. Sin. 2002, 24, 105–111, (In Chinese with English Abstract). [Google Scholar]
- Sinclair, M.R. Objective Identification of Cyclones and Their Circulation Intensity, and Climatology. Weather Forecast. 1997, 12, 595–612. [Google Scholar] [CrossRef]
- Li, C.Q.; Ding, Y.H. A diagnostic study of an explosively deepening oceanic cyclone over the northwest pacific. Chin. Acta Meteorol. Sin. 1989, 42, 180–190. [Google Scholar] [CrossRef]
- Reader, M.C.; Moore, G.K. Stratosphere-troposphere interactions associated with a case of explosive cyclogenesis in the Labrador Sea. Tellus A 1995, 47, 849–863. [Google Scholar] [CrossRef]
- Huang, L.W.; Yi, Q.J.; Qin, Z.H.; Yu, R.C. Dynamics/therm dynamics diagnosis of explosive development of extratropical cyclones over the northwestern Pacific Ocean. Chin. Acta Meteorol. Sin. 1999, 5, 581–593. [Google Scholar] [CrossRef]
- Zehnder, J.A.; Keyser, D. The influence of interior gradients of potential vorticity on rapid cyclogenesis. Tellus A 1991, 43, 198–212. [Google Scholar] [CrossRef]
- Ding, Z.Y.; Wang, J.S. Research on composite diagnosis and mechanisms of explosive cyclones. Chin. J. Appl. Meteorol. Sci. 2001, 12, 30–40, (In Chinese with English Abstract). [Google Scholar]
- Rogers, E.; Bosart, L.F. An Investigation of Explosively Deepening Oceanic Cyclones. Mon. Weather Rev. 1986, 114, 702–718. [Google Scholar] [CrossRef]
- Rivière, G.; Arbogast, P.; Maynard, K.; Joly, A. The essential ingredients leading to the explosive growth stage of the European wind storm Lothar of Christmas 1999. Q. J. R. Meteorol. Soc. 2010, 136, 638–652. [Google Scholar] [CrossRef]
- Sanders, F.; Gyakum, J.R. Synoptic-Dynamic Climatology of the “Bomb”. Mon. Weather Rev. 1980, 108, 1589–1606. [Google Scholar] [CrossRef]
- Dee, D.P.; Uppala, S.M.; Simmons, A.J.; Berrisford, P.; Poli, P.; Kobayashi, S.; Andrae, U.; Balmaseda, M.A.; Balsamo, G.; Bauer, P.; et al. The ERA-Interim reanalysis: Configuration and performance of the data assimilation system. Q. J. R. Meteorol. Soc. 2011, 137, 553–597. [Google Scholar] [CrossRef]
- Rayner, N.A.; Parker, D.E.; Horton, E.B.; Folland, C.K.; Alexander, L.V.; Rowell, D.P.; Kent, E.C.; Kaplan, A. Global analyses of sea surface temperature, sea ice, and night marine air temperature since the late nineteenth century. J. Geophys. Res. 2003, 108, 4407. [Google Scholar] [CrossRef]
- Yu, L.; Jin, X.; Weller, R.A. Multidecade Global Flux Datasets from the Objectively Analyzed Air-Sea Fluxes (OAFlux) Project: Latent and Sensible Heat Fluxes, Ocean Evaporation, and Related Surface Meteorological Variables. Available online: http://oaflux.whoi.edu/pdfs/OAFlux_TechReport_3rd_release.pdf (accessed on 17 January 2019).
- Barnston, A.G.; Livezey, R.E. Classification, Seasonality and Persistence of Low-Frequency Atmospheric Circulation Patterns. Mon. Weather Rev. 1987, 115, 1083–1126. [Google Scholar] [CrossRef]
- Lu, C.H. A modified algorithm for identifying and tracking extratropical cyclones. Adv. Atmos. Sci. 2017, 34, 909–924. [Google Scholar] [CrossRef]
- Qin, Y.J.; Lu, C.H.; Li, L.P. Multi-scale cyclone activity in the Changjiang River-Huaihe River valleys during spring and its relationship with rainfall anomalies. Adv. Atmos. Sci. 2017, 34, 246–257. [Google Scholar] [CrossRef]
- Wernli, H.; Schwierz, C. Surface cyclones in the ERA-40 dataset (1958–2001). Part I: Novel identification method and global climatology. J. Atmos. Sci. 2006, 63, 2486–2507. [Google Scholar] [CrossRef]
- Takaya, K.; Nakamura, H. A formulation of a waveactivity flux for stationary Rossby waves on a zonally varying basic flow. Geophys. Res. Lett. 1997, 24, 2985–2988. [Google Scholar] [CrossRef]
- Takaya, K.; Nakamura, H. A formulation of a phase-independent wave-activity flux for stationary and migratory quasigeostrophic eddies on a zonally varying basic flow. J. Atmos. Sci. 2001, 58, 608–627. [Google Scholar] [CrossRef]
- Hoskins, B.J.; Valdes, P.J. On the Existence of Storm-Tracks. J. Atmos. Sci. 1990, 47, 1854–1864. [Google Scholar] [CrossRef]
- Trenberth, K.E.; Fasullo, J.T.; Kiehl, J. Earth’s Global Energy Budget. Bull. Am. Meteorol. Soc. 2009, 90, 311–324. [Google Scholar] [CrossRef]
- Hsiung, J.; Newell, R.E.; Houghtby, T. The annual cycle of oceanic heat storage and oceanic meridional heat transport. Q. J. R. Meteorol. Soc. 1989, 115, 1–28. [Google Scholar] [CrossRef]
- MartínezAlvarado, O.; Gray, S.L.; Methven, J. Diabatic Processes and the Evolution of Two Contrasting Summer Extratropical Cyclones. Mon. Weather Rev. 2016, 144, 3251–3276. [Google Scholar] [CrossRef]
- Gyakum, J.R.; Danielson, R.E. Analysis of Meteorological Precursors to Ordinary and Explosive Cyclogenesis in the Western North Pacific. Mon. Weather Rev. 2000, 128, 851–863. [Google Scholar] [CrossRef]
- Kuo, Y.; Low-Nam, S. Prediction of Nine Explosive Cyclones over the Western Atlantic Ocean with a Regional Model. Mon. Weather Rev. 1990, 118, 3–25. [Google Scholar] [CrossRef]
- Shapiro, M.A.; Kennedy, P.J. Research Aircraft Measurements of Jet Stream Geostrophic and Ageostrophic Winds. J. Atmos. Sci. 1981, 38, 2642–2652. [Google Scholar] [CrossRef]
- Branstator, G. Circumglobal Teleconnections, the Jet Stream Waveguide, and the North Atlantic Oscillation. J. Clim. 2002, 15, 1893–1910. [Google Scholar] [CrossRef]
- Watanabe, M. Asian Jet Waveguide and a Downstream Extension of the North Atlantic Oscillation. J. Clim. 2004, 17, 4674–4691. [Google Scholar] [CrossRef]
- Hoskins, B.J.; Ambrizzi, T. Rossby Wave Propagation on a Realistic Longitudinally Varying Flow. J. Atmos. Sci. 1993, 50, 1661–1671. [Google Scholar] [CrossRef]
- Serreze, M.C.; Carse, F.; Barry, R.G.; Jeffery, C.R. Icelandic Low Cyclone Activity: Climatological Features, Linkages with the NAO and Relationship with Recent Changes in the Northern Hemisphere Circulation. J. Clim. 1997, 10, 453–464. [Google Scholar] [CrossRef]
- Peng, S.; Robinson, W.; Li, S. North Atlantic SST forcing of the NAO and relationships with intrinsic hemispheric variability. Geophys. Res. Lett. 2002, 29, 117-1–117-4. [Google Scholar] [CrossRef]
- Polonsky, A.; Basharin, D.; Voskresenskaya, E.; Worley, S.; Yurovsky, A. Relationship between North Atlantic Oscillation, Euro-Asian climate anomalies and Pacific variability. Pac. Oceanogr. 2004, 2, 52–67. [Google Scholar]
- Zuo, J.Q.; Li, W.J.; Sun, C.H.; Xu, L.; Ren, H.-L. Impact of the North Atlantic sea surface temperature tripole on the East Asian summer monsoon. Adv. Atmos. Sci. 2013, 30, 1173–1186. [Google Scholar] [CrossRef]
- Wu, Z.W.; Wang, B.; Li, J.P.; Jin, F.F. An empirical seasonal prediction model of the East Asian summer monsoon using ENSO and NAO. J. Geophys. Res. 2009, 114, D18120. [Google Scholar] [CrossRef]
- Lorenz, E.N. A study of the predictability of a 28-variable model. Tellus 1965, 17, 321–333. [Google Scholar] [CrossRef]
- Marshall, J.; Kushnir, Y.; Battisti, D.; Chang, P.; Czaja, A.; Dickson, R.; Hurrell, J.; McCartney, M.; Saravanan, R.; Visbeck, M. North Atlantic climate variability: Phenomena, impacts and mechanisms. Int. J. Climatol. 2001, 21, 1863–1898. [Google Scholar] [CrossRef]
- Cayan, D.R. Latent and Sensible Heat Flux Anomalies over the Northern Oceans: The Connection to Monthly Atmospheric Circulation. J. Clim. 1992, 5, 354–370. [Google Scholar] [CrossRef]
- Hurrell, J.W. Decadal Trends in the North Atlantic Oscillation: Regional Temperatures and Precipitation. Science 1995, 269, 676–679. [Google Scholar] [CrossRef]
- Rodwell, M.J.; Rowell, D.P.; Folland, C.K. Oceanic Forcing of the Wintertime North Atlantic Oscillation and European Climate. Nature 1999, 398, 320–323. [Google Scholar] [CrossRef]
- Trenberth, K.E.; Hurrell, J.W. Decadal atmosphere-ocean variations in the Pacific. Clim. Dyn. 1994, 9, 303–319. [Google Scholar] [CrossRef]
- Hurrell, J.W.; Loon, H.V. Decadal variations in climate associated with the north atlantic oscillation. Clim. Chang. 1997, 36, 301–326. [Google Scholar] [CrossRef]
- Kushnir, Y. Interdecadal Variations in North Atlantic Sea Surface Temperature and Associated Atmospheric Conditions. J. Clim. 1994, 7, 141–157. [Google Scholar] [CrossRef]
- Xu, H.M.; Cui, M.X. Atmospheric-oceanic features associated with large-scale SST anomalies over the North Pacific in winter. Chin. Trans. Atmos. Sci. 2018, 41, 330–343, (In Chinese with English Abstract). [Google Scholar]
- Chen, L.; Tan, B.; Kvamstø, G.N.; Johannessen, O.M. Wintertime cyclone/anticyclone activity over China and its relation to upper tropospheric jets. Tellus A 2014, 66, 21889. [Google Scholar] [CrossRef]


| Positive MASI Years | Negative MASI Years |
|---|---|
| 1983, 1992, 1993, 1995, 1999, 2000, 2012 | 1979, 1982, 1985, 1997, 2001, 2010, 2011 |
| Slowly Developing Cyclone Counts | ||
|---|---|---|
| Year | PSSTA | NSSTA |
| 6 | 4 | 4 |
| 7 | 2 | 1 |
| 8 | 4 | 3 |
| 9 | 2 | 1 |
| 10 | 3 | 2 |
| 11 | 3 | 3 |
| 12 | 2 | 1 |
| 13 | 4 | 1 |
| 14 | 3 | 2 |
| 15 | 3 | 0 |
© 2019 by the authors. Licensee MDPI, Basel, Switzerland. This article is an open access article distributed under the terms and conditions of the Creative Commons Attribution (CC BY) license (http://creativecommons.org/licenses/by/4.0/).
Share and Cite
Zhang, J.; Xu, H.; Ma, J.; Deng, J. Interannual Variability of Spring Extratropical Cyclones over the Yellow, Bohai, and East China Seas and Possible Causes. Atmosphere 2019, 10, 40. https://doi.org/10.3390/atmos10010040
Zhang J, Xu H, Ma J, Deng J. Interannual Variability of Spring Extratropical Cyclones over the Yellow, Bohai, and East China Seas and Possible Causes. Atmosphere. 2019; 10(1):40. https://doi.org/10.3390/atmos10010040
Chicago/Turabian StyleZhang, Jiuzheng, Haiming Xu, Jing Ma, and Jiechun Deng. 2019. "Interannual Variability of Spring Extratropical Cyclones over the Yellow, Bohai, and East China Seas and Possible Causes" Atmosphere 10, no. 1: 40. https://doi.org/10.3390/atmos10010040
APA StyleZhang, J., Xu, H., Ma, J., & Deng, J. (2019). Interannual Variability of Spring Extratropical Cyclones over the Yellow, Bohai, and East China Seas and Possible Causes. Atmosphere, 10(1), 40. https://doi.org/10.3390/atmos10010040