Abstract
Interannual variability of cyclones that are generated over the eastern Asian continent and passed over the Yellow, Bohai, and East China seas (YBE cyclones) in spring is analyzed using reanalysis datasets for the period of 1979–2017. Possible causes for the variability are also discussed. Results show that the number of YBE cyclones exhibits significant interannual variability with a period of 4–5 years. Developing cyclones are further classified into two types: rapidly developing cyclones and slowly developing cyclones. The number of rapidly developing cyclones is highly related to the underlying sea surface temperature (SST) anomalies (SSTA) and the atmospheric baroclinicity from Lake Baikal to the Japan Sea. The number of slowly developing cyclones, however, is mainly affected by the North Atlantic Oscillation (NAO) in the preceding winter (DJF); it works through the upper-level jet stream over Japan and the memory of ocean responses to the atmosphere. Positive NAO phase in winter is associated with the meridional tripole pattern of SSTA in the North Atlantic Ocean, which persists from winter to the following spring (MAM) due to the thermal inertia of the ocean. The SSTA in the critical mid-latitude Atlantic region in turn act to affect the overlying atmosphere via sensible and latent heat fluxes, leading to an increased frequency of slowly developing cyclones via exciting an anomalous eastward-propagating Rossby wave train. These results are confirmed by several numerical simulations using an atmospheric general circulation model.
1. Introduction
Extratropical cyclones are an essential component of the atmospheric circulation system in the extratropical region, which play an important role in maintaining the energy balance of the atmosphere by transferring energy and moisture poleward to reduce the meridional temperature gradient [1]. In the Northern Hemisphere, extratropical cyclones are mainly located over Kuroshio in the Pacific, subtropical Northwest American coast, East Pacific, Southeast Greenland, and Barents sea in winter [2]. On the interannual time scale, there exists an obvious correlation between Atlantic storm frequency and the North Atlantic Oscillation (NAO) [2,3]. While the eastern Pacific cyclone frequency is related to the Pacific-North American (PNA) pattern [2]. Zhang et al. [4] found that the Arctic Oscillation (AO) index is positively correlated with the frequency of extratropical cyclones at the high latitudes in the Northern Hemisphere, whereas a negative correlation appears at the low latitudes. Changes in long-term trends of extratropical cyclones over the Northern Hemisphere have gained many attentions due to global warming [5,6,7,8,9,10,11,12]. Wang et al. [5,6] found that the counts of deep cyclones show a general increase in both hemispheres over the past half century. The increase is more obvious in the Northern Hemisphere than in the Southern Hemisphere, and it is more obvious in winter than in summer. Chang [13] also pointed out that, by the end of this century, there will be a significant increase in the frequency of extreme cyclones in all four seasons regardless of the definition, while the total number of cyclones shows the opposite trend. Many studies also indicated that the total number of the boreal winter extratropical cyclones will be decreasing in the Northern Hemisphere during the winter by the end of this century [5,8,9,10,14]. The enhanced near-surface heating at high latitudes may be a critical cause. On one hand, it leads to the reduction of meridional temperature gradient and it reduces the available potential energy for extratropical cyclones. On the other hand, it acts to weaken the atmospheric baroclinicity and suppress the development of cyclones [5,8,9,10,11,14]. Besides, the general trend of extratropical cyclones is closely related to the activities of strong cyclones, which tend to move poleward in the Atlantic Ocean [12].
The East China coast is a vital cyclogenesis region [15]. Cyclones that are generated in this region and passing over the Yellow, Bohai, and East China seas (hereafter referred to as YBE seas) can seriously affect the offshore transportation and fishery. Recent studies have focused on the climatological characteristics of China’s offshore cyclones. Using an objective tracking algorithm of cyclones, Qin et al. [16] found that China’s offshore extratropical cyclone tracks tend to shift northward in recent decades, characterized by increased (decreased) cyclone number over the Yellow and Bohai seas (the East China Sea). Moreover, extratropical cyclones over East Asia and Western Pacific exhibit obvious seasonal variability, that is, extratropical cyclones occur more frequently in spring and summer than in autumn and winter [17], and extratropical cyclones are stronger in winter and spring than in summer and autumn [17,18]. Thus, this paper mainly focuses on the spring season of more frequent and stronger cyclones. Besides, China’s offshore cyclones are generally weak, and deepened mainly over the ocean far from the coast near the region of Kuroshio extension [15,16,19,20], accounting for 51% of the total explosive cyclones in the western Pacific [17]. Previous studies showed that the favorable conditions for the development of extratropical cyclones include atmospheric baroclinicity [21,22,23], potential vorticity and vorticity advection [21,24,25], temperature advection [21,23,26], dynamic forcing of the upper-level jet [18,21,27], and ocean warm current and associated latent heat release [16,23,26,28].
Previous studies on China’s offshore cyclones mainly focused on climatological characteristics, and they paid little attention to its interannual variability and possible causes, especially for weak cyclones. In this study, we investigate the interannual variability of spring cyclones over the East Asia continent that start to develop when they enter the YBE seas and the possible causes.
We organize the paper, as follows. In Section 2, we introduce the data and methods used in this study. Characteristics of the YBE cyclones are presented in Section 3. Influence factors and possible causes of YBE cyclones are discussed, together with the results from model simulation in Section 4. Conclusions and discussion are given in Section 5.
2. Data and Methods
2.1. Data
In this study, the data used to extract the cyclone activities are the six-hourly ERA-Interim reanalysis dataset from the European Centre for Medium-Range Weather Forecasts, which has a resolution of 0.75° × 0.75° [29]. The ERA-Interim reanalysis dataset includes sea level pressure, geopotential height, air temperature, zonal wind, and meridional wind. The monthly mean sea surface temperature (SST) data are from the Hadley Centre Sea Ice and Sea Surface Temperature dataset (HadISST) [30], with a global coverage on 1° × 1° grid. The monthly mean sensible and latent heat fluxes are from the Objectively Analyzed Air-sea Fluxes (OAFlux) [31], with a spatial resolution of 1° × 1°. The monthly NAO index is from the Climate Production Center of the National Oceanic and Atmospheric Administration (CPC/ NOAA). The procedure that was used to calculate the NAO index is based on the Rotated Principal Component Analysis (RPCA) in Barnston and Livezey [32]. All of these datasets cover the period of 1979–2017.
2.2. Methods
Conventional climate analysis methods are used in this study, including correlation, regression, composite, and Fourier analysis. Additionally, seasonal-mean datasets are used in all correlations, regressions, and composite analysis; and, Student’s t-test is used for obtaining statistical significance.
We mainly focus on the interannual variability of extratropical cyclones in this study. Thus, linear trends are removed, and interdecadal changes longer than eight years are also filtered by Fourier analysis before analyses. Thus, the filtered values are the anomalies of the field.
2.2.1. Cyclone Tracking
The objective algorithm modified by Lu [33,34] is used to identify and track extratropical cyclones here. The algorithm is based on triangular-mesh contouring techniques combined with a connected-component labeling method to detect the characteristics of individual cyclones. It uses neighbor center point (NCP; i.e., point-to-point) and connecting the overlaid feature area (COFA; i.e., field-to-field) schemes to develop a new cyclone tracking scheme, which can identify cyclones’ merging and splitting events and reduce the uncertainty of tropical cyclone tracking. When detecting a cyclone center points, it uses the nine-point local minima method to select cyclone-center candidates. That is, when the geopotential height of a lattice point is lower than the height of its eight neighboring grids, the lattice point is marked as the center of the candidate cyclone. With the location of the central point as the center, the methodology that is applied in this algorithm is similar to that in Wernli and Schwierz [35]. They performed a first guess and then searched for successive points of the enclosed contour based on the direction perpendicular to the local gradient of the SLP field. Because of the limited data resolution, the cyclone with scale smaller than 150 km cannot be identified. Moreover, to improve the efficiency of identification, the cyclone with scale larger than 2000 km were filtered.
2.2.2. Selection and Classification of Cyclones
The region of the YBE seas (35°–41° N, 117°–127° E), (23°–35° N, 120°–130° E) defined in this study is shown in Figure 1. First, a YBE cyclone is defined as a cyclone that is generated over the East Asia continent and it then enters the YBE region. Second, we define an effective cyclone activity as a cyclone with at least one enclosed isobar on the sea-level chart and its lifetime longer than 24 h. According to the above criterions, the YBE cyclones in spring (March–April–May, or MAM) from 1979 to 2017 are detected.
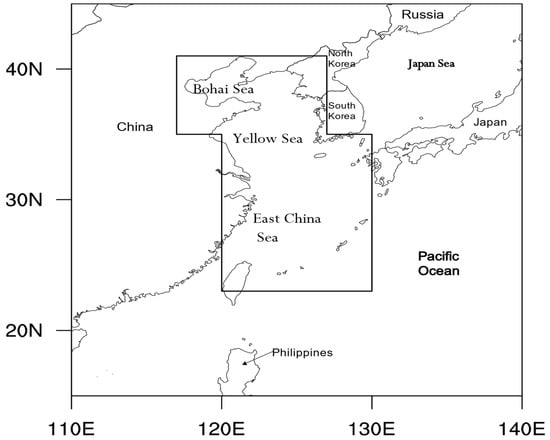
Figure 1.
Map of the Yellow, Bohai, and East China seas (the black border, i.e., 35°–41° N, 117°–127° E; 23°–35° N, 120–130° E).
According to the definition of explosive cyclones [28], normalized central pressure deepening rate is defined, as follows:
where Pt−12 and Pt+12 are the central pressures of the cyclone 12 h before and after current time, respectively; Ф is the latitude of the cyclone center. The unit of R is “bergeron” (referred to as B).
R = (Pt−12 − Pt+12)/24 hPa × [(sin60°)/sinФ],
The value of R is positive (negative) for developing (non-developing) cyclones, and the cyclone with R exceeding 1 B is considered as an explosive cyclone. Thus, the YBE cyclones are classified using the threshold of R. To better describe the intensity of the development of cyclones, developing cyclones are further classified into two types: rapidly developing cyclones with R ≥ 0.5 B, and slowly developing cyclones with 0 < R < 0.5 B.
2.2.3. Wave Activity Fluxes
The horizontal wave activity flux is used to analyze stationary Rossby wave propagation, which is defined as in Takaya and Nakamura [36,37]:
where Ψ′ is the perturbation geostrophic streamfunction, U and V are the basic state horizontal wind velocities, and u′ and v′ are perturbation geostrophic wind velocities. The normalized pressure P is pressure divided by 1000 hPa.
2.2.4. Atmospheric Baroclinicity
The atmospheric baroclinicity can be represented by Eady growth rate maximum [38], which is defined as:
where N is the atmospheric static stability, and f is the Coriolis parameter. = (u, v) is the horizontal wind velocities, and Z is geopotential height.
2.3. Model
The Community Atmosphere Model version 5.1 (CAM5.1) is the atmospheric component of the Community Earth System Model Version 1.0.3 (CESM1.0.3), which is developed by the National Center for Atmospheric Research. CAM5.1 can simulate the atmospheric circulation as a standalone model or as part of a coupled model as in CESM1.0.3. CAM5.1 that was used in this study has a horizontal resolution of 0.9° × 1.25° (latitude × longitude) and a hybrid vertical coordinate with 30 levels.
3. Characteristics of Spring YBE Cyclones
Figure 2 shows the time series of YBE spring cyclone number in different types. There exists obvious interannual variability for each type of YBE cyclones. The average number of spring YBE cyclones is around six per year (Figure 2a), about 80% of which develop when they pass over the YBE region. For the period of 1979 to 2017, we identify 94 rapidly developing cyclones (including 23 explosively developed cyclones; Figure 2b) and 111 slowly developing cyclones (Figure 2c). The number of non-developing cyclones is only 52 (Figure 2d), accounting for only 20% of the total. Thus, our attention is focused on developing cyclones.
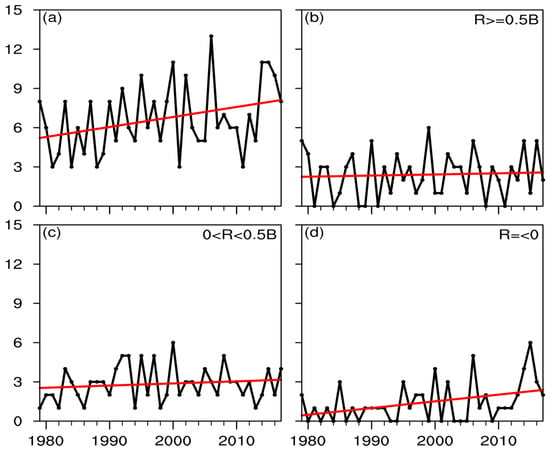
Figure 2.
Time series of Yellow, Bohai, and East China (YBE) spring cyclone number (black curve) and the linear trend (red line) for (a) all cyclones, (b) rapidly developing cyclones (R ≥ 0.5 B), (c) slowly developing cyclones (0 < R < 0.5 B), and (d) non-developing cyclones (R ≤ 0).
Figure 3 shows the power spectrum of YBE cyclone number in different types (The x-axis shows several major periods). Both numbers of rapidly and slowly developing cyclones show two energy peaks: one at 4–5 years and the other around 2.5 years (Figure 3b,c). However, only the energy peak at 4–5 years significantly exceeds the 95% confidence red noise spectrum, indicating that both numbers of rapidly and slowly developing cyclones have a period of 4–5 years. In contrast, non-developing cyclone number has no significant period (Figure 3d).
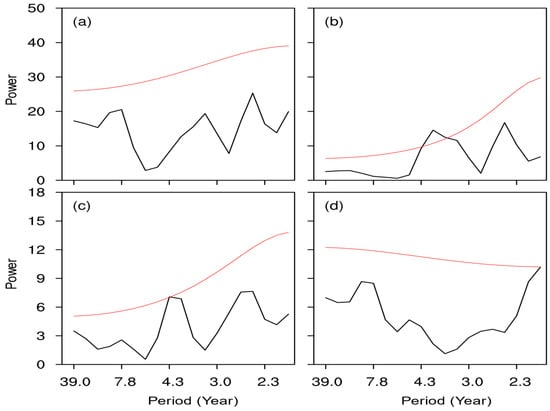
Figure 3.
Power spectra of the numbers of YBE spring cyclones for (a) all cyclones, (b) rapidly developing cyclones (R ≥ 0.5 B), (c) slowly developing cyclones (0 < R < 0.5 B), and (d) non-developing cyclones (R ≤ 0). The red curve denotes the 95% confidence level of red noise spectrum. The x-axis shows several major periods.
4. Possible Mechanisms for the Interannual Variability of Rapidly and Slowly Developing Cyclone Numbers
Previous subsections show that each type of developing cyclones exhibits obvious interannual variability. To better describe the intensity of the development of different cyclones and reveal the mechanisms for the interannual variability of cyclone numbers, we divide them into rapidly and slowly developing cyclones using the threshold of R, and study them separately. Moreover, the number of explosive cyclones is too small (only 23 in total) to be studied independently. Thus, they are classified as rapidly developing cyclones in this study.
4.1. Rapidly Developing Cyclones
Figure 4a shows the correlation coefficient between the number of rapidly developing cyclones and sea surface temperature anomalies (SSTA) over the East China Sea in spring. The number of rapidly developing cyclones is positively correlated with the underlying SSTA, suggesting that more rapidly developing cyclones would appear when SSTA are high, and vice versa. The significant positive correlation coefficient center is located in the region with strong SST gradients, which is closely related to the Kuroshio in the East China Sea. This is consistent with the finding that cyclones tend to develop when passing over the region of strong SST gradients [28].
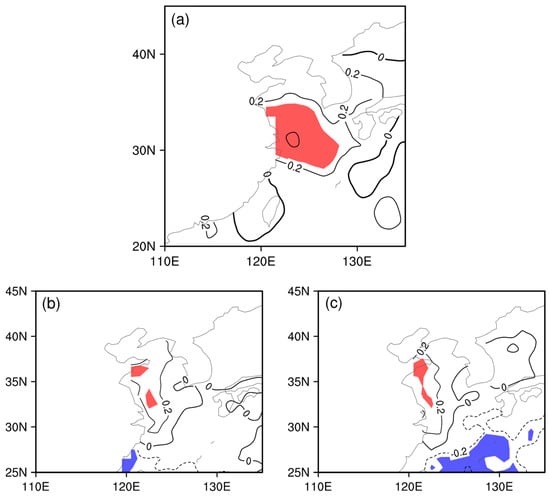
Figure 4.
Correlation coefficients between the number of rapidly developing cyclones and (a) sea surface temperature anomalies (SSTA) over the East China Sea, (b) latent heat fluxes, and (c) sensible heat fluxes in spring. Red and blue shadings represent the positive and negative correlation coefficients exceeding the 90% confidence level, respectively.
There is a general agreement that sea surface heat fluxes play an important role in energy and moisture exchanges in air-sea interaction processes [39,40], and diabatic heating is essential in the development of strong cyclones [41]. To further explore the role of the underlying SSTA, Figure 4b,c show the correlation coefficients between the number of rapidly developing cyclones and sea surface heat fluxes. An in-phase relationship is found between the number of rapidly developing cyclones and the simultaneous underlying sea surface heat fluxes (Figure 4b,c), with a positive center being located over the coastal area of China. On one hand, the higher SSTA may heat the atmosphere by releasing sensible and latent heat fluxes, providing energy to the rapid development of the cyclone and to strengthen the low-level cyclonic circulation [42,43]. On the other hand, sufficient moisture that is associated with the high SSTA seems to favor the development of a cyclone [16,43].
The relationship between the number of rapidly developing cyclones and 700-hPa atmospheric baroclinicity (derived from (3) in Section 2) is shown in Figure 5. There exists a significant positive correlation coefficient from Lake Baikal to the coast of the Japan Sea, which is linked to the topography over the East Asia continent. Cold air often accumulates on the west side of the Great Khingan Mountains and then keeps spreading southeastward, resulting in strong baroclinicity along the East Asia coast [21]. Yoshida et al. [18] also pointed out that both strong low-level baroclinic area along the Japan Sea coast and the expansion of the cold air mass over the Asia continent could provide favorable atmospheric conditions for the rapid development of cyclones in the Northwest Pacific Ocean.
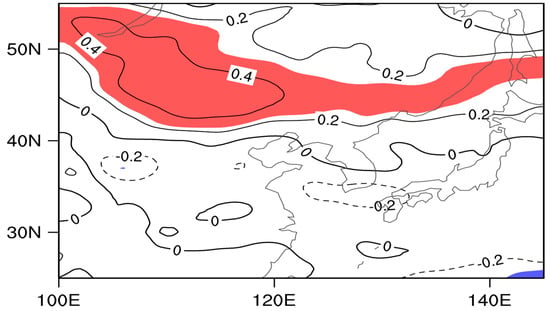
Figure 5.
Correlation coefficients between the number of rapidly developing cyclones and 700-hPa atmospheric baroclinicity in spring. Red and blue shadings represent the positive and negative correlation coefficients exceeding the 90% confidence level, respectively.
To further reveal the influence of low- and mid-level atmospheric baroclinicity on the rapidly developing cyclones, Figure 6 shows the spatial-temporal evolutions of composite atmospheric circulation before and after the rapidly developing cyclones (94 in total) enter the sea. Day 0 is the day when a cyclone enters the YBE seas and intensifies. Before the cyclone enters the sea, a deep trough occurs in the lower-to-mid troposphere around Lake Baikal (Figure 6(a1–a3,b1–b3)), accompanied by significant alternative cold and warm advections. This trough is more clearly seen at lower levels, and it turns into a more zonally orientated trough at 850 hPa (Figure 6(a3)). Thus, the cold advection directly intensifies the trough and forms significant atmospheric baroclinicity near Lake Baikal; and, dense isobars are found in sea level pressure, with a high pressure center located in the Yellow and Bohai seas (Figure 6(a4,b4)). Along with this eastward-travelling high pressure system, the cyclone gradually enters the sea (Figure 6(c4,d4)), and the cold air mass behind the zonal trough moves eastward, favoring atmospheric baroclinicity from Lake Baikal to the Japan Sea coast (Figure 5). Meanwhile, the zonally orientated trough is also intensified by the strengthened upstream cold advection and moves to 120° E, with its orientation changed from the northeast-southwest direction to the meridional direction (Figure 6(c1–c3)). Besides, the East Asia trough evidently rebuilds at 700 and 850 hPa, and the downstream warm advection brings warm air to the East China Sea (Figure 6(c2,c3)). This low-level circulation pattern remains stationary after the cyclone enters the sea and continues providing favorable condition for the development of the cyclone (Figure 6(d1–d3)). Thus, the significant atmospheric baroclinicity from Lake Baikal to the Japan Sea may not affect the rapidly developing cyclones directly. It may act to work through the change of atmospheric circulation instead.
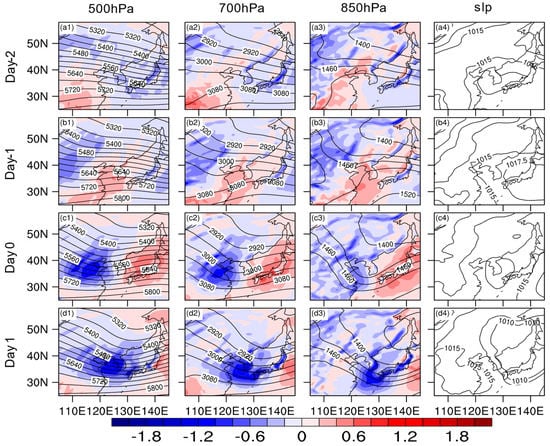
Figure 6.
Spatial-temporal evolutions of composite (a1–d1) 500-hPa, (a2–d2) 700-hPa, and (a3–d3) 850-hPa height (contour; gpm) and horizontal thermal advection (color shading; ×10−4 K∙s−1), and (a4–d4) sea level pressure (contour; hPa) for rapidly developing cyclones (94 in total) on (a1–a4) day-2, (b1–b4) day-1, (c1–c4) day 0, and (d1–d4) day+1. Day 0 indicates the time when the cyclone enters the seas and intensify.
To summarize, the number of rapidly developing cyclones is mainly associated with the underlying SSTA and the atmospheric baroclinicity from Lake Baikal to the Japan Sea. On one hand, the high SSTA may heat the atmosphere via sensible and latent heat fluxes, and provide energy and moisture, which favor the development of the cyclone. On the other hand, the atmospheric baroclinicity may not affect the rapidly developing cyclones directly. It seems to influence the development of cyclones, mainly by changing the atmospheric circulation instead. As the cyclone enters the sea, the eastward-spreading cold air mass benefits the low-level atmospheric baroclinicity from Lake Baikal to the Japan Sea, changing atmospheric circulation, characterized by a zonally orientated trough moving to 120° E, with its orientation rotating anticlockwise. Finally, the East Asian trough reconstructs, and the downstream warm advection brings warm airs to the East China Sea, promoting the development of cyclones.
4.2. Slowly Developing Cyclones
4.2.1. Observational Results
Figure 7a shows the correlation coefficient between the number of slowly developing cyclones and 200-hPa wind speeds in spring. The number of slowly developing cyclones is significantly positively correlated with the subtropical upper-level jet over Japan, suggesting that the upper-level jet over Japan seems to be favorable for the development of cyclones. The significant positive center is located on the right-hand side of the jet stream entrance, which is consistent with the result of Yoshida and Asuma [18], who found that most cyclones entering the sea from the East Asia continent are accompanied by a strong upper-level jet stream over Japan. Shapiro and Kennedy [44] also pointed out that the divergence on the right flank of the jet stream entrance strengthens upward motion, which is favorable for cyclones developing.
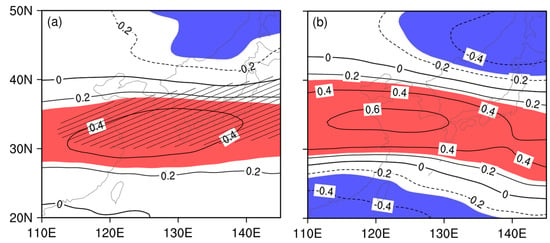
Figure 7.
(a) Correlation coefficients between the number of slowly developing cyclones and spring 200-hPa wind speeds. (b) Correlation coefficients between 200-hPa wind speeds in spring (MAM) and North Atlantic Oscillation (NAO) index in the preceding winter (DJF). Red and blue shadings represent the positive and negative correlation coefficients exceeding the 90% confidence level, respectively. The hatching in (a) indicates the area with wind speed exceeding 40 m∙s−1.
Figure 7b shows the correlation coefficient between 200-hPa wind speeds in spring and NAO index in the preceding winter (December–January–February, DJF). The 200-hPa wind speed over Japan in spring is significantly positively correlated with the NAO index in the preceding winter, suggesting that the upper-level jet over Japan may be affected by the NAO index in the preceding winter. Branstator [45] and Watanabe [46] also found that the Asian jet acts as a waveguide (Hoskins and Ambrizzi [47]), extending the influence of the NAO downstream by trapping the downstream-propagating quasi-stationary Rossby wave train associated with the NAO.
Figure 8 shows an obviously in-phase relationship between the number of the slowly developing cyclones in spring and the NAO index in the preceding winter (DJF). The correlation coefficient is 0.42, exceeding the 95% confidence level with Student’s t-test, while the relationship between the rapidly developing cyclones in spring and the NAO index in the preceding winter is not detectable. Previous researches founded that the NAO not only affects the atmospheric circulation in the Atlantic, but also plays an important role in global large-scale atmospheric circulation [48,49,50,51,52]. However, the memory of the atmosphere is less than two weeks due to the chaotic internal dynamics of atmospheric motion [53]. Thus, to investigate the mechanism for this in-phase relationship, we analyze the SSTA associated with the winter NAO index and the following spring (March–April–May, MAM) atmospheric circulation.
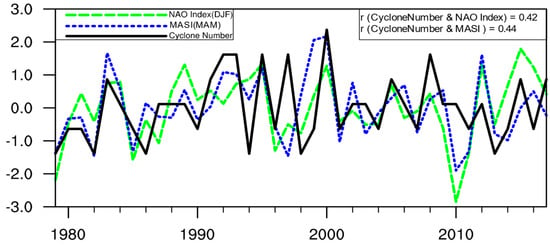
Figure 8.
Normalized time series of the number of slowly developing cyclones in spring (black), winter NAO index (green), and spring mid-latitude Atlantic sea surface temperature anomalies index (MASI) (blue) for the period of 1979–2017.
Figure 9a,b show correlation coefficients between the number of slowly developing cyclones and the Atlantic SSTA in winter and the following spring. The relationship between the number of slowly developing cyclones and local SSTA in spring is not detectable. Moreover, an obvious meridional tripole pattern is found over the North Atlantic Ocean, extending from the high latitudes to the subtropics. It is characterized by a positive correlation coefficient over the central North Atlantic, with negative correlation coefficients to its north and south (Figure 9a), which may be associated with the NAO [54]. In addition, this tripole pattern can persist from winter to the following spring (Figure 9b). As shown in Figure 10a, the spring SSTA pattern, which is quite similar to the tripole pattern in Figure 9b, is associated with the positive NAO phase in winter, that is, significant positive SSTA tend to occur in the mid-latitude Atlantic Ocean while significant negative SSTA appear in the high latitudes and subtropical Atlantic Ocean in the following spring in response to the positive NAO phase. This indicates that the positive SSTA region over the North Atlantic may be the critical region linking the number of slowly developing cyclones in spring and the NAO in the preceding winter.
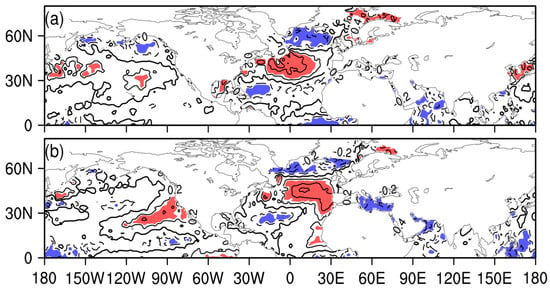
Figure 9.
Correlation coefficients between the number of slowly developing cyclones and the Atlantic SSTA in the (a) preceding winter and (b) spring. Red and blue shadings represent the positive and negative correlation coefficients exceeding the 90% confidence level, respectively.
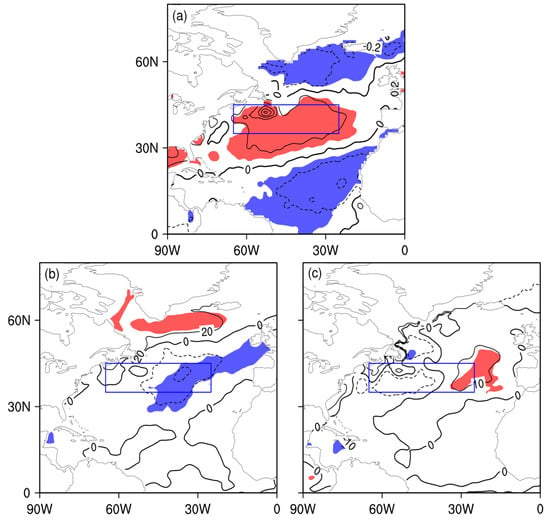
Figure 10.
(a) Regression coefficients of spring SSTA onto the NAO index in the preceding winter. Composite differences of heat fluxes (sensible and latent fluxes) between positive and negative spring MASI years (positive upward; W∙m−2) in the (b) preceding winter and (c) spring. Positive MASI years are 1983, 1992, 1993, 1995, 1999, 2000, and 2012; and negative MASI years are 1979, 1982, 1985, 1997, 2001, 2010, and 2011. Red and blue shadings in (a) represent the positive and negative regression coefficients exceeding the 90% confidence level, respectively. Red and blue shadings in (b) and (c) represent the positive and negative differences statistically significant at the 90% confidence level, respectively. The blue rectangles in (a), (b), and (c) denote the critical mid-latitude Atlantic (CMA) region.
As mentioned above, the SSTA over the mid-latitude Atlantic Ocean (blue rectangle in Figure 10a) are highly and positively related to both the NAO index in the preceding winter and the number of slowly developing cyclones in spring, indicating that the SSTA region over the North Atlantic may be the critical region linking the number of slowly developing cyclones in spring and the NAO in the preceding winter. Several studies also mentioned that positive tripole SSTA associated with strong NAO can impact both surface air temperature in North Euro-Asian [50] and summer monsoon in East Asia [50,51,52]. Thus, to measure the interannual variability of SSTA in mid-latitude Atlantic Ocean, we define the mid-latitude Atlantic SSTA index (MASI) as the normalized regionally-averaged SSTA over the critical mid-latitude Atlantic (CMA) region (35–45° N, 25–65° W; the blue solid rectangle in Figure 10a; in general, the regression coefficients of spring SSTA onto the NAO index in the preceding winter are statistically significant at the 90% confidence level). As shown in Figure 8, there also exists an obvious in-phase relationship between the YBE spring cyclone number and spring MASI, with a correlation coefficient of 0.44 exceeding the 95% confidence level. This indicates that more slowly developing cyclones would occur when the CMA region is warmer, and vice versa.
To analyze the air-sea relation in the CMA region, positive (standardized MASI larger than 1) and negative (standardized MASI less than −1) MASI years are selected from the normalized time series of spring MASI. Positive MASI years include 1983, 1992, 1993, 1995, 1999, 2000, and 2012, while negative MASI years include 1979, 1982, 1985, 1997, 2001, 2010, and 2011; as shown in Table 1. To distinguish which factor plays the leading role in air-sea interaction, we use the theory that was proposed in Cayan [55], that is, positive correlations between heat flux (positive upward) and SSTA indicate the dominance of the ocean, while negative correlations between heat flux and SSTA imply the forcing of the atmosphere. This theory has been widely used to distinguish whether the ocean or atmosphere plays the dominant role [56,57,58,59,60]. Composite differences of seasonal-mean sea surface heat flux anomalies between positive and negative MASI years (Figure 10b,c) show that significant negative anomalies occur in winter over the CMA region, indicating that the ocean is mainly forced by the overlying atmosphere. However, no obvious negative anomalies are found in spring, with only significant positive anomalies to the east of the CMA region. Peng et al. [49] and Zuo et al. [51] also found that, in spring, heat fluxes in the mid-latitude Atlantic Ocean are positively correlated with the positive SSTA tripole patterns. Thus, when compared to winter, the atmosphere in spring no longer plays a leading role in the air-sea interaction, and the ocean may play a more active role.

Table 1.
Positive and negative MASI years.
Figure 11 shows regression patterns of 500-hPa geopotential height and wave-activity fluxes (derived from (2) in Section 2) in spring onto the simultaneous MASI. Significant positive height anomalies occur north of the CMA region, while negative height anomalies are located to the south. To the east of the CMA region, there exist negative height anomalies (Figure 11), accompanied by easterly wind anomalies (not shown). This is consistent with the result of Xu and Cui [61], who used Cayan’s theory [55] and found similar wind and height anomaly patterns when the ocean forces the atmosphere. Thus, the atmosphere acts to force the ocean in winter over the CMA region (Figure 10b), while the influence of the ocean on the atmosphere seems to enhance in spring.
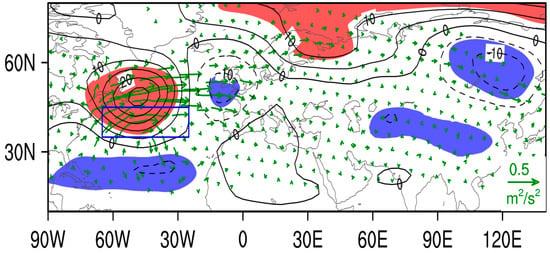
Figure 11.
Regression coefficients of spring 500-hPa geopotential height (contour; interval of 5 gpm) onto the spring MASI, and the associated Rossby wave activity fluxes (vectors; m2∙s−2). Red and blue shadings represent the positive and negative regression coefficients exceeding the 90% confidence level, respectively. The blue rectangle indicates the critical mid-latitude Atlantic (CMA) region.
In spring, two positive height anomaly centers are located over the CMA region and the Scandinavian Peninsula, respectively, while two negative height anomaly centers occur over the coast of western Europe and Mongolia, respectively (Figure 11). Positive local geopotential height anomalies over the CMA region may result from the atmospheric heating via sensible and latent heat fluxes (Figure 10c). The wave-activity fluxes propagate eastward from the central West Atlantic to western Europe, resulting in negative geopotential height anomalies there. Subsequently, they travel downstream to induce positive geopotential height anomalies over the Scandinavian Peninsula, and finally reach Mongolia and its neighboring regions, which are the main cyclone source regions in China [62], favoring negative geopotential height anomalies there. Previous studies also found that North Atlantic tripole SSTA could exert an effect on East Asian climate variability by inducing a zonal wave-train propagating downstream over the Atlantic-Eurasia region [49,51,52]. The 500-hPa negative geopotential height anomalies in Mongolia and its neighboring regions are conducive to reduced low-level pressure and the development of cyclonic circulations. Since Mongolia and its neighboring regions are the main sources of extratropical cyclones in China [62], an increased cyclone frequency in these regions may lead to an increase in downstream slowly developing cyclones.
Overall, the number of slowly developing cyclones is mainly affected by the NAO in the preceding winter. On one hand, the NAO in the preceding winter may affect the number of slowly developing cyclones via upper-level jet over Japan [45,46]. On the other hand, it works through the memory of ocean responses to the atmosphere. The mid-latitude Atlantic Ocean plays an important role in this process. In winter, the atmospheric forces the ocean to induce a meridional tripole pattern of SSTA in the North Atlantic Ocean [51,52], which can persist from winter to the following spring due to the oceanic thermal inertia. In spring, positive SSTA in the CMA region in turn impact the overlying atmosphere via sensible and latent heat fluxes, leading to an increased frequency of slowly developing YBE spring cyclones via exciting an anomalous eastward-propagating Rossby wave train.
4.2.2. Model Results
In this section, the CAM5.1 is employed to confirm the impacts of Atlantic SSTA on the East Asia atmosphere circulation in spring.
A control experiment (CTRL) and two sensitivity experiments are performed. The CTRL is run with climatological monthly mean SST as its ocean surface boundary condition. Two sensitivity experiments include a positive and a negative SSTA experiment, referred as PSSTA and NSSTA, respectively. In the PSSTA, monthly mean SSTA averaged over the CMA region from positive MASI years (Figure 12a, i.e., 1983, 1992, 1993, 1995, 1999, 2000, 2012) is added to the climatological monthly mean SST from March to May; and, the NSSTA is the same as the PSSTA, except using the SSTA from negative MASI years (Figure 12b, i.e., 1979, 1982, 1985, 1997, 2001, 2010, 2011). Thus, two sensitivity experiments are the same as the CTRL, except for ocean surface boundary conditions. Each experiment is integrated for 15 years, and the results from the last 10 years are analyzed. Thus, the difference between CTRL and each of the two sensitivity experiments can be regarded as the impacts of SST anomalies in the CMA region on the atmospheric circulation in spring.
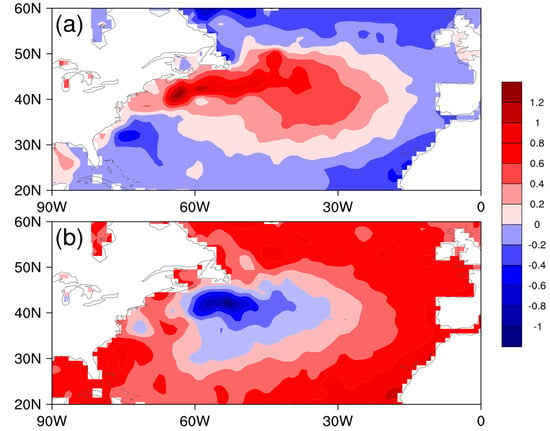
Figure 12.
Spatial distribution of spring SSTA (color shading; K) averaged from (a) positive and (b) negative MASI years used in the positive and negative SSTA experiment (PSSTA and NSSTA), respectively.
Table 2 shows the number of slowly developing cyclones from the PSSTA and NSSTA. The definition and classification of the YBE cyclones in the simulation are the same as those for the observations, including slowly developing cyclones. Using the Student’s t-test, we confirmed that simulated cyclone number differences between PSSTA and NSSTA runs are significant (exceeding the 95% confidence level). When compared to the NSSTA results, the number of slowly developing cyclones in the PSSTA is obviously increased, implying the in-phase relationship between the number of slowly developing cyclones and MASI, which is consistent with the above observational results.

Table 2.
The number of slowly developing cyclones in the PSSTA and NSSTA over the last 10 model years.
Figure 13 shows the difference of 500-hPa geopotential height and associated wave-activity fluxes in spring in the two sensitivity experiments (PSSTA minus NSSTA). Positive height anomalies are located in the CMA region (Figure 13), accompanied by underlying positive heat fluxes (sensible and latent fluxes; figure not shown). The geopotential height anomalies are featured by two positive centers over the CMA region and the Scandinavian Peninsula, respectively, and two negative centers are over western Europe and Mongolia, respectively, which display similar spatial patterns as in Figure 11. This anomalous Rossby wave train propagates eastward from the CMA region across the Eurasian continent and finally reaches Mongolia and its neighboring regions, which are responsible for the negative height anomalies over China. As a result, mid- and low-level pressures are reduced (not shown), which favors the development of cyclonic circulations. Overall, the positive SSTA in the CMA region in spring can induce the mid-tropospheric negative geopotential height anomalies over Mongolia and its neighboring regions. Therefore, the results from these experiments reasonably well reproduce the negative relationship between SSTA in the CMA region and 500-hPa geopotential height anomalies over Mongolia and its neighboring regions where the YBE cyclones are generated
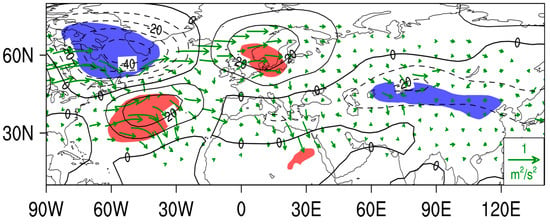
Figure 13.
Simulated differences of 500-hPa height (contour; interval of 10 gpm) between two sensitivity experiments (PSSTA minus NSSTA) in spring, and the associated Rossby wave activity fluxes (vector; m2∙s−2) averaged over the last 10 model years. Red and blue shadings represent the positive and negative differences statistically significant at the 90% confidence level, respectively.
5. Summary
In this study, YBE spring cyclones are classified into two types to reveal their interannual variability and possible causes based on reanalysis datasets and numerical simulations. The conclusions are as follows.
The number of YBE cyclones exhibits significant interannual variability with a period of 4–5 years. The average number of spring YBE cyclones is around six per year, 80% of which develop when passing over the YBE region. One-third of these cyclones are rapidly deepened, and about 9% of the total cyclones finally become explosive cyclones.
The number of rapidly developing cyclones is mainly associated with the underlying SSTA and the atmospheric baroclinicity from Lake Baikal to the Japan Sea. The high SSTA may heat the atmosphere via sensible and latent heat fluxes, and provides energy and moisture for the cyclones, which favor the development of cyclones. The significant atmospheric baroclinicity from Lake Baikal to the Japan Sea may not affect the rapidly developing cyclones directly. It may act to work through the change of atmospheric circulation instead. The eastward-spreading cold air mass accompanies with the change of atmospheric circulation, characterized by a zonally orientated trough moving to around 120° E, with its orientation rotating anticlockwise. Finally, the East Asian trough reconstructs, and the downstream warm advection brings warm airs to the East China Sea, promoting the development of cyclones.
The number of slowly developing cyclones is mainly affected by the NAO in the preceding winter. On one hand, the NAO in the preceding winter may exert influence on the number of slowly developing cyclones via upper-level jet over Japan. On the other hand, it seems to work through the memory of ocean responses to the atmosphere. The mid-latitude Atlantic Ocean plays an important role in this process. In winter, the atmosphere forces the ocean to induce a meridional tripole pattern of SSTA in the North Atlantic Ocean [51,52], which can persist to the following spring due to the oceanic thermal inertia. In spring, the positive SSTA in the CMA region in turn impact the above atmosphere via sensible and latent heat fluxes, leading to an increased frequency of slowly developing YBE spring cyclones via exciting an anomalous eastward-propagating Rossby wave train.
In summary, we show two distinct mechanisms for the interannual variability of slowly and rapidly developing cyclones, indicating that different processes govern the slowly and rapidly development of cyclones, respectively. These findings require further investigation in the future. Moreover, the result of cyclone tracking may be related to the spatial resolution of datasets, which is worthy of further investigation with higher spatial resolution of datasets.
Author Contributions
Conceptualization, H.X.; methodology, H.X., J.Z. and J.D.; software, J.Z.; validation, J.Z. and J.M.; formal analysis, J.Z.; writing—original draft preparation, J.Z. and J.M.; writing—review and editing, J.Z., J.M., H.X. and J.D.; and supervision, H.X.
Funding
This work was jointly supported by the National Natural Science Foundation of China (41575077, 41490643, and 41805051), the National Key Research and Development Program of China (2017YFA0604102), the Priority Academic Program Development of Jiangsu Higher Education Institutions (PAPD), and the Startup Foundation for Introducing Talent of NUIST (2017r057). Deng was also supported by the Natural Science Foundation of Jiangsu Province (BK20170942), the General Program of Natural Science Research of Jiangsu Province University (17KJB170012), the Startup Foundation for Introducing Talent of NUIST (2016r051), and the China Scholarship Council (CSC).
Conflicts of Interest
The authors declare no conflict of interest.
References
- Zhang, Y.C.; Rossow, W.B. Estimating meridional energy transports by the atmospheric and oceanic general circulations using boundary fluxes. J. Clim. 1997, 10, 2358–2373. [Google Scholar] [CrossRef]
- Gulev, S.K.; Zolina, O.; Grigoriev, S. Extratropical cyclone variability in the Northern Hemisphere winter from the NCEP/NCAR reanalysis data. Clim. Dyn. 2001, 17, 795–809. [Google Scholar] [CrossRef]
- Geng, Q.; Sugi, M. Variability of the North Atlantic Cyclone Activity in Winter Analyzed from NCEP–NCAR Reanalysis Data. J. Clim. 2001, 14, 3863–3873. [Google Scholar] [CrossRef]
- Zhang, Y.X.; Ding, Y.H.; Li, Q.P. Interdecadal Variations of Extratropical Cyclone Activities and Storm Tracks in the Northern Hemisphere. Chin. J. Atmos. Sci. 2012, 36, 912–928. [Google Scholar] [CrossRef]
- Zhang, Y.; Wang, W. Model-Simulated Northern Winter Cyclone and Anticyclone Activity under a Greenhouse Warming Scenario. J. Clim. 1997, 10, 1616–1634. [Google Scholar] [CrossRef]
- Wang, X.L.; Feng, Y.; Chan, R.; Isaac, V. Inter-comparison of extra-tropical cyclone activity in nine reanalysis datasets. Atmos. Res. 2016, 181, 133–153. [Google Scholar] [CrossRef]
- Wang, X.L.; Feng, Y.; Compo, G.P.; Swail, V.R.; Zwiers, F.W.; Allan, R.J.; Sardeshmukh, P.D. Trends and low frequency variability of extra-tropical cyclone activity in the ensemble of twentieth century reanalysis. Clim. Dyn. 2013, 40, 2775–2800. [Google Scholar] [CrossRef]
- McDonald, R.E. Understanding the impact of climate change on Northern Hemisphere extra-tropical cyclones. Clim. Dyn. 2011, 37, 1399–1425. [Google Scholar] [CrossRef]
- Mizuta, R.; Matsueda, M.; Endo, H.; Yukimot, S. Future change in extratropical cyclones associated with change in the upper troposphere. J. Clim. 2011, 24, 6456–6470. [Google Scholar] [CrossRef]
- Eichler, T.P.; Gaggini, N.; Pan, Z. Impacts of global warming on Northern Hemisphere winter storm tracks in the CMIP5 model suite. J. Geophys. Res. 2013, 118, 3919–3932. [Google Scholar] [CrossRef]
- Catto, J.L.; Shaffrey, L.C.; Hodges, K.I. Northern Hemisphere extratropical cyclones in a warming climate in the HiGEM high-resolution climate model. J. Clim. 2011, 24, 5336–5352. [Google Scholar] [CrossRef]
- Wang, X.L.; Swail, V.R.; Zwiers, F.W. Climatology and Changes of Extratropical Cyclone Activity: Comparison of ERA-40 with NCEP–NCAR Reanalysis for 1958–2001. J. Clim. 2006, 19, 3145–3166. [Google Scholar] [CrossRef]
- Chang, E.K. Projected Significant Increase in the Number of Extreme Extratropical Cyclones in the Southern Hemisphere. J. Clim. 2017, 30, 4915–4935. [Google Scholar] [CrossRef]
- Bengtsson, L.; Hodges, K.I.; Keenlyside, N. Will Extratropical Storms Intensify in a Warmer Climate? J. Clim. 2009, 22, 2276–2301. [Google Scholar] [CrossRef]
- Chen, S.J.; Kuo, Y.H.; Zhang, P.Z.; Bai, Q.F. Climatology of explosive cyclones off the east Asian coast. Mon. Weather Rev. 1992, 120, 3029–3035. [Google Scholar] [CrossRef]
- Qin, T.; Wei, L.X. The statistic and variance of cyclones entering coastal waters of China in 1979-2012. Chin. Acta Oceanol. Sin. 2015, 37, 43–52. [Google Scholar] [CrossRef]
- Yi, Q.J.; Ding, Y.H. Climatology of the Explosive Cyclogenesis over East Asia and the West Pacific. Chin. J. Atmos. Sci. 1993, 17, 302–309. [Google Scholar] [CrossRef]
- Yoshida, A.; Asuma, Y. Structures and environment of explosively developing extratropical cyclones in the northwestern Pacific region. Mon. Weather Rev. 2004, 132, 1121–1142. [Google Scholar] [CrossRef]
- Qin, Z.H.; Yong, L.I.; Huang, L.W. Climatology of the extratropical cyclones over the East China Sea and the West Pacific. Chin. Acta Oceanol. Sin. 2002, 24, 105–111, (In Chinese with English Abstract). [Google Scholar]
- Sinclair, M.R. Objective Identification of Cyclones and Their Circulation Intensity, and Climatology. Weather Forecast. 1997, 12, 595–612. [Google Scholar] [CrossRef]
- Li, C.Q.; Ding, Y.H. A diagnostic study of an explosively deepening oceanic cyclone over the northwest pacific. Chin. Acta Meteorol. Sin. 1989, 42, 180–190. [Google Scholar] [CrossRef]
- Reader, M.C.; Moore, G.K. Stratosphere-troposphere interactions associated with a case of explosive cyclogenesis in the Labrador Sea. Tellus A 1995, 47, 849–863. [Google Scholar] [CrossRef]
- Huang, L.W.; Yi, Q.J.; Qin, Z.H.; Yu, R.C. Dynamics/therm dynamics diagnosis of explosive development of extratropical cyclones over the northwestern Pacific Ocean. Chin. Acta Meteorol. Sin. 1999, 5, 581–593. [Google Scholar] [CrossRef]
- Zehnder, J.A.; Keyser, D. The influence of interior gradients of potential vorticity on rapid cyclogenesis. Tellus A 1991, 43, 198–212. [Google Scholar] [CrossRef]
- Ding, Z.Y.; Wang, J.S. Research on composite diagnosis and mechanisms of explosive cyclones. Chin. J. Appl. Meteorol. Sci. 2001, 12, 30–40, (In Chinese with English Abstract). [Google Scholar]
- Rogers, E.; Bosart, L.F. An Investigation of Explosively Deepening Oceanic Cyclones. Mon. Weather Rev. 1986, 114, 702–718. [Google Scholar] [CrossRef]
- Rivière, G.; Arbogast, P.; Maynard, K.; Joly, A. The essential ingredients leading to the explosive growth stage of the European wind storm Lothar of Christmas 1999. Q. J. R. Meteorol. Soc. 2010, 136, 638–652. [Google Scholar] [CrossRef]
- Sanders, F.; Gyakum, J.R. Synoptic-Dynamic Climatology of the “Bomb”. Mon. Weather Rev. 1980, 108, 1589–1606. [Google Scholar] [CrossRef]
- Dee, D.P.; Uppala, S.M.; Simmons, A.J.; Berrisford, P.; Poli, P.; Kobayashi, S.; Andrae, U.; Balmaseda, M.A.; Balsamo, G.; Bauer, P.; et al. The ERA-Interim reanalysis: Configuration and performance of the data assimilation system. Q. J. R. Meteorol. Soc. 2011, 137, 553–597. [Google Scholar] [CrossRef]
- Rayner, N.A.; Parker, D.E.; Horton, E.B.; Folland, C.K.; Alexander, L.V.; Rowell, D.P.; Kent, E.C.; Kaplan, A. Global analyses of sea surface temperature, sea ice, and night marine air temperature since the late nineteenth century. J. Geophys. Res. 2003, 108, 4407. [Google Scholar] [CrossRef]
- Yu, L.; Jin, X.; Weller, R.A. Multidecade Global Flux Datasets from the Objectively Analyzed Air-Sea Fluxes (OAFlux) Project: Latent and Sensible Heat Fluxes, Ocean Evaporation, and Related Surface Meteorological Variables. Available online: http://oaflux.whoi.edu/pdfs/OAFlux_TechReport_3rd_release.pdf (accessed on 17 January 2019).
- Barnston, A.G.; Livezey, R.E. Classification, Seasonality and Persistence of Low-Frequency Atmospheric Circulation Patterns. Mon. Weather Rev. 1987, 115, 1083–1126. [Google Scholar] [CrossRef]
- Lu, C.H. A modified algorithm for identifying and tracking extratropical cyclones. Adv. Atmos. Sci. 2017, 34, 909–924. [Google Scholar] [CrossRef]
- Qin, Y.J.; Lu, C.H.; Li, L.P. Multi-scale cyclone activity in the Changjiang River-Huaihe River valleys during spring and its relationship with rainfall anomalies. Adv. Atmos. Sci. 2017, 34, 246–257. [Google Scholar] [CrossRef]
- Wernli, H.; Schwierz, C. Surface cyclones in the ERA-40 dataset (1958–2001). Part I: Novel identification method and global climatology. J. Atmos. Sci. 2006, 63, 2486–2507. [Google Scholar] [CrossRef]
- Takaya, K.; Nakamura, H. A formulation of a waveactivity flux for stationary Rossby waves on a zonally varying basic flow. Geophys. Res. Lett. 1997, 24, 2985–2988. [Google Scholar] [CrossRef]
- Takaya, K.; Nakamura, H. A formulation of a phase-independent wave-activity flux for stationary and migratory quasigeostrophic eddies on a zonally varying basic flow. J. Atmos. Sci. 2001, 58, 608–627. [Google Scholar] [CrossRef]
- Hoskins, B.J.; Valdes, P.J. On the Existence of Storm-Tracks. J. Atmos. Sci. 1990, 47, 1854–1864. [Google Scholar] [CrossRef]
- Trenberth, K.E.; Fasullo, J.T.; Kiehl, J. Earth’s Global Energy Budget. Bull. Am. Meteorol. Soc. 2009, 90, 311–324. [Google Scholar] [CrossRef]
- Hsiung, J.; Newell, R.E.; Houghtby, T. The annual cycle of oceanic heat storage and oceanic meridional heat transport. Q. J. R. Meteorol. Soc. 1989, 115, 1–28. [Google Scholar] [CrossRef]
- MartínezAlvarado, O.; Gray, S.L.; Methven, J. Diabatic Processes and the Evolution of Two Contrasting Summer Extratropical Cyclones. Mon. Weather Rev. 2016, 144, 3251–3276. [Google Scholar] [CrossRef]
- Gyakum, J.R.; Danielson, R.E. Analysis of Meteorological Precursors to Ordinary and Explosive Cyclogenesis in the Western North Pacific. Mon. Weather Rev. 2000, 128, 851–863. [Google Scholar] [CrossRef]
- Kuo, Y.; Low-Nam, S. Prediction of Nine Explosive Cyclones over the Western Atlantic Ocean with a Regional Model. Mon. Weather Rev. 1990, 118, 3–25. [Google Scholar] [CrossRef]
- Shapiro, M.A.; Kennedy, P.J. Research Aircraft Measurements of Jet Stream Geostrophic and Ageostrophic Winds. J. Atmos. Sci. 1981, 38, 2642–2652. [Google Scholar] [CrossRef]
- Branstator, G. Circumglobal Teleconnections, the Jet Stream Waveguide, and the North Atlantic Oscillation. J. Clim. 2002, 15, 1893–1910. [Google Scholar] [CrossRef]
- Watanabe, M. Asian Jet Waveguide and a Downstream Extension of the North Atlantic Oscillation. J. Clim. 2004, 17, 4674–4691. [Google Scholar] [CrossRef]
- Hoskins, B.J.; Ambrizzi, T. Rossby Wave Propagation on a Realistic Longitudinally Varying Flow. J. Atmos. Sci. 1993, 50, 1661–1671. [Google Scholar] [CrossRef]
- Serreze, M.C.; Carse, F.; Barry, R.G.; Jeffery, C.R. Icelandic Low Cyclone Activity: Climatological Features, Linkages with the NAO and Relationship with Recent Changes in the Northern Hemisphere Circulation. J. Clim. 1997, 10, 453–464. [Google Scholar] [CrossRef]
- Peng, S.; Robinson, W.; Li, S. North Atlantic SST forcing of the NAO and relationships with intrinsic hemispheric variability. Geophys. Res. Lett. 2002, 29, 117-1–117-4. [Google Scholar] [CrossRef]
- Polonsky, A.; Basharin, D.; Voskresenskaya, E.; Worley, S.; Yurovsky, A. Relationship between North Atlantic Oscillation, Euro-Asian climate anomalies and Pacific variability. Pac. Oceanogr. 2004, 2, 52–67. [Google Scholar]
- Zuo, J.Q.; Li, W.J.; Sun, C.H.; Xu, L.; Ren, H.-L. Impact of the North Atlantic sea surface temperature tripole on the East Asian summer monsoon. Adv. Atmos. Sci. 2013, 30, 1173–1186. [Google Scholar] [CrossRef]
- Wu, Z.W.; Wang, B.; Li, J.P.; Jin, F.F. An empirical seasonal prediction model of the East Asian summer monsoon using ENSO and NAO. J. Geophys. Res. 2009, 114, D18120. [Google Scholar] [CrossRef]
- Lorenz, E.N. A study of the predictability of a 28-variable model. Tellus 1965, 17, 321–333. [Google Scholar] [CrossRef]
- Marshall, J.; Kushnir, Y.; Battisti, D.; Chang, P.; Czaja, A.; Dickson, R.; Hurrell, J.; McCartney, M.; Saravanan, R.; Visbeck, M. North Atlantic climate variability: Phenomena, impacts and mechanisms. Int. J. Climatol. 2001, 21, 1863–1898. [Google Scholar] [CrossRef]
- Cayan, D.R. Latent and Sensible Heat Flux Anomalies over the Northern Oceans: The Connection to Monthly Atmospheric Circulation. J. Clim. 1992, 5, 354–370. [Google Scholar] [CrossRef]
- Hurrell, J.W. Decadal Trends in the North Atlantic Oscillation: Regional Temperatures and Precipitation. Science 1995, 269, 676–679. [Google Scholar] [CrossRef]
- Rodwell, M.J.; Rowell, D.P.; Folland, C.K. Oceanic Forcing of the Wintertime North Atlantic Oscillation and European Climate. Nature 1999, 398, 320–323. [Google Scholar] [CrossRef]
- Trenberth, K.E.; Hurrell, J.W. Decadal atmosphere-ocean variations in the Pacific. Clim. Dyn. 1994, 9, 303–319. [Google Scholar] [CrossRef]
- Hurrell, J.W.; Loon, H.V. Decadal variations in climate associated with the north atlantic oscillation. Clim. Chang. 1997, 36, 301–326. [Google Scholar] [CrossRef]
- Kushnir, Y. Interdecadal Variations in North Atlantic Sea Surface Temperature and Associated Atmospheric Conditions. J. Clim. 1994, 7, 141–157. [Google Scholar] [CrossRef]
- Xu, H.M.; Cui, M.X. Atmospheric-oceanic features associated with large-scale SST anomalies over the North Pacific in winter. Chin. Trans. Atmos. Sci. 2018, 41, 330–343, (In Chinese with English Abstract). [Google Scholar]
- Chen, L.; Tan, B.; Kvamstø, G.N.; Johannessen, O.M. Wintertime cyclone/anticyclone activity over China and its relation to upper tropospheric jets. Tellus A 2014, 66, 21889. [Google Scholar] [CrossRef]
© 2019 by the authors. Licensee MDPI, Basel, Switzerland. This article is an open access article distributed under the terms and conditions of the Creative Commons Attribution (CC BY) license (http://creativecommons.org/licenses/by/4.0/).