Article

Sensitivity to Convective Schemes on Precipitation Simulated by the Regional Climate Model MAR over Belgium (1987–2017)

Laboratory of Climatology, Department of Geography, UR SPHERES, University of Liège, 4000 Liège, Belgium
*
Author to whom correspondence should be addressed.
Atmosphere 2019, 10(1), 34; https://doi.org/10.3390/atmos10010034
Submission received: 25 September 2018 / Revised: 8 January 2019 / Accepted: 10 January 2019 / Published: 17 January 2019
(This article belongs to the Special Issue Regional Climate Modeling)

Abstract

:
The aim of this study is to assess the sensitivity of convective precipitation modelled by the regional climate model MAR (Modèle Atmosphérique Régional) over 1987–2017 to four newly implemented convective schemes: the Bechtold scheme coming from the MESO-NH regional model and the Betts-Miller-Janjić, Kain-Fritsch and modified Tiedtke schemes coming from the WRF regional model. MAR version 3.9 is used here at a resolution of 10 km over a domain covering Belgium using the ERA-Interim reanalysis as forcing. The simulated precipitation is compared against SYNOP and E-OBS gridded precipitation data. Trends in total and convective precipitation over 1987–2017 are discussed. None of the MAR experiments compares better with observations than the others and they all show the same trends in (extreme) precipitation. Over the period 1987–2017, MAR suggests a significant increase in the mean annual precipitation amount over the North Sea but a significant decrease over High Belgium.

1. Introduction

Precipitation can generally be classified into two main types: (i) stratiform precipitation resulting from stable stratified clouds and characterized by a large spatial extent, weak vertical velocities and mostly low precipitation rates and (ii) convective precipitation resulting from convective clouds (congestus or cumulonimbus clouds) on a smaller areal coverage but with higher vertical velocities and precipitation rates than stratiform precipitation [1]. In temperate regions, stratiform precipitation generally results from fronts in mid-latitude cyclones and occurs all year round [2]. On the opposite, convective precipitation occurs mainly during summer, although it can also appear (less frequently) in winter [3].
The representation of convective systems in general circulation models (GCMs) or regional climate models (RCMs) is quite challenging since their spatial dimensions are most of the time significantly smaller than the spatial resolution allowed by the models. For this reason, contrary to stratiform precipitation which is explicitly simulated, convective precipitation has to be parameterized. Except for the convection-permitting RCM simulations which have a kilometre-scale resolution and are thus adapted to the explicit representation of the convection. However, due to the high computational costs, this kind of models are not commonly used especially for long climate simulations [4].
Three main types of convective schemes can be defined:
  • moisture budget schemes (e.g., [5]) based on the convective instability and moisture convergence to parameterize the cumulus convection [6];
  • adjustment schemes (e.g., [7,8]) using a mixing line approach for driving the actual lapse rate toward the moist adiabatic lapse rate [6];
  • mass flux schemes (e.g., [9,10,11]) aiming to calculate the interactions between cumulus ensembles and their large-scale environment, itself divided into cumulus-covered and clear-sky parts [12].
All these schemes consider a single column of the atmospheric model and their general purpose is to remove the instability of the air column to reach its equilibrium state. The main consequence of this atmospheric re-balancing is the production of precipitation, known as convective precipitation. Some convective schemes can also modify the vertical structure of humidity, temperature and wind in the free atmosphere as well as in the boundary layer [13].
As the performance of convective schemes is highly dependent on model biases and spatial resolution, successfully simulating convective precipitation amounts and patterns remains a big challenge for most of climate models, both for GCMs [14] and RCMs [15,16,17].
Wyard et al. [18] highlighted the underestimation of convective clouds and summer precipitation in the version 3.6 of the regional climate model MAR (Modèle Atmosphérique Régional) over Belgium. Despite some improvements made in the convective scheme of MAR version 3.8 [19], the underestimation of summer precipitation and clouds remains partly unsolved [20]. This is why, implementation and sensitivity tests of five convective schemes are made in MARv3.9: one convective scheme from the regional model MESO–NHv5.3.1, three convective schemes from the regional model WRF (version 3.9.1.1. from 28 August 2017) and the original scheme used in MAR. Although precipitation in Belgium has been shown to occur frequently [21,22], the dependency of simulated precipitation to convective schemes as never been assessed over this region and particularly with the MAR model.
The aim of this research is thus to assess the sensitivity of convective precipitation modelled by MAR over 1987–2017 to those five convective schemes. After a brief presentation of the area of interest, Section 2 describes MAR, the different convective schemes and the in situ evaluation data used in this research. Results are then presented in Section 3. Section 3.1. presents the comparison of the MAR results to weather station data. Section 3.2. presents the MAR sensitivity to the convective schemes by analysing the trends in total precipitation and convective precipitation over the period 1987–2017 before the discussion of the results in Section 4 and conclusion in Section 5.

2. Methods and Data

2.1. Study Area and Evaluation Dataset

Belgium (Figure 1) is mainly influenced by a temperate oceanic climate, implying that precipitation occurs year round. Prevailing winds from the South-West are responsible for the advection of moist air from the North–Atlantic Ocean and thus for most of precipitation events. Belgium is divided into three orographic zones regarding to elevation above sea level (z): Low-Belgium (z < 100 m), Middle-Belgium (100 m < z < 300 m) and High-Belgium (z > 300 m) with a highest point at 694 m above sea level. In Low and Middle-Belgium mean precipitation amount of 700–800 mm/year is measured, while precipitation amount can reach more than 1400 mm/year on the summits of Belgium [21,22]. Thunderstorms mainly occur between April and September, often originate from the South–West and are the most frequent in High–Belgium [23].
As done in Wyard et al. [18], all weather observation data used for the evaluation of MAR comes from weather stations of the surface synoptic observations network (SYNOP). These data include daily precipitation amounts and are available for 20 stations over the whole Belgian territory from 2008 to 2014 from the OGIMET web site [24]. Missing or erroneous observation data range from 3% to 16% depending on the station. The weather stations are listed with their latitude, longitude and altitude, as well as the corresponding ones from MAR in Table S1 and are pointed on Figure 1.
In addition to these in situ observations, MAR is also evaluated against the European daily high-resolution gridded Observations database (E–OBS [25]) from the European Climate Assessment and Dataset project (ECA&D). These data are based on several precipitation networks, including SYNOP and are interpolated with a three-step process on four different grids [25]. The uncertainties mainly depend on the station density [25]. Hofstra et al. [26] have shown that precipitation is over-smoothed when the station density is weak. Fortunately, Belgium has a high station density and has the lowest biases (+/−10% of the mean bias averaged over all models and all seasons identified by Lenderink [27]). ECA&D provides daily weather data (mainly temperature and precipitation) throughout Europe (e.g., [16,28,29,30]). In this paper, the version 17.0 (April 2018) of E–OBS at a resolution of 0.22° × 0.22° is used. As for the evaluation of MAR, E-OBS data are extracted from the nearest grid cell to the location of the SYNOP observations.

2.2. The MAR Model and Set-Up

Although MAR has been originally developed for polar regions [19,31,32], the model was adapted for West-European temperate regions [18,20,33,34,35,36]. The MAR model was also applied to West-Africa tropical regions where the use of a convective scheme is essential to represent the local precipitation regimes [37,38,39]. MAR is a hydrostatic primitive equation model in which the cloud microphysical parameterization is based on several studies [40,41,42,43] and is described in Gallée et al. [37]. The radiative transfer through the atmosphere is based on Morcrette [44]. The convection in the standard model configuration is parameterized according to Bechtold et al. [9].
In this study, MAR version 3.9 is used at a resolution of 10 km over a domain covering Belgium (80 × 75 pixels) for the period 1987–2017 with 4 months of spin-up. Lateral boundary conditions (temperature, pressure, wind and specific humidity) and sea surface temperature are provided every 6 h by the 3rd generation ERA–Interim reanalysis [45] available at a horizontal resolution of 0.75° × 0.75° and 60 vertical levels. The use of the ERA-Interim reanalysis is motivated by the fact that forcing MAR with this reanalysis led to the best agreement with ground-based meteorological observations over Belgium among a set of other reanalyses [18]. The spatial resolution jump between the GCM and the nested model has approximately a ratio of 8. This ratio is appropriate according to Antic et al. [46] who recommend a maximum of 12 and even according to Giorgi and Gutowski [47] who are more restrictive and recommend a maximum of 10.

2.3. Description of the Convective Schemes

The standard configuration of MAR uses the mass flux scheme of Bechtold et al. [9] (hereafter called STD or MAR–STD when used in MAR sensitivity experiments) as convective parameterization [38]. Our sensitivity study is based on the use of four other convective schemes. The first one is the scheme implemented in the version 5.3.1 of the MESO-NH regional model [48]. This scheme is also based on the Bechtold scheme but with different optimizations and parameter adjustments compared to the original convective scheme implemented in MAR for simulating convective precipitation in Africa [38]. This scheme is called MES hereafter or MAR-MES when used in MAR sensitivity experiments. The three other schemes come from the version 3.9.1.1. of the WRF model described by Skamarock et al. [49]:
  • the adjustment convective scheme of Betts-Miller-Janjić [7,8] (called BMJ or MAR-BMJ in MAR sensitivity experiments;
  • the mass flux scheme of Kain-Fritsch [10] (called KFS or MAR–KFS in MAR sensitivity experiments);
  • the modified Tiedtke mass flux scheme [11,50] (called NTK or MAR–NTK in MAR sensitivity experiments).
These three convective schemes have been widely used and exhibit overall good results over Europe [51,52,53] while NTK seems to be the most suitable for intense convective systems [54,55]. However, there is no consensus in the performance of these schemes. For example, Evans et al. [56] and Ratna et al. [57] show that BMJ and KFS produce good precipitation patterns respectively in South–East Australia and in South Africa but they both tend to overestimate precipitation amounts while it is the opposite in Madala et al. [58] over South East of India. Although Ratna et al. [57] show that BMJ is closest to the observed precipitation amount than KFS, Pohl et al. [59] show exactly the opposite over the equatorial east Africa and Ishak et al. [60] show better performance for KFS during summer and for BMJ during winter over Southwest England. It appears that none of the convective schemes performs systematically better than the others but instead depend on the region, the season or the model configuration, as concluded by Ishak et al. [60]. This study pointed that it is essential to identify the best convective scheme for each given region and each given period.

3. Results

3.1. Evaluation with In Situ Observation of Precipitation

This section presents the statistics of the mean annual precipitation amount and monthly biases, as well as the monthly normalized root mean square error (NRMSE) and associated monthly correlation coefficient (R) computed on daily value.
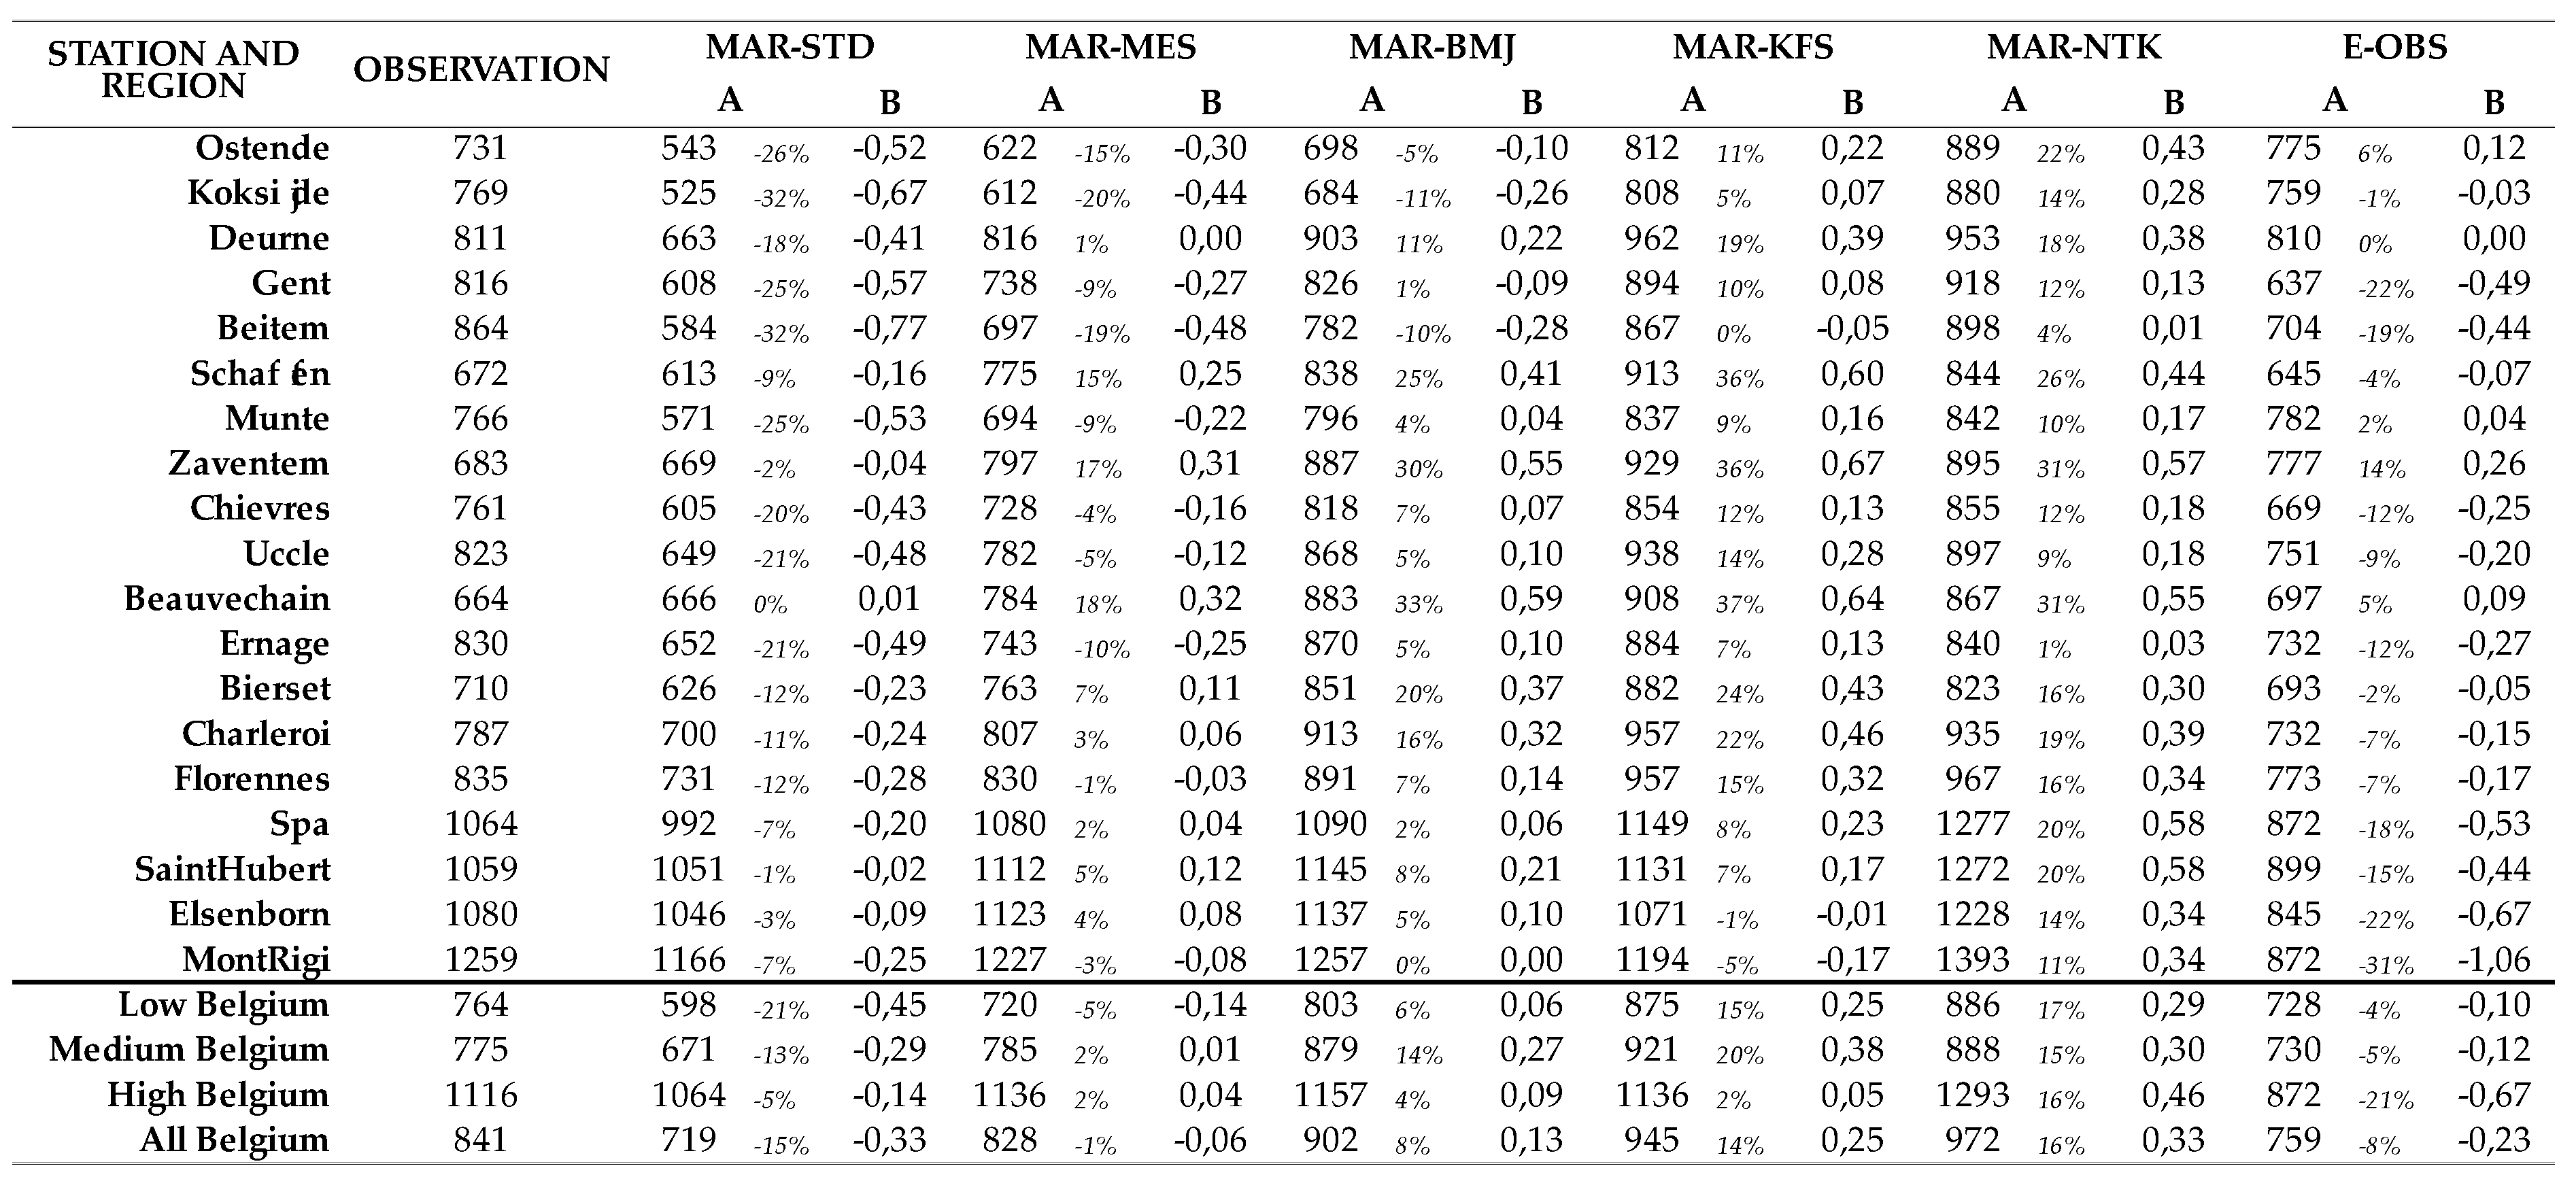
At the annual time scale (Table 1), MAR–STD underestimates precipitation for almost all stations. The smallest biases are obtained for the stations in High-Belgium while the largest biases occur for the stations in Low-Belgium. Results are similar for both MAR-MES and MAR-BMJ, except that their biases are generally smaller for the stations in Low-Belgium and slightly larger in High-Belgium compared to MAR-STD. For these three simulations, at an annual time scale, most of the annual biases range between −33% and +33%. The annual biases of the E-OBS data are larger for the stations in High-Belgium than in Low and Medium Belgium where E-OBS data compares better than MAR. Such biases in High-Belgium are explained by the coarse resolution of the E-OBS data which does not correctly represent the elevation-driven precipitation gradient between Low-Belgium and High-Belgium. Regarding the average biases for each region, MAR-MES has the lowest one while MAR-KFS and MAR-NTK present the largest biases. MAR-STD follows the same regional behaviour as when comparing it to individual stations: it has the lowest biases over High-Belgium and the largest ones over Low-Belgium.
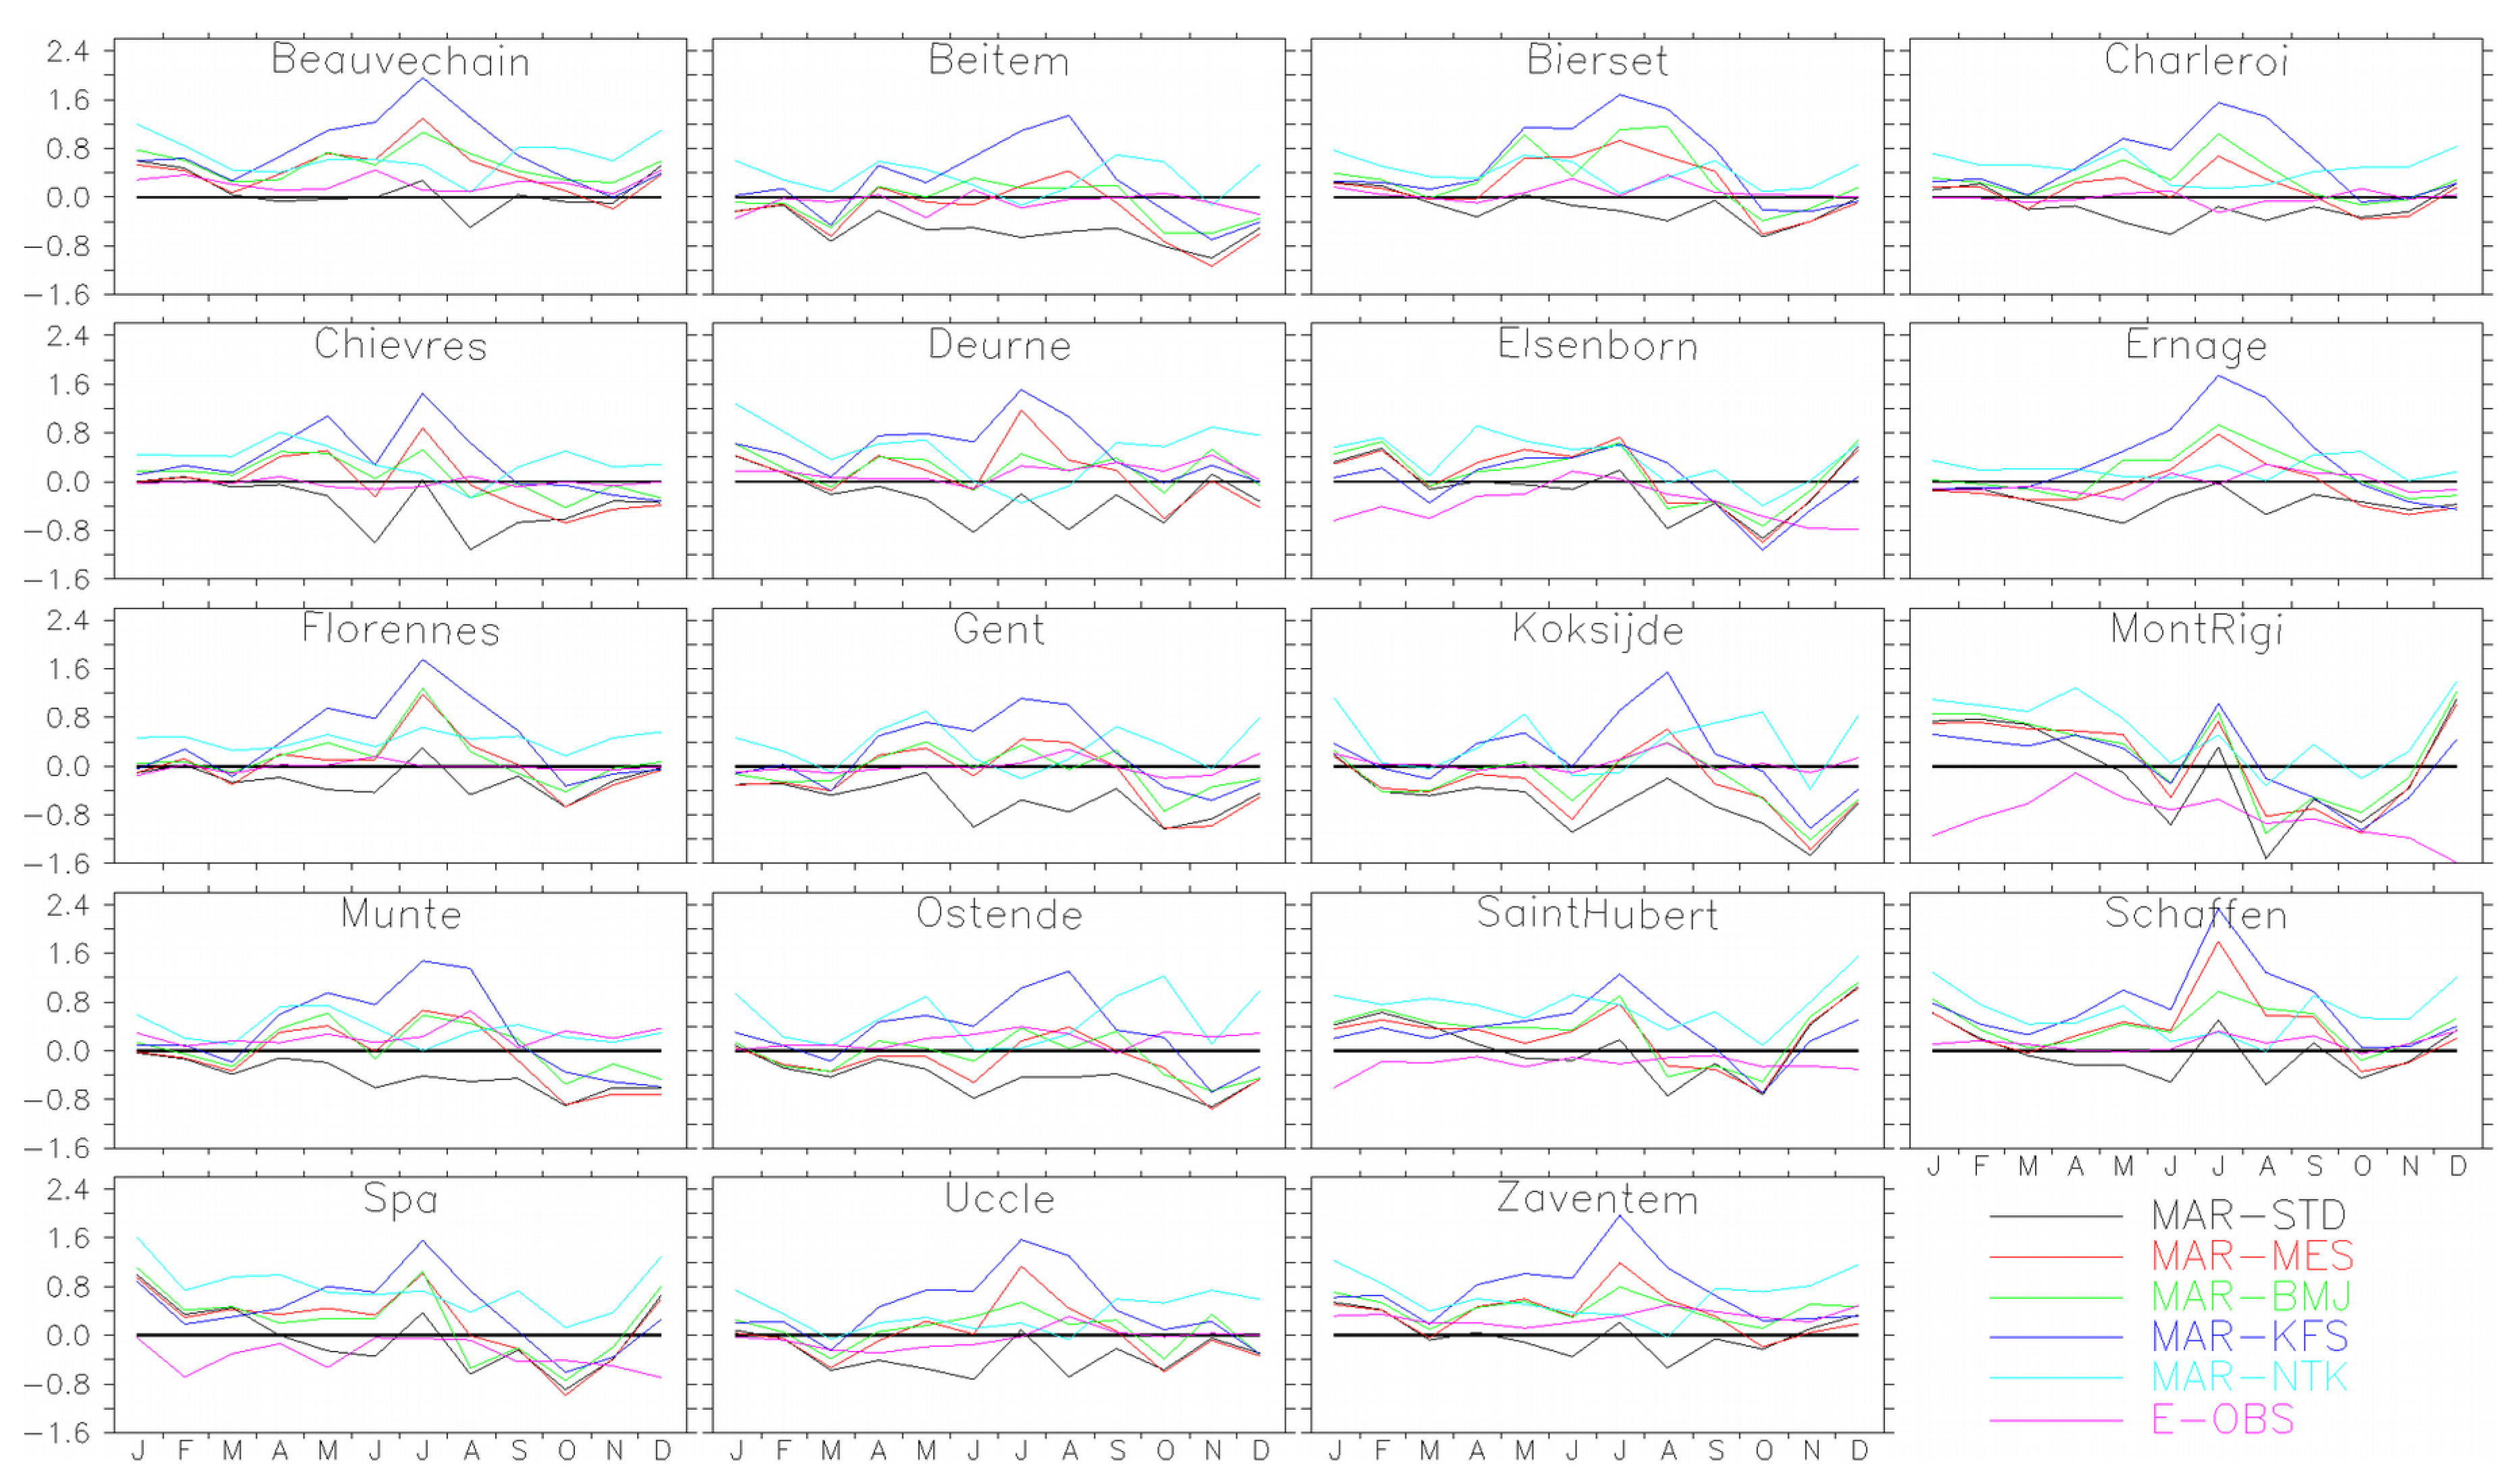
At the monthly scale (Figure 2), MAR-STD underestimates precipitation year round for all stations except in summer at some stations (e.g., Beauvechain, Schaffen, Spa). This is the opposite situation for MAR-NTK with almost always positive or close-to-zero biases all around the year for most stations. MAR-BMJ, MAR-MES and MAR-KFS have a weak bias in winter but they overestimate precipitation in summer.
In summer, the largest biases are simulated by MAR-KFS and to a lesser extent by MAR-MES and MAR-BMJ, in comparison to the MAR-STD simulation which shows no clear seasonality in its biases.
It is interesting to note that the NRMSE (Figure S1) of the E-OBS data is generally close or a bit lower (less than 2 mm/day) than the NRMSE of the different MAR simulations except in winter when MAR gives better NRMSE results than the E-OBS data, in particular at Mont Rigi. This is probably linked to the coarse resolution of the E-OBS data compared to MAR whose pixel containing Mont Rigi station is closer to the real elevation.
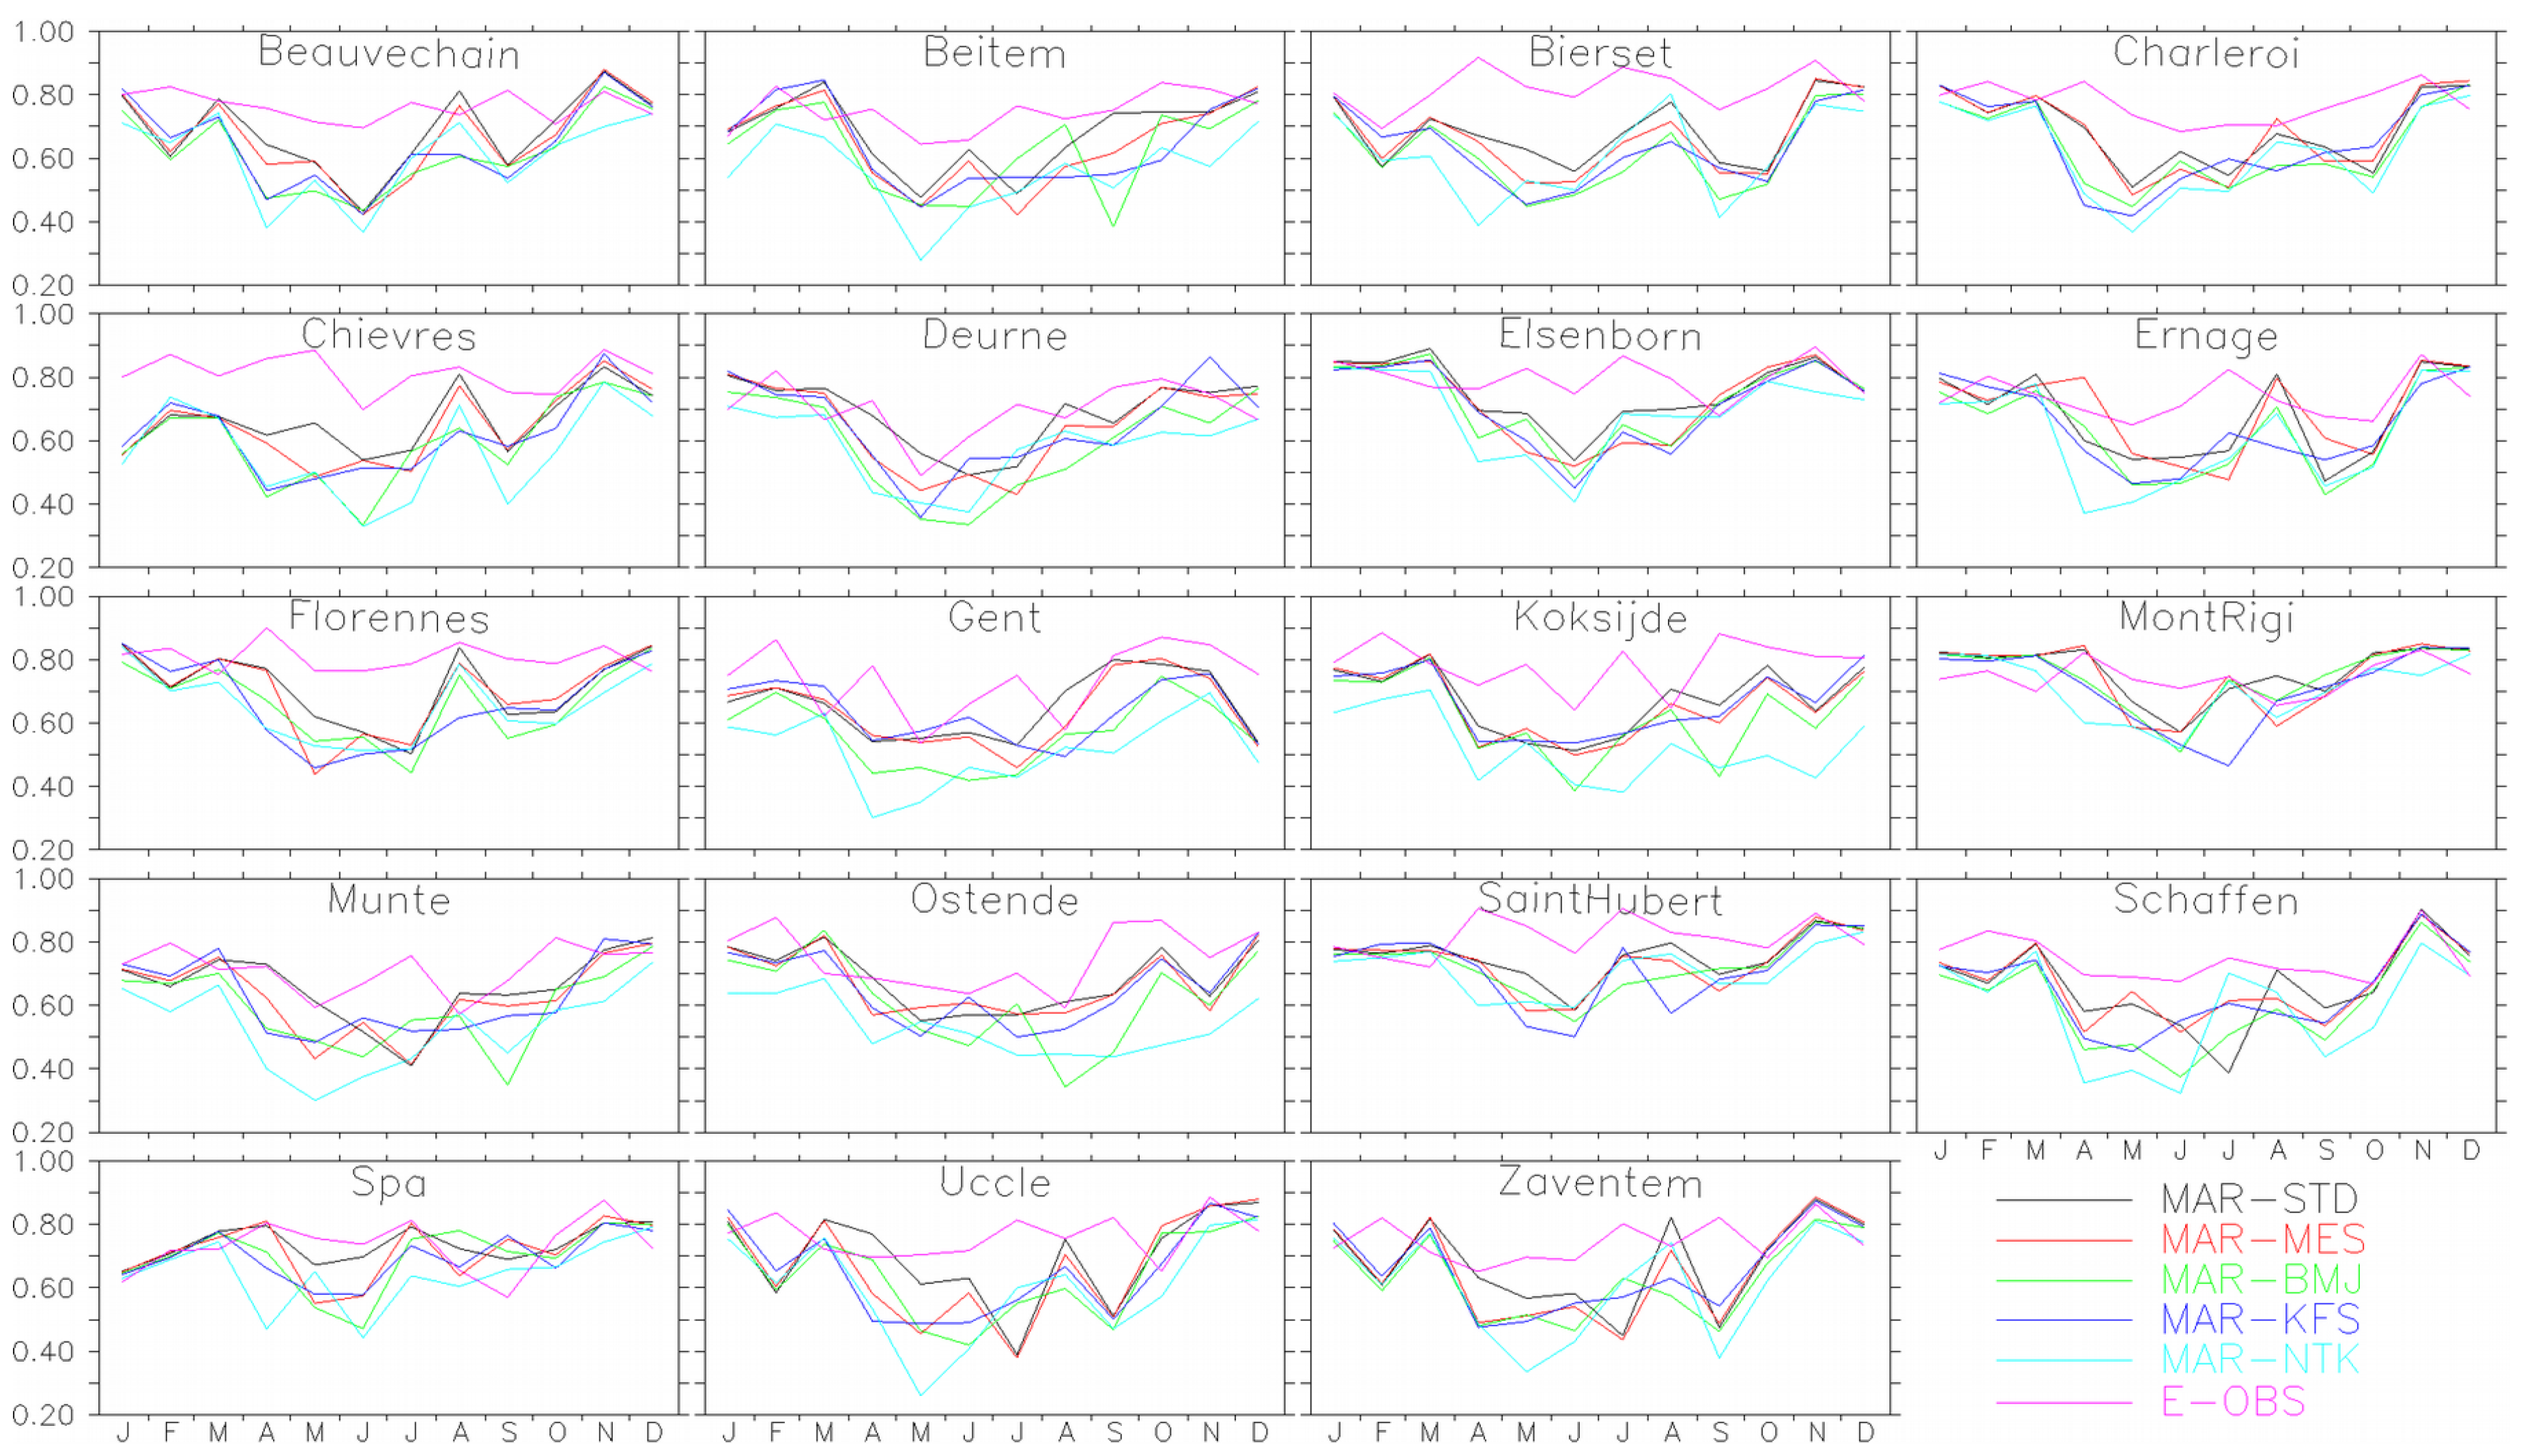
During winter for all schemes and for all stations (Figure 3), R is between 0.7 and 0.9 with respect to daily measurements. In summer, R drops to values between 0.5 and 0.7. MAR-STD, MAR-MES and MAR-KFS present similar correlations while MAR-BMJ and MAR-NTK show weaker performances. In winter and spring, these simulations are close to the three others but in summer and autumn, their R values are rather lower than 0.5.
For the E-OBS data, as for the NRMSE analysis, R values are not better than for the MAR simulations in winter. But in spring and summer, E-OBS data are significantly better correlated to daily observations than MAR with R values around 0.8.
When analysing each region, Figures S2 and S3A shows that all experiments fit better for High-Belgium in contrast to E-OBS which fits better over Low and Medium Belgium. In Figure S2, the interception with the 0–1 line occurs from 1 mm for MAR-STD, around 2 mm for MAR-MES and MAR-BMJ, between 3 and 4 mm for MAR-KFS and 3.5 mm for MAR-NTK except for High-Belgium where MAR-NTK clearly overestimates for all the observed values.
MAR-STD (and MAR-MES to a lesser extent) shows the lowest values for NRMSE (Figure S3B) and the highest for R values (Figure S3C) while this is the contrary for MAR-NTK and MAR-BMJ to a lesser extent. For NRMSE (Figure S3B) and R values (Figure S3C), E-OBS shows nevertheless the best agreements with the SYNOP data than all our experiments for all regions.
Two main conclusions can be drawn in this section. Firstly, all statistical indicators show that for all convective schemes MAR performs systematically better in winter than in summer. The implementation of new convective schemes does not improve the comparison suggesting that the convective scheme is likely not the source of the MAR misleading in summer. In winter, the MAR performance is even better than E-OBS data. However, it should be noted that the model data are compared with observational data that are not free from errors. This may explain some large abnormal differences that can be found for a given station but not for the others (for example the station of Spa shows the worst values for biases, NRMSE and R for the month of January compared to the other stations where results are better for the three statistical indexes). In addition, the comparison between model results and observational data can lead to increase biases due to the isolated measurements of weather variables. This is especially the case in summer when precipitation is more convective and thus more localized in time and space (see Appendix A which illustrates two study cases of this issue). Secondly, MAR-STD, MAR-MES and to a lesser extent MAR-KFS compare the best with observations. However, MAR-STD tends to underestimate precipitation, especially over Low-Belgium where MAR-MES tends to slightly overestimate precipitation compared to observational data.

3.2. Changes in Precipitation over 1987–2017 in Belgium

After a brief comparison of the annual precipitation between MAR simulations and observations and its intra annual variability, this section focuses on convective precipitation to assess the part of convective and stratiform precipitation in comparison to the different convective schemes and E-OBS data. Finally, the discrepancies in simulating extreme precipitation following the convective scheme are analysed. Extreme precipitation is defined here as the annual value of the 95th percentile of daily precipitation. For each of these indicators, the linear trends are calculated according to the convective scheme and E-OBS data over the period 1987–2017. The trend significance is assessed following the uncertainty range of Snedecor for the 95th confidence interval as described in Wyard et al. [18].

3.2.1. Annual Precipitation

The annual mean precipitation amount simulated by MAR over 1987–2017 (Figure 4) shows the same pattern for each scheme but with different precipitation amounts. MAR-STD simulates the lowest precipitation amounts (from 600 mm to 1150 mm) while MAR-NTK simulates the largest amounts (from 800 mm to 1400 mm). Compared to the E-OBS gridded observations, MAR-MES compares the best (from 700 mm to 1200 mm) while MAR-STD underestimates the E-OBS amounts. Finally, MAR-BMJ, MAR-KFS and MAR-NTK overestimate them. However, concerning High-Belgium, Section 3.1. shows that E-OBS underestimates the precipitation amounts while MAR-STD and MAR-MES compare the best.
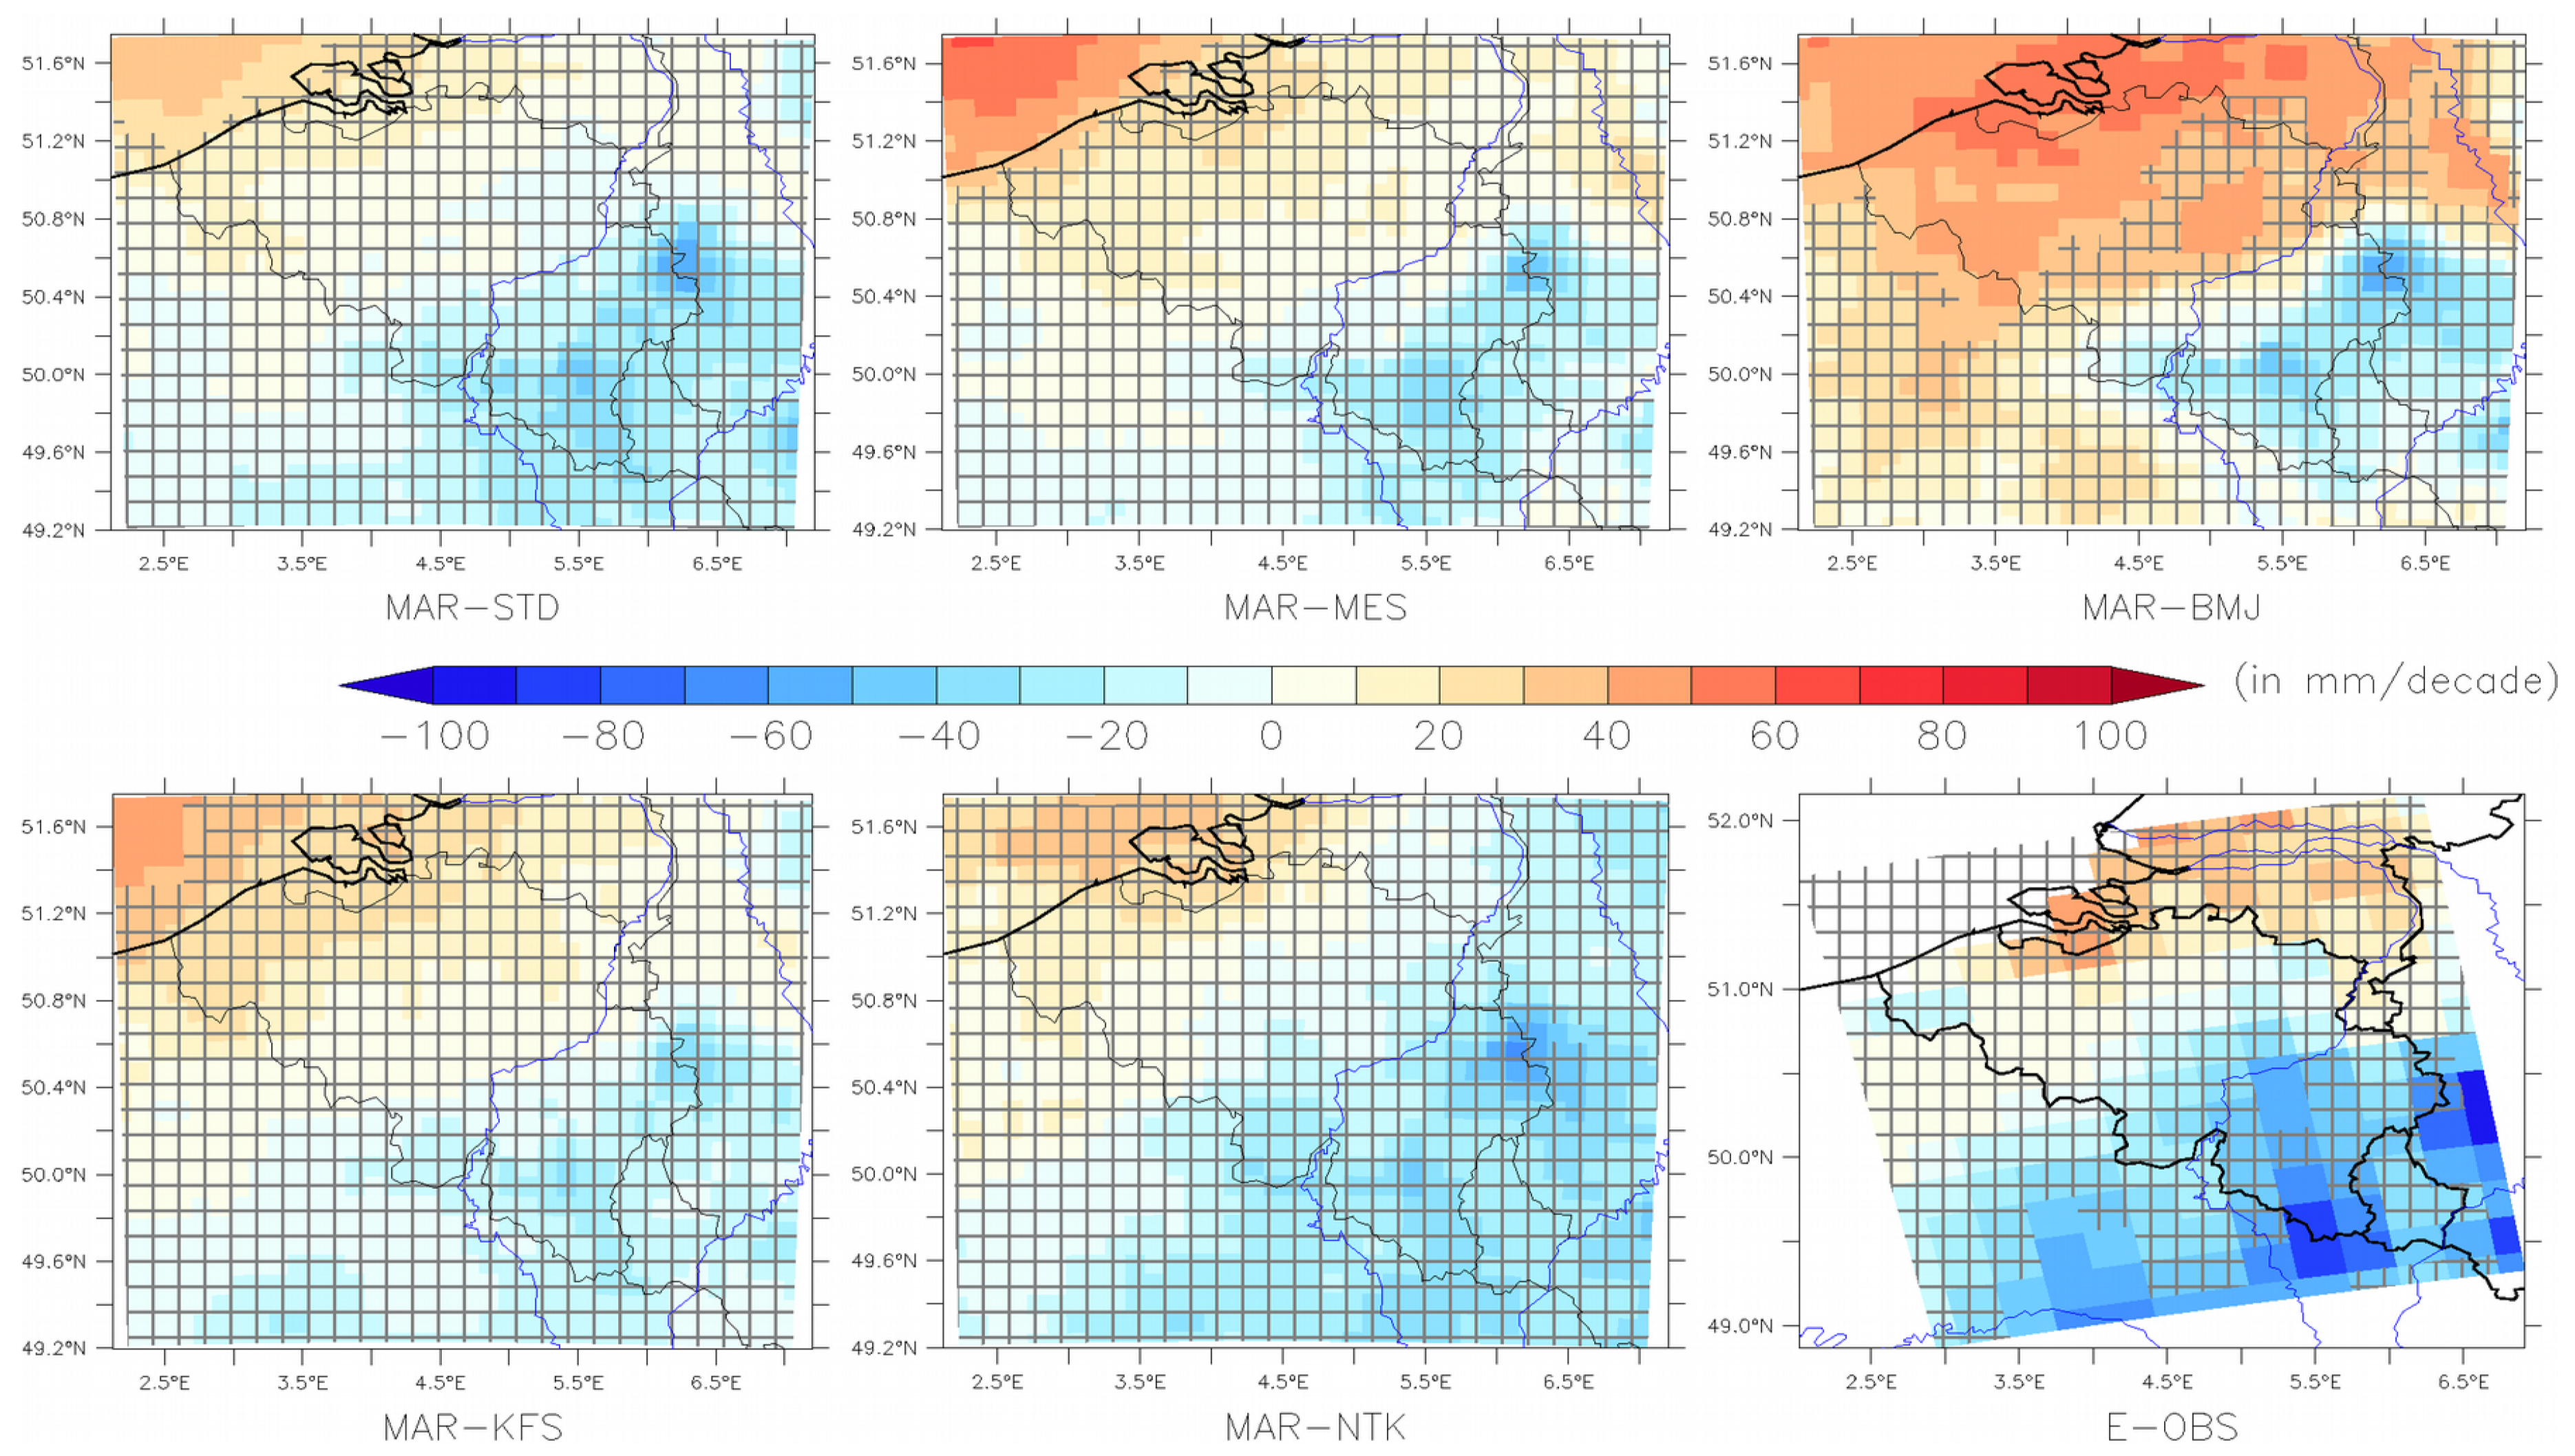
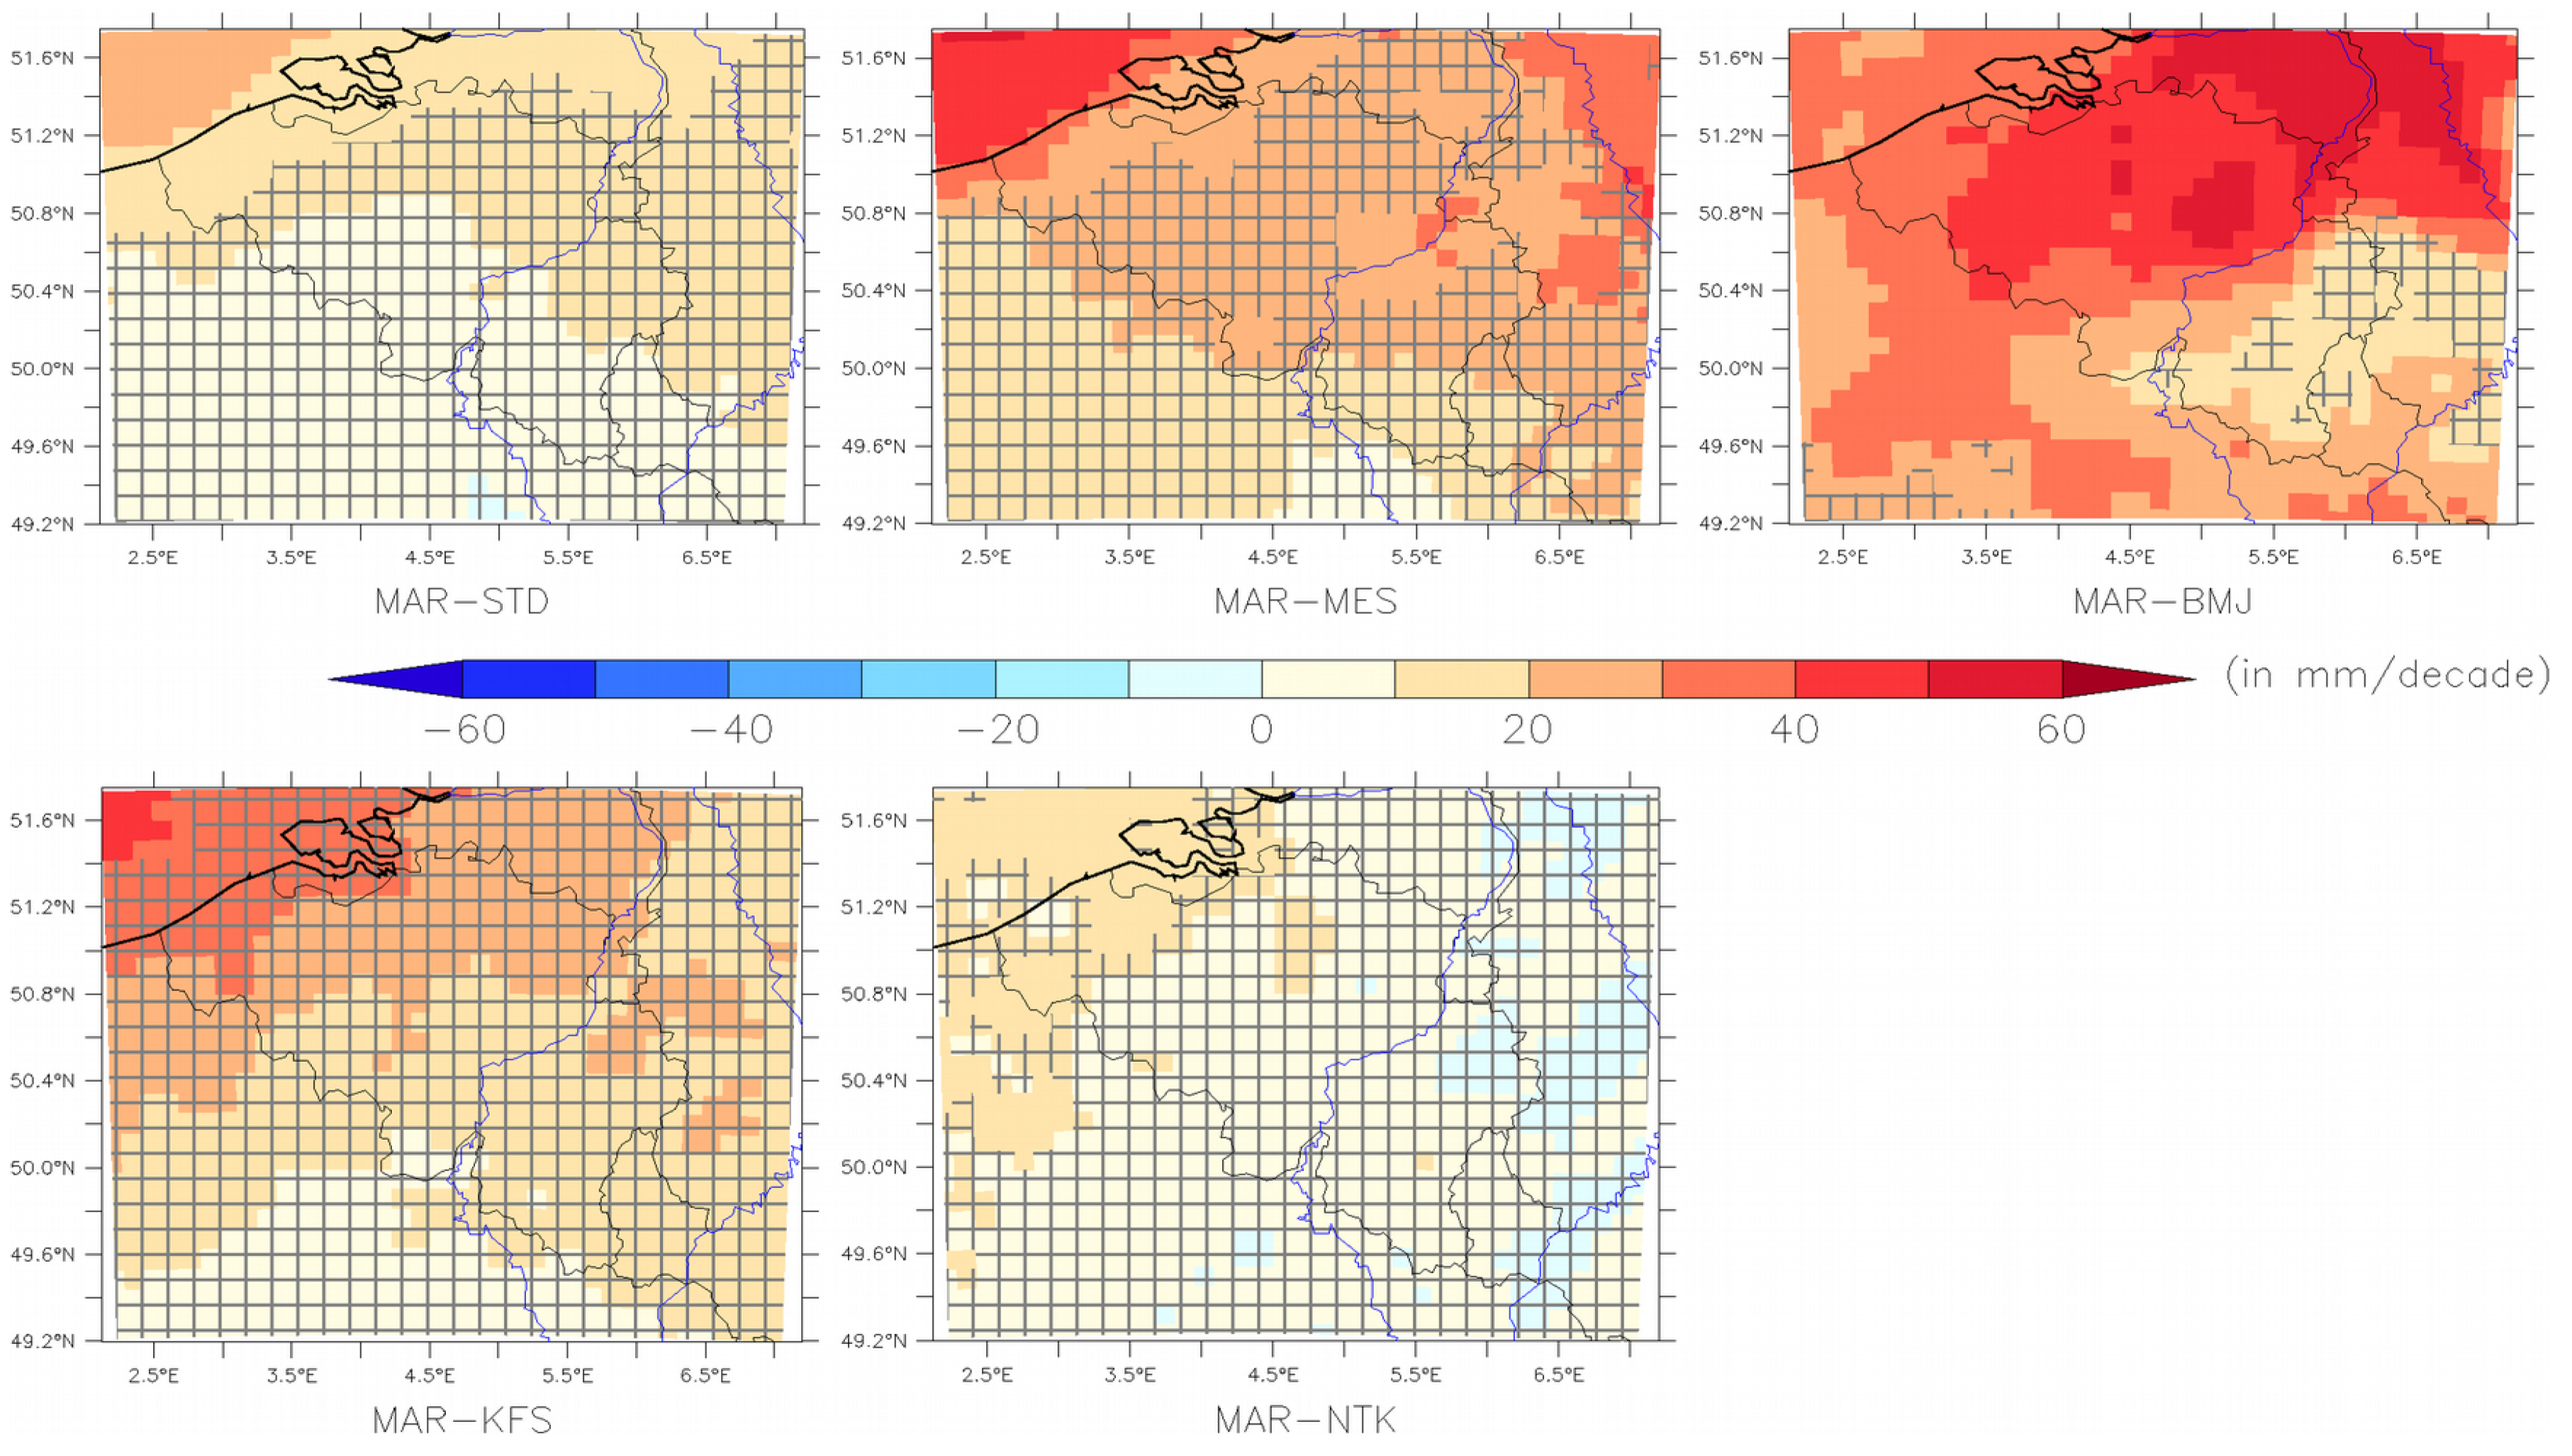
According to MAR, the annual precipitation amount (Figure 5 and Figure S4) does not show any significant trend over Belgium except over the North Sea where a significant increase (+20 to +60 mm/decade) is simulated in MAR-STD, MAR-MES and MAR-BMJ (which also shows a significant trend over the northern half of Belgium). Although E-OBS have no information over the sea pixels, the nearest shore grid points also reveal a positive trend (+30 mm/decade) even if it is not significant. On the other hand, the E-OBS data show a significant decreasing trend over High Belgium (−50 to −80 mm/decade) and the surrounding regions to the east and to the south. The five MAR experiments suggest a non-significant decreasing trend in High Belgium.

3.2.2. Convective Precipitation

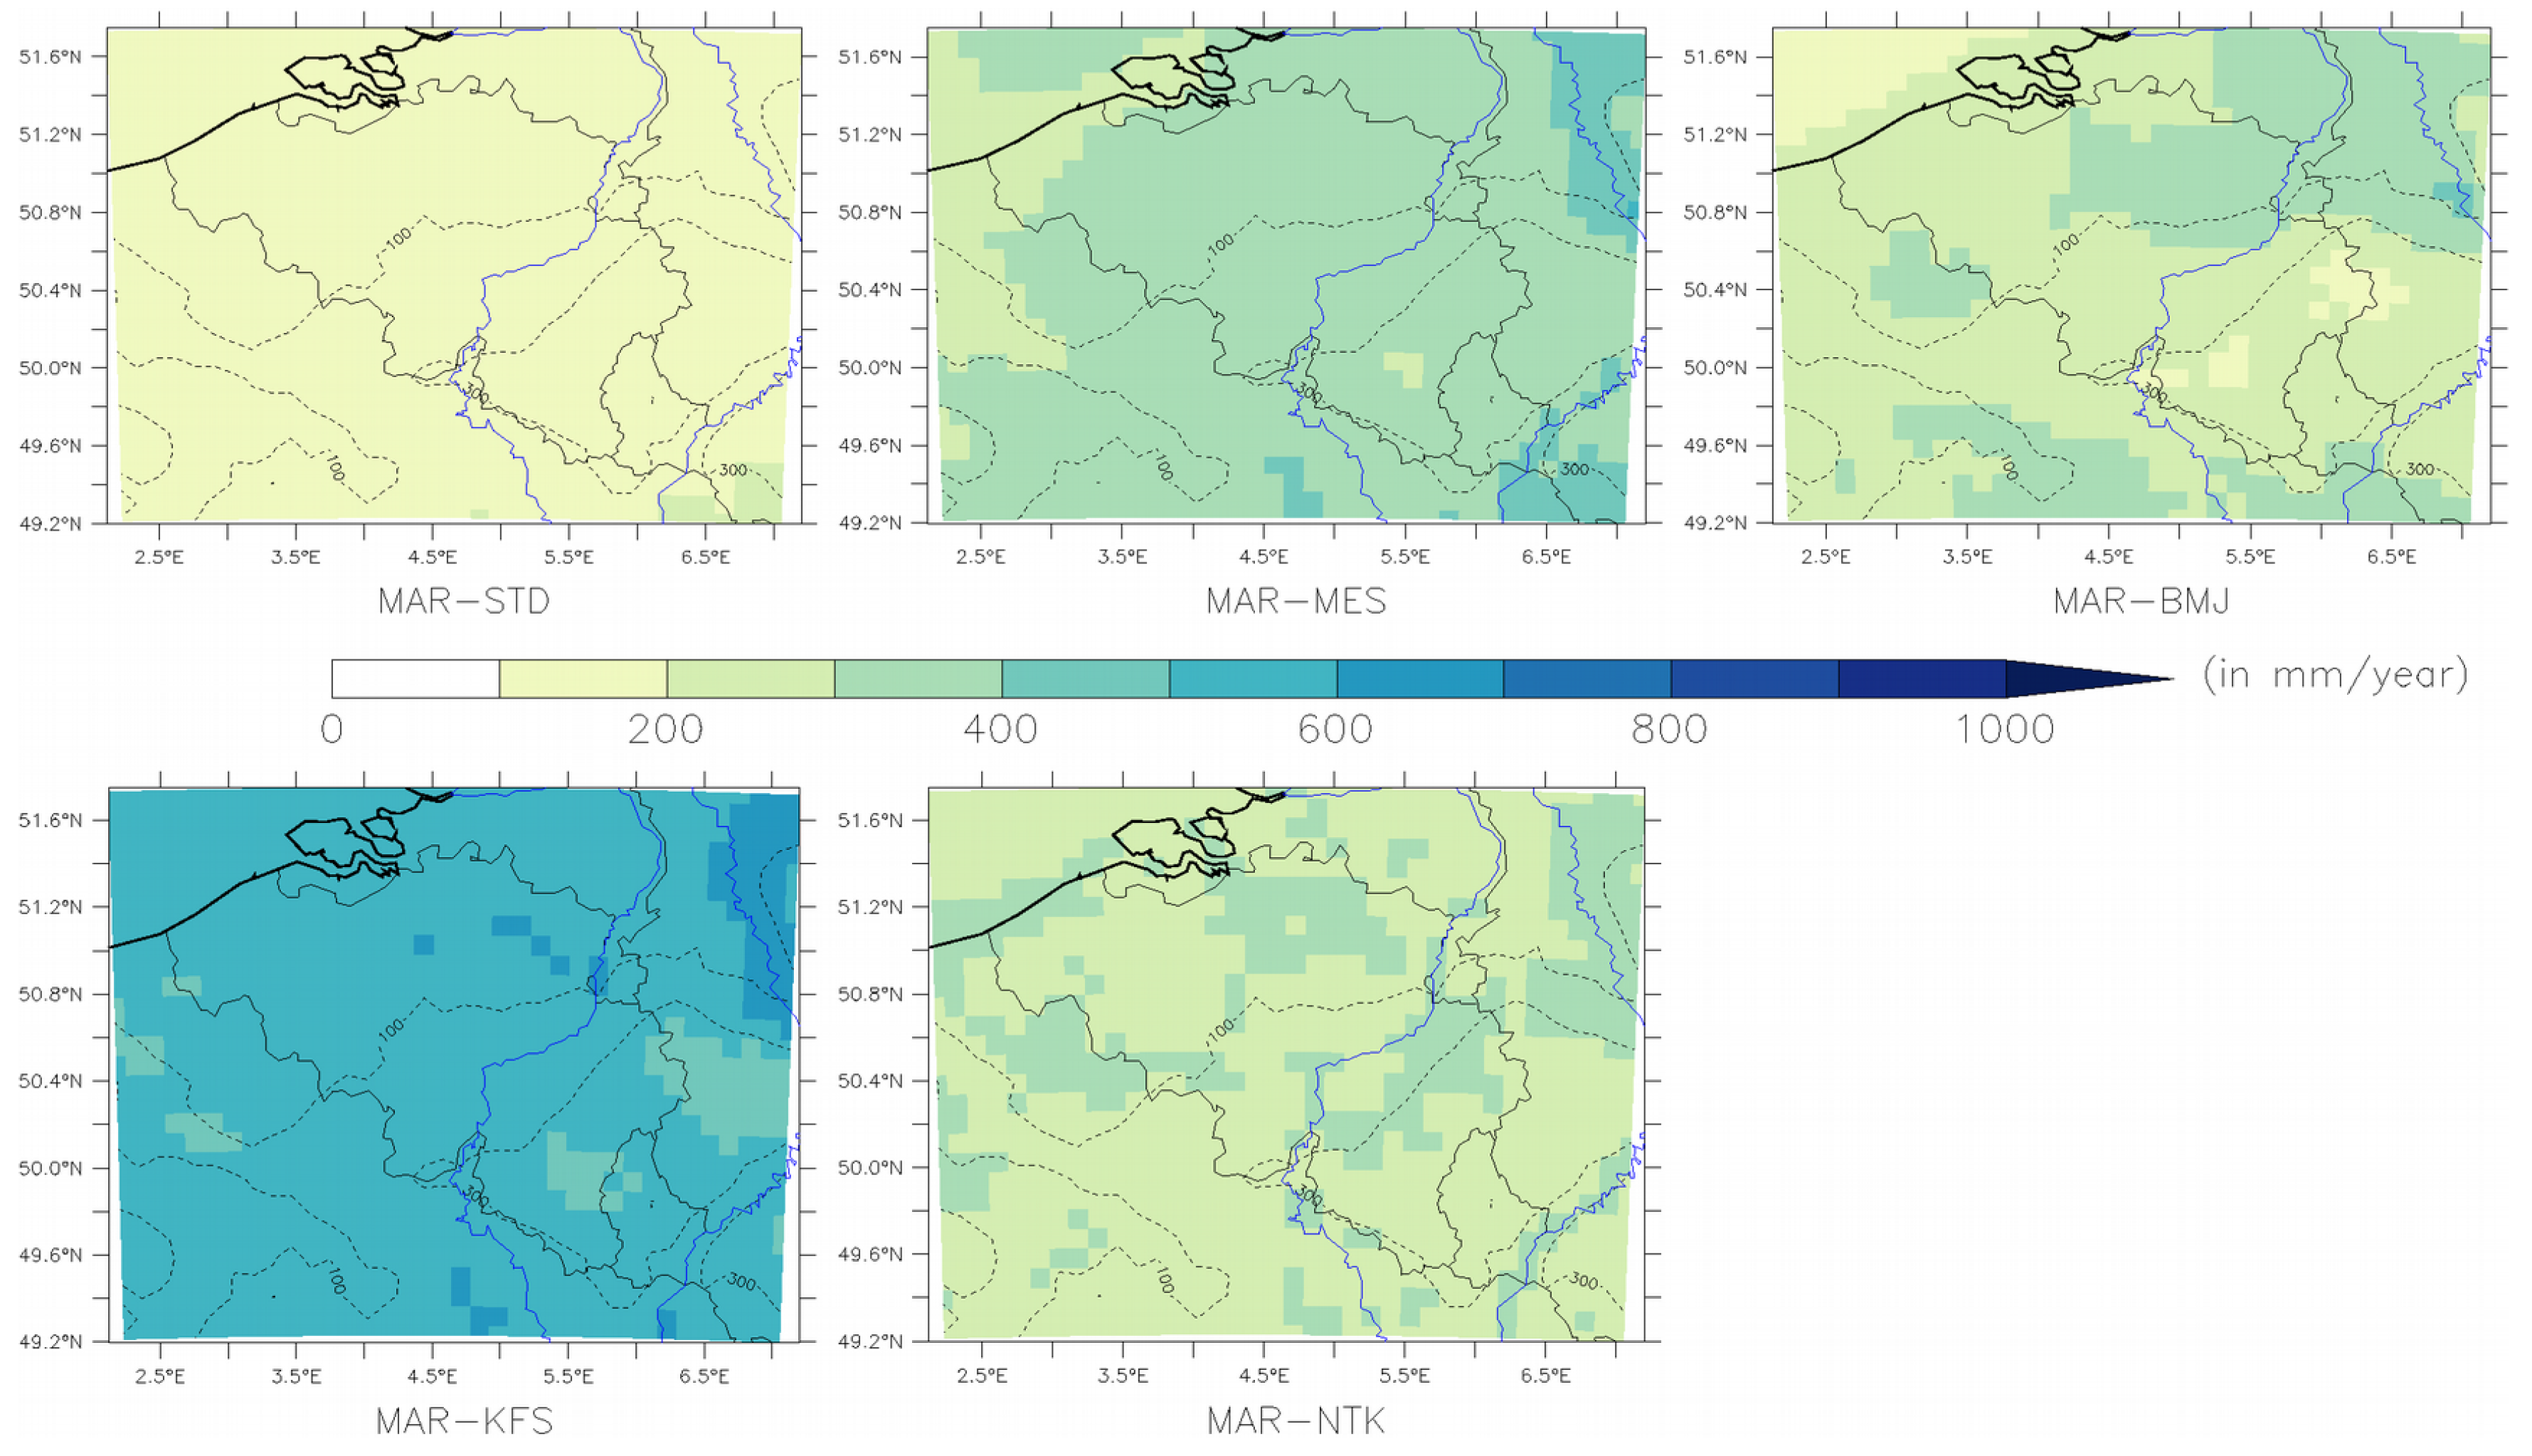
The annual mean convective precipitation over 1987–2017 differs significantly from one experiment to another as shown in Figure 6. MAR-STD simulates an amount of convective precipitation of about 120 mm/year (in Low Belgium) to 160 mm/year (in High Belgium), while the other runs simulate greater precipitation amount compared to MAR-STD: +150 mm/year for MAR-MES, +150 mm/year for MAR-BMJ except over the High Belgium, +350 mm/year for MAR-KFS and +100 mm/year for MAR-NTK. Unfortunately, the E-OBS data (or any other observation based dataset) do not allow a distinction between convective and stratiform precipitation.
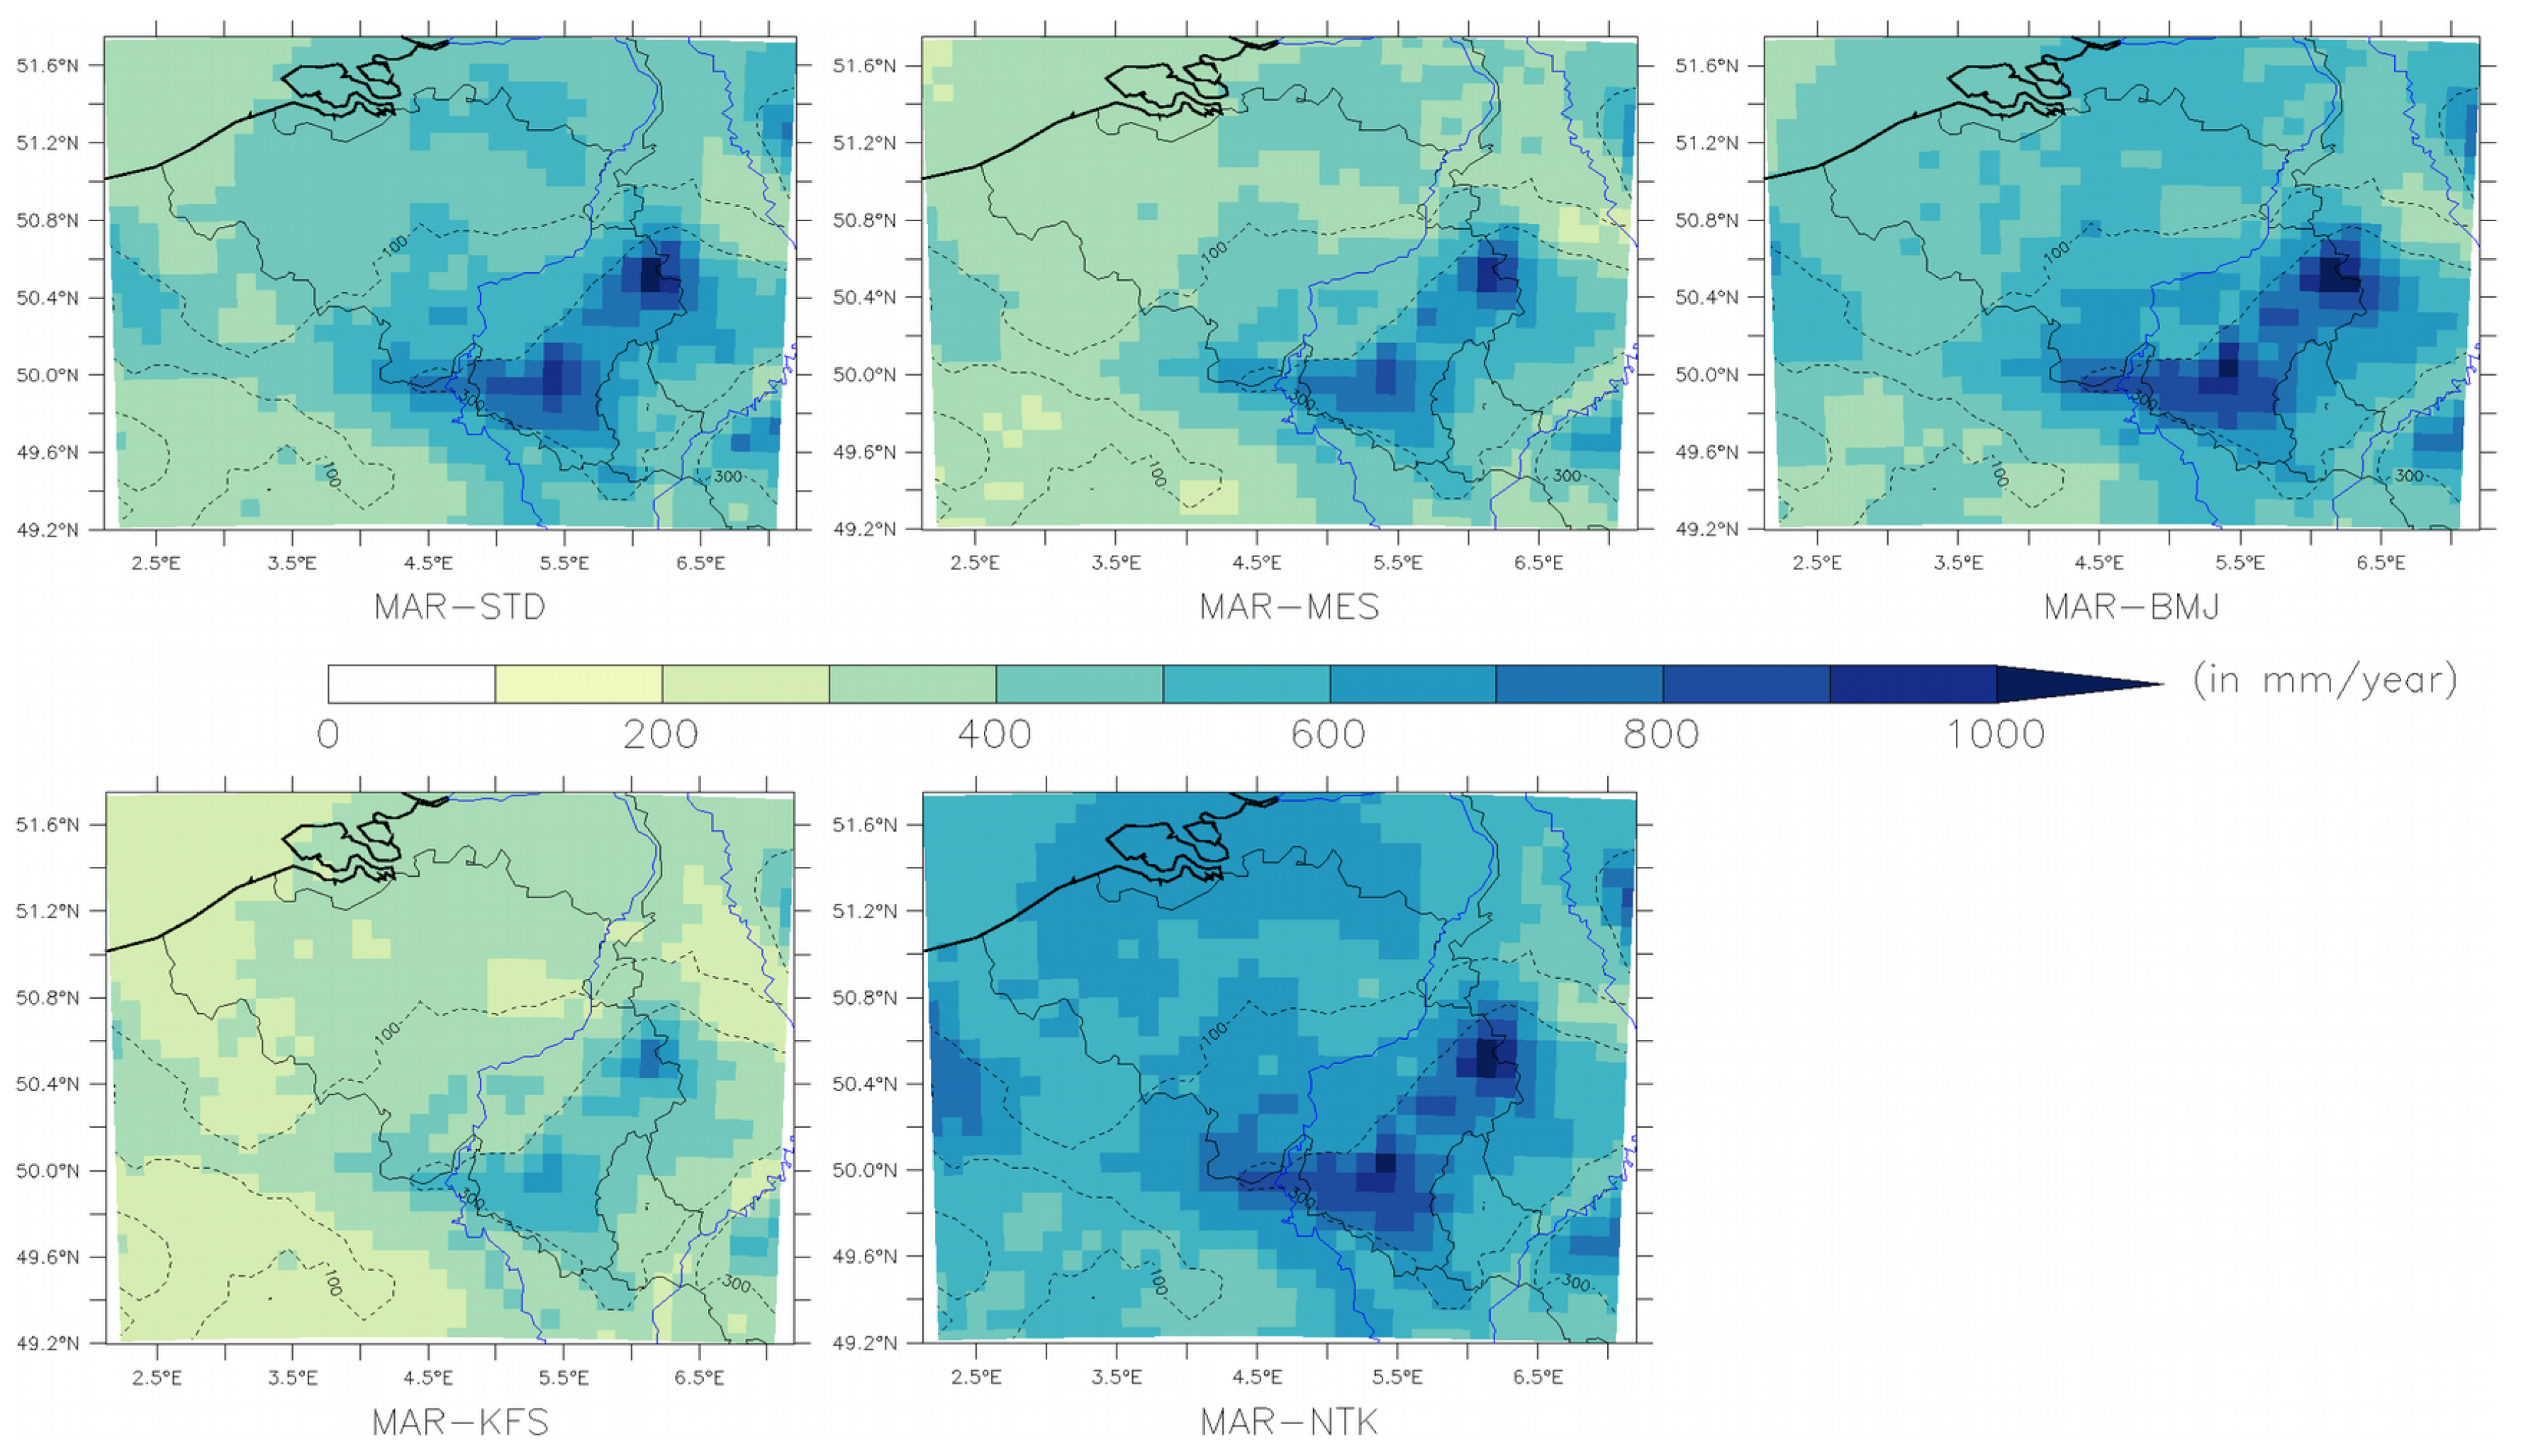
Beyond this general increase in convective precipitation in the different model configurations, it is interesting to note that stratiform precipitation reacts also differently. As shown in Figure 7, MAR-BMJ and MAR-NTK simulate more stratiform precipitation compared to the MAR-STD while the opposite stands for MAR-MES and MAR-KFS.
The mean annual convective precipitation amount (Figure 8 and Figure S5) significantly increases over and near the North Sea in all MAR simulations with the highest ranges in MAR-MES, MAR-BMJ and MAR-KFS (between 20 to 40mm/decade).
Unfortunately, all these trends of convective precipitation cannot be corroborated by any observational data. Nevertheless, MAR simulations globally agree on the signal trend but not on the absolute values.

3.2.3. Extreme Precipitation

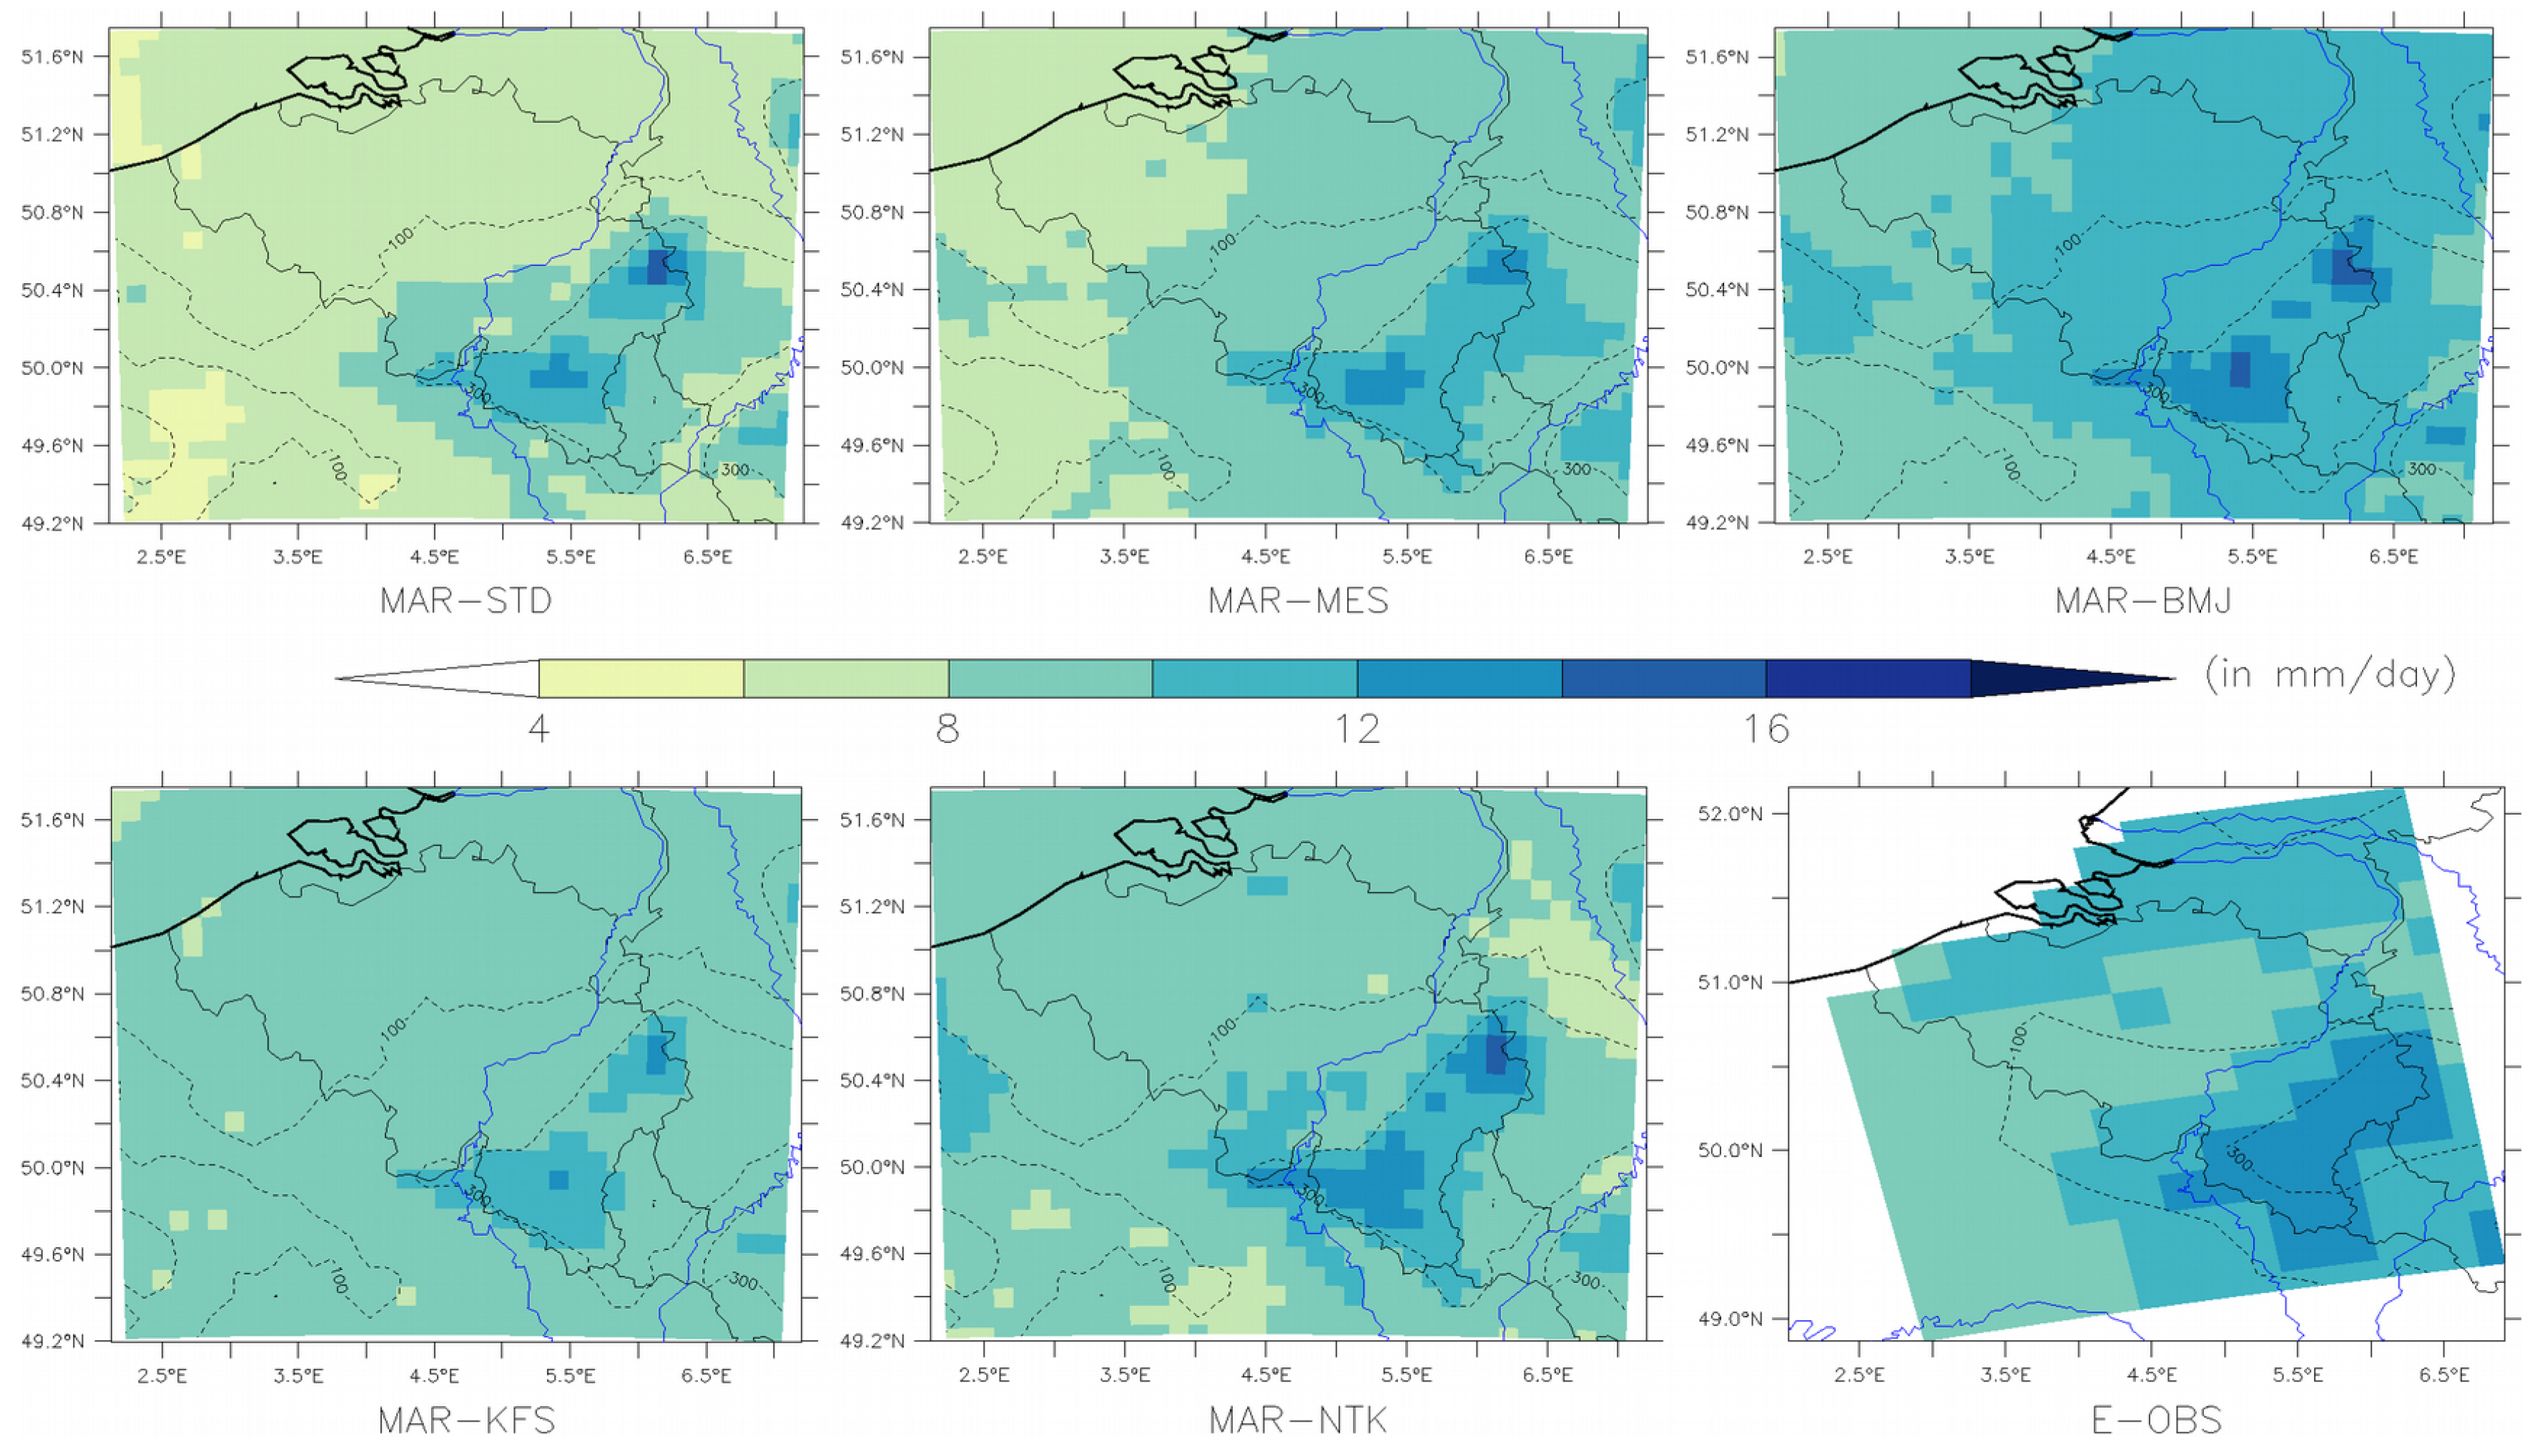
All MAR simulations (except MAR-KFS) are in agreement with the average 95th percentile from the E-OBS data for High Belgium over 1987–2017 (Figure 9) with values between 13 and 16 mm/day while MAR-KFS simulates lower percentiles. For Low and Medium Belgium, MAR-STD underestimates the 95th percentile, while MAR-MES, MAR-KFS and MAR-NTK compare better. The best agreement occurs with MAR-BMJ.
The 95th percentile of daily precipitation simulated (Figure S6) by MAR-STD, MAR-MES, MAR-BMJ and MAR-NTK show significant positive trends (+0.5 to +1.5 mm/decade) over the North Sea while for High Belgium, all simulations agree on a decreasing trend of the 95th percentile of daily precipitation in agreement with the E-OBS data (Figure S7). The majority of the increase in precipitation in the North Sea and the decrease in High Belgium may therefore result from the above mentioned changes in intense precipitation quantities (Figure 5).

4. Discussion

Three main results can be drawn. Firstly, MAR suggests an increase in precipitation over the North Sea as a result of an increase in the amounts of extreme precipitation in agreement with the coastal pixels of E-OBS and previous studies [61,62]. According to Joyce [63] and Sherman et al. [64] showing that the North Sea is one of the region of the North Atlantic Ocean with the highest warming over the last 25 years, these changes are mainly due to the increase of sea surface temperature providing more moisture and heat to the atmosphere favouring the development of convective precipitation.
Secondly, both MAR simulations and E-OBS show a decrease in the amount of precipitation over High Belgium as a decrease in extreme precipitation. Willems [65] and Wyard et al. [18] stated that extreme precipitation trends are highly dependent on the studied periods because they undergo multidecadal oscillations. These authors showed that from 1980 to 2000, Central Belgium was in a phase of increasing extreme precipitation amount, before entering a decreasing phase after 2000. It is possible that the negative trends calculated in High Belgium are more an artefact highly dependent on the considered period rather than on a real climate change in High Belgium. During the 20th century, Moberg et al. [66] found that winter precipitation has increased over Europe but without an increase in extreme precipitation. As for summer precipitation, the same authors state that it has not undergone any significant change throughout Europe. Finally, several studies (e.g., [18,67,68,69,70]) have shown increasing trends of extreme precipitation in Belgium but these trends only concern recent periods, highlighting the necessity to have longer time series to detect more robust changes in precipitation.
Thirdly, all the sensitivity experiments show the same behaviour and approximately the same trends confirmed by the E-OBS data, there are discrepancies in quantities between each experiment:
  • MAR-STD simulates the smallest precipitation amounts, for both total annual precipitation and convective precipitation;
  • MAR-NTK simulates the largest total annual precipitation while MAR-KFS simulates the largest contribution of convective precipitation;
  • MAR-MES behaves in the same way than MAR-STD but produces more mean annual precipitation, which being thus more in agreement with E-OBS than MAR-STD;
  • MAR-BMJ seems to perform better for extreme precipitation events. This suggests that the BMJ scheme is more reactive to extreme precipitation than the other schemes. In contrast, the STD and MES schemes, which are the original convective schemes implemented in MAR, are better on average.
MAR-STD and MAR-MES fit slightly better the observations as well as the E-OBS data, most likely because the STD and MES schemes are the original convective schemes used in the MAR model, whose compensation for unknown errors (inherent to any climate model) is itself calibrated on the original MAR configuration. In contrast, MAR-NTK shows the largest total annual precipitation, probably because this convective scheme was originally developed for a GCM and particularly for the equatorial region [11]. Zhang et al. [50] adapted this scheme for a RCM but they recognize that it produced more intense shallow convection and thus leads to more precipitation than other convective schemes such as BMJ. In general, each convective scheme has particular parameters or reference profiles for BMJ, defined by the authors in order to have the best results with their models for a specific configuration. Even if certain studies tried to have experimental results reproducible as written by Janjić [8], it is normal that results change when using another model than the experimental one. As introduced in Section 2.3, results clearly show that no convective scheme performs systematically better than the others and that the results are extremely dependent on the internal configuration of the model [52,60]. Despite these individual results, all experiments show that the trends are similar, which suggests that it would be interesting to use all these experiments as part of a model ensemble, as already proposed by Pieri et al. [53] and Cortéz-Hernàndez et al. [71].
These sensitivity experiments show that none of the schemes enable an improved representation of the observed rates, amount and location of convective precipitation compared to the others. However, it should be noted that quantifying precipitation from observations is a challenging task since ground-based observations are isolated measurements and convective storms are isolated phenomena. If the convective storm passes nearby the weather station but not exactly above, no precipitation is recorded neither in the SYNOP station nor in the E-OBS data. In addition, the gridding procedure of E-OBS could also filter extreme precipitation events. Two case studies (Appendix A) illustrate these problems.
As a synthesis, the observation from weather stations or any gridded data coming from these weather stations, need to be considered with caution for model evaluation, as the convective precipitation is very localized in space and time. Using other supplementary sources of data (such as radar or satellite data) to compare these convective precipitation can provide additional information.
Moreover GCM driving the lateral boundary conditions of the RCM play an important role in the assimilation of a convective event into the RCM. As the convective event is localized in space and time, if this event occurs during the time interval between two forcings of the RCM, neither the location of the event nor the associated precipitation amount could be reproduced. Consequently, the driving conditions, particularly the driving data update frequency and the spatial resolution of the large scale forcing have a significant influence on the representation of precipitation by the RCM, as shown in Frigon et al. [72] and Gao et al. [73].

5. Conclusions

The aim of this study was to assess the sensitivity of MAR to different convective schemes and to determine whether trends in the evolution of convective precipitation exist over the period 1987–2017 in Belgium. Since MARv3.8 has difficulties to simulate summer precipitation [18], four convective schemes have been implemented in MARv3.9: the Bechtold scheme [9] from the MESO-NH model, the Betts-Miller-Janjić scheme [7,8], the Kain-Fritsch scheme [10] and the modified Tiedtke scheme [11,50]. These five configurations of MAR were forced by the ERA-Interim reanalysis and compared, on the one hand, to the SYNOP daily precipitation amount observations and, on the other hand, to the E-OBS gridded data from the ECA&D network. This evaluation led to the following results:
  • The MAR simulations are in better agreement with the SYNOP weather station observations than the gridded E-OBS data during autumn and winter when stratiform precipitation is dominant and explicitly simulated by MAR. This is the opposite during summer when convective precipitation is dominant. The two configurations of MAR using the Bechtold scheme (MAR-STD and MAR-MES) both give the best results compared to the three other configurations.
  • The MAR simulations show a significant increasing trend of the mean annual precipitation amount during years 1987–2017 over the North Sea and the coastal regions as corroborated by E-OBS. This increase is most likely due to an increase in convective precipitation over the same period as a result of a warming of the sea surface temperature favouring the formation of convective systems.
  • The MAR simulations also show a significant decrease in precipitation amount over High Belgium for the period 1987–2017. Such a decrease can also be seen in E-OBS and might be explained by multidecadal oscillations in extreme precipitation amounts.
  • All simulations show the same trends in extreme precipitation whatever the convective scheme used. The best agreement with E-OBS occurs with MAR-BMJ but the scheme performs less well than the two Bechtold’s convective schemes in the simulation of the annual averages. It should be noted that the MAR model has been originally developed with this scheme.
Unfortunately, despite the implementation of additional convective schemes, the representation of summer precipitation by MAR has not significantly been improved compared to the standard model configuration. Improvements other than convective schemes should therefore be carried out in the soil moisture parameters or the moisture feedback from vegetation, since this has an impact on the convective precipitation [74], by providing more moisture and/or heat to the air. As shown by Katragkou et al. [28], the resolution of the sea surface temperature forcing can also improve results. Holland et al. [75] and Sato et al. [76] have respectively improved the modelling of tropical cyclone activity in the Gulf of Mexico and summer precipitation in Mongolia by correcting the sea surface temperature. As MAR does not simulate explicitly the sea surface conditions, it may be interesting to use other sea reanalyses or to couple an ocean model with MAR to improve the simulation of precipitation. In addition to these possible improvements, it is necessary to find other sources of observations for the precipitation comparison, especially for convective precipitation that is very temporally and spatially localized. Satellite data or radar data could be better to detect convective precipitation but they may be subject to other sources of error.
Despite these non-improved summer precipitation results simulated by MAR, this study shows that the different model configurations based on different convective schemes agree on precipitation trends in Belgium and confirm the trends observed in the E-OBS grid data. It would therefore be interesting to extend this ensemble of simulations to the future climate and thus determine the behaviour and trends of convective and extreme precipitation under different climate forcing conditions.

Supplementary Materials

The following are available online at https://www.mdpi.com/2073-4433/10/1/34/s1, Table S1. Weather stations of the surface synoptic observations network (SYNOP) used in this study with their true location (latitude and longitude), their true altitude (z) and location and altitude of the model grid cell containing the location of the weather station. Light grey accounts for z < 100m, moderate grey for 100m < z < 300m and dark grey for z > 300m. Figure S1. Monthly mean NRMSE (Normalized Root Mean Square Error) of daily precipitation simulated by MAR for each experiment and provided by E-OBS with respect to SYNOP observations (in mm/day). Figure S2. Monthly mean of daily precipitation simulated by MAR for each experiment and provided by E-OBS situated in the y-axis compared to the SYNOP observation situated in the x-axis (in mm/day). Figure S3. Regional averages of biases (A), NRMSE (B) and correlation coefficient (C) for each experiment and provided by E-OBS with respect to SYNOP observations. Figure S43: Evolution of annual precipitation in High, Medium and Low Belgium (in mm/year) simulated by MAR for each model experiment and provided by E-OBS. The significant trends are plotted in dotted lines. The delimitation of High (z > 300 m), Medium (100 m < z < 300 m) and Low Belgium (z < 100 m) areas are based on the MAR 10-km (resp. E-OBS 0.22°) topography. Figure S5. Idem as Figure S4 but for convective precipitation over Low Belgium. Figure S6. Trends over 1987–2017 of the yearly 95th percentile of daily precipitation simulated by MAR for each experiment and provided by E-OBS. Crosshatched pixels indicate statistically non-significant trends. Figure S7. Idem as Figure S4 but for the 95th percentile of precipitation over High Belgium.

Author Contributions

Conceptualization, S.D.; Formal analysis, S.D., C.W., C.A., C.K. and X.F.; Investigation, S.D.; Methodology, S.D.; Resources, S.D. and C.W.; Software, S.D. and X.F.; Supervision, Michel Erpicum and X.F.; Validation, S.D. and X.F.; Visualization, S.D.; Writing—original draft, S.D.; Writing—review & editing, S.D., C.W., C.A., C.K., M.E. and X.F.

Funding

This research received no external funding.

Acknowledgments

The ERA-Interim reanalyses used in this study were obtained from the ECMWF data server: http://apps.ecmwf.int/datasets. The authors acknowledge the web site OGIMET (www.ogimet.com) which provides us the weather data used in this paper. The authors are also grateful to the Consortium des Équipements de Calculs Intensifs and the high performance computing massively parallel cluster of the University of Liège for providing high-performance scientific computing facilities and resources. We acknowledge the E-OBS dataset from the data providers in the ECA&D project (http://www.ecad.eu). The IMERG satellite data were provided by the NASA/Goddard Space Flight Centre.

Conflicts of Interest

The authors declare no conflict of interest.

Appendix A

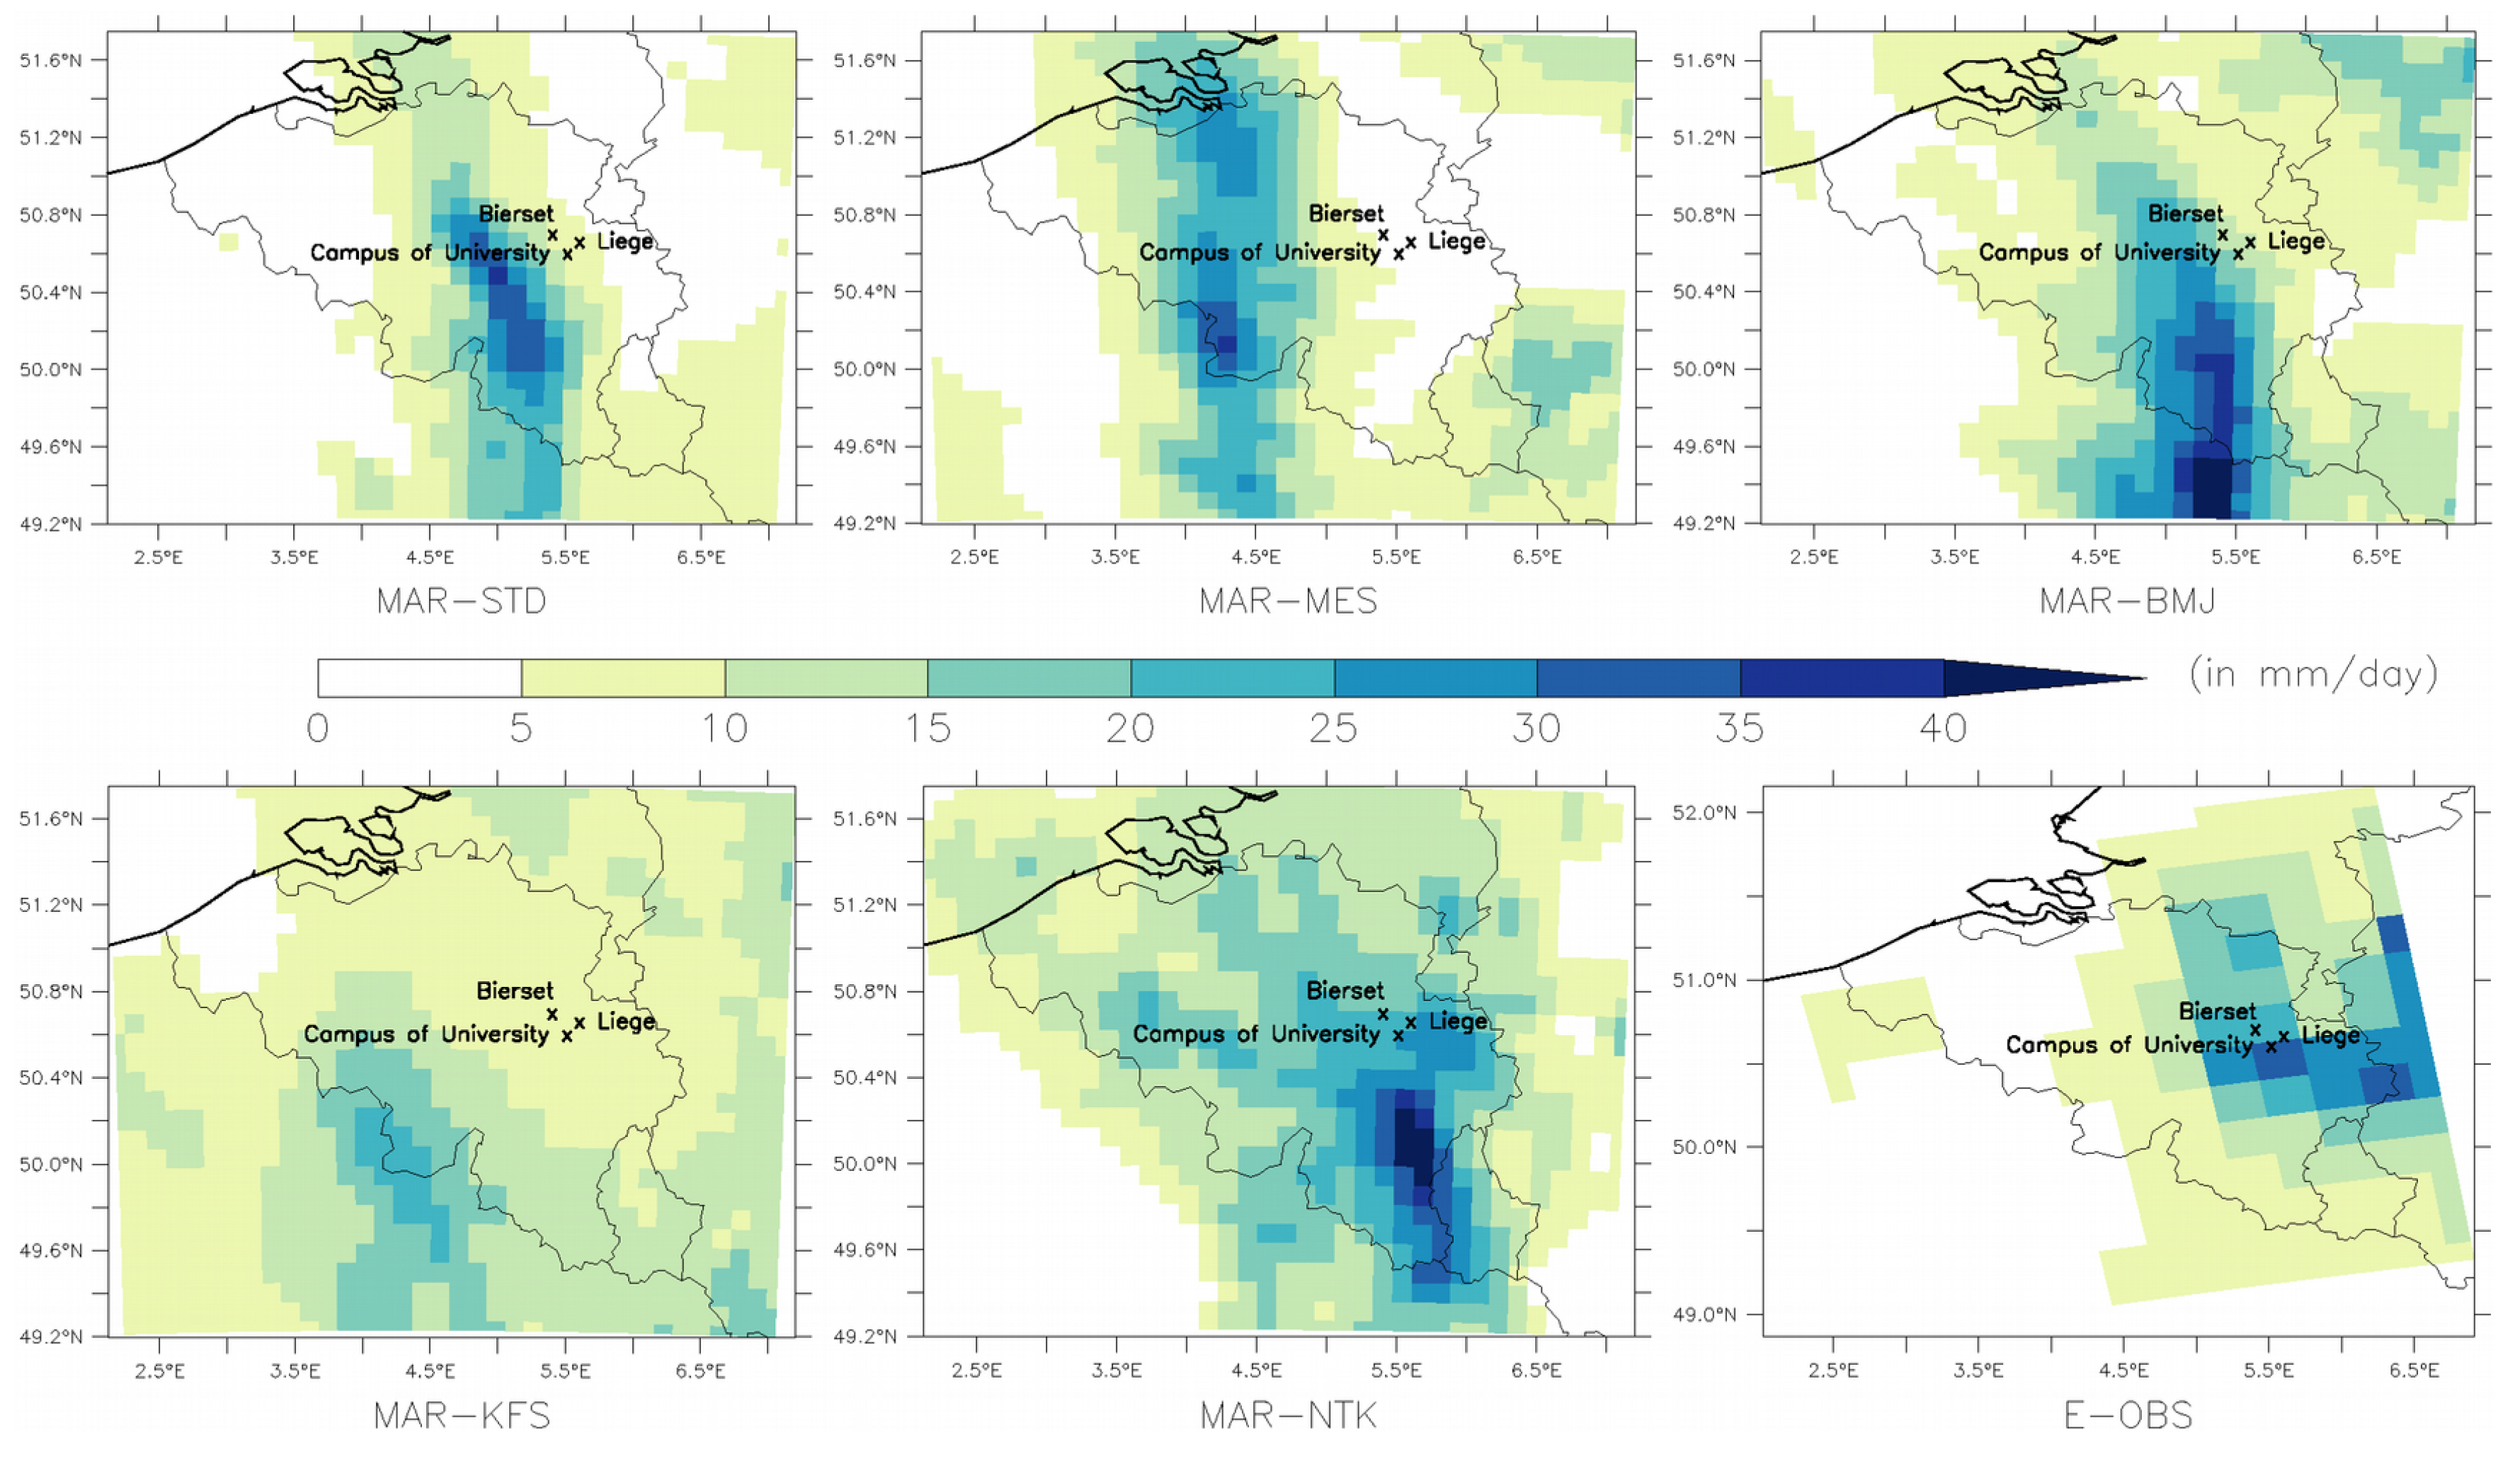
The first example took place on 29 May 2008 when a thunderstorm affected the region of Liège and more particularly the campus of the University of Liège. This convective storm, well documented in the report [77], came from the south-east. It travelled all night throughout the East of France to reactivate in the morning over High Belgium and dump large amounts of rainfall at the same location between 8 am and 10 am local time. A weather station located on the campus recorded a total of 90 mm in less than 2 h [77]. Unfortunately, a power cut interrupted the recording but most of the rain had already fallen. In comparison, the SYNOP data for the Bierset station (used for Section 3.1.) counts 56 mm during the entire day.
Figure A1 shows that all MAR runs simulate precipitation mainly in the eastern half of Belgium but none of them localize the maximum of precipitation on Liège contrary to the E-OBS data which suggest a precipitation amount of 35 mm/day over the grid point containing the city of Liège. Nevertheless, it is interesting to note that this maximum provided by E-OBS is more in agreement with the amount measured at the Bierset station than the extreme rate measured at the station located on the Campus of the University of Liège. The maximum of precipitation simulated by MAR are of the same order of magnitude as E-OBS but all MAR experiments are wrongly located whatever the MAR experiment. However all schemes lead to a precipitation trace oriented from south to north corresponding to the direction of the thunderstorm cell. MAR-NTK provides the best results with a maximum of precipitation at ~50 km south of Liege while MAR-KFS exhibits a weak maximum in the north of France. None of the MAR experiments can reproduce neither the exact location of the convective precipitation nor the exact precipitation amounts.
Figure A1. Precipitation simulated by MAR for each experiment and provided by E-OBS on the 29 May 2008 (in mm/day).
Atmosphere 10 00034 g0a1
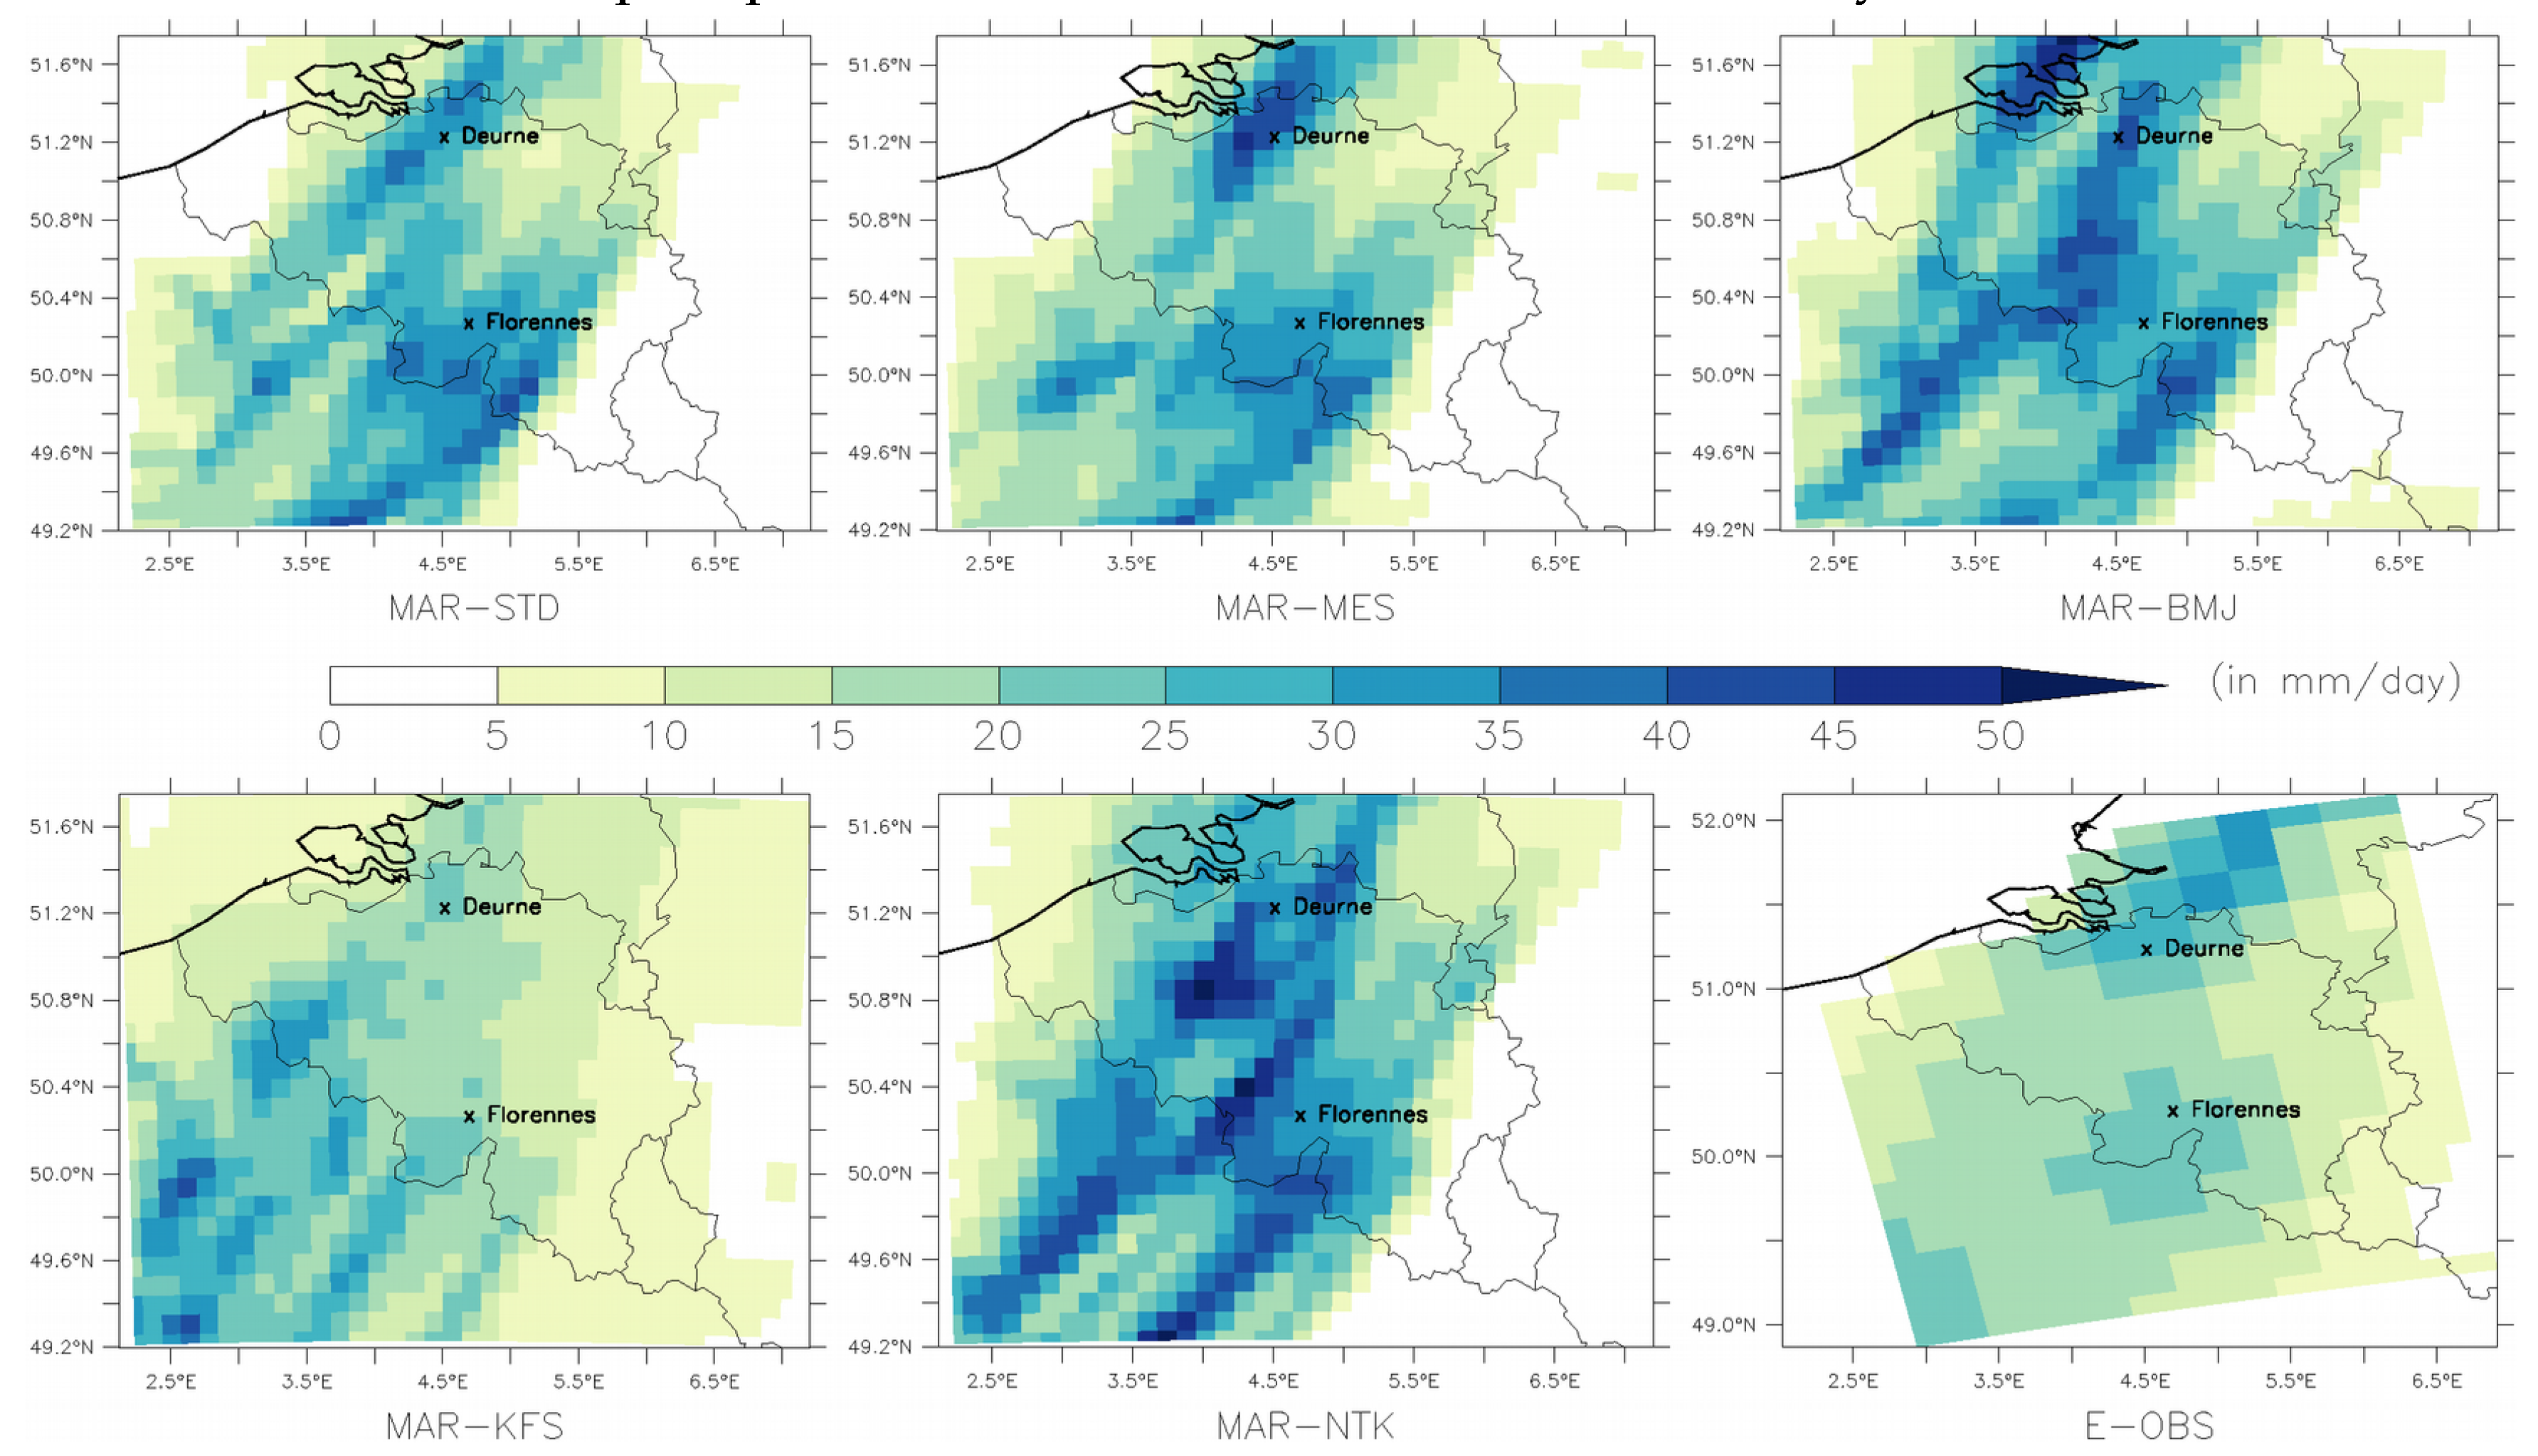
The second example took place on 22 May 2016 when warm and unstable air from the Iberian plateau moves to France, Belgium and the Netherlands thanks to a Low centred near the British Isles. This convective event provides a lot of severe thunderstorms which travel from France to the Netherlands. Some SYNOP stations recorded large precipitation amounts as Florennes (with 32 mm) or Deurnes (with 33 mm) in agreement with the E-OBS data. As shown in Figure A2, all MAR simulations seem to represent the same amount of precipitation for these two stations, even if MAR-STD and MAR-MES seem to give better results. However the MAR simulations also show higher values elsewhere. They show precipitation tracks South-West to North-East oriented with precipitation amounts higher than 40 mm which are not represented in E-OBS because the SYNOP station are isolated, thus precipitation fall near the station but not directly above it.
Figure A2. Precipitation simulated by MAR for each experiment and provided by E-OBS on the 22 May 2016 (in mm/day).
Atmosphere 10 00034 g0a2
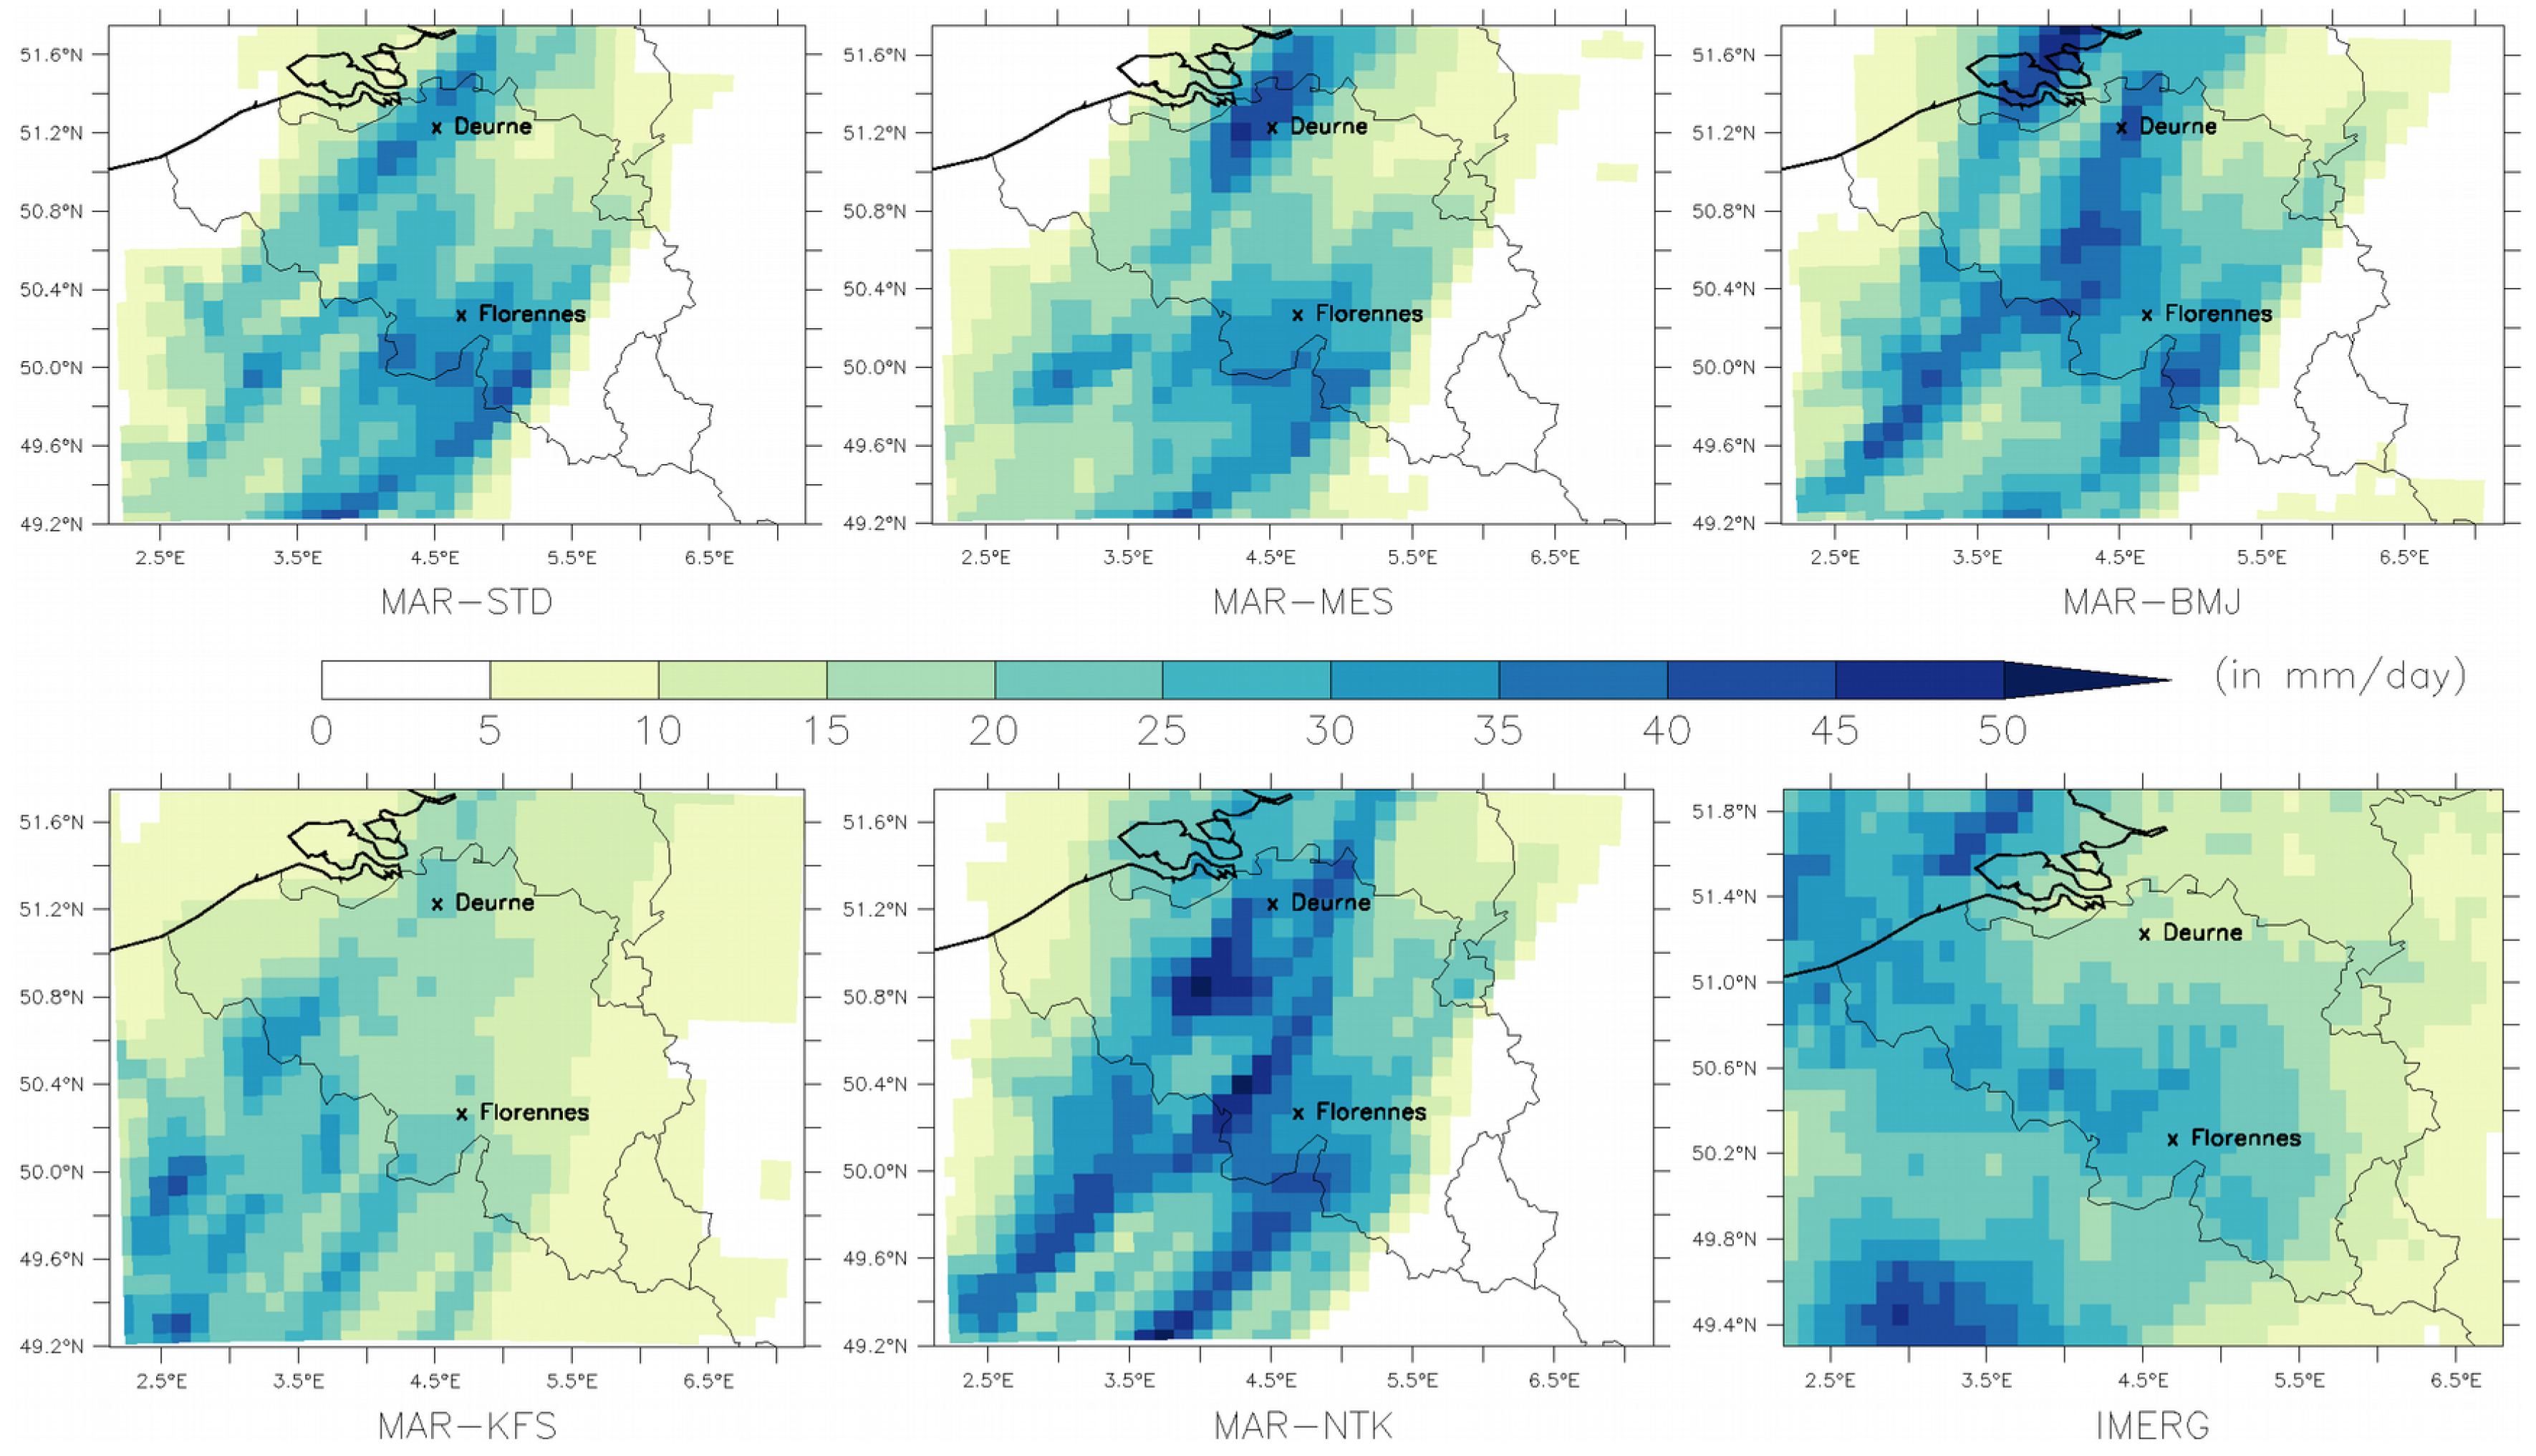
By using the IMERG satellite data [78] (Figure A3), the advantage is that the precipitation fields are spatially continuous and well represented as shown in Chen et al. [79] because these data are based on satellite measurements. Thus high values of precipitation in MAR simulations seem to be represented in the IMERG data especially in the southern half of Belgium with values higher than 30 mm not present in the E-OBS data. The disadvantage is that IMERG data have a short history (only from 2014), precipitation is globally underestimated [80] and particularly the winter precipitation where the performance of IMERG data is poor [79].
Figure A3. Precipitation simulated by MAR for each experiment and provided by the IMERG satellite data on the 22 May 2016 (in mm/day).
Atmosphere 10 00034 g0a3

References

  1. Anagnostou, E.N. A convective/stratiform precipitation classification algorithm for volume scanning weather radar observations. Meteorol. Appl. 2004, 11, 291–300. [Google Scholar] [CrossRef]
  2. Houze, R. Stratiform precipitation in regions of convection. Bull. Am. Meteorol. Soc. 1997, 78, 2179–2195. [Google Scholar] [CrossRef]
  3. Ooyama, K. A Theory on Parameterization of Cumulus Convection. J. Meteorol. Soc. Jpn. Ser. II 1971, 49A, 744–756. [Google Scholar] [CrossRef]
  4. Kendon, E.J.; Ban, N.; Roberts, N.M.; Fowler, H.J.; Roberts, M.J.; Chan, S.C.; Evans, J.P.; Fosser, G.; Wilkinson, J.M.; Kendon, E.J.; et al. Do Convection-Permitting Regional Climate Models Improve Projections of Future Precipitation Change? Bull. Am. Meteorol. Soc. 2017, 98, 79–93. [Google Scholar] [CrossRef]
  5. Kuo, H.L.; Kuo, H.L. Further Studies of the Parameterization of the Influence of Cumulus Convection on Large-Scale Flow. J. Atmos. Sci. 1974, 31, 1232–1240. [Google Scholar] [CrossRef] [Green Version]
  6. Das, S.; Mitra, A.K.; Iyengar, G.R.; Mohandas, S. Comprehensive test of different cumulus parameterization schemes for the simulation of the Indian summer monsoon. Meteorol. Atmos. Phys. 2001, 78, 227–244. [Google Scholar] [CrossRef]
  7. Betts, A.K.; Miller, M.J. A new convective adjustment scheme. Part II: Single column tests using GATE wave, BOMEX, ATEX and arctic air-mass data sets. Q. J. R. Meteorol. Soc. 1986, 112, 693–709. [Google Scholar] [CrossRef]
  8. Janjić, Z.I. The Step-Mountain Eta Coordinate Model: Further Developments of the Convection, Viscous Sublayer and Turbulence Closure Schemes. Mon. Weather Rev. 1994, 122, 927–945. [Google Scholar] [CrossRef]
  9. Bechtold, P.; Bazile, E.; Guichard, F.; Mascart, P.; Richard, E. A mass-flux convection scheme for regional and global models. Q. J. R. Meteorol. Soc. 2001, 127, 869–886. [Google Scholar] [CrossRef]
  10. Kain, J.S. The Kain–Fritsch Convective Parameterization: An Update. J. Appl. Meteorol. 2004, 43, 170–181. [Google Scholar] [CrossRef]
  11. Tiedtke, M. A Comprehensive Mass Flux Scheme for Cumulus Parameterization in Large-Scale Models. Mon. Weather Rev. 1989, 117, 1779–1800. [Google Scholar] [CrossRef] [Green Version]
  12. Arakawa, A.; Schubert, W.H. Interaction of a Cumulus Cloud Ensemble with the Large-Scale Environment, Part I. J. Atmos. Sci. 1974, 31, 674–701. [Google Scholar] [CrossRef] [Green Version]
  13. Bechtold, P. Atmospheric moist convection. In Meteorological Training Course Lecture Series; ECMWF: Reading, UK, 2009; pp. 1–85. [Google Scholar]
  14. Rybka, H.; Tost, H. Uncertainties in future climate predictions due to convection parameterisations. Atmos. Chem. Phys. 2014, 14, 5561–5576. [Google Scholar] [CrossRef] [Green Version]
  15. Nikulin, G.; Jones, C.; Giorgi, F.; Asrar, G.; Büchner, M.; Cerezo-Mota, R.; Christensen, O.B.; Déqué, M.; Fernandez, J.; Hänsler, A.; et al. Precipitation Climatology in an Ensemble of CORDEX-Africa Regional Climate Simulations. J. Clim. 2012, 25, 6057–6078. [Google Scholar] [CrossRef] [Green Version]
  16. Kotlarski, S.; Keuler, K.; Christensen, O.B.; Colette, A.; Déqué, M.; Gobiet, A.; Goergen, K.; Jacob, D.; Lüthi, D.; van Meijgaard, E.; et al. Regional climate modelling on European scales: A joint standard evaluation of the EURO-CORDEX RCM ensemble. Geosci. Model Dev. 2014, 7, 1297–1333. [Google Scholar] [CrossRef]
  17. Huang, B.; Polanski, S.; Cubasch, U. Assessment of precipitation climatology in an ensemble of CORDEX-East Asia regional climate simulations. Clim. Res. 2015, 64, 141–158. [Google Scholar] [CrossRef]
  18. Wyard, C.; Scholzen, C.; Fettweis, X.; Van Campenhout, J.; François, L. Decrease in climatic conditions favouring floods in the south-east of Belgium over 1959–2010 using the regional climate model MAR. Int. J. Climatol. 2017, 37, 2782–2796. [Google Scholar] [CrossRef]
  19. Fettweis, X.; Box, J.E.; Agosta, C.; Amory, C.; Kittel, C.; Lang, C.; van As, D.; Machguth, H.; Gallée, H. Reconstructions of the 1900–2015 Greenland ice sheet surface mass balance using the regional climate MAR model. Cryosphere 2017, 11, 1015–1033. [Google Scholar] [CrossRef] [Green Version]
  20. Wyard, C.; Doutreloup, S.; Belleflamme, A.; Wild, M.; Fettweis, X. Global Radiative Flux and Cloudiness Variability for the Period 1959–2010 in Belgium: A Comparison between Reanalyses and the Regional Climate Model MAR. Atmosphere 2018, 9, 262. [Google Scholar] [CrossRef]
  21. Erpicum, M.; Nouri, M.; Demoulin, A. The climate of Belgium and Luxembourg. In Landscapes and Landforms of Belgium and Luxembourg; Springer: Cham, Switzerland, 2018; pp. 35–41. [Google Scholar]
  22. Alexandre, J.; Erpicum, M.; Vernemmen, C. Géographie de la Belgique: Le Climat. In Géographie de la Belgique; Denis, J., Ed.; Crédit Communal: Bruxelles, Belgium, 1992; pp. 88–128. ISBN 2871931526. [Google Scholar]
  23. Poelman, D.R. A 10-Year Study on the Characteristics of Thunderstorms in Belgium Based on Cloud-to-Ground Lightning Data. Mon. Weather Rev. 2014, 142, 4839–4849. [Google Scholar] [CrossRef]
  24. OGIMET Website. Available online: http://www.ogimet.com (accessed on 25 October 2017).
  25. Haylock, M.R.; Hofstra, N.; Klein Tank, A.M.G.; Klok, E.J.; Jones, P.D.; New, M. A European daily high-resolution gridded data set of surface temperature and precipitation for 1950–2006. J. Geophys. Res. 2008, 113, D20119. [Google Scholar] [CrossRef]
  26. Hofstra, N.; New, M.; Mcsweeney, C. The Influence of Interpolation and Station Network Density on the Distribution and Extreme Trends of Climate Variables in Gridded Data. 2009. Available online: https://www.ecad.eu/documents/Scalingpaper.pdf (accessed on 19 November 2018).
  27. Lenderink, G. Exploring metrics of extreme daily precipitation in a large ensemble of regional climate model simulations. Clim. Res. 2010, 44, 151–166. [Google Scholar] [CrossRef] [Green Version]
  28. Katragkou, E.; García-Díez, M.; Vautard, R.; Sobolowski, S.; Zanis, P.; Alexandri, G.; Cardoso, R.M.; Colette, A.; Fernandez, J.; Gobiet, A.; et al. Regional climate hindcast simulations within EURO-CORDEX: Evaluation of a WRF multi-physics ensemble. Geosci. Model Dev. 2015, 8, 603–618. [Google Scholar] [CrossRef]
  29. Smiatek, G.; Kunstmann, H.; Senatore, A. EURO-CORDEX regional climate model analysis for the Greater Alpine Region: Performance and expected future change. J. Geophys. Res. Atmos. 2016, 121, 7710–7728. [Google Scholar] [CrossRef] [Green Version]
  30. Lhotka, O.; Kyselý, J.; Plavcová, E. Evaluation of major heat waves’ mechanisms in EURO-CORDEX RCMs over Central Europe. Clim. Dyn. 2018, 50, 4249–4262. [Google Scholar] [CrossRef]
  31. Gallée, H.; Schayes, G. Development of a Three-Dimensional Meso-γ Primitive Equation Model: Katabatic Winds Simulation in the Area of Terra Nova Bay, Antarctica. Mon. Weather Rev. 1994, 122, 671–685. [Google Scholar] [CrossRef] [Green Version]
  32. Fettweis, X.; Franco, B.; Tedesco, M.; van Angelen, J.H.; Lenaerts, J.T.M.; van den Broeke, M.R.; Gallée, H. Estimating the Greenland ice sheet surface mass balance contribution to future sea level rise using the regional atmospheric climate model MAR. Cryosphere 2013, 7, 469–489. [Google Scholar] [CrossRef]
  33. Brasseur, O. Development and Application of a Physical Approach to Estimating Wind Gusts. Mon. Weather Rev. 2001, 129, 5–25. [Google Scholar] [CrossRef]
  34. Brasseur, O.; Gallée, H.; Creutin, J.-D.; Lebel, T.; Marbaix, P. High Resolution Simulations of Precipitation over the ALPS with the Perspective of Coupling to Hydrological Models; Springer: Dordrecht, The Netherlands, 2002; pp. 75–99. [Google Scholar]
  35. Fettweis, X.; Wyard, C.; Doutreloup, S.; Belleflamme, A. Noël 2010 En Belgique: Neige En Flandre Et Pluie En Haute-Ardenne. Bull. Soc. Géogr. Liège 2017, 68, 97–107. [Google Scholar]
  36. Termonia, P.; Van Schaeybroeck, B.; De Cruz, L.; De Troch, R.; Caluwaerts, S.; Giot, O.; Hamdi, R.; Vannitsem, S.; Duchêne, F.; Willems, P.; et al. The CORDEX.be initiative as a foundation for climate services in Belgium. Clim. Serv. 2018, 11, 49–61. [Google Scholar] [CrossRef]
  37. Gallée, H.; Moufouma-Okia, W.; Bechtold, P.; Brasseur, O.; Dupays, I.; Marbaix, P.; Messager, C.; Ramel, R.; Lebel, T. A high-resolution simulation of a West African rainy season using a regional climate model. J. Geophys. Res. 2004, 109, D05108. [Google Scholar] [CrossRef]
  38. Brasseur, O.; Ntezimana, V.; Gallee, H.; Schayes, G.; Tricot, C. Importance of the convective adjustment scheme in the simulation of the diurnal cycle of convective activity in Africa. In Proceedings of the International Conference on Tropical Climatology, Meteorology and Hydrology in Memoriam Franz Bultot, Bruxelles, Belgium, 22–24 May 1996; Royal Meteorological Institute of Belgium; Royal Academy of Overseas Science: Leuven, Belgium, 1998. [Google Scholar]
  39. De Ridder, K.; Gallée, H. Land Surface–Induced Regional Climate Change in Southern Israel. J. Appl. Meteorol. 1998, 37, 1470–1485. [Google Scholar] [CrossRef]
  40. Kessler, E. On the continuity and distribution of water substance in atmospheric circulations. Atmos. Res. 1995, 38, 109–145. [Google Scholar] [CrossRef]
  41. Lin, Y.-L.; Farley, R.D.; Orville, H.D. Bulk Parameterization of the Snow Field in a Cloud Model. J. Clim. Appl. Meteorol. 1983, 22, 1065–1092. [Google Scholar] [CrossRef] [Green Version]
  42. Levkov, L.; Rockel, B.; Kapitza, H.; Raschke, E. 3D mesoscale numerical 680 studies of cirrus and stratus clouds by their time and space evolution. Contrib. Atmos. Phys. 1992, 65, 35–58. [Google Scholar]
  43. Meyers, M.P.; DeMott, P.J.; Cotton, W.R. New Primary Ice-Nucleation Parameterizations in an Explicit Cloud Model. J. Appl. Meteorol. 1992, 31, 708–721. [Google Scholar] [CrossRef] [Green Version]
  44. Morcrette, J.-J. Assessment of the ECMWF Model Cloudiness and Surface Radiation Fields at the ARM SGP Site. Mon. Weather Rev. 2002, 130, 257–277. [Google Scholar] [CrossRef]
  45. Dee, D.P.; Uppala, S.M.; Simmons, A.J.; Berrisford, P.; Poli, P.; Kobayashi, S.; Andrae, U.; Balmaseda, M.A.; Balsamo, G.; Bauer, P.; et al. The ERA-Interim reanalysis: Configuration and performance of the data assimilation system. Q. J. R. Meteorol. Soc. 2011, 137, 553–597. [Google Scholar] [CrossRef]
  46. Antic, S.; Laprise, R.; Denis, B.; de Elía, R. Testing the downscaling ability of a one-way nested regional climate model in regions of complex topography. Clim. Dyn. 2006, 26, 305–325. [Google Scholar] [CrossRef]
  47. Giorgi, F.; Gutowski, W.J. Regional Dynamical Downscaling and the CORDEX Initiative. Annu. Rev. Environ. Resour. 2015, 40, 467–490. [Google Scholar] [CrossRef]
  48. Lac, C.; Chaboureau, J.-P.; Masson, V.; Pinty, J.-P.; Tulet, P.; Escobar, J.; Leriche, M.; Barthe, C.; Aouizerats, B.; Augros, C.; et al. Overview of the Meso-NH model version 5.4 and its applications. Geosci. Model Dev. Discuss. 2018, 11, 1929–1969. [Google Scholar] [CrossRef]
  49. Skamarock, C.; Klemp, B.; Dudhia, J.; Gill, O.; Barker, D.; Duda, G.; Huang, X.; Wang, W.; Powers, G. A Description of the Advanced Research WRF Version 3; NCAR Technical Note NCAR/TN-475+STR; NCAR: Boulder Colorado, CO, USA, 2008. [Google Scholar]
  50. Zhang, C.; Wang, Y.; Hamilton, K. Improved Representation of Boundary Layer Clouds over the Southeast Pacific in ARW-WRF Using a Modified Tiedtke Cumulus Parameterization Scheme. Mon. Weather Rev. 2011, 139, 3489–3513. [Google Scholar] [CrossRef]
  51. Stergiou, I.; Tagaris, E.; Sotiropoulou, R.-E.P. Sensitivity Assessment of WRF Parameterizations over Europe. Proceedings 2017, 1, 119. [Google Scholar] [CrossRef]
  52. Argueso, D.; Hidalgo-muñoz, J.M.; Gamiz-fortis, S.R.; Esteban-Parra, M.J. Evaluation of WRF Parameterizations for Climate Studies over Southern Spain Using a Multistep Regionalization. J. Clim. 2011, 24, 5633–5651. [Google Scholar] [CrossRef]
  53. Pieri, A.B.; von Hardenberg, J.; Parodi, A.; Provenzale, A. Sensitivity of Precipitation Statistics to Resolution, Microphysics and Convective Parameterization: A Case Study with the High-Resolution WRF Climate Model over Europe. J. Hydrometeorol. 2015, 16, 1857–1872. [Google Scholar] [CrossRef]
  54. Torn, R.D.; Davis, C.A. The Influence of Shallow Convection on Tropical Cyclone Track Forecasts. Mon. Weather Rev. 2012, 140, 2188–2197. [Google Scholar] [CrossRef]
  55. Brown, B.R.; Hakim, G.J. Sensitivity of intensifying Atlantic hurricanes to vortex structure. Q. J. R. Meteorol. Soc. 2015, 141, 2538–2551. [Google Scholar] [CrossRef]
  56. Evans, J.P.; Ekström, M.; Ji, F. Evaluating the performance of a WRF physics ensemble over South-East Australia. Clim. Dyn. 2012, 39, 1241–1258. [Google Scholar] [CrossRef]
  57. Ratna, S.B.; Ratnam, J.V.; Behera, S.K.; Rautenbach, C.J.D.; Ndarana, T.; Takahashi, K.; Yamagata, T. Performance assessment of three convective parameterization schemes in WRF for downscaling summer rainfall over South Africa. Clim. Dyn. 2014, 42, 2931–2953. [Google Scholar] [CrossRef]
  58. Madala, S.; Satyanarayana, A.N.V.; Rao, T.N. Performance evaluation of PBL and cumulus parameterization schemes of WRF ARW model in simulating severe thunderstorm events over Gadanki MST radar facility—Case study. Atmos. Res. 2014, 139, 1–17. [Google Scholar] [CrossRef]
  59. Pohl, B.; Crétat, J.; Camberlin, P. Testing WRF capability in simulating the atmospheric water cycle over Equatorial East Africa. Clim. Dyn. 2011, 37, 1357–1379. [Google Scholar] [CrossRef]
  60. Ishak, A.M.; Bray, M.; Remesan, R.; Han, D. Seasonal evaluation of rainfall estimation by four cumulus parameterization schemes and their sensitivity analysis. Hydrol. Process. 2012, 26, 1062–1078. [Google Scholar] [CrossRef]
  61. Daniels, E.E.; Lenderink, G.; Hutjes, R.W.A.; Holtslag, A.A.M. Spatial precipitation patterns and trends in The Netherlands during 1951–2009. Int. J. Climatol. 2014, 34, 1773–1784. [Google Scholar] [CrossRef]
  62. Attema, J.J.; Lenderink, G. The influence of the North Sea on coastal precipitation in the Netherlands in the present-day and future climate. Clim. Dyn. 2014, 42, 505–519. [Google Scholar] [CrossRef]
  63. Joyce, A.E. The coastal temperature network and ferry route programme: Long-term temperature and salinity observations. Sci. Data Rep. 2006, 43, 129. [Google Scholar]
  64. Sherman, K.; Reilly, J.O.; Hyde, K. Variability of Large Marine Ecosystems in response to global climate change. Int. Counc. Explor. Seas 2007, 20, 46. [Google Scholar]
  65. Willems, P. Adjustment of extreme rainfall statistics accounting for multidecadal climate oscillations. J. Hydrol. 2013, 490, 126–133. [Google Scholar] [CrossRef]
  66. Moberg, A.; Jones, P.D.; Lister, D.; Walther, A.; Brunet, M.; Jacobeit, J.; Alexander, L.V.; Della-Marta, P.M.; Luterbacher, J.; Yiou, P.; et al. Indices for daily temperature and precipitation extremes in Europe analyzed for the period 1901–2000. J. Geophys. Res. 2006, 111, D22106. [Google Scholar] [CrossRef]
  67. Ntegeka, V.; Willems, P. Trends and multidecadal oscillations in rainfall extremes, based on a more than 100-year time series of 10 min rainfall intensities at Uccle, Belgium. Water Resour. Res. 2008, 44, W07402. [Google Scholar] [CrossRef]
  68. De Jongh, I.L.M.; Verhoest, N.E.C.; De Troch, F.P. Analysis of A 105-year time series of precipitation observed at Uccle, Belgium. Int. J. Climatol. 2006, 26, 2023–2039. [Google Scholar] [CrossRef]
  69. Madsen, H.; Lawrence, D.; Lang, M.; Martinkova, M.; Kjeldsen, T.R. Review of trend analysis and climate change projections of extreme precipitation and floods in Europe. J. Hydrol. 2014, 519, 3634–3650. [Google Scholar] [CrossRef] [Green Version]
  70. Royal Meteorological Institute. Royal Meteorological Institute of Belgium (RMI) Vigilence Climatique 2015; Royal Meteorological Institute of Belgium: Leuven, Belgium, 2015; Volulme 86. [Google Scholar]
  71. Cortés-Hernández, V.E.; Zheng, F.; Evans, J.; Lambert, M.; Sharma, A.; Westra, S. Evaluating regional climate models for simulating sub-daily rainfall extremes. Clim. Dyn. 2016, 47, 1613–1628. [Google Scholar] [CrossRef]
  72. Frigon, A.; Music, B.; Slivitzky, M. Sensitivity of runoff and projected changes in runoff over Quebec to the update interval of lateral boundary conditions in the Canadian RCM. Meteorol. Z. 2010, 19, 225–236. [Google Scholar] [CrossRef]
  73. Gao, X.; Shi, Y.; Song, R.; Giorgi, F.; Wang, Y.; Zhang, D. Reduction of future monsoon precipitation over China: Comparison between a high resolution RCM simulation and the driving GCM. Meteorol. Atmos. Phys. 2008, 100, 73–86. [Google Scholar] [CrossRef]
  74. Seth, A.; Giorgi, F. The Effects of Domain Choice on Summer Precipitation Simulation and Sensitivity in a Regional Climate Model. J. Clim. 1998, 11, 2698–2712. [Google Scholar] [CrossRef] [Green Version]
  75. Holland, G.; Done, J.; Bruyere, C.; Cooper, C.K.; Suzuki, A. Model Investigations of the Effects of Climate Variability and Change on Future Gulf of Mexico Tropical Cyclone Activity. In Proceedings of the Offshore Technology Conference, Houston, TX, USA, 3–6 May 2010. [Google Scholar]
  76. Sato, T.; Kimura, F.; Kitoh, A. Projection of global warming onto regional precipitation over Mongolia using a regional climate model. J. Hydrol. 2007, 333, 144–154. [Google Scholar] [CrossRef]
  77. AQUAPÔLE—ULg Étude et Modélisation des Impacts Hydrologiques de Pluies Exceptionnelles dans un Environnement Vallonné et Boisé; Université de Liège: Liège, Belgium, 2009; pp. 12–22.
  78. Huffman, G.; Bolvin, D.T.; Braithwaite, D.; Hsu, K.; Joyce, R.; Kidd, C.; Nelkin, E.J.; Xie, P. Integrated Multi-Satellite Retrievals for GPM (IMERG). In Algorithm Theoretical Basis Document (ATBD) Version 4.5; National Aeronautics Space Administration Goddard Space Flight Center: Greenbelt, MD, USA, 2015. [Google Scholar]
  79. Chen, F.; Li, X. Evaluation of IMERG and TRMM 3B43 Monthly Precipitation Products over Mainland China. Remote Sens. 2016, 8, 472. [Google Scholar] [CrossRef]
  80. Sharifi, E.; Steinacker, R.; Saghafian, B. Assessment of GPM-IMERG and Other Precipitation Products against Gauge Data under Different Topographic and Climatic Conditions in Iran: Preliminary Results. Remote Sens. 2016, 8, 135. [Google Scholar] [CrossRef]
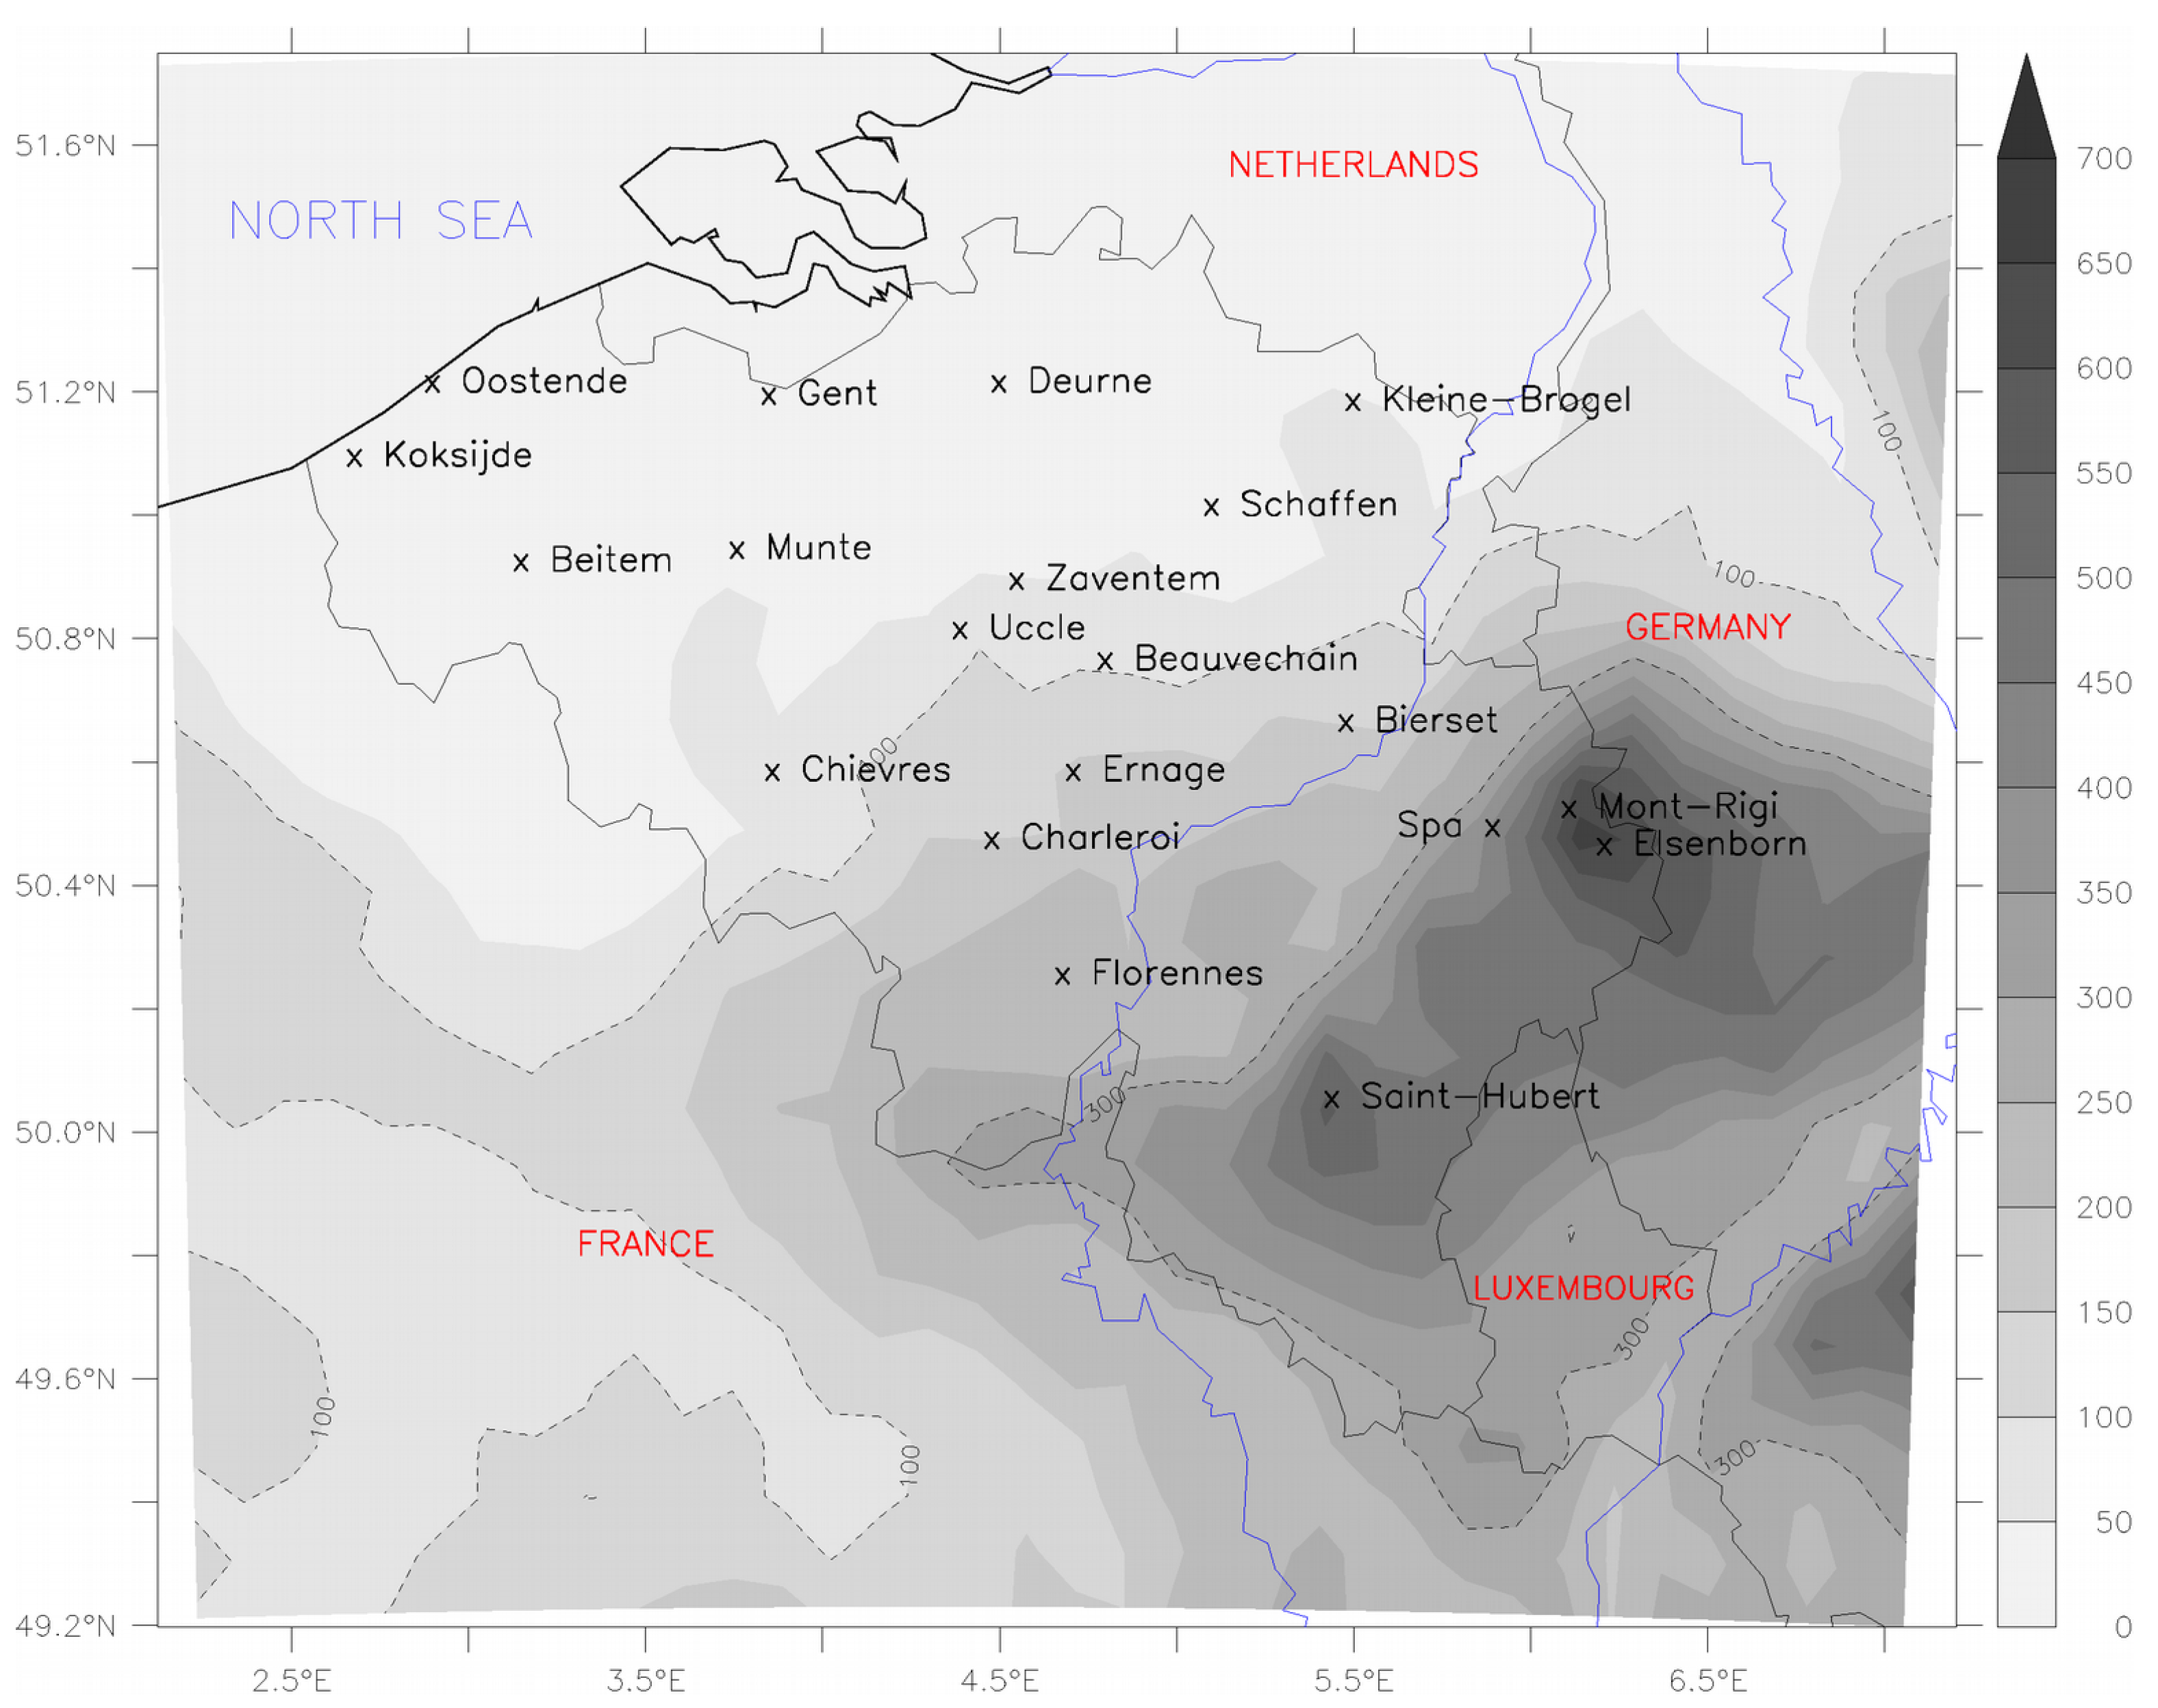
Figure 1. Model elevation of the study area (in meters) and location of the weather stations of the surface synoptic observations network (SYNOP) used in this study (black crosses). Dotted black lines represent the 100 m and 300 m elevation and the blue lines represent the major rivers of our studied area.
Atmosphere 10 00034 g001
Figure 2. Monthly mean biases of daily precipitation simulated by MAR for each experiment and provided by E-OBS with respect to SYNOP observations (in mm/day).
Atmosphere 10 00034 g002
Figure 3. Monthly mean correlation (R) of daily precipitation simulated by MAR and provided by E-OBS with respect to SYNOP observations.
Atmosphere 10 00034 g003
Figure 4. Mean annual precipitation over 1987–2017 simulated by MAR for each experiment and provided by E-OBS in mm/year. Dotted black lines represent the 100 m and 300 m elevation of the MAR (resp. E-OBS) and the blue lines represent the major rivers of our studied area.
Atmosphere 10 00034 g004
Figure 5. Trends in annual precipitation simulated by MAR for each experiment and provided by E-OBS over 1987–2017 in mm/decade. Crosshatched pixels indicate statistically non-significant trends.
Atmosphere 10 00034 g005
Figure 6. Mean annual convective precipitation over 1987–2017 simulated by MAR for each experiment in mm/year. Dotted black lines represent the 100 m and 300 m elevation of the MAR and the blue lines represent the major rivers of our studied area.
Atmosphere 10 00034 g006
Figure 7. Idem as Figure 6 but for stratiform precipitation.
Atmosphere 10 00034 g007
Figure 8. Trends in annual convective precipitation simulated by MAR for each experiment over 1987–2017 in mm/decade. Crosshatched pixels indicate statistically non-significant trends.
Atmosphere 10 00034 g008
Figure 9. Idem as Figure 4 but for the 95th percentile of daily precipitation in mm/day.
Atmosphere 10 00034 g009
Table 1. Comparison over 2008–2014 of annual mean precipitation from SYNOP weather stations (and all stations in each region) with MAR experiments and E-OBS. Column A represents precipitation simulated by MAR (resp. provided by E-OBS) in mm/year and the corresponding bias in % and column B represents the mean daily bias in mm/day.
Atmosphere 10 00034 i001