DynSig: Modelling Dynamic Signaling Alterations along Gene Pathways for Identifying Differential Pathways

Abstract
1. Introduction
2. Materials and Methods
2.1. Framework of DynSig for Pathway Analysis
2.2. Data Preparation
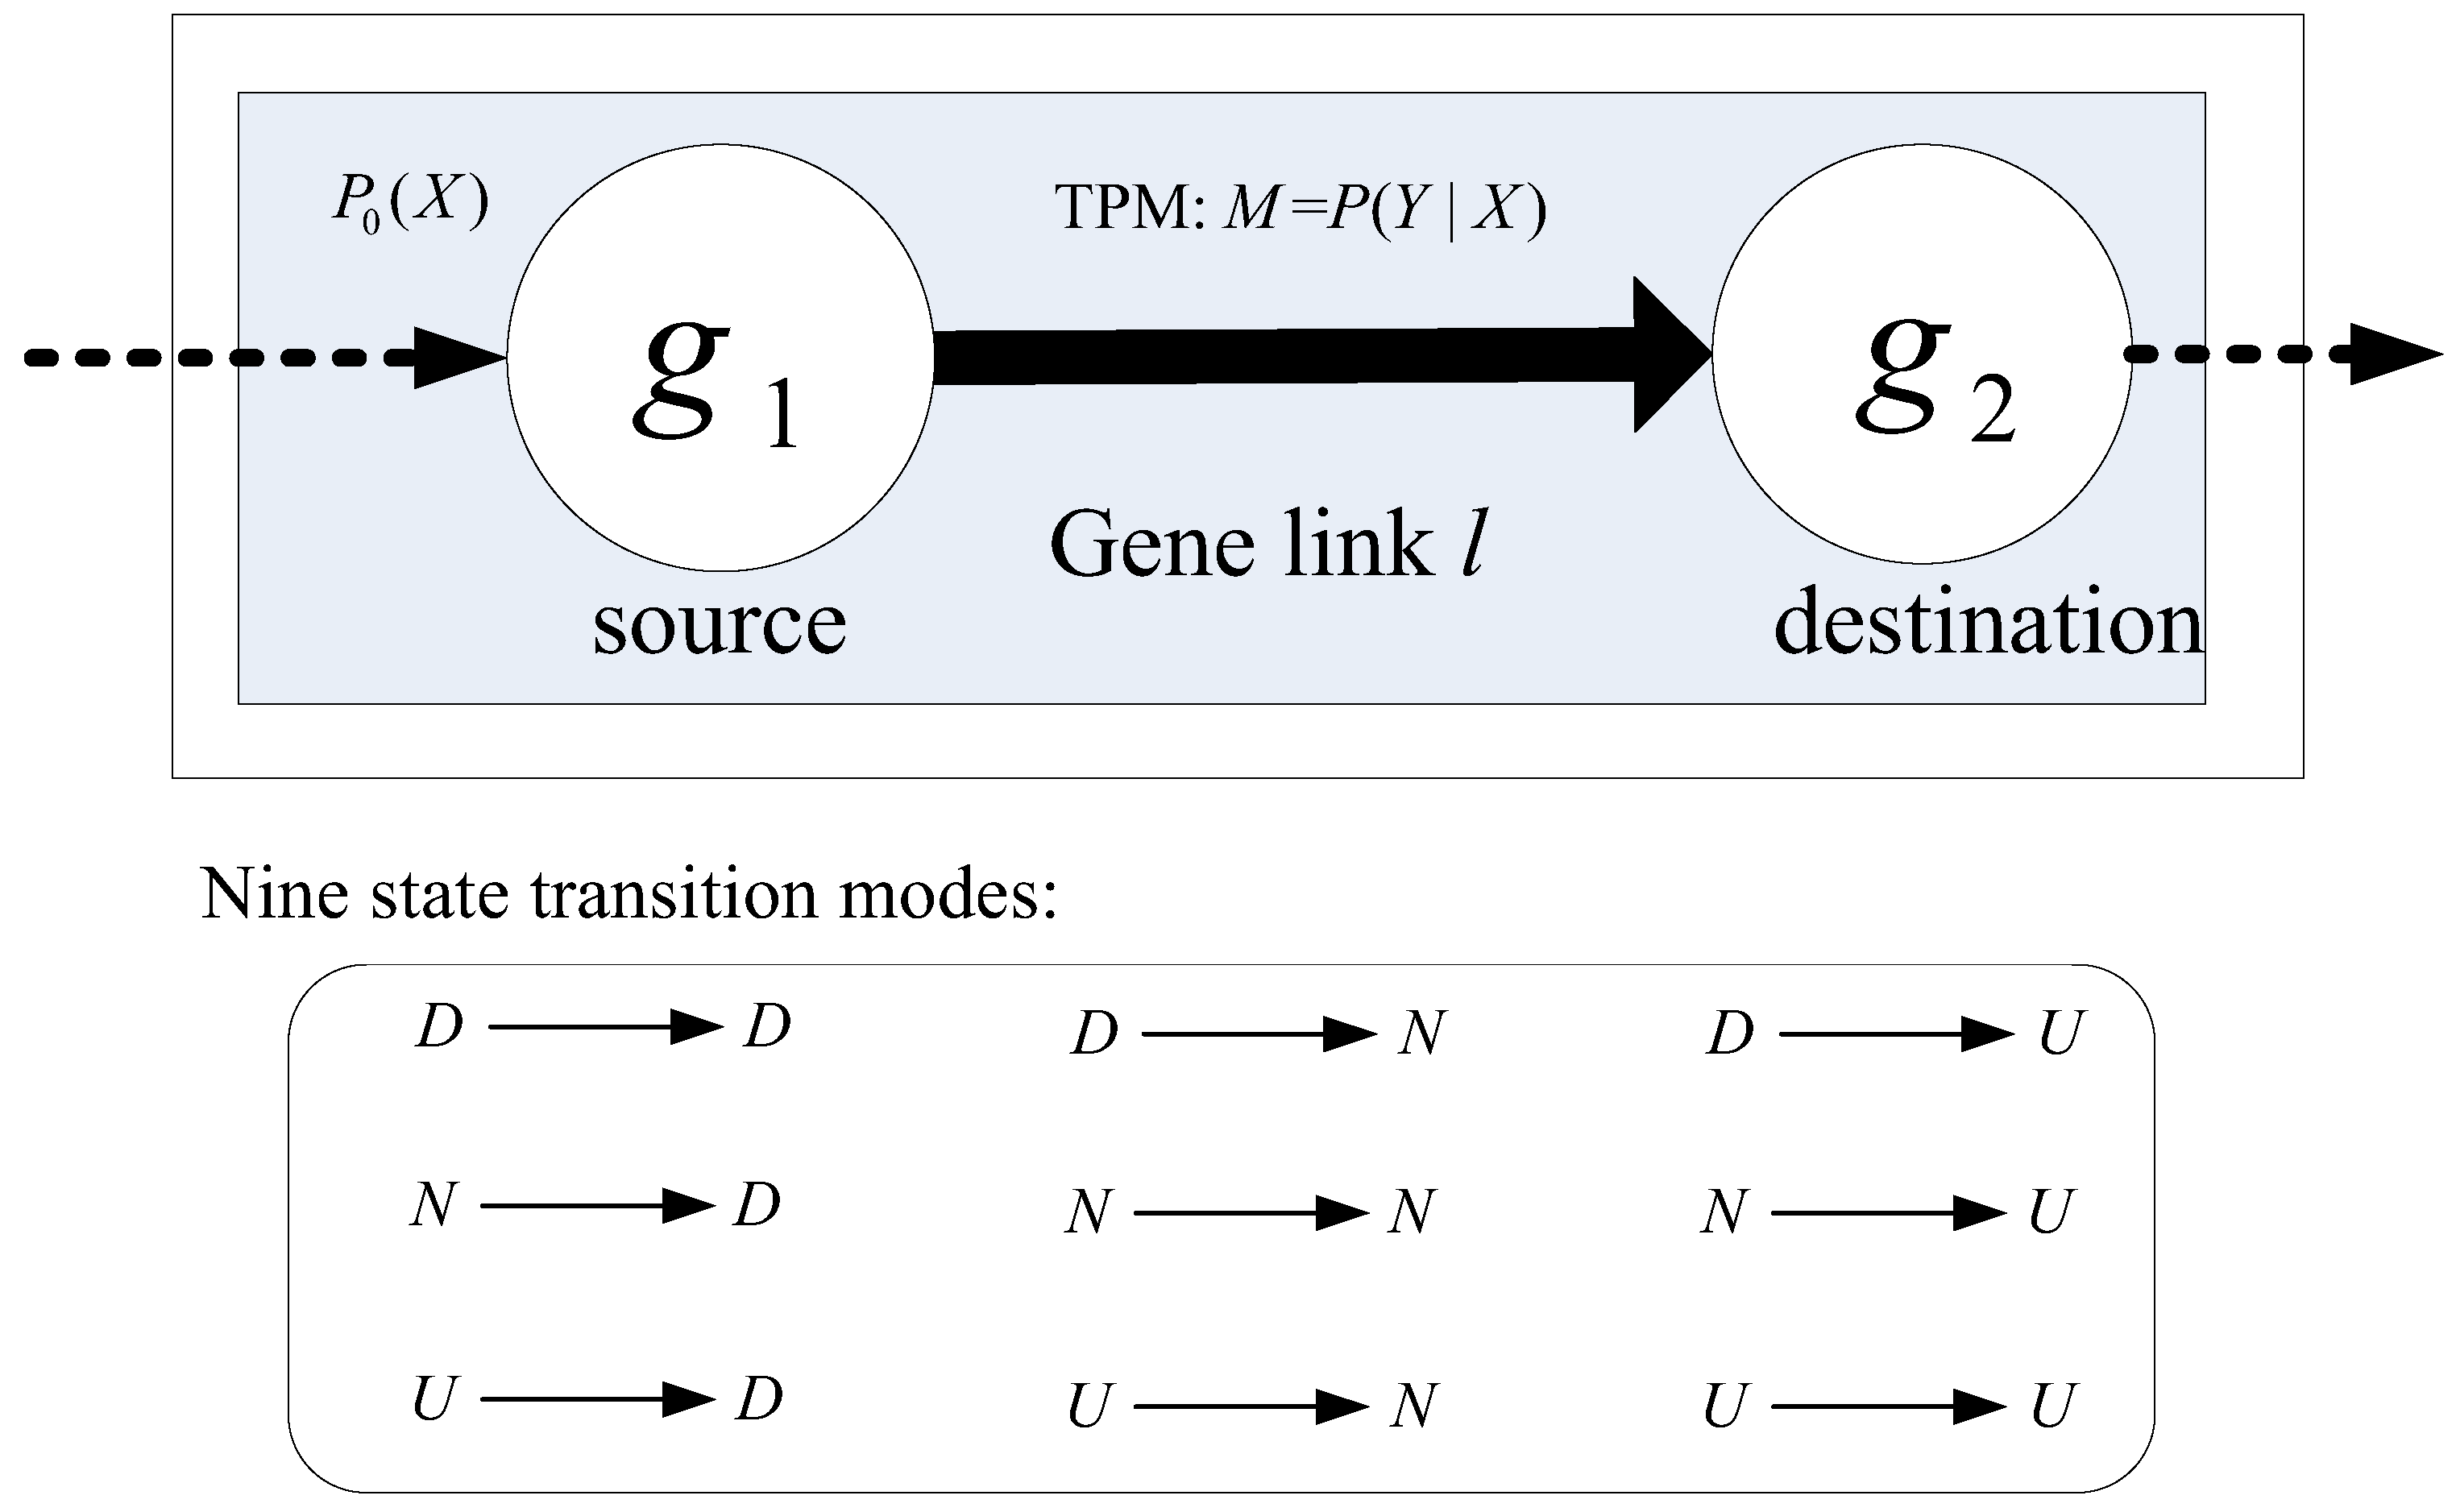
2.3. Modeling the Dynamics of Gene Links Using Markov Chain Model
2.3.1. Scoring Gene Links for the Disparity of Signaling Dynamics
2.3.2. Identifying Differentially Expressed Pathways
2.3.3. Principal Pattern of Signaling Dynamics Specific to a Cancer Type
2.4. Simulation Data Generation
3. Results
3.1. Simulation Data Study
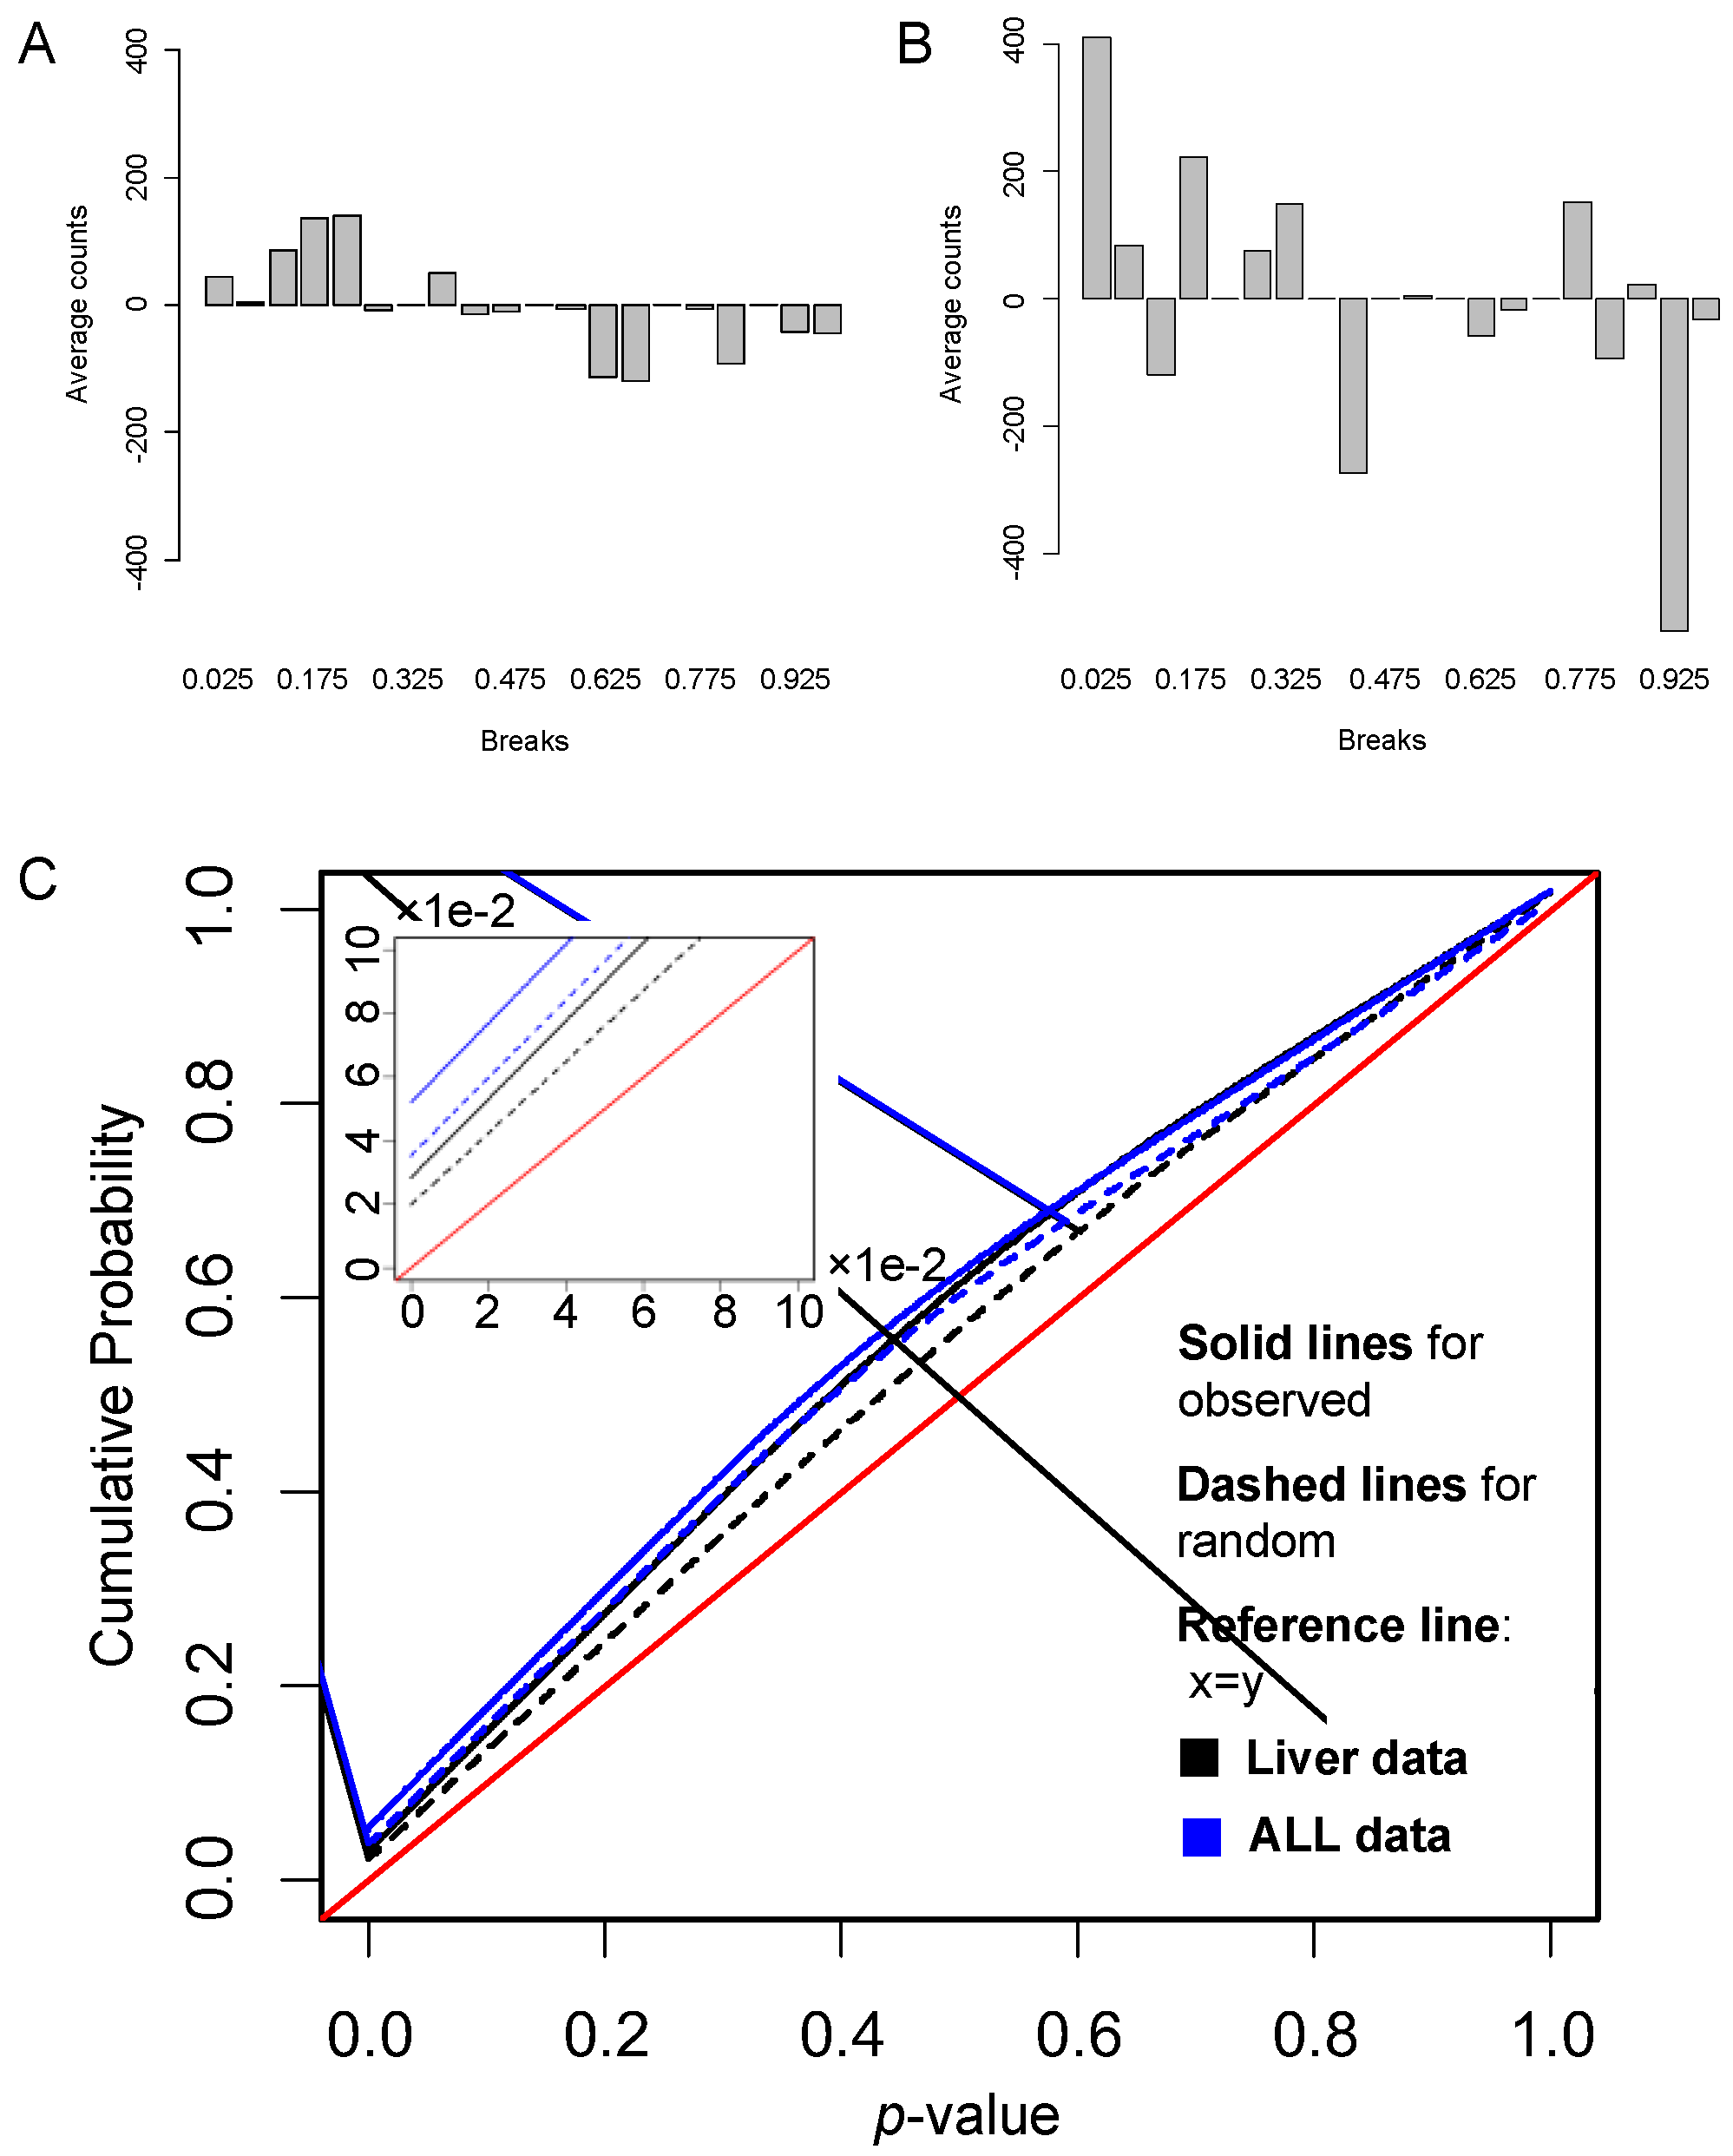
3.2. Applications to Real-World Expression Data
3.2.1. Identification of Differentially Expressed Pathways
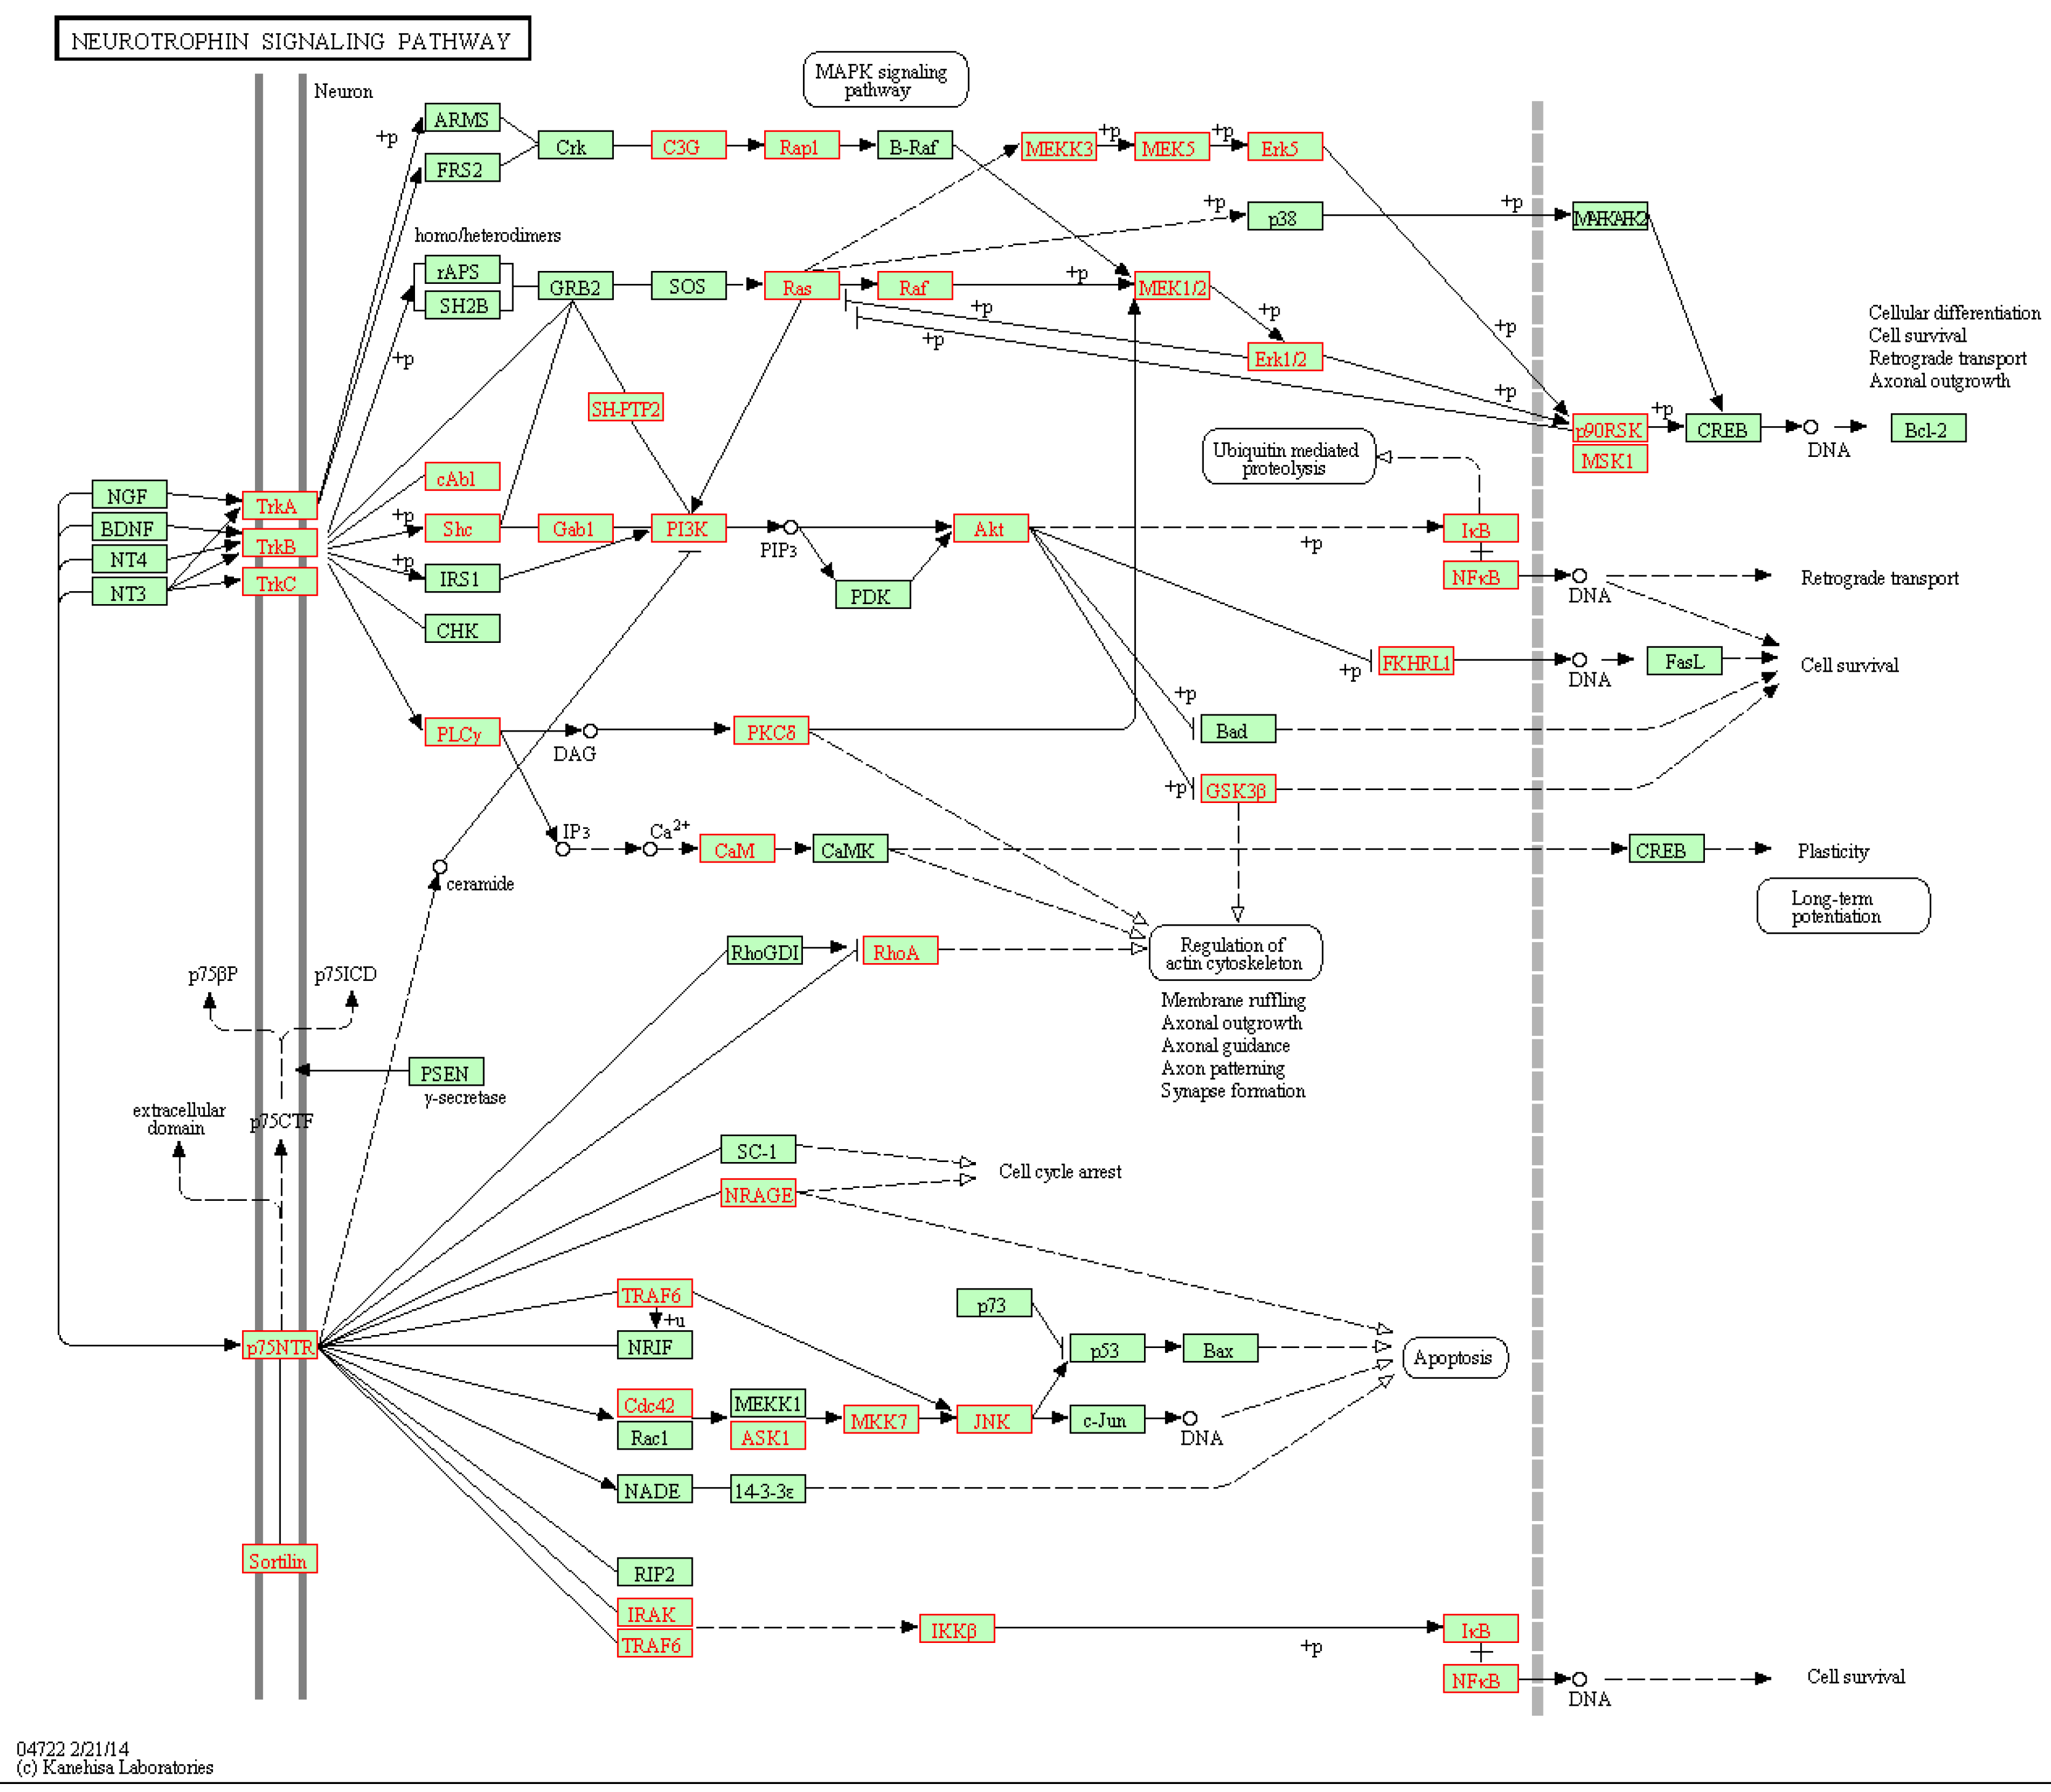
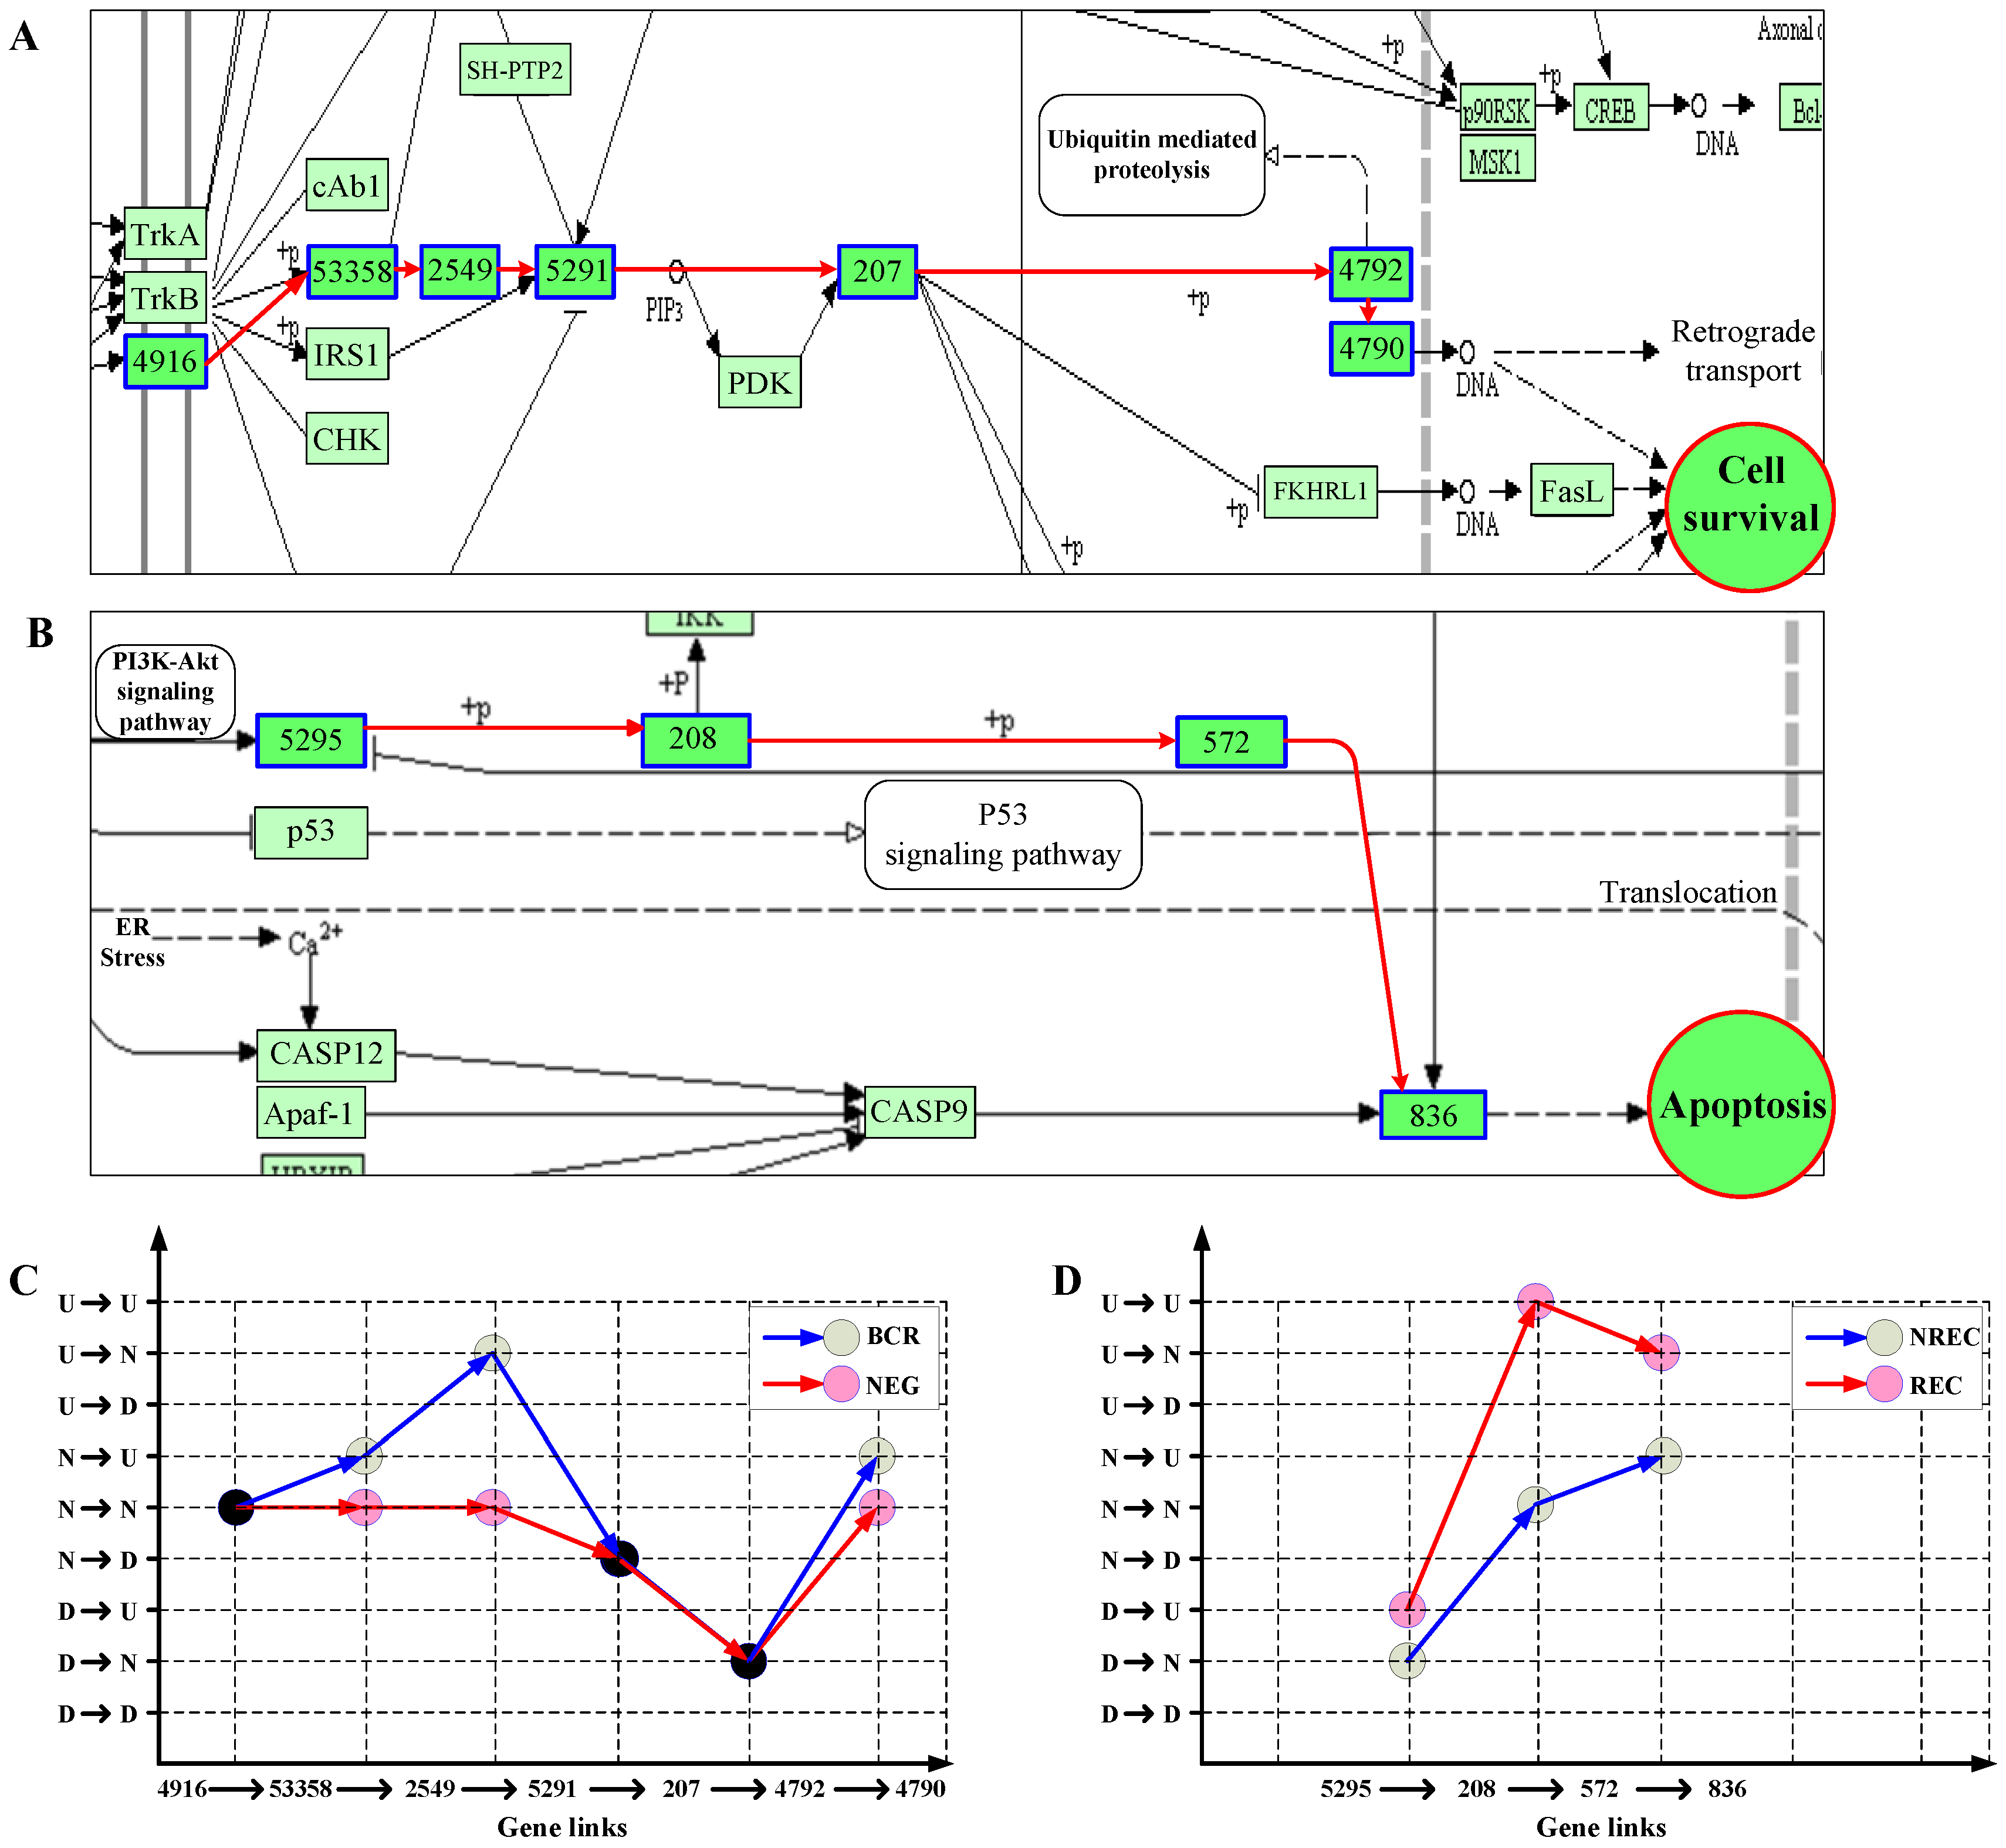
3.2.2. Gene Links Play Significant Roles in Pathway Activity
3.2.3. Principal Patterns of Pathways Reflect Abnormality of Signaling Dynamics in Cancer
4. Discussion
5. Conclusions
Supplementary Materials
Author Contributions
Funding
Acknowledgments
Conflicts of Interest
References
- Chasman, D.; Ho, Y.-H.; Berry, D.B.; Nemec, C.M.; MacGilvray, M.E.; Hose, J.; Merrill, A.E.; Lee, M.V.; Will, J.L.; Coon, J.J.; et al. Pathway connectivity and signaling coordination in the yeast stress-activated signaling network. Mol. Syst. Biol. 2014, 10, 759–799. [Google Scholar] [CrossRef] [PubMed]
- De la Fuente, A.; Bing, N.; Hoeschele, I.; Mendes, P. Discovery of meaningful associations in genomic data using partial correlation coefficients. Bioinformatics 2004, 20, 3565–3574. [Google Scholar] [CrossRef] [PubMed]
- Kaever, A.; Landesfeind, M.; Feussner, K.; Morgenstern, B.; Feussner, I.; Meinicke, P. Meta-Analysis of pathway enrichment: Combining independent and dependent omics data sets. PLoS ONE 2014, 9, e89297. [Google Scholar] [CrossRef] [PubMed]
- Raspe, E.; Decraene, C.; Berx, G. Gene expression profiling to dissect the complexity of cancer biology: Pitfalls and promise. Semin. Cancer Biol. 2012, 22, 250–260. [Google Scholar] [CrossRef] [PubMed]
- Lazar, C.; Meganck, S.; Taminau, J.; Steenhoff, D.; Coletta, A.; Molter, C.; Weiss-Solís, D.Y.; Duque, R.; Bersini, H.; Nowé, A. Batch effect removal methods for microarray gene expression data integration: A survey. Brief. Bioinf. 2012, 14, 469–490. [Google Scholar] [CrossRef] [PubMed]
- Kanehisa, M.; Goto, S. KEGG: Kyoto encyclopedia of genes and genomes. Nucleic Acids Res. 2000, 28, 27–30. [Google Scholar] [CrossRef] [PubMed]
- Lo, K.; Raftery, A.; Dombek, K.; Zhu, J.; Schadt, E.; Bumgarner, R.; Yeung, K.Y. Integrating external biological knowledge in the construction of regulatory networks from time-series expression data. BMC Syst. Biol. 2012, 6, 101. [Google Scholar] [CrossRef] [PubMed]
- Varadan, V.; Mittal, P.; Vaske, C.J.; Benz, S.C. The integration of biological pathway knowledge in cancer genomics: A review of existing computational approaches. IEEE Signal Process. Mag. 2012, 29, 35–50. [Google Scholar] [CrossRef]
- Khatri, P.; Sirota, M.; Butte, A.J. Ten years of pathway analysis: Current approaches and outstanding challenges. PLoS Comput. Biol. 2012, 8, e1002375. [Google Scholar] [CrossRef] [PubMed]
- Khatri, P.; Draghici, S. Ontological analysis of gene expression data: Current tools, limitations, and open problems. Bioinformatics 2005, 21, 3587–3595. [Google Scholar] [CrossRef] [PubMed]
- Drǎghici, S.; Khatri, P.; Martins, R.P.; Ostermeier, G.C.; Krawetz, S.A. Global functional profiling of gene expression. Genomics 2003, 81, 98–104. [Google Scholar] [CrossRef]
- Subramanian, A.; Tamayo, P.; Mootha, V.K.; Mukherjee, S.; Ebert, B.L.; Gillette, M.A.; Paulovich, A.; Pomeroy, S.L.; Golub, T.R.; Lander, E.S.; et al. Gene set enrichment analysis: A knowledge-based approach for interpreting genome-wide expression profiles. Proc. Natl. Acad. Sci. USA 2005, 102, 15545–15550. [Google Scholar] [CrossRef] [PubMed]
- Goeman, J.J.; van de Geer, S.A.; de Kort, F.; van Houwelingen, H.C. A global test for groups of genes: Testing association with a clinical outcome. Bioinformatics 2004, 20, 93–99. [Google Scholar] [CrossRef] [PubMed]
- Rahnenfuhrer, J.; Domingues, F.; Maydt, J.; Lengauer, T. Calculating the statistical significance of changes in pathway activity from gene expression data. Stat. Appl. Gen. Mol. Biol. 2004, 3, 1–29. [Google Scholar] [CrossRef] [PubMed]
- Gao, S.; Wang, X. Tappa: Topological analysis of pathway phenotype association. Bioinformatics 2007, 23, 3100–3102. [Google Scholar] [CrossRef] [PubMed]
- Isci, S.; Ozturk, C.; Jones, J.; Otu, H.H. Pathway analysis of high-throughput biological data within a bayesian network framework. Bioinformatics 2011, 27, 1667–1674. [Google Scholar] [CrossRef] [PubMed]
- Jacob, L.; Neuvial, P.; Dudoit, S. More power via graph-structured tests for differential expression of gene networks. Ann. Appl. Stat. 2012, 6, 561–600. [Google Scholar] [CrossRef]
- Van Allen, E.M.; Wagle, N.; Levy, M.A. Clinical analysis and interpretation of cancer genome data. J. Clin. Oncol. 2013, 31, 1825–1833. [Google Scholar] [CrossRef] [PubMed]
- Azad, A.K.M.; Lawen, A.; Keith, J.M. Bayesian model of signal rewiring reveals mechanisms of gene dysregulation in acquired drug resistance in breast cancer. PLoS ONE 2017, 12, e0173331. [Google Scholar] [CrossRef] [PubMed]
- Kaushik, A.; Ali, S.; Gupta, D. Altered pathway analyzer: A gene expression dataset analysis tool for identification and prioritization of differentially regulated and network rewired pathways. Sci. Rep. 2017, 7, 40450. [Google Scholar] [CrossRef] [PubMed]
- Han, J.; Shi, X.; Zhang, Y.; Xu, Y.; Jiang, Y.; Zhang, C.; Feng, L.; Yang, H.; Shang, D.; Sun, Z.; et al. ESEA: Discovering the dysregulated pathways based on edge set enrichment analysis. Sci. Rep. 2015, 5, 13044. [Google Scholar] [CrossRef] [PubMed]
- Li, D.; Li, R.; Wang, H.-Q. A Novel Discretization Method for Microarray-Based Cancer Classification. In Intelligent Computing Technology; Huang, D.-S., Jiang, C., Bevilacqua, V., Figueroa, J., Eds.; Springer: Berlin/Heidelberg, Germany, 2012; pp. 327–333. [Google Scholar]
- Pleasance, E.; Stephens, P.; O’Meara, S.; McBride, D.; Meynert, A.; Jones, D.; Lin, M.; Beare, D.; Lau, K.; Greenman, C.; et al. A small-cell lung cancer genome with complex signatures of tobacco exposure. Nature 2010, 463, 184–190. [Google Scholar] [CrossRef] [PubMed]
- Sartor, M.A.; Leikauf, G.D.; Medvedovic, M. Lrpath: A logistic regression approach for identifying enriched biological groups in gene expression data. Bioinformatics 2009, 25, 211–217. [Google Scholar] [CrossRef] [PubMed]
- Martini, P.; Sales, G.; Massa, M.S.; Chiogna, M.; Romualdi, C. Along signal paths: An empirical gene set approach exploiting pathway topology. Nucleic Acids Res. 2013, 41, e19. [Google Scholar] [CrossRef] [PubMed]
- Iizuka, N.; Oka, M.; Yamada-Okabe, H.; Nishida, M.; Maeda, Y.; Mori, N.; Takao, T.; Tamesa, T.; Tangoku, A.; Tabuchi, H.; et al. Oligonucleotide microarray for prediction of early intrahepatic recurrence of hepatocellular carcinoma after curative resection. Lancet 2003, 361, 923–929. [Google Scholar] [CrossRef]
- Chiaretti, S.; Li, X.; Gentleman, R.; Vitale, A.; Wang, K.S.; Mandelli, F.; Foa, R.; Ritz, J. Gene expression profiles of B-lineage adult acute lymphocytic leukemia reveal genetic patterns that identify lineage derivation and distinct mechanisms of transformation. Clin. Cancer Res. 2005, 11, 7209–7219. [Google Scholar] [CrossRef] [PubMed]
- Li, S.; Li, D. DNA Microarray Technology and Data Analysis in Dancer Research; World Scientific Publishing: Singapore, 2008. [Google Scholar]
- Wang, H.-Q.; Jing, G.-J.; Zheng, C.-H. Biology-constrained gene expression discretization for cancer classification. Neurocomputing 2014, 145, 30–36. [Google Scholar] [CrossRef]
- Kanehisa, M.; Goto, S.; Furumichi, M.; Tanabe, M.; Hirakawa, M. KEGG for representation and analysis of molecular networks involving diseases and drugs. Nucleic Acids Res. 2010, 38, D355–D360. [Google Scholar] [CrossRef] [PubMed]
- Wang, H.-Q.; Tuominen, L.K.; Tsai, C.-J. SLIM: A sliding linear model for estimating the proportion of true null hypotheses in datasets with dependence structures. Bioinformatics 2011, 27, 225–231. [Google Scholar] [CrossRef] [PubMed]
- Tarca, A.L.; Draghici, S.; Khatri, P.; Hassan, S.S.; Mittal, P.; Kim, J.-S.; Kim, C.J.; Kusanovic, J.P.; Romero, R. A novel signaling pathway impact analysis. Bioinformatics 2009, 25, 75–82. [Google Scholar] [CrossRef] [PubMed]
- Baldwin, J.A.S. The NF-κB and IκB proteins: New discoveries and insights. Annu. Rev. Immunol. 1996, 14, 649–683. [Google Scholar] [CrossRef] [PubMed]
- Hamdane, M.; Davidcordonnier, M.H.; D’Halluin, J.C. Activation of p65 NF-κB protein by p210BCR-ABL in a myeloid cell line (p210BCR-ABL activates p65 NF-κB). Oncogene 1997, 15, 2267–2275. [Google Scholar] [CrossRef] [PubMed]
- Reuther, J.Y.; Reuther, G.W.; Cortez, D.; Pendergast, A.M.; Baldwin, A.S. A requirement for NF-κB activation in BCR–ABL-mediated transformation. Genes Dev. 1998, 12, 968–981. [Google Scholar] [CrossRef] [PubMed]
- Ren, R. Mechanisms of BCR-ABL in the pathogenesis of chronic myelogenous leukaemia. Nat. Rev. Cancer 2005, 5, 172–183. [Google Scholar] [CrossRef] [PubMed]
- Ingham, R.J.; Santos, L.; Dang-Lawson, M.; Holgado-Madruga, M.; Dudek, P.; Maroun, C.R.; Wong, A.J.; Matsuuchi, L.; Gold, M.R. The Gab1 docking protein links the B cell antigen receptor to the phosphatidylinositol 3-kinase/Akt signaling pathway and to the SHP2 tyrosine phosphatase. J. Biol. Chem. 2001, 276, 12257–12265. [Google Scholar] [CrossRef] [PubMed]


| Method | TPR | FPR | FNR | ACC | PPV | MCC | AUC |
|---|---|---|---|---|---|---|---|
| ρ = 0.3 | |||||||
| Our method | 56.40/48.30 | 7.90/9.30 | 43.60/51.70 | 74.25/69.50 | 88.51/85.84 | 52.32/42.66 | 87.19/85.09 |
| Global | 0.00/0.00 | 0.00/0.00 | 100.00/100.00 | 50.00/50.00 | NA/NA | NA/NA | 46.50/47.95 |
| LRpath | 3.30/4.10 | 3.60/3.80 | 96.70/95.90 | 49.85/50.15 | 47.02/52.61 | −0.94/0.90 | 50.01/51.70 |
| TAPPA | 5.80/7.30 | 3.40/2.70 | 94.20/92.70 | 51.20/52.30 | 61.96/72.08 | 5.47/10.29 | 58.37/63.05 |
| Clipper | 0.20/1.00 | 0.50/1.70 | 99.80/99.00 | 49.85/49.65 | NA/32.33 | NA/−3.38 | 46.11/48.71 |
| DEGraph | 1.80/2.20 | 2.00/2.20 | 98.20/97.80 | 49.90/50.00 | 46.67/47.33 | −0.79/−0.31 | 46.74/48.05 |
| ρ = 0.5 | |||||||
| Our method | 96.70/94.10 | 5.80/9.10 | 3.30/5.90 | 95.45/92.50 | 94.61/91.84 | 91.30/85.67 | 99.69/98.24 |
| Global | 0.00/0.00 | 0.00/0.00 | 100.00/100.00 | 50.00/50.00 | NA/NA | NA/NA | 46.96/48.29 |
| LRpath | 2.40/4.00 | 4.70/4.70 | 97.60/96.00 | 48.85/49.65 | 32.59/46.33 | −6.40/−1.67 | 49.87/50.26 |
| TAPPA | 8.80/4.50 | 2.40/1.60 | 91.20/95.50 | 53.20/51.45 | 77.12/72.25 | 13.48/8.11 | 70.07/63.95 |
| Clipper | 0.30/1.20 | 0.80/1.50 | 99.70/98.80 | 49.75/49.85 | NA/48.00 | NA/−0.71 | 47.43/47.30 |
| DEGraph | 1.80/2.40 | 2.20/2.10 | 98.20/97.60 | 49.80/50.15 | NA/54.99 | NA/1.00 | 46.93/47.28 |
| ρ = 0.7 | |||||||
| Our method | 100.00/99.90 | 6.40/8.60 | 0.00/0.10 | 96.80/95.65 | 94.21/92.32 | 93.90/91.76 | 99.95/99.18 |
| Global | 0.00/0.00 | 0.00/0.00 | 100.00/100.00 | 50.00/50.00 | NA/NA | NA/NA | 43.38/44.64 |
| LRpath | 3.30/3.50 | 5.30/5.60 | 96.70/96.50 | 49.00/48.95 | 36.85/36.46 | −5.19/−5.40 | 49.94/48.92 |
| TAPPA | 19.30/2.20 | 0.60/0.40 | 80.70/97.80 | 59.35/50.90 | 97.20/NA | 31.26/NA | 87.69/63.11 |
| Clipper | 0.10/1.00 | 0.50/2.00 | 99.90/99.00 | 49.80/49.50 | NA/24.88 | NA/−4.92 | 44.28/44.61 |
| DEGraph | 1.50/1.80 | 2.40/2.40 | 98.50/98.20 | 49.55/49.70 | 32.64/35.48 | −3.91/−3.01 | 44.98/47.14 |
| Pathway | Our Method | Global Test | LRpath | TAPPA | Clipper | DEGraph |
|---|---|---|---|---|---|---|
| Axon guidance | √ | √ | ☓ | √ | √ | √ |
| Cell cycle | √ | √ | √ | ☓ | √ | √ |
| Chronic myeloid leukemia | √ | √ | ☓ | ☓ | √ | √ |
| ErbB signaling pathway | ☓ | √ | ☓ | ☓ | ☓ | √ |
| Neurotrophin signaling pathway | √ | √ | ☓ | ☓ | √ | √ |
| Pathogenic Escherichia coli infection | √ | √ | ☓ | ☓ | √ | √ |
| Pathways in cancer | √ | √ | ☓ | ☓ | ☓ | √ |
| Shigellosis | √ | √ | ☓ | ☓ | √ | ☓ |
| Viral myocarditis | √ | ☓ | √ | ☓ | √ | ☓ |
© 2018 by the authors. Licensee MDPI, Basel, Switzerland. This article is an open access article distributed under the terms and conditions of the Creative Commons Attribution (CC BY) license (http://creativecommons.org/licenses/by/4.0/).
Share and Cite
Shi, M.; Chong, Y.; Shen, W.; Xie, X.-P.; Wang, H.-Q. DynSig: Modelling Dynamic Signaling Alterations along Gene Pathways for Identifying Differential Pathways. Genes 2018, 9, 323. https://doi.org/10.3390/genes9070323
Shi M, Chong Y, Shen W, Xie X-P, Wang H-Q. DynSig: Modelling Dynamic Signaling Alterations along Gene Pathways for Identifying Differential Pathways. Genes. 2018; 9(7):323. https://doi.org/10.3390/genes9070323
Chicago/Turabian StyleShi, Ming, Yanwen Chong, Weiming Shen, Xin-Ping Xie, and Hong-Qiang Wang. 2018. "DynSig: Modelling Dynamic Signaling Alterations along Gene Pathways for Identifying Differential Pathways" Genes 9, no. 7: 323. https://doi.org/10.3390/genes9070323
APA StyleShi, M., Chong, Y., Shen, W., Xie, X.-P., & Wang, H.-Q. (2018). DynSig: Modelling Dynamic Signaling Alterations along Gene Pathways for Identifying Differential Pathways. Genes, 9(7), 323. https://doi.org/10.3390/genes9070323