Genetic Diversity in the UV Sex Chromosomes of the Brown Alga Ectocarpus

 , , , ,
Abstract
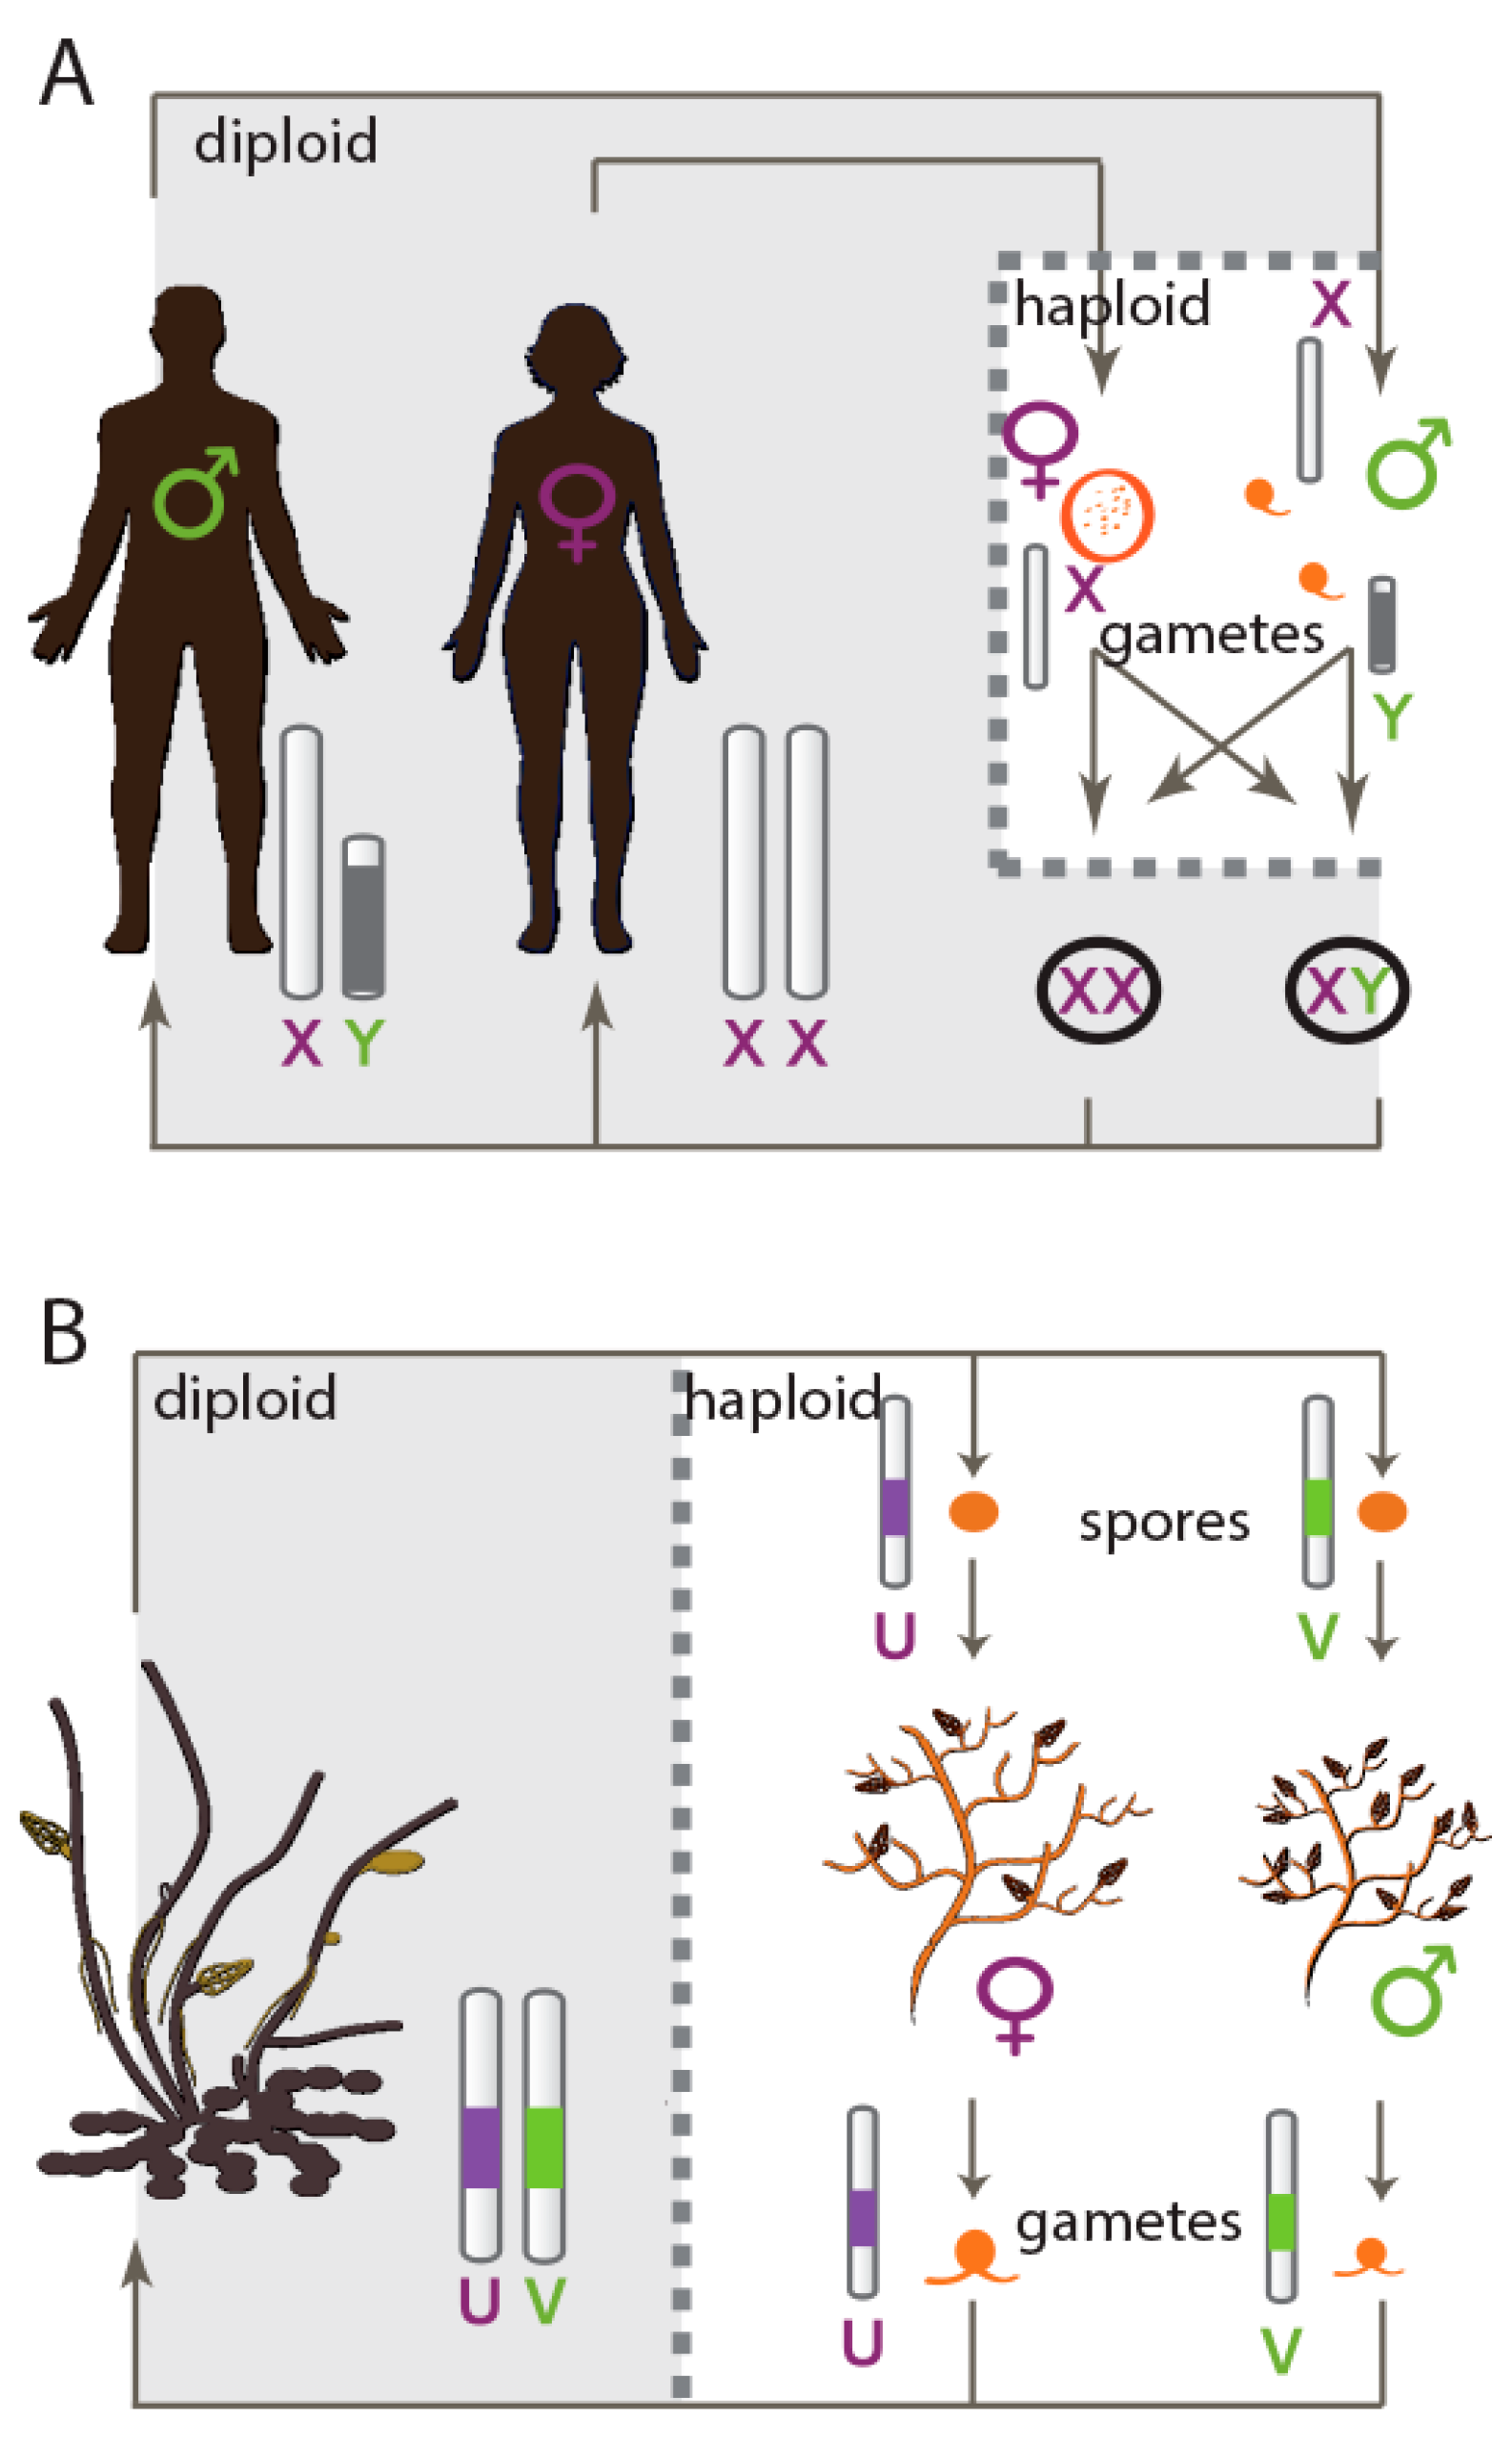
1. Introduction
2. Materials and Methods
2.1. Quantitative Trait Loci (QTL) Mapping of the Sex Locus in Ectocarpus Siliculosus
QTL Mapping of the Sex Locus
2.2. Sequencing of the Individuals from Different Natural Populations for Population Genomics Analyses
2.2.1. Field Sample Unialgal Collections
2.2.2. Analyses of Neutral Diversity in Non-Recombining versus Recombining Regions
2.2.3. Analyses of Non-Recombining and Recombining Coding Regions
2.3. Data Analysis
2.4. Data Availability
3. Results
3.1. Identification of the PAR and SDR in the Sex Chromosome of E. siliculosus
3.2. ddRAD-seq Data
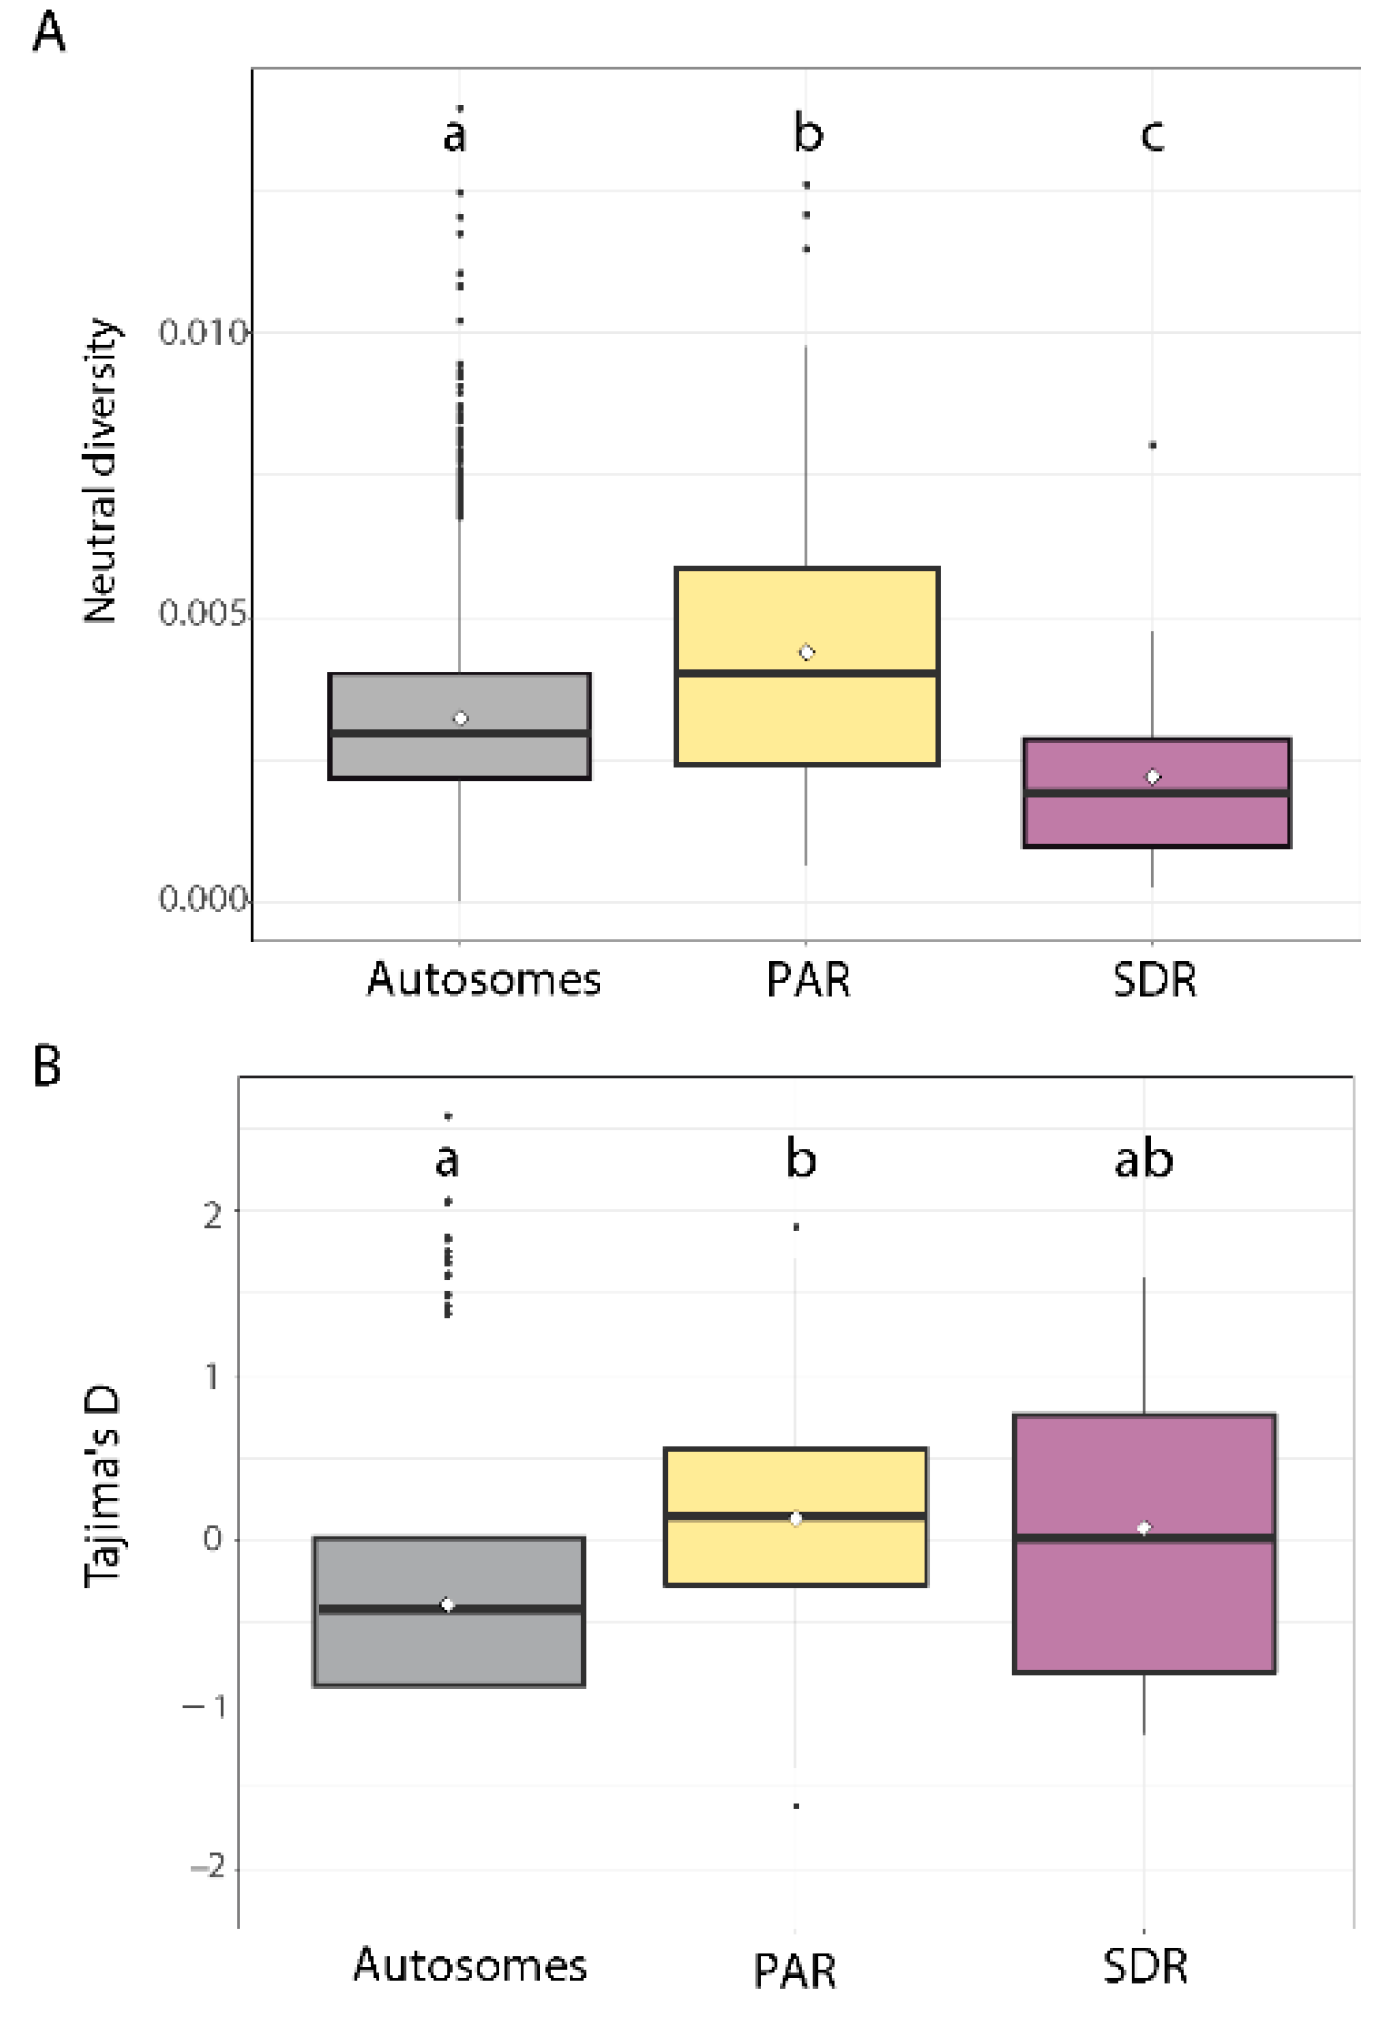
3.3. DNA Neutral Diversity
3.4. Comparison of DNA Neutral Genetic Diversity Pattern between the Four Study Populations
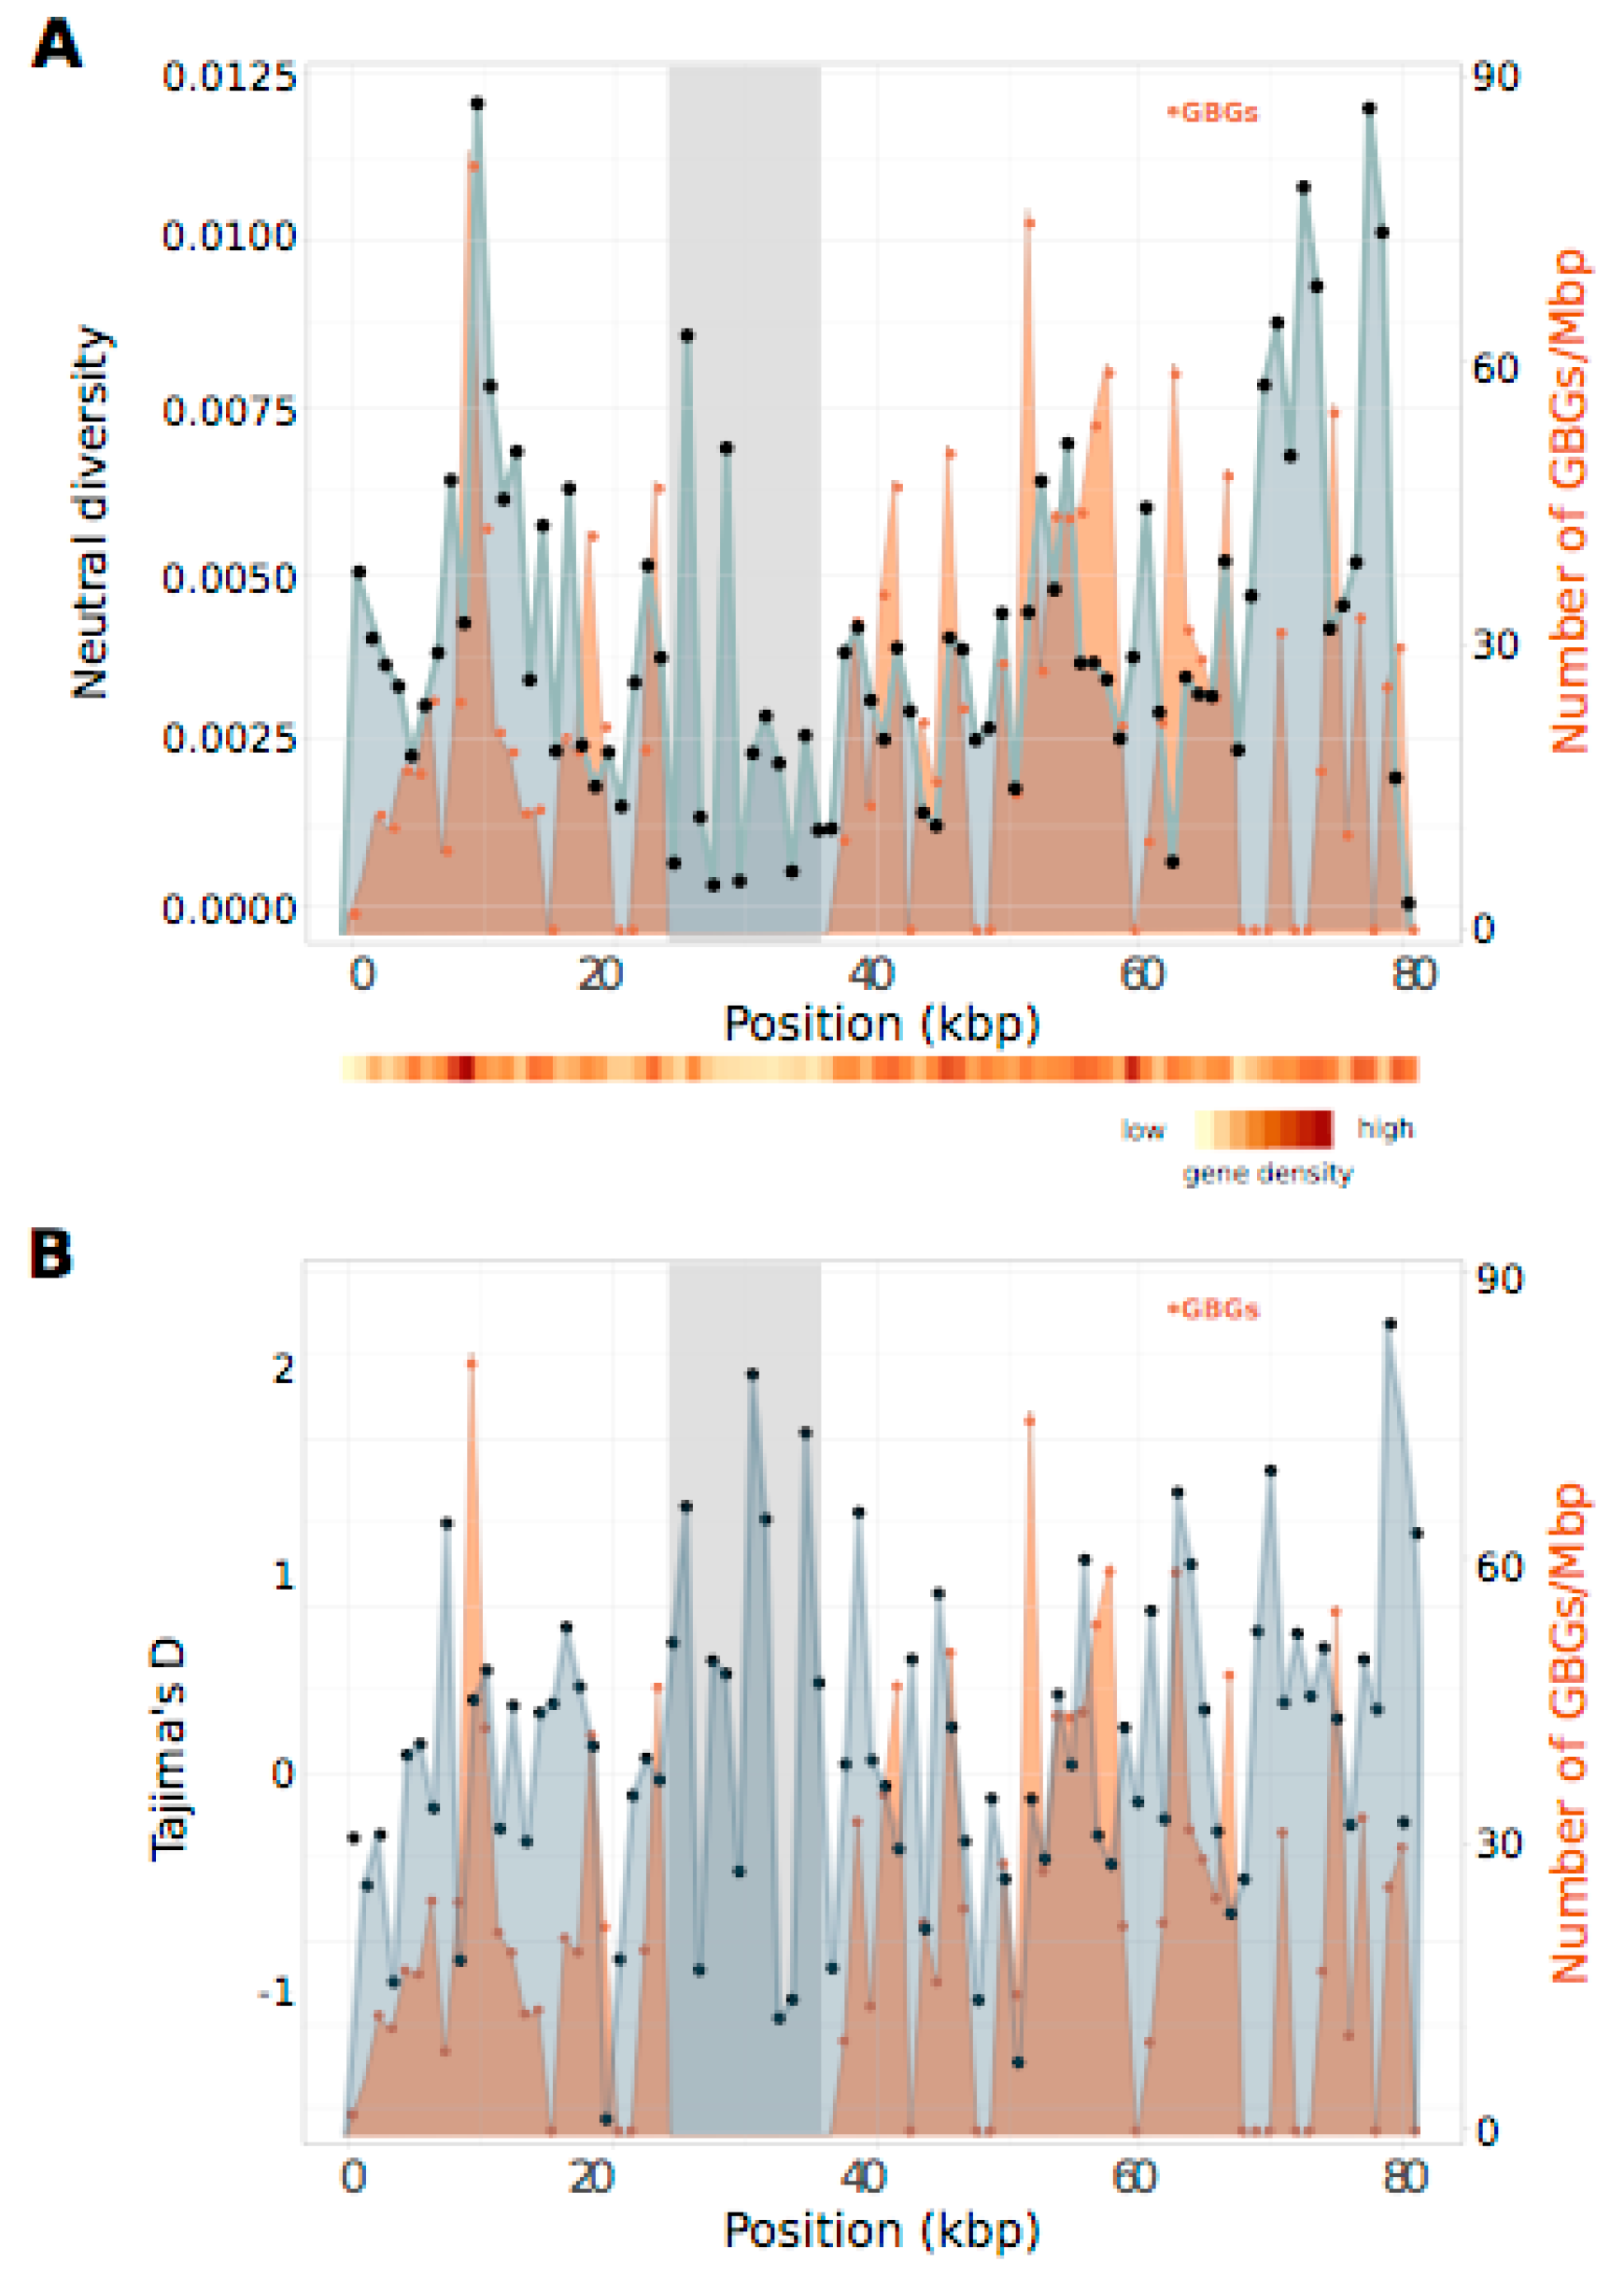
3.5. PAR Nucleotide Diversity and Generation-Biased Genes
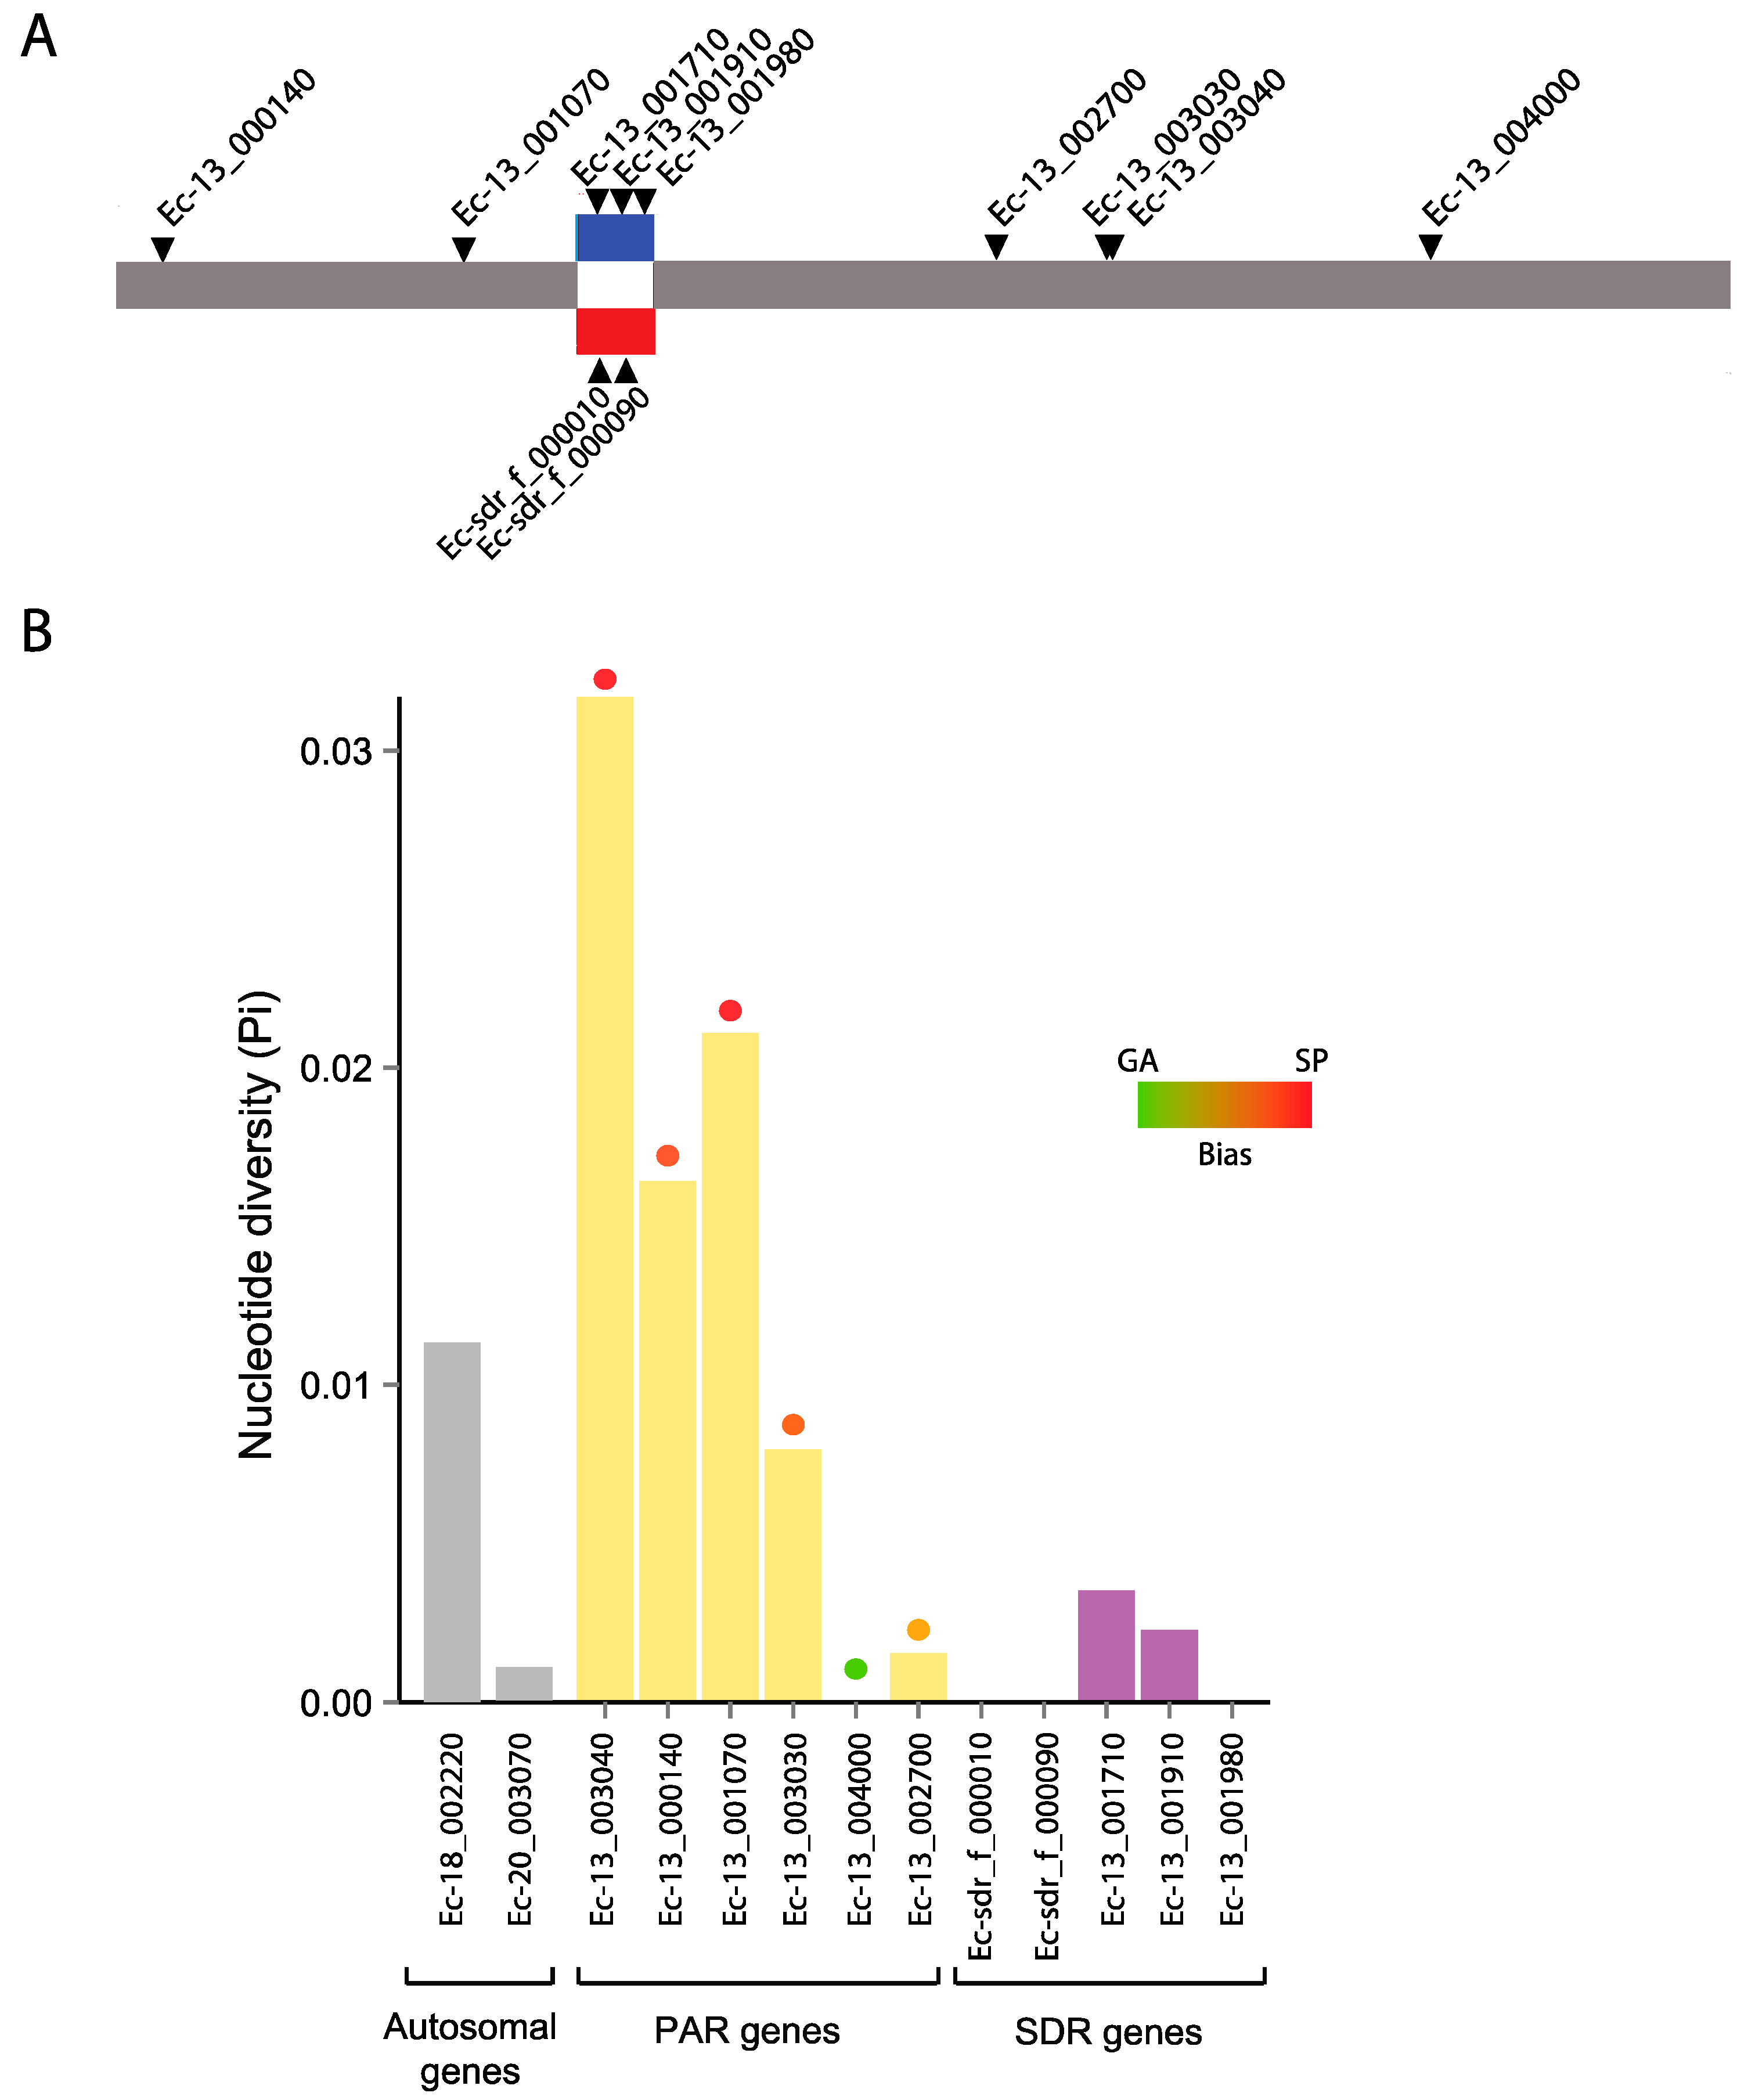
3.6. Genetic Diversity in a Selected Subset of Autosomal, PAR and SDR Genes
3.7. Evolutionary Histories of the Selected Autosomal, PAR and SDR Genes
4. Discussion
4.1. Non-Recombining Regions in U and V Chromosomes Exhibit Reduced Neutral Diversity
4.2. Increased Nucleotide Diversity on the PAR Compared with Autosomes
4.3. Lack of a Regional Pattern of PAR Diversity in Relation to the SDR
5. Conclusions
Supplementary Materials
Author Contributions
Funding
Acknowledgments
Conflicts of Interest
References
- Bachtrog, D. Y-chromosome evolution: Emerging insights into processes of Y-chromosome degeneration. Nat. Rev. Genet. 2013, 14, 113. [Google Scholar] [CrossRef] [PubMed]
- Charlesworth, B.; Charlesworth, D. The degeneration of Y chromosomes. Philos. Trans. R. Soc. B Biol. Sci. 2000, 355, 1563–1572. [Google Scholar] [CrossRef] [PubMed]
- Cutter, A.D.; Payseur, B.A. Genomic signatures of selection at linked sites: Unifying the disparity among species. Nat. Rev. Genet. 2013, 14, 262. [Google Scholar] [CrossRef] [PubMed]
- Hill, W.G.; Robertson, A. The effect of linkage on limits to artificial selection. Genet. Res. 1966, 8, 269–294. [Google Scholar] [CrossRef] [PubMed]
- Charlesworth, B. The effects of deleterious mutations on evolution at linked sites. Genetics 2012, 190, 5–22. [Google Scholar] [CrossRef] [PubMed]
- Kimura, M. The number of heterozygous nucleotide sites maintained in a finite population due to steady flux of mutations. Genetics 1969, 61, 893–903. [Google Scholar] [PubMed]
- Hellborg, L.; Ellegren, H. Low levels of nucleotide diversity in mammalian Y chromosomes. Mol. Biol. Evolut. 2004, 21, 158–163. [Google Scholar] [CrossRef] [PubMed]
- Qiu, S.; Bergero, R.; Forrest, A.; Kaiser, V.B.; Charlesworth, D. Nucleotide diversity in Silene latifolia autosomal and sex-linked genes. Proc. R. Soc. Lond. B Biol. Sci. 2010, 277, 3283–3290. [Google Scholar] [CrossRef] [PubMed]
- McAllister, B.F.; Charlesworth, B. Reduced Sequence Variability on the NeoY Chromosome of Drosophila americana americana. Genetics 1999, 153, 221–233. [Google Scholar] [PubMed]
- Handley, L.L.; Hammond, R.; Emaresi, G.; Reber, A.; Perrin, N. Low Y chromosome variation in Saudi-Arabian hamadryas baboons (Papio hamadryas hamadryas). Heredity 2006, 96, 298. [Google Scholar] [CrossRef] [PubMed]
- Ellis, N.; Taylor, A.; Bengtsson, B.O.; Kidd, J.; Rogers, J. Population structure of the human pseudoautosomal boundary. Nature 1990, 344, 663. [Google Scholar] [CrossRef] [PubMed]
- Toder, R.; Graves, J.A.M. CSF2RA, ANT3, and STS are autosomal in marsupials: Implications for the origin of the pseudoautosomal region of mammalian sex chromosomes. Mamm. Genome 1998, 9, 373–376. [Google Scholar] [CrossRef] [PubMed]
- Otto, S.P.; Pannell, J.R.; Peichel, C.L.; Ashman, T.-L.; Charlesworth, D.; Chippindale, A.K.; Delph, L.F.; Guerrero, R.F.; Scarpino, S.V.; McAllister, B.F. About PAR: The distinct evolutionary dynamics of the pseudoautosomal region. Trends Genet. 2011, 27, 358–367. [Google Scholar] [CrossRef] [PubMed]
- Charlesworth, B.; Jordan, C.Y.; Charlesworth, D. The evolutionary dynamics of sexually antagonistic mutations in pseudoautosomal regions of sex chromosomes. Evolution 2014, 68, 1339–1350. [Google Scholar] [CrossRef] [PubMed]
- Jordan, C.Y.; Charlesworth, D. The potential for sexually antagonistic polymorphism in different genome regions. Evolution 2012, 66, 505–516. [Google Scholar] [CrossRef] [PubMed]
- Kirkpatrick, M.; Guerrero, R.F. Signatures of sex-antagonistic selection on recombining sex chromosomes. Genetics 2014, 197, 531–541. [Google Scholar] [CrossRef] [PubMed]
- Kirkpatrick, M.; Guerrero, R.F.; Scarpino, S.V. Patterns of neutral genetic variation on recombining sex chromosomes. Genetics 2010, 184, 1141–1152. [Google Scholar] [CrossRef] [PubMed]
- Guirao-Rico, S.; Sánchez-Gracia, A.; Charlesworth, D. Sequence diversity patterns suggesting balancing selection in partially sex-linked genes of the plant Silene latifolia are not generated by demographic history or gene flow. Mol. Ecol. 2017, 26, 1357–1370. [Google Scholar] [CrossRef] [PubMed]
- Qiu, S.; Bergero, R.; Charlesworth, D. Testing for the footprint of sexually antagonistic polymorphisms in the pseudoautosomal region of a plant sex chromosome pair. Genetics 2013, 194, 663–672. [Google Scholar] [CrossRef] [PubMed]
- Wilson Sayres, M.A. Genetic diversity on the sex chromosomes. Genome Biol. Evolut. 2018, 10, 1064–1078. [Google Scholar] [CrossRef] [PubMed]
- Bachtrog, D.; Kirkpatrick, M.; Mank, J.E.; McDaniel, S.F.; Pires, J.C.; Rice, W.; Valenzuela, N. Are all sex chromosomes created equal? Trends Genet. 2011, 27, 350–357. [Google Scholar] [CrossRef] [PubMed]
- Bull, J.J. Sex chromosomes in haploid dioecy: A unique contrast to Muller's theory for diploid dioecy. Am. Nat. 1978, 112, 245–250. [Google Scholar] [CrossRef]
- Cole, K.M.; Sheath, R.G. Biology of the Red Algae; Cambridge University Press: Cambridge, UK, 1990. [Google Scholar]
- Lindblad-Toh, K.; Wade, C.M.; Mikkelsen, T.S.; Karlsson, E.K.; Jaffe, D.B.; Kamal, M.; Clamp, M.; Chang, J.L.; Kulbokas Iii, E.J.; Zody, M.C.; et al. Genome sequence, comparative analysis and haplotype structure of the domestic dog. Nature 2005, 438, 803. [Google Scholar] [CrossRef] [PubMed]
- Makova, K.D.; Li, W.-H. Strong male-driven evolution of DNA sequences in humans and apes. Nature 2002, 416, 624. [Google Scholar] [CrossRef] [PubMed]
- Ahmed, S.; Cock, J.M.; Pessia, E.; Luthringer, R.; Cormier, A.; Robuchon, M.; Sterck, L.; Peters, A.F.; Dittami, S.M.; Corre, E.; et al. A haploid system of sex determination in the brown alga Ectocarpus sp. Curr. Biol. 2014, 24, 1945–1957. [Google Scholar] [CrossRef] [PubMed]
- Cock, J.M.; Sterck, L.; Rouze, P.; Scornet, D.; Allen, A.E.; Amoutzias, G.; Anthouard, V.; Artiguenave, F.; Aury, J.-M.; Badger, J.H.; et al. The Ectocarpus genome and the independent evolution of multicellularity in brown algae. Nature 2010, 465, 617–621. [Google Scholar] [CrossRef] [PubMed]
- Luthringer, R.; Lipinska, A.P.; Roze, D.; Cormier, A.; Macaisne, N.; Peters, A.F.; Cock, J.M.; Coelho, S.M. The Pseudoautosomal Regions of the U/V Sex Chromosomes of the Brown Alga Ectocarpus Exhibit Unusual Features. Mol. Biol. Evolut. 2015, 32, 2973–2985. [Google Scholar] [CrossRef] [PubMed]
- Lipinska, A.P.; Toda, N.R.; Heesch, S.; Peters, A.F.; Cock, J.M.; Coelho, S.M. Multiple gene movements into and out of haploid sex chromosomes. Genome Biol. 2017, 18, 104. [Google Scholar] [CrossRef] [PubMed]
- Avia, K.; Coelho, S.M.; Montecinos, G.J.; Cormier, A.; Lerck, F.; Mauger, S.; Faugeron, S.; Valero, M.; Cock, J.M.; Boudry, P. High-density genetic map and identification of QTLs for responses to temperature and salinity stresses in the model brown alga Ectocarpus. Sci. Rep. 2017, 7, 43241. [Google Scholar] [CrossRef] [PubMed]
- Cormier, A.; Avia, K.; Sterck, L.; Derrien, T.; Wucher, V.; Andres, G.; Monsoor, M.; Godfroy, O.; Lipinska, A.; Perrineau, M.M. Re-annotation, improved large-scale assembly and establishment of a catalogue of noncoding loci for the genome of the model brown alga Ectocarpus. New Phytol. 2017, 214, 219–232. [Google Scholar] [CrossRef] [PubMed]
- Heesch, S.; Cho, G.Y.; Peters, A.F.; Le Corguille, G.; Falentin, C.; Boutet, G.; Coedel, S.; Jubin, C.; Samson, G.; Corre, E.; et al. A sequence-tagged genetic map for the brown alga Ectocarpus siliculosus provides large-scale assembly of the genome sequence. New Phytol. 2010, 188, 42–51. [Google Scholar] [CrossRef] [PubMed]
- Montecinos, A.E.; Couceiro, L.; Peters, A.F.; Desrut, A.; Valero, M.; Guillemin, M.L. Species delimitation and phylogeographic analyses in the Ectocarpus subgroup siliculosi (Ectocarpales, Phaeophyceae). J. Phycol. 2017, 53, 17–31. [Google Scholar] [CrossRef] [PubMed]
- Mignerot, L.; Avia, K.; Luthringer, R.; Lipinska, A.P.; Cock, J.M.; Coelho, S.M. Genetic and cellular characterization of parthenogenesis in the brown alga Ectocarpus. In preparation. 2018. [Google Scholar]
- Coelho, S.M.; Scornet, D.; Rousvoal, S.; Peters, N.; Dartevelle, L.; Peters, A.F.; Cock, J.M. Genetic crosses between Ectocarpus strains. Cold Spring Harbor Protocols 2012, 2012, pdb. prot067942. [Google Scholar] [CrossRef] [PubMed]
- Coelho, S.M.; Scornet, D.; Rousvoal, S.; Peters, N.T.; Dartevelle, L.; Peters, A.F.; Cock, J.M. How to cultivate Ectocarpus. Cold Spring Harbor Protocols 2012, 2012, pdb. prot067934. [Google Scholar] [CrossRef] [PubMed]
- Lipinska, A.P.; Ahmed, S.; Peters, A.F.; Faugeron, S.; Cock, J.M.; Coelho, S.M. Development of PCR-based markers to determine the sex of kelps. PLoS ONE 2015, 10, e0140535. [Google Scholar] [CrossRef] [PubMed]
- Broman, K.W.; Wu, H.; Sen, Ś.; Churchill, G.A. R/qtl: QTL mapping in experimental crosses. Bioinformatics 2003, 19, 889–890. [Google Scholar] [CrossRef] [PubMed]
- Van Ooijen, J. MapQTL® 5. In Software for the Mapping of Quantitative Trait Loci in Experimental Populations; Kyazma BV: Wageningen, The Netherlands, 2004. [Google Scholar]
- Broman, K.W.; Kwak, I.-Y. xoi: Tools for Analyzing Crossover Interference. R Package Version 0.67-4. Available online: https://github.com/kbroman/xoi (accessed on 5 June 2018).
- Couceiro, L.; Le Gac, M.; Hunsperger, H.M.; Mauger, S.; Destombe, C.; Cock, J.M.; Ahmed, S.; Coelho, S.M.; Valero, M.; Peters, A.F. Evolution and maintenance of haploid-diploid life cycles in natural populations: The case of the marine brown alga Ectocarpus. Evolution 2015, 69, 1808–1822. [Google Scholar] [CrossRef] [PubMed]
- Montecinos, A.E.; Guillemin, M.L.; Couceiro, L.; Peters, A.F.; Stoeckel, S.; Valero, M. Hybridization between two cryptic filamentous brown seaweeds along the shore: Analysing pre-and postzygotic barriers in populations of individuals with varying ploidy levels. Mol. Ecol. 2017, 26, 3497–3512. [Google Scholar] [CrossRef] [PubMed]
- Peterson, B.K.; Weber, J.N.; Kay, E.H.; Fisher, H.S.; Hoekstra, H.E. Double digest RADseq: An inexpensive method for de novo SNP discovery and genotyping in model and non-model species. PLoS ONE 2012, 7, e37135. [Google Scholar] [CrossRef] [PubMed]
- Li, H. Aligning sequence reads, clone sequences and assembly contigs with BWA-MEM. arXiv, 2013; arXiv:1303.3997. [Google Scholar]
- Pearson, G.; Lago-Leston, A.; Valente, M.; Serrão, E. Simple and rapid RNA extraction from freeze-dried tissue of brown algae and seagrasses. Eur. J. Phycol. 2006, 41, 97–104. [Google Scholar] [CrossRef]
- Danecek, P.; Auton, A.; Abecasis, G.; Albers, C.A.; Banks, E.; DePristo, M.A.; Handsaker, R.E.; Lunter, G.; Marth, G.T.; Sherry, S.T. The variant call format and VCFtools. Bioinformatics 2011, 27, 2156–2158. [Google Scholar] [CrossRef] [PubMed]
- Martin, S.H.; Möst, M.; Palmer, W.J.; Salazar, C.; McMillan, W.O.; Jiggins, F.M.; Jiggins, C.D. Natural selection and genetic diversity in the butterfly Heliconius melpomene. Genetics 2016, 203, 525–541. [Google Scholar] [CrossRef] [PubMed][Green Version]
- Catchen, J.; Hohenlohe, P.A.; Bassham, S.; Amores, A.; Cresko, W.A. Stacks: An analysis tool set for population genomics. Mol. Ecol. 2013, 22, 3124–3140. [Google Scholar] [CrossRef] [PubMed]
- Librado, P.; Rozas, J. DnaSP v5: A software for comprehensive analysis of DNA polymorphism data. Bioinformatics 2009, 25, 1451–1452. [Google Scholar] [CrossRef] [PubMed]
- Stoletzki, N.; Eyre-Walker, A. Estimation of the neutrality index. Mol. Biol. Evolut. 2010, 28, 63–70. [Google Scholar] [CrossRef] [PubMed]
- Wickham, H. ggplot2. In Wiley Interdisciplinary Reviews: Computational Statistics; Wiley: Hoboken, NJ, USA, 2011; Volume 3, pp. 180–185. [Google Scholar]
- Ectocarpus siliculosus V2. Available online: http://bioinformatics.psb.ugent.be/orcae/overview/EctsiV2 (accessed on 5 June 2018).
- Willing, E.-M.; Hoffmann, M.; Klein, J.D.; Weigel, D.; Dreyer, C. Paired-end RAD-seq for de novo assembly and marker design without available reference. Bioinformatics 2011, 27, 2187–2193. [Google Scholar] [CrossRef] [PubMed]
- Catchen, J.M.; Hohenlohe, P.A.; Bernatchez, L.; Funk, W.C.; Andrews, K.R.; Allendorf, F.W. Unbroken: RADseq remains a powerful tool for understanding the genetics of adaptation in natural populations. Mol. Ecol. Resour. 2017, 17, 362–365. [Google Scholar] [CrossRef] [PubMed]
- Lowry, D.B.; Hoban, S.; Kelley, J.L.; Lotterhos, K.E.; Reed, L.K.; Antolin, M.F.; Storfer, A. Breaking RAD: An evaluation of the utility of restriction site-associated DNA sequencing for genome scans of adaptation. Mol. Ecol. Resour. 2017, 17, 142–152. [Google Scholar] [CrossRef] [PubMed]
- Tajima, F. Statistical methods for testing the neutral mutation hypothesis by DNA polymorphism. Genetics 1989, 123, 585–595. [Google Scholar] [PubMed]
- Lipinska, A.P.; Luthringer, R.; Roze, D.; Cormier, A.; Peters, A.F.; Cock, J.M.; Coelho, S.M. Unusual features of the pseudoautosomal region of a U/V pair of sex chromosomes. Eur. J. Phycol. 2015, 50, 68. [Google Scholar]
- Lipinska, A.P.; Serrano-Serrano, M.; Peters, A.F.; Kogame, K.; Cock, J.M.; Coelho, S.M. Rapid turnover of life-cycle-related genes in the brown algae. bioRxiv 2018. [Google Scholar] [CrossRef]
- Charlesworth, B.; Campos, J.L. The relations between recombination rate and patterns of molecular variation and evolution in Drosophila. Annu. Rev. Genet. 2014, 48, 383–403. [Google Scholar] [CrossRef] [PubMed]
- Wilson Sayres, M.A.; Lohmueller, K.E.; Nielsen, R. Natural selection reduced diversity on human Y chromosomes. PLoS Genet. 2014, 10, e1004064. [Google Scholar] [CrossRef] [PubMed]
- Smeds, L.; Kawakami, T.; Burri, R.; Bolivar, P.; Husby, A.; Qvarnström, A.; Uebbing, S.; Ellegren, H. Genomic identification and characterization of the pseudoautosomal region in highly differentiated avian sex chromosomes. Nat. Commun. 2014, 5, 5448. [Google Scholar] [CrossRef] [PubMed]
- Hough, J.; Wang, W.; Barrett, S.C.; Wright, S.I. Hill-Robertson interference reduces genetic diversity on a young plant Y-chromosome. Genetics 2017, 207, 685–695. [Google Scholar] [CrossRef] [PubMed]
- Smeds, L.; Warmuth, V.; Bolivar, P.; Uebbing, S.; Burri, R.; Suh, A.; Nater, A.; Bureš, S.; Garamszegi, L.Z.; Hogner, S. Evolutionary analysis of the female-specific avian W chromosome. Nat. Commun. 2015, 6, 7330. [Google Scholar] [CrossRef] [PubMed]
- Singh, N.D.; Koerich, L.B.; Carvalho, A.B.; Clark, A.G. Positive and purifying selection on the Drosophila Y chromosome. Mol. Biol. Evolut. 2014, 31, 2612–2623. [Google Scholar] [CrossRef] [PubMed]
- Comeron, J.M.; Williford, A.; Kliman, R. The Hill–Robertson effect: Evolutionary consequences of weak selection and linkage in finite populations. Heredity 2008, 100, 19. [Google Scholar] [CrossRef] [PubMed]
- McVean, G.A.; Charlesworth, B. The effects of Hill-Robertson interference between weakly selected mutations on patterns of molecular evolution and variation. Genetics 2000, 155, 929–944. [Google Scholar] [PubMed]
- Kawakami, T.; Smeds, L.; Backström, N.; Husby, A.; Qvarnström, A.; Mugal, C.F.; Olason, P.; Ellegren, H. A high-density linkage map enables a second-generation collared flycatcher genome assembly and reveals the patterns of avian recombination rate variation and chromosomal evolution. Mol. Ecol. 2014, 23, 4035–4058. [Google Scholar] [CrossRef] [PubMed]
- Lander, E.S.; Linton, L.M.; Birren, B.; Nusbaum, C.; Zody, M.C.; Baldwin, J.; Devon, K.; Dewar, K.; Doyle, M.; FitzHugh, W. Initial sequencing and analysis of the human genome. Nature 2001, 409, 860–921. [Google Scholar] [CrossRef] [PubMed]
- Aguade, M.; Miyashita, N.; Langley, C.H. Reduced variation in the yellow-achaete-scute region in natural populations of Drosophila melanogaster. Genetics 1989, 122, 607–615. [Google Scholar] [PubMed]
- Begun, D.J.; Aquadro, C.F. Levels of naturally occurring DNA polymorphism correlate with recombination rates in D. melanogaster. Nature 1992, 356, 519. [Google Scholar] [CrossRef] [PubMed]
- Nachman, M.W. Patterns of DNA variability at X-linked loci in Mus domesticus. Genetics 1997, 147, 1303–1316. [Google Scholar] [PubMed]
- Nachman, M.W.; Bauer, V.L.; Crowell, S.L.; Aquadro, C.F. DNA variability and recombination rates at X-linked loci in humans. Genetics 1998, 150, 1133–1141. [Google Scholar] [PubMed]
- Stephan, W.; Langley, C.H. Molecular genetic variation in the centromeric region of the X chromosome in three Drosophila ananassae populations. I. Contrasts between the vermilion and forked loci. Genetics 1989, 121, 89–99. [Google Scholar] [PubMed]
- Dvorřák, J.; Luo, M.-C.; Yang, Z.-L. Restriction fragment length polymorphism and divergence in the genomic regions of high and low recombination in self-fertilizing and cross-fertilizing Aegilops species. Genetics 1998, 148, 423–434. [Google Scholar]
- Kraft, T.; Säll, T.; Magnusson-Rading, I.; Nilsson, N.-O.; Halldén, C. Positive correlation between recombination rates and levels of genetic variation in natural populations of sea beet (Beta vulgaris subsp. maritima). Genetics 1998, 150, 1239–1244. [Google Scholar] [PubMed]
- Stephan, W.; Langley, C.H. DNA polymorphism in Lycopersicon and crossing-over per physical length. Genetics 1998, 150, 1585–1593. [Google Scholar] [PubMed]
- Badouin, H.; Gladieux, P.; Gouzy, J.; Siguenza, S.; Aguileta, G.; Snirc, A.; Le Prieur, S.; Jeziorski, C.; Branca, A.; Giraud, T. Widespread selective sweeps throughout the genome of model plant pathogenic fungi and identification of effector candidates. Mol. Ecol. 2017, 26, 2041–2062. [Google Scholar] [CrossRef] [PubMed]
- Hellmann, I.; Ebersberger, I.; Ptak, S.E.; Pääbo, S.; Przeworski, M. A neutral explanation for the correlation of diversity with recombination rates in humans. Am. J. Hum. Genet. 2003, 72, 1527–1535. [Google Scholar] [CrossRef] [PubMed]
- Tenaillon, M.I.; Sawkins, M.C.; Anderson, L.K.; Stack, S.M.; Doebley, J.; Gaut, B.S. Patterns of diversity and recombination along chromosome 1 of maize (Zea mays ssp. mays L.). Genetics 2002, 162, 1401–1413. [Google Scholar] [PubMed]
- Tenaillon, M.I.; Sawkins, M.C.; Long, A.D.; Gaut, R.L.; Doebley, J.F.; Gaut, B.S. Patterns of DNA sequence polymorphism along chromosome 1 of maize (Zea mays ssp. mays L.). Proc. Natl. Acad. Sci. USA 2001, 98, 9161–9166. [Google Scholar] [CrossRef] [PubMed]
- Tenaillon, M.I.; U'ren, J.; Tenaillon, O.; Gaut, B.S. Selection versus demography: A multilocus investigation of the domestication process in maize. Mol. Biol. Evolut. 2004, 21, 1214–1225. [Google Scholar] [CrossRef] [PubMed]
- Smeds, L.; Qvarnström, A.; Ellegren, H. Direct estimate of the rate of germline mutation in a bird. Genome Res. 2016, 26, 1211–1218. [Google Scholar] [CrossRef] [PubMed]
- Hudson, R.R.; Kaplan, N.L. The coalescent process in models with selection and recombination. Genetics 1988, 120, 831–840. [Google Scholar] [PubMed]


| Gene | Functional Description | No. of Sequences | Length of Region Studied (Total CDS) | Segregating Sites | No. of Haplotypes |
|---|---|---|---|---|---|
| Autosomes | |||||
| Ec-18_002220 | Alpha tubulin | 19 | 141 (1362) | 1 | 2 |
| Ec-20_003070 | Similar to G-protein coupled receptors | 20 | 747 (1650) | 1 | 2 |
| PAR | |||||
| Ec-13_003040 | Expressed unknown protein | 16 | 258 (450) | 28 | 10 |
| Ec-13_000140 | Expressed unknown protein | 19 | 603 (1200) | 8 | 2 |
| Ec-13_001070 | Expressed unknown protein | 12 | 390 (1728) | 6 | 5 |
| Ec-13_003030 | Expressed unknown protein | 9 | 330 (648) | 5 | 3 |
| Ec-13_004000 | Tetratricopeptide TPR_2 repeat protein | 13 | 423 (2997) | 0 | 1 |
| Ec-13_002700 | Expressed unknown protein | 18 | 606 (993) | 4 | 4 |
| SDR | |||||
| Ec-sdr_f_000010 | STE20-like serine/threonine kinase | 8 | 597 (1265) | 0 | 1 |
| Ec-sdr_f_000090 | GTPase activating protein | 9 | 543 (2547) | 0 | 1 |
| Ec-13_001710 | GTPase activating protein | 11 | 627 (1944) | 2 | 3 |
| Ec-13_001910 | STE20-like serine/threonine kinase | 9 | 1062 (1314) | 1 | 2 |
| Ec-13_001980 | Ubiquitin C-terminal hydrolase | 11 | 570 (1110) | 0 | 1 |
| Gene | πSyn # | DN/DS | DoS | Tajima’s D | p-Value | Fay and Wu’s H | p-Value | log2FC (SP/GA) * |
|---|---|---|---|---|---|---|---|---|
| Autosomes | ||||||||
| Ec-18_002220 | 0.01138 | 0 | No replacements | 0.417 | 0.368 | 0.257 | 0.196 | −0.52 |
| Ec-20_003070 | 0.00106 | 0.13 | 0.316 | −0.592 | 0.501 | −1.516 | 0.015 | −0.78 |
| PAR | ||||||||
| Ec-13_003040 | 0.032 | 0.512 | −0.223 | −1.740 | 0.0002 | −3.467 | 0.102 | 2.25 |
| Ec-13_000140 | 0.016 | 0.253 | 0.105 | 2.033 | 0.0007 | −1.392 | 0.167 | 6.52 |
| Ec-13_001070 | 0.02 | 0 | 0 | −0.120 | 0.443 | −0.848 | 0.171 | 1.19 |
| Ec-13_003030 | 0.008 | 0.494 | 0.158 | −1.678 | 0.013 | −4.278 | 0.0073 | 0.98 |
| Ec-13_004000 | 0 | 0.312 | no polymorphism | NA | NA | NA | NA | 0.71 |
| Ec-13_002700 | 0.002 | 0.109 | −0.265 | −1.381 | 0.050 | −0.863 | 0.101 | −0.44 |
| SDR | ||||||||
| Ec-sdr_f_000010 | 0 | 0 | no polymorphism | NA | NA | NA | NA | −0.27 |
| Ec-sdr_f_000090 | 0 | 0.6 | no polymorphism | NA | NA | NA | NA | 0.41 |
| Ec-13_001710 | 0.00351 | 0.692 | 0.190 | 0.199 | 0.399 | 0.255 | 0.412 | −0.53 |
| Ec-13_001910 | 0.00229 | 0.077 | 0.222 | 1.401 | 0.122 | −0.139 | 0.210 | 0.16 |
| Ec-13_001980 | 0 | 2.077 | no polymorphism | NA | NA | NA | NA | −0.54 |
© 2018 by the authors. Licensee MDPI, Basel, Switzerland. This article is an open access article distributed under the terms and conditions of the Creative Commons Attribution (CC BY) license (http://creativecommons.org/licenses/by/4.0/).
Share and Cite
Avia, K.; Lipinska, A.P.; Mignerot, L.; Montecinos, A.E.; Jamy, M.; Ahmed, S.; Valero, M.; Peters, A.F.; Cock, J.M.; Roze, D.; et al. Genetic Diversity in the UV Sex Chromosomes of the Brown Alga Ectocarpus. Genes 2018, 9, 286. https://doi.org/10.3390/genes9060286
Avia K, Lipinska AP, Mignerot L, Montecinos AE, Jamy M, Ahmed S, Valero M, Peters AF, Cock JM, Roze D, et al. Genetic Diversity in the UV Sex Chromosomes of the Brown Alga Ectocarpus. Genes. 2018; 9(6):286. https://doi.org/10.3390/genes9060286
Chicago/Turabian StyleAvia, Komlan, Agnieszka P. Lipinska, Laure Mignerot, Alejandro E. Montecinos, Mahwash Jamy, Sophia Ahmed, Myriam Valero, Akira F. Peters, J. Mark Cock, Denis Roze, and et al. 2018. "Genetic Diversity in the UV Sex Chromosomes of the Brown Alga Ectocarpus" Genes 9, no. 6: 286. https://doi.org/10.3390/genes9060286
APA StyleAvia, K., Lipinska, A. P., Mignerot, L., Montecinos, A. E., Jamy, M., Ahmed, S., Valero, M., Peters, A. F., Cock, J. M., Roze, D., & Coelho, S. M. (2018). Genetic Diversity in the UV Sex Chromosomes of the Brown Alga Ectocarpus. Genes, 9(6), 286. https://doi.org/10.3390/genes9060286