Article

Identifying Patients with Atrioventricular Septal Defect in Down Syndrome Populations by Using Self-Normalizing Neural Networks and Feature Selection

1
College of Life Science, Shanghai University, Shanghai 200444, China
2
Department of Medical Informatics, Erasmus MC, 3015 CE Rotterdam, The Netherlands
3
Department of Biostatistics and Computational Biology, School of Life Sciences, Fudan University, Shanghai 200438, China
4
Institute of Health Sciences, Shanghai Institutes for Biological Sciences, Chinese Academy of Sciences, Shanghai 200031, China
5
Department of Computer Science, Guangdong AIB Polytechnic, Guangzhou 510507, China
6
College of Information Engineering, Shanghai Maritime University, Shanghai 201306, China
*
Authors to whom correspondence should be addressed.
These authors contributed equally to this work.
Genes 2018, 9(4), 208; https://doi.org/10.3390/genes9040208
Submission received: 15 March 2018 / Revised: 28 March 2018 / Accepted: 3 April 2018 / Published: 12 April 2018
(This article belongs to the Special Issue Computational Approaches for Disease Gene Identification)

Abstract

:
Atrioventricular septal defect (AVSD) is a clinically significant subtype of congenital heart disease (CHD) that severely influences the health of babies during birth and is associated with Down syndrome (DS). Thus, exploring the differences in functional genes in DS samples with and without AVSD is a critical way to investigate the complex association between AVSD and DS. In this study, we present a computational method to distinguish DS patients with AVSD from those without AVSD using the newly proposed self-normalizing neural network (SNN). First, each patient was encoded by using the copy number of probes on chromosome 21. The encoded features were ranked by the reliable Monte Carlo feature selection (MCFS) method to obtain a ranked feature list. Based on this feature list, we used a two-stage incremental feature selection to construct two series of feature subsets and applied SNNs to build classifiers to identify optimal features. Results show that 2737 optimal features were obtained, and the corresponding optimal SNN classifier constructed on optimal features yielded a Matthew’s correlation coefficient (MCC) value of 0.748. For comparison, random forest was also used to build classifiers and uncover optimal features. This method received an optimal MCC value of 0.582 when top 132 features were utilized. Finally, we analyzed some key features derived from the optimal features in SNNs found in literature support to further reveal their essential roles.

1. Introduction

Congenital heart disease (CHD) is a defect of the heart structure at birth [1] and is one of the most common birth defects in America with 8 out 1000 newborns affected with different severities [2]. In 2010, more than 35,000 babies in the United States are born with CHD [2,3]. With the advances in medical technologies, majority of these babies can have active, productive lives with proper medical interference. To date, more than 1 million adults live with CHD in the United States [3], implying that this disease is a widely distributed and significant threat to the health of human beings.
As a structural defect of the heart at birth, CHD has similar major signs and symptoms to cardiovascular diseases, including rapid breathing, cyanosis, fatigue, and poor blood circulation, but do not hold the typical symptoms of other cardiovascular diseases, such as chest pain [4,5]. As a group of heart structural problems at birth, CHD can be further categorized into various subtypes based on detailed pathogenesis, including different regions of the cardiovascular system and similar symptoms [6]. Atrioventricular septal defect (AVSD) was previously described as common atrioventricular canal defect or endocardial cushion defect, but is found to be a clinically significant subtype of CHD, that accounts for over 5% of all CHD cases [7]. To geneticists, ASVD is particularly important because of its strong association with Down syndrome (DS) [4,8,9]. Babies with DS are likely to have AVSD with an incidence 2000 times higher than that in the euploid population. According to clinical statistics, approximately 15% to 20% of newborns with DS also suffer from the AVSD, indicating the potential relationship between these two diseases [10,11].
DS, also known as trisomy 21, is caused by a genetic disorder induced by the presence of all or part of a third copy of chromosome 21. The genetic contributions of trisomy 21 to the concurrence of DS and AVSD are more significant compared with other factors, even environmental factors. In 2012, a specific study [12] on CHD confirmed that variants in CRELD1, encoding an epidermal growth factor-related gene, contribute to the concurrence of DS and AVSD. In addition, researchers identified a group of CRELD1 variants that affect the susceptibility of AVSD in patients with DS, thus validating the genetic causative component of AVSD, especially in DS populations [12]. In 2015, two studies [13,14] confirmed that genes NKX2-5, GATA4, and CREL1 participate in the pathogenesis of AVSD in DS. In 2016, another study [15] focusing on all types of genetic contribution on AVSD in DS showed that not only the genetic variants but also other regulatory variants (e.g., altered microRNA expression) may participate in such pathogenesis. As a specific form of genetic variants, copy number variants (CNVs) have been widely identified in DS according to many recent publications. In 2017, a novel study provided by the Gene Expression Omnibus (GEO) database (GSE93004) [16,17] describing the CNVs anchored in chromosome 21 in DS confirmed that such a type of genetic variant may also affect the susceptibility of AVSD in patients with DS. However, this study did not reveal that the detailed regions/genes located on chromosome 21 that may contribute to the pathogenesis of AVSD in patients with DS. Therefore, in this study, we tried to find out an applicable computational method to identify the key genomic regions/genes that contribute to such pathogenesis.
Machine learning models provide a powerful solution to identify the crucial regions/genes associated with AVSD in patients with DS. These models have been used to analyze the CNV data for cancers [18,19]. For example, Ding et al. apply feature selection to identify crucial genes associated with cancer; these genes are further coded into conventional machine learning models to distinguish cancer samples from other control samples. However, these models still do not achieve high performance.
Deep learning has recently achieved remarkable results in computer vision and computational biology [20,21,22,23,24,25,26,27]. Most successful applications use many layers of convolutional or recurrent neural networks but are limited to vision or sequential tasks. For data without sequential characteristics or local structure, the feed-forward neural network (FNN) can be applied. Successfully using FNN with more than four layers is rarely reported. For deep network, the variations in the distributions of the activations are known as internal covariate shift [28], resulting in slow training and poor generalization [29,30,31]. In addition, training deep networks easily suffers from vanishing or exploding gradient [32], which can be avoided by stabilizing variance of activations. Thus, batch normalization [28] and other normalization tricks are applied to ensure zero mean and unit variance of activations and thus robustly learn many layers. However, these tricks are easily perturbed by stochastic gradient descent and dropout regularization. Both the convolutional neural network (CNN) and the recurrent neural network can cope with this issue using Rectified Linear Unit, weight sharing, or skip connection (residual network ResNet [33]). On the contrary, deep FNNs are sensitive to these perturbations and have high variance even when using all these techniques [32]. Currently, there are no effective techniques that can be applied for training deep FNNs. The self-normalizing neural network (SNN) [32] is proposed to handle the effect of the perturbations and build deep FNNs.
SNNs open the door for deep network applications on general data and are not limited to sequential and image data. It has been evaluated on 121 UCI tasks, and the results reveal that SNNs are superior to FNNs in all tasks and have outperformed random forests (RFs) and support vector machine (SVM) when the data size is greater than 1000. Furthermore, SNNs outperformed all other methods, including ultradeep CNNs, such as ResNet, on the Tox21 and astronomy dataset. The winning SNNs are deep [32].
In this study, we present machine learning-based methods to analyze CNV data of 236 patients with both DS and AVSD and 290 patients with only DS provided by the study from GEO we have mentioned above (GSE93004) [16]. Considering the high dimension of CNVs, we first apply feature selection methods to identify the informative genes that may contribute to the pathogenesis of AVSD. Then, we train a deep SNN model on those informative genes to classify patients with DS and AVSD from those only with DS. As a comparison, the powerful classification algorithm, RF [34], is also used to build classifiers and estimate their prediction abilities on distinguishing the two types of patient samples. With both qualitative and quantitative analyses, this study not only facilitates the identification of pathogenic genes contributing to AVSD in DS populations, but also lays a statistical foundation for further studies on the relationship and detailed mechanisms of CHD and DS.

2. Materials and Methods

We presented a machine learning-based method to identify the pathogenic genes associated with AVSD in DS population (Figure 1). We first collect copy number data of total 526 samples. Then, we applied feature selection methods to yield the informative genes. These informative features are further fed into a deep SNN classifier to classify patients with DS and AVSD from those only with DS and fed into Johnson reducer algorithm to generate some decision rules with biological support.

2.1. Dataset

We downloaded the copy number data of 236 patients with both DS and AVSD and 290 patients who had only DS and did not have other simple forms of CHD [16] from GEO [35]. The copy numbers of 52,842 probes on chromosome 21 were measured using Agilent Comparative Genomic Hybridization arrays (Agilent, Santa Clara, CA, USA). By investigating the copy number difference between patients with both DS and AVSD and patients with only DS, we may find the key genomic regions or genes that trigger the AVSD for patients with DS.

2.2. Feature Analysis

In this study, each patient sample was represented by 52,842 features derived from the copy number of probes. To select some essential features that might contribute to discriminating patients with DS and AVSD from those only with DS, a reliable feature selection procedure was necessary to achieve the goal. To this end, we applied Monte Carlo feature selection (MCFS) [36] and incremental feature selection (IFS) methods. The details are described in the following sections.

2.2.1. Monte Carlo Feature Selection Method

MCFS method is designed to rank informative features for supervised classifiers using sampling technique with replacement. In detail, a large number of decision tree classifiers are constructed, where each tree is grown from a bootstrapped dataset with a randomly selected feature subset. In addition, each feature f is assigned a score called relative importance (RIf). MCFS assigns greater RIf to feature f if it participates more in the classification using the tree classifiers. For each time, a feature subset is constructed with m features (mM, where M is the total number of features) and t tree classifiers are grown, wherein each of the t trees is trained by a random sampled training and test sets from the original training set. Repeating the abovementioned process s times, we obtained s feature subsets and a total of t × s tree classifiers. Then, for each feature, we calculate the score RI by estimating the overall number of splits involving this feature in all nodes of all constructed trees. Particularly, RI is estimated for feature f using the following equation:
RI f = τ = 1 s × t ( wAcc ) u n f ( τ ) IG ( n f ( τ ) ) ( no .   in   n f ( τ ) no .   in   τ ) v ,
where wAcc is the weighted accuracy for all samples, IG ( n f ( τ ) ) is the information gain of node n f ( τ ) , no .   in   n f ( τ ) is the number of samples in n f ( τ ) , no .   in   τ is the number of samples in tree τ, and u and v are fixed real numbers. By default u and v are set to 1, and a detailed discussion on how to set parameters of MCFS method can be found in Draminski et al. study [36]. The wAcc is defined as follows:
wAcc = 1 c i = 1 c n i i n i 1 + n i 2 + + n i c ,
where c reprents the number of classes and n i j denotes the number of samples from class i that are classified as class j . The IG ( n f ( τ ) ) is defined as follows:
IG ( n f ( τ ) ) = Entropy   ( T ) Entropy   ( T , f ) ,
where T is the target variable (class label) of node n f ( τ ) , Entropy   ( T ) is the entropy of the frequency table of variable T and Entropy   ( T , f ) is the entropy of the frequency table of the two variables T and f . One way of building a decision tree is to repeatedly find the attribute that returns the highest information gain. Both s and t should be sufficiently large so that a feature has a great chance to appear in many randomly generated feature subsets. Even so, there is still a chance that a feature is totally ignored by the algorithm. However, the great majority of the features are properly ranked by the algorithm which is sufficient for the feature selection in our work.
By using MCFS software downloaded from home page of Dramiński [37], we ranked all features. As a result, we yielded a ranked feature list in descending order according to their RI values, which can be formulated as
F = [ f 1 , f 2 , , f M ] ,
where M is the total 52,842 features.

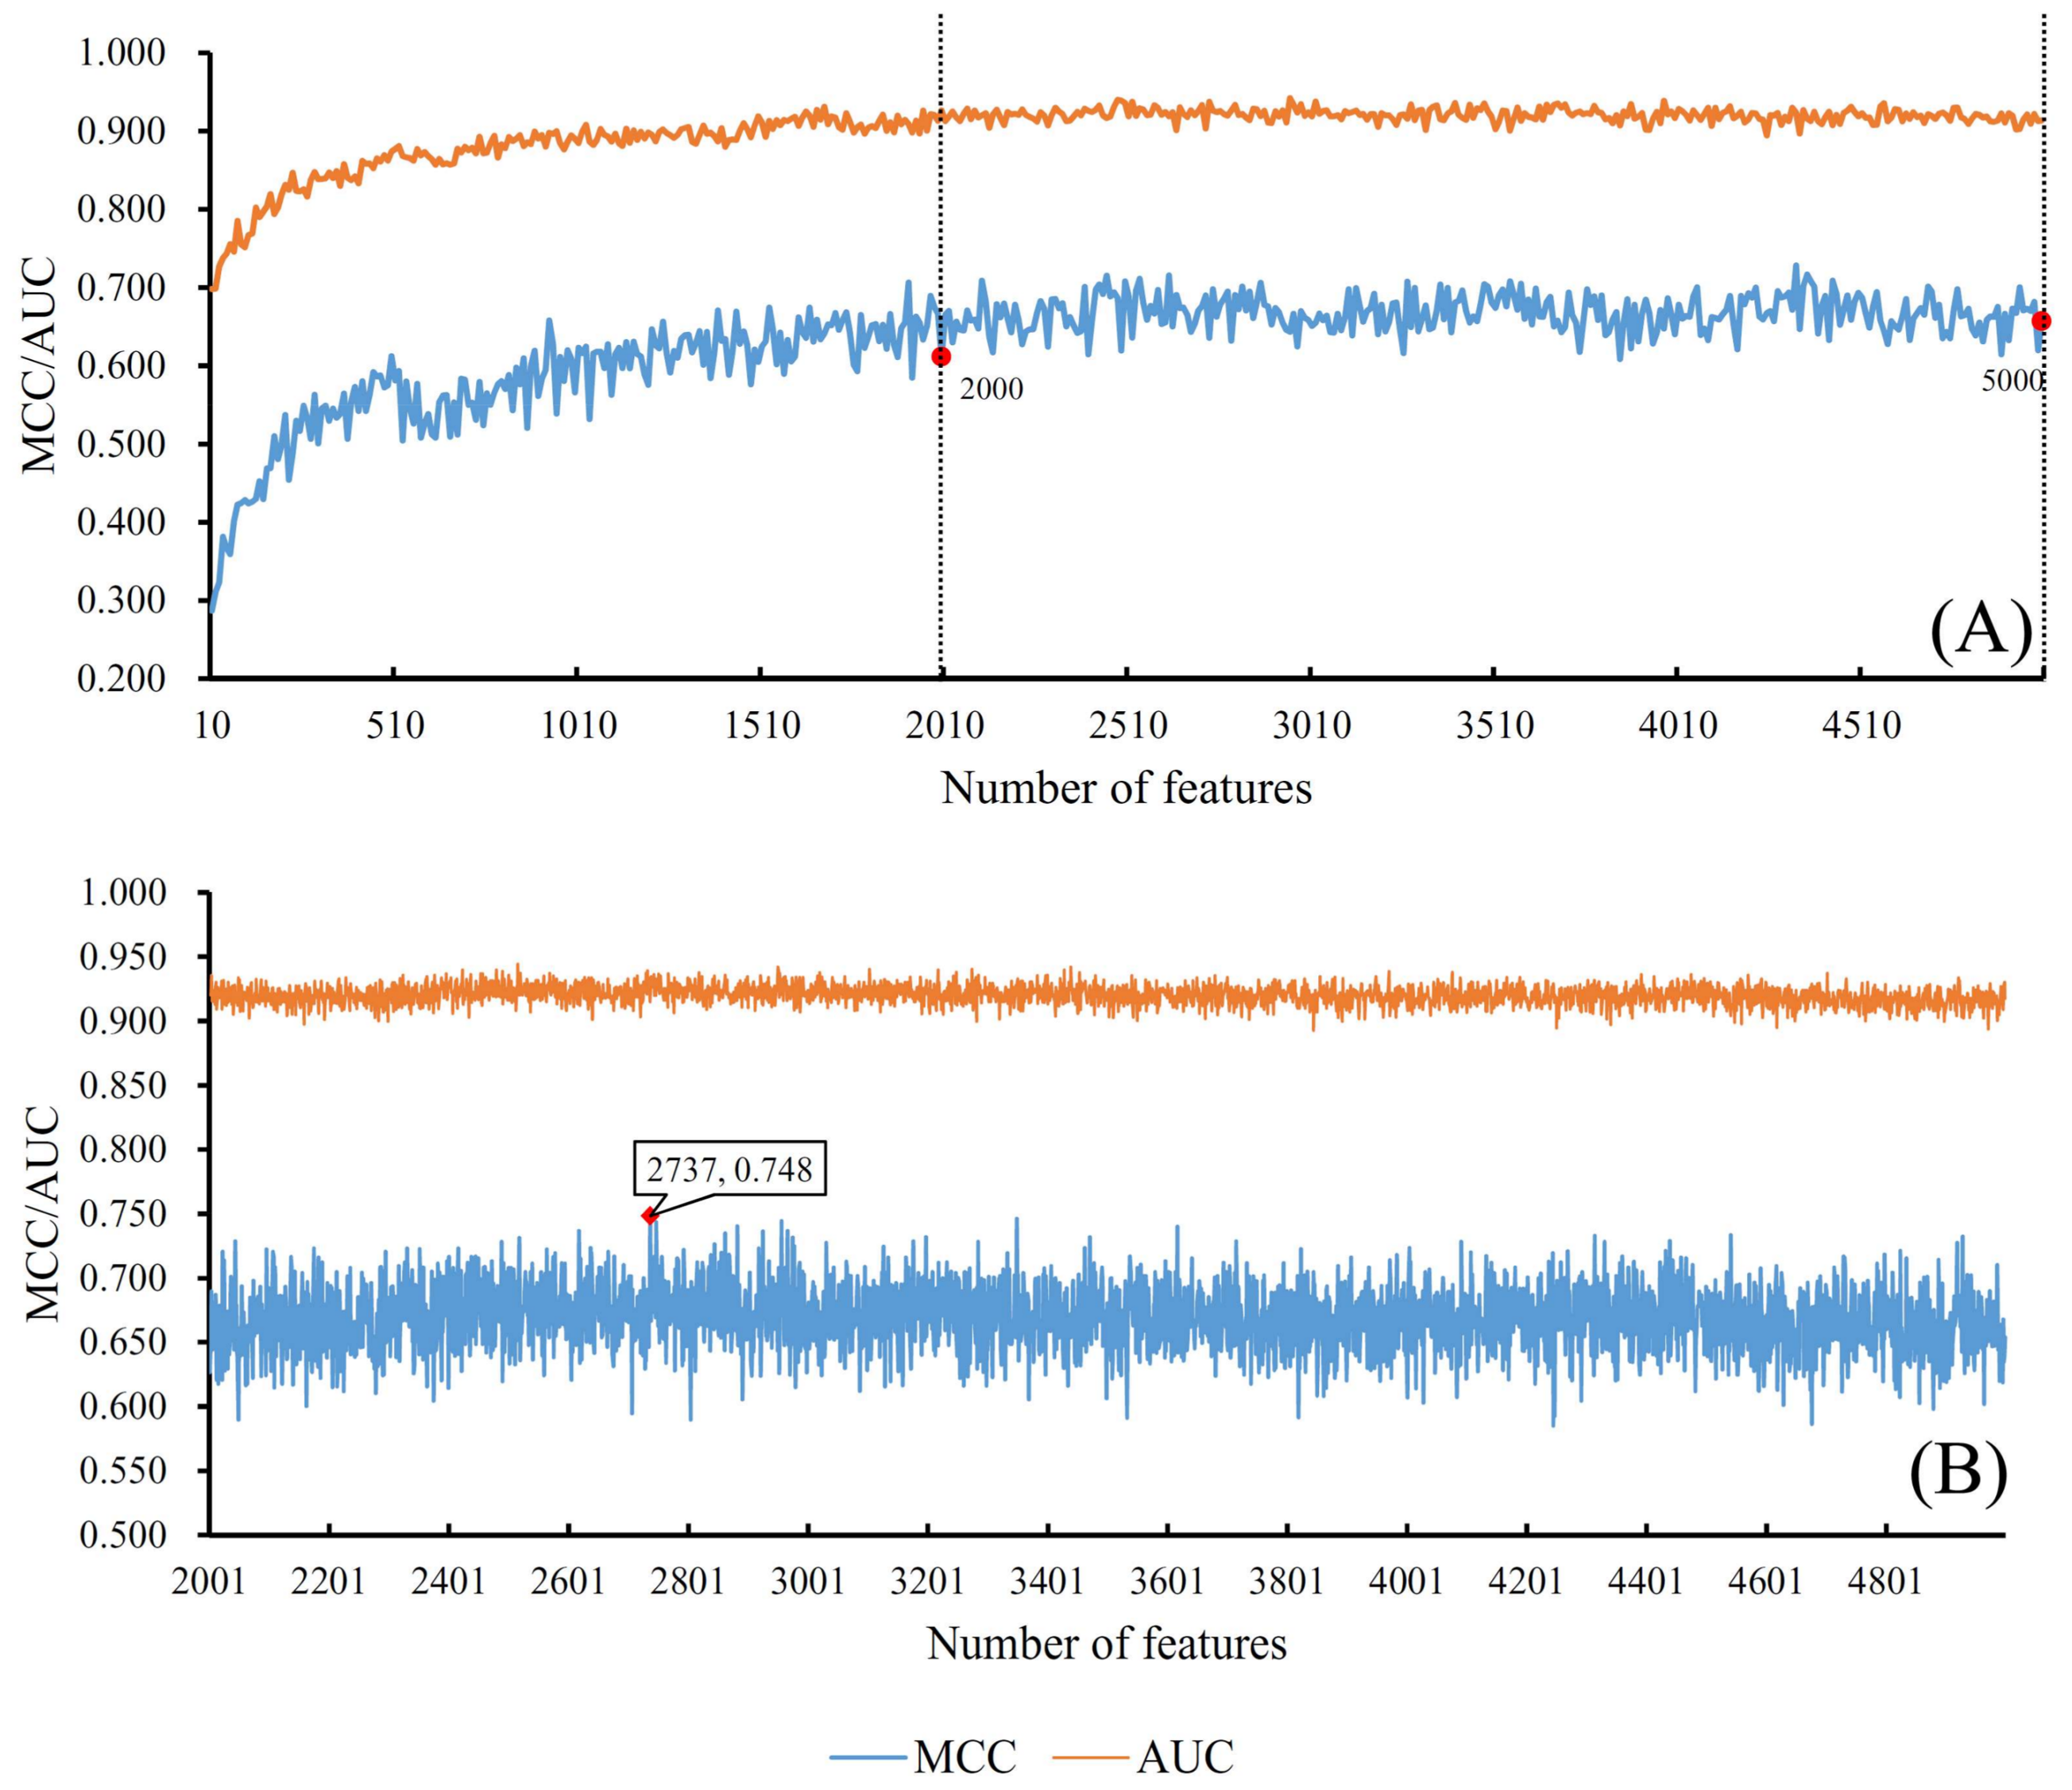
2.2.2. Incremental Feature Selection Method

Based on the ranked feature list yielded from MCFS, we attempted to further determine a group of optimal features with a supervised classifier, which would correctly distinguish the most of the two types of patient samples in our dataset. Many supervised classifiers can be used, such as SVM, RF, SNN, etc. In this study, we used SNN and RF (Section 2.3) as the supervised classifiers. Therefore, we performedIFS method on the ranked feature list. First, we constructed a series of feature subsets, formulated as S 1 1 , S 2 1 , …, S l 1 , where S i 1 = [ f 1 , f 2 , f i k ] , i.e., the ith feature subset contained the first i * k features in the original feature list. By using features in each feature subset to represent patient samples in dataset, one classifier was built. After testing all feature subsets, we would obtain good prediction performances in a feature interval represented as [min, max].
To exactly extract optimal features in this interval, another series of feature subsets, S m i n 2 , S m i n + 1 2 , …, S m a x 2 , was also constructed. Similarly, we tested all feature subsets by building classifiers on them. We obtained a feature subset with the best performance. Finally, the features in this feature subset were denoted as optimal features for further utilization. We believed that the optimal features contained key chromatin segments, which can be used to distinguish different patient samples. Simultaneously, we obtained an optimal classifier built on these optimal features.

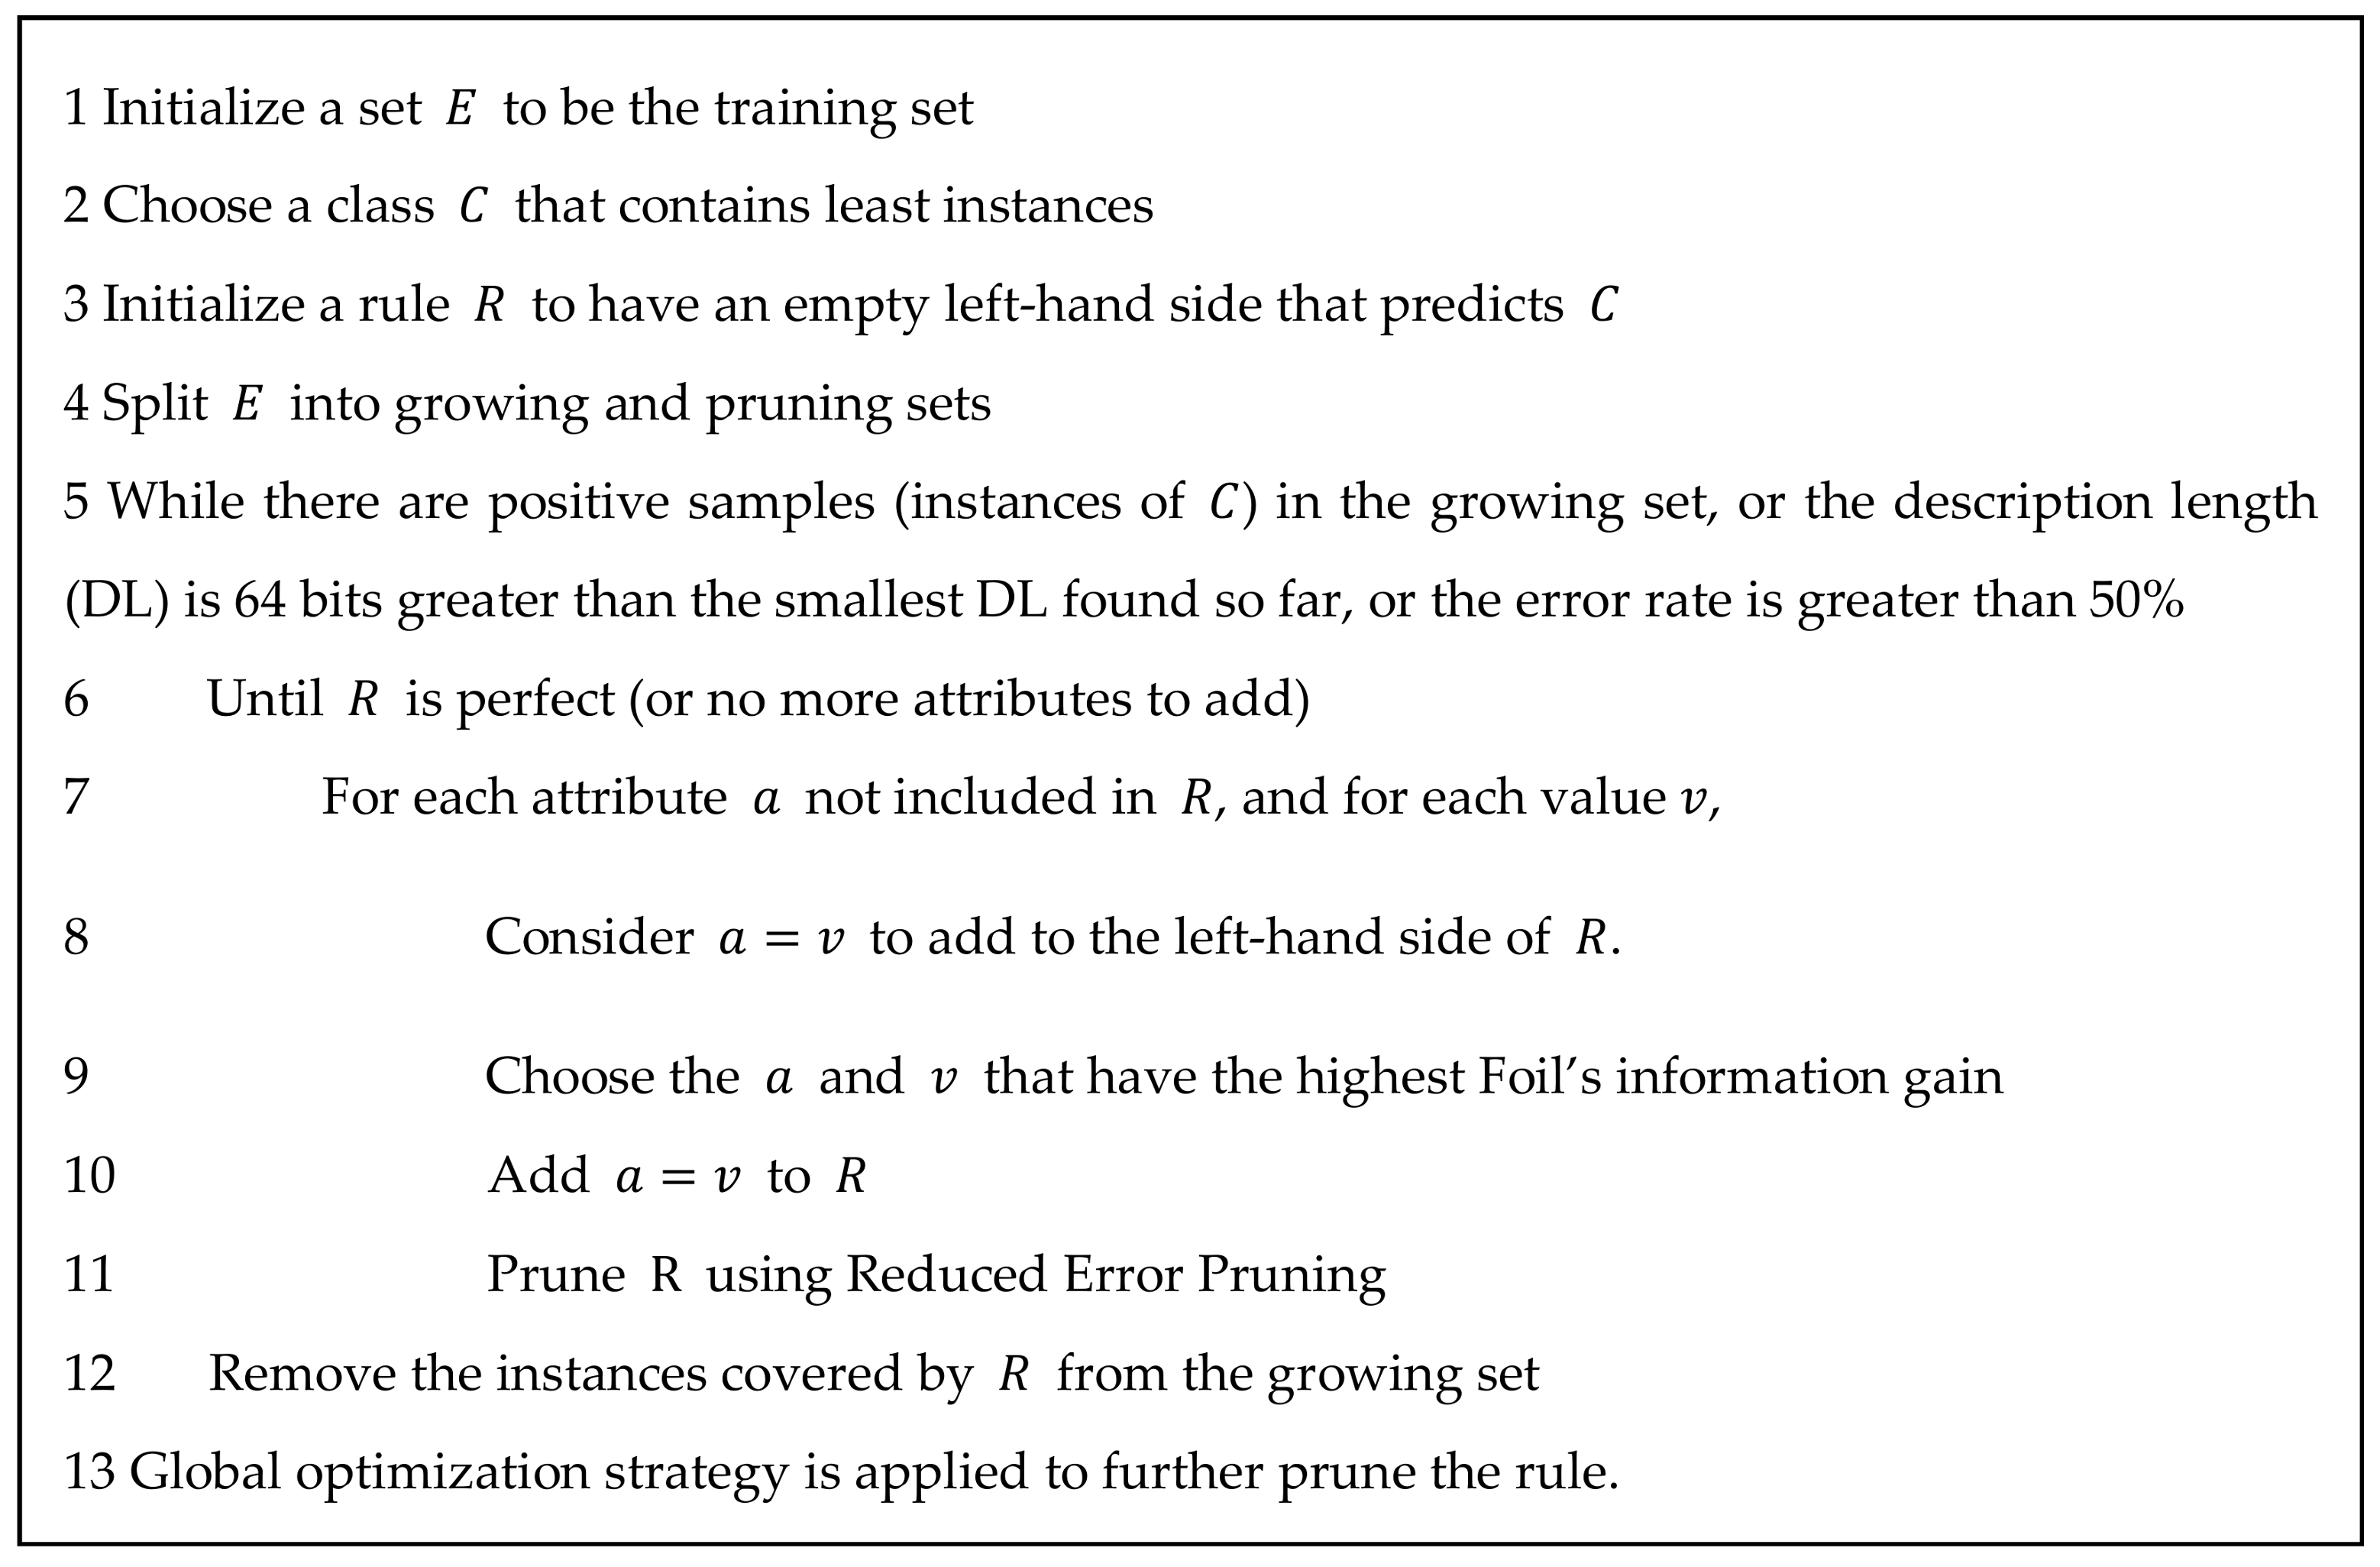
2.2.3. Rule Extraction

Based on the MCFS method, a feature list can be obtained as formulated in Equation (4). Informative features can be extracted from this list by selecting the top p% features in the list, where p is a predefined number. The Johnson Reducer algorithm [38] is then used to find a single reduction of the top p% features, which is a reduced subset of the features able to classify as well as using all of the features. Johnson Reducer algorithm is a greedy heuristic algorithm, which generates a reduction that is not guaranteed to have minimal size. Based on the reduction, Repeated Incremental Pruning to Produce Error Reduction (RIPPER) algorithm is applied to generate decision rules. The RIPPER, proposed by Cohen [39] in 1995, is a rule learning algorithm, which is capable of handling large noisy datasets effectively. It is an improved version of Incremental Reduced Error Pruning (IREP) [40], which combines both the separate-and-conquer technique used first in the relational learner FOIL, a system that learns Horn clauses from data expressed as relations [41], and the reduced error pruning strategy proposed by Brunk and Pazzani [42]. The RIPPER algorithm is described briefly in Figure 2.
In this study, the implementation of MCFS method from http://www.ipipan.eu/staff/m.draminski/mcfs.html integrates the rule extraction method mentioned above. By analyzing the extracted rules, a clearer comprehension can be achieved for DS population with AVSD. The rule extraction approach generates IF-THEN rules, which are more easily interpreted by a human being as they are similar to human language. In addition, it can narrow down the features to the most important ones which deserve special attention from related researchers.

2.3. Classification Algorithm

As described in Section 2.2.2, a classification algorithm is necessary to build classifiers on the feature subset derived from IFS method. In this study, a type of newly proposed neural network SNN and a widely used algorithm RF were applied. The mechanism on building classifiers is briefly listed as follows.

2.3.1. Self-Normalizing Neural Network Algorithm

SNN [32] is proposed to solve the problems by keeping the mean ( μ ) and variance ( v ) of activations to a certain interval and making it ( μ , v ) converge to a fixed point, particularly to ( 0 , 1 ) . Two techniques are adopted to achieve the self-normalizing properties as follows: (i) modify the activation functions; and (ii) initialize the weights of the network. The authors tweak an Exponential Linear Unit (ELU) activation function to obtain a Scale ELU (SELU) function.
selu ( x ) = λ { x   if   x > 0 α e x α   if   x 0
The authors [32] prove that after initializing the weights, SNN is indeed self-normalizing with the SELU function, and if v is too high and approaches the upper bound, it will decrease v , and if v is too low and approaches the lower bound, it will increase v .
In terms of initializing, Gaussian distribution with mean 0 and variance 1 n , where n is the number of weights, is applied. The authors prove that with such initializing and the fixed point being ( 0 , 1 ) , SNN obtains an optimum solution λ = 1.0507 and α = 1.6733 in SELU function [32].
In addition, alpha dropout [32] is proposed to maintain the self-normalizing properties. Instead of using zero, which would perturb the mean and variance, the authors suggest using α λ as the inputs of any dropout neurons. Then, the variance is preserved by applying an affine transformation a x + b where a , b can be computed relative to the dropout rate and the most negative activation.
In this study, all the constructed SNN classifiers have three hidden layers, each layer containing 200 hidden nodes.

2.3.2. Random Forest Algorithm

RF is an ensemble classifier [43], which grows multiple decision trees. In the training stage, two statistical techniques including bootstrap method [44] and random feature subsets [45] are combined to build decision trees. In the procedure of bootstrap, a training dataset containing N samples is repeatedly sampled B times (B as a parameter representing the number of decision trees). For each decision tree, the randomly selected N samples (with replacement) comprise its training set, and a random feature subset is adopted to split the nodes of this decision tree. Eventually, B decision trees are grown. For a new sample, each decision tree provides a predicted result, and the predicted result of the RF was finally determined by majority voting. To date, it has been applied to tackle many biological problems [46,47,48,49,50,51,52,53,54,55].
The RF algorithm was implemented by the RandomForest classifier with default parameters in Weka [56] software, which contains some state-of-the-art machine learning algorithms.

2.4. Performance Measurements

To evaluate prediction ability of SNN classifier, we performed a 10-fold cross-validation [57,58,59,60]. Compared with jackknife cross validation test [61,62], the 10-fold test usually yielded a similar result.
As a binary classification problem, each positive or negative sample received a predicted class label from the constructed classifier. By comparing with their real labels, four values are calculated. They are true positive (TP), true negative (TN), false negative (FN), and false positive (FP) [63], where TP/FN is the number of positive samples that are predicted correctly/incorrectly, TN/FP is the number of negative samples that are predicted correctly/incorrectly. Based on the four values, a measurement called Matthew’s correlation coefficient (MCC) [64] is calculated to evaluate the prediction ability of classifier, defined as follows:
M C C = T P × T N F P × F N ( T P + F P ) ( T P + F N ) ( T N + F P ) ( T N + F N )
The range of MCC is between −1 and 1. +1 represents a perfect prediction, 0 shows the prediction is close to random guessing and −1 indicates total disagreement between prediction and real labels. The predicted results were primarily evaluated using MCC because the two sample sizes in our dataset were slightly different.
In addition to MCC, we also employed the area under curve (AUC) for evaluating the performance of different classifiers. To calculate AUC, the receiver operating characteristic (ROC) curve should be plotted, which is defined by setting true positive rate (TPR) as its Y-axis and false positive rate (FPR) as its X-axis. Then, the AUC is defined as the value of area under the ROC curve. Generally, AUC is larger than 0.5 and a high AUC always implies good performance.

3. Results

In this study, we used different copy numbers of probes of chromosome 21 as input features to distinguish patients with DS and AVSD from those with only DS. To evaluate these features on discriminating two types of patient samples, a MCFS method was used to rank all features in descending order according to their RI values using Monte Carlo method and decision trees. We selected the top 5000 features (listed in Supplementary Material S1) in feature list and executed IFS method on them because our goal was to extract important features and most of them are weakly correlated with patient samples.

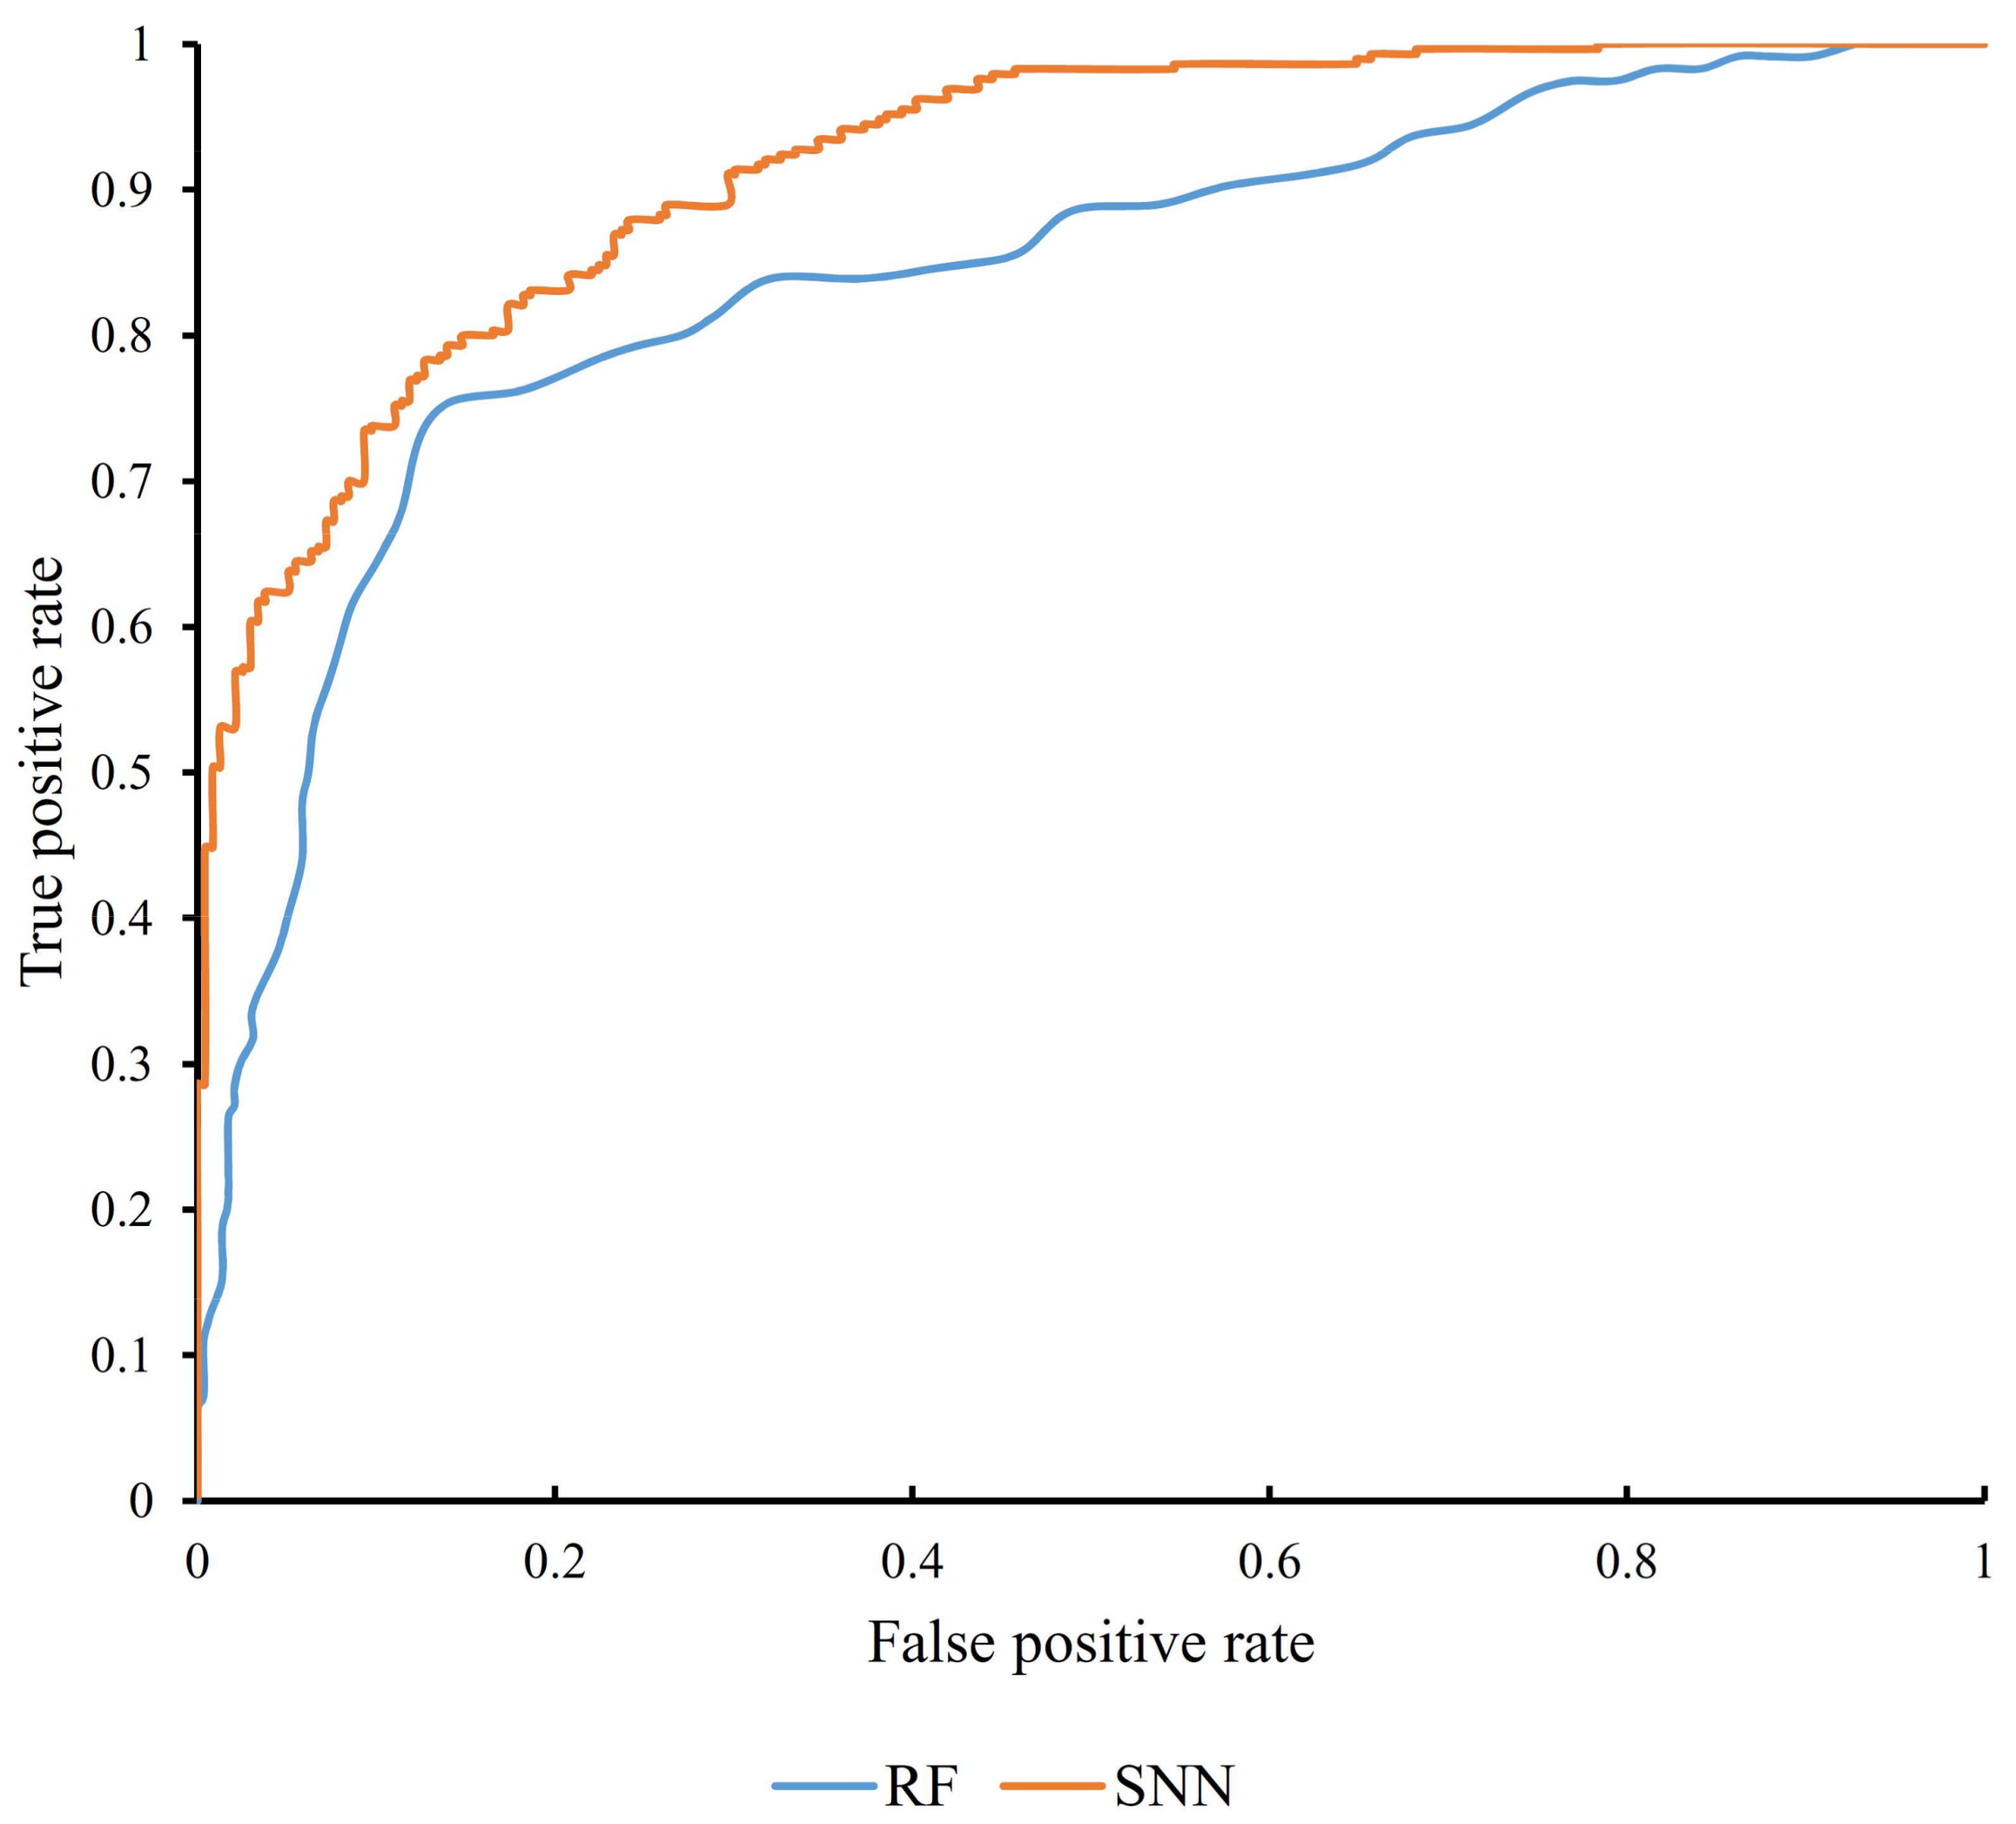
3.1. Results from Self-Normalizing Neural Network Algorithm

After the feature ranking procedure using MCFS, we obtained two series of feature subsets as introduced in Section 2.2.2. For the first series of feature subsets, the parameter k was set to 10. Thus, the ith feature subset contained top 10 * i features in the original feature list. Then, we constructed a SNN classifier on each feature subset, executed 10-fold cross validation test and calculated its MCC value. The obtained MCCs are listed in Supplementary Material S2. To provide a clear exhibition of these MCCs, we plotted an IFS curve using MCC as its Y-axis and the number used features as its X-axis, which is shown in Figure 3A. It can be observed that the IFS curve first follows a sharp increasing trend and then becomes stable. By careful checking, several good MCC values (most of them are larger than 0.600) were achieved by using number of features ranging from 2000 to 5000. Therefore, we determined a number interval [2001, 4999] for subsequent utilization.
The second series of feature subsets were built using the number of features in the number interval [2001, 4999]. Each feature subset had one more feature than the former one. Similarly, by testing all of them, we accessed several MCC values, which are also listed in Supplementary Material S2. Similarly, an IFS curve was also plotted to illustrate these values, which is shown in Figure 3B. The optimal MCC value (0.748) was yielded when top 2737 features were used to construct the SNN classifier (Table 1), which in turn demonstrated the discriminative ability of those top 2737 genes. In addition, we also ran the similar pipeline using RF as the classifier. The RF classifier yielded an optimum MCC 0.582 using optimum 132 features (see Section 3.2). RF yielded a much lower MCC than 0.748 of the SNN classifier, which demonstrated the power of deep SNN classifier. Accordingly, we obtained an optimal feature subset and an optimal SNN classifier.
As mentioned in Section 2.4, to give a full evaluation of different classifiers, we also counted the AUCs for all SNN classifiers, which are provided in Supplementary Material S2. Also, we plotted the IFS curves for these AUCs, which are shown in Figure 3. It can be seen that the trends of these IFS curves are always similar to those for MCCs. In addition, for the optimal SNN classifier, its AUC (0.915) is listed in Table 1 and the corresponding ROC curve is illustrated in Figure 4.

3.2. Results from Random Forest Algorithm

Similar to SNN algorithm, we also applied RF algorithm to build classifiers on feature subsets derived from IFS method, and each classifier was evaluated by a 10-fold cross validation test. Because the RF algorithm is quite fast, all feature sets containing 10–5000 features were tested. The obtained MCC and AUC values are provided in Supplementary Material S3. Also, for a good observation, the IFS curves for MCC and AUC were plotted in Figure 5, from which we can see that the optimal MCC value is 0.582 when top 132 features in feature list were used (Table 1). Accordingly, the top 132 features and RF algorithm can construct the optimal RF classifier. The AUC yielded by this classifier was also calculated, it was 0.834 (Table 1). Obviously, the MCC and AUC obtained by the optimal RF classifier were much less than those obtained by the optimal SNN classifier. In addition, in most of the range of X-values, the corresponding MCC and AUC values of classifiers constructed using the RF algorithm were lower than those using the SNN algorithm (RF: majority of MCC values < 0.550 and all AUC values < 0.9, see Figure 5; SNN: majority of MCC values > 0.550 and all AUC values > 0.9, see Figure 3), indicating good prediction abilities of SNN classifiers on distinguishing complex biological samples.

3.3. Decision Rules

As mentioned in Section 2.2.3, IF-THEN rules were generated by the program of MCFS method, which are listed in Table 2. Two gene regions were involved in these rules: A_16_P41408273 and A_16_P03593084. Following these rules, the predicted results were measured as a MCC of 0.169. We also estimated an odds ratio for these rules of 2.01 (p = 2.62 × 10⁻¹¹, 95% Confidence Interval (CI): lower, upper were 1.63, 2.48). These results also suggest that the predicted class from these rules was consistent with class of the observed disease groups. Although it is not very satisfactory, we can still find important clues that indicate the differences between DS populations with and without AVSD by analyzing A_16_P41408273 and A_16_P03593084, which is given below.
Three rules have been screened to identify two subgroups of DS populations with or without AVSD. In Rule 1, only one specific gene region named A_16_P41408273 in our reference database [16] has been screened out. According to this rule, patients with a reduction in copy number in A_16_P41408273 are more likely to have AVSD. Aside from our original database, minimal direct evidence confirmed the CNV of such region in patients with AVSD. Based on the GSE93004, GSE18152 from GEO database, and a specific publication [65], the copy number of such gene region is downregulated in most patients with AVSD compared with those without AVSD, validating our prediction. The Rule 2 of our quantitative screening involves two functional genes, PDE9A (A_16_P03593084) and A_16_P41408273 we mentioned above. The gene PDE9A, encoding a component of cGMP phosphodiesterase which further contributes to signal transduction by regulating the intracellular cyclic nucleotides’ concentration, has increased copy number in most patients with AVSD, consistent with our predicted rule (≥ −0.0164 and ≤ 0.075) [66,67]. As for transcript A_16_P41408273, we found that most patients with AVSD have a reduced copy number. However, a group of DS patients with AVSD who have an increasing copy number in A_16_P41408273 according to our reference dataset remains [65]. Combined with PDE9A, to speculate that all such samples screened out by Rule 2 are definitely DS patients with AVSD is quite reasonable and is consistent with our prediction. The successive application of Rule 1 and Rule 2 may identify patients with AVSD more accurately than either rule alone. Furthermore, according to our optimal rules, patients with DS with different copy number variant patterns compared with our previous two rules turn out to be patients without AVSD, corresponding with our original dataset.

4. Discussion

4.1. Why Use Self-Normalizing Neural Network as the Classifier

In this study, we integrated a SNN into feature selection method IFS, and achieved good prediction performance for classifying DS patients with or without AVSD. In addition, we also found some important genes and quantitative rules aligning with recent literature. However, there still exists some limitations: (i) the number of samples is much smaller than the number of input features, which easily leads to model overfitting; (ii) deep learning in general requires many more training samples, and currently we only trains SNN on a small dataset. Thus, if we can collect more samples, our method is expected to achieve better performance; (iii) SNN is still a black-box classifier, and currently we combine it with feature selection method to identify the important genes based on the discriminate performance; and (iv) training a deep learning model is still time-consuming.
As shown in Table 1, SNN performed much better than conventional machine learning classifier RF, which in general outperforms other conventional classifiers on many datasets. Meanwhile, we can train multiple classifiers to combine as a super learner, which is expected to perform better than any single classifier. However, it is time-consuming to train multiple classifiers. In particular, the classifier is integrated in IFS, which will run multiple times on feature subsets to select the optimum features. On the other hand, SNN itself outperforms other classifiers with a large margin. Thus, we just used SNN instead of a super learner.

4.2. Optimal Genes Associated with Atrioventricular Septal Defect in Patients with Down Syndrome

Findings from our analysis suggest that patients with AVSD have specific copy number characteristics in DS populations compared with other patients with DS. Based on the copy number statistics provided in the GEO database, we apply our newly SNN-based method. Using our newly presented computational method, a group of functional genes (Table 3) with specific CNVs that may distinguish patients with AVSD in DS population were identified. The detailed analysis of screened important genes is listed below.
PDE9A (A_16_P03593084) has been predicted to have different copy number status in DS patients with or without AVSD. According to recent publications, PDE9A has been reported to contribute to the signaling transduction processes by specifically hydrolyzing the second messenger cyclic guanosine monophosphate (cGMP) [68,69]. In 2000 and 2011, two publications confirmed that in some patients with DS and in mouse models, PDE9A, predicted as an important gene in our model, has specific pathological CNV, validating the specific distribution of CNVs in such genes among DS populations [66,67]. PDE9A as a specific component of the cGMP signaling pathway has also been reported to participate in atrioventricular septal-associated diseases [70,71,72]. To identify patients with AVSD in DS populations by its specific atrioventricular septal associated functions is quite reasonable, further validating our prediction.
The gene DOPEY2 (A_16_P03583086) is a known pathological gene of DS involved in the protein traffic between lately Golgi and early endosomes [73,74]. Recently, a comprehensive review [75] on the genome dosage imbalance in DS confirmed that the copy number alteration of this gene may be involved in the complications of disease, such as AVSD, aligning with our prediction. Considering that the CNVs of DOPEY2 may participate in the pathogenesis of AVSD, to speculate that DS patients with or without AVSD may have different copy number status of gene DOPEY2 is quite reasonable, validating the efficacy and accuracy of our prediction.
LCA5L (A_16_P03587947) encoding the ligand of LCA5 has been widely reported to participate in centrosomal or ciliary functions according to recent publications [76,77]. Additionally, the interaction between LCA5L and NDK1 has been confirmed to contribute to the pathogenesis of DS with specific CNVs [78,79,80]. Although no direct evidence revealed the specific contribution of LCA5L in patients with DS, a study [81] on the congenital heart defects confirmed that copy number variation of LCA5L also participated in the pathogenesis of congenital heart defects. In general, AVSD is a subtype of congenital heart defects. Therefore, considering that LCA5L simultaneously participate in the pathogenesis of both AVSD and DS, to conclude the potential relationship between LCA5L and DS patients with AVSD is quite reasonable.
DSCR4 (A_16_P21251330) as a specific non-coding RNA gene that has been linked to the pathogenesis of DS is also predicted to contribute to distinguishing DS patients with or without AVSD [82]. The copy number alteration of this gene has also been reported to participate in AVSD-associated biological processes. In 2013, a specific study on children with DS implied that copy number alteration of DSCR4 participate in the pathogenesis of DS patients with AVSD, functionally interacting with CRELD1 [83]. In 2017, another study [84] also confirmed that in partial trisomy 21 cases, a specific gene region of DSCR4 and its neighbor gene KCNJ6 have been duplicated in patients with AVSD, compared with other patients without AVSD, validating our prediction.
ITGB2 (A_16_P41466725) has also been predicted to contribute to AVSD in patients with DS. CNVs have been widely reported in ITGB2 contributing to various subtypes of diseases, including DS [85], systemic lupus erythematosus [86], and lupus nephritis [86]. As a DS-associated gene, the CNV of ITGB2 has also been reported to contribute to the specific complication of DS and CHD, indicating its complicated biological functions during such pathogenesis [87]. To consider ITGB2 as a potential marker for the distinction of the two subgroups of DS is quite reasonable because the CNV of ITGB2 has different distribution patterns in patients with and without AVSD [87], validating our prediction.
The last annotated gene in the top 10 predicted gene list is U16296 (A_16_P41430034). As a specific annotated RNA isoform of gene TIAM1, the relationship between U16296 and AVSD actually refers to the relationship between TIAM1 and AVSD. Early in 2011, based on mouse embryo sequencing data, the CNVs of our predicted gene TIAM1 has been reported to participate in the pathogenesis of DS-associated heart defects including AVSD, validating our prediction [88]. Furthermore, in 2004, a clinical study on a male infant with DS further confirmed the specific role of TIAM1 translocation in the pathogenesis of CHD, aligning with our prediction [89]. Therefore, based on such literature supports, our predicted RNA isoform named U16296 derived from TIAM1 may contribute to the identification of DS patients with AVSD.
Limited by the length of our manuscript, not all predicted genes/transcripts are discussed in detail. Filtering out the un-annotated RNA transcripts, many of the top predicted genes/transcripts have been reported to contribute to the distinction of DS patients with or without AVSD, providing a group of solid candidate biomarkers for further experimental confirmation and clinical detection.

5. Conclusions

Although lacking detailed copy number statistics for further validation, all screened rules have been confirmed to align with recent literature. Combined with the qualitative analysis of optimal distinctive genes we analyzed, our computational method successfully identified a group of functional biomarkers for the identification of patients with AVSD in patients with DS, which can help to understand why some DS patients develop AVSD. Although the model was still too complex to be applied in clinical practice, it included the candidate genes for further experimental validation, and the complex mechanism of AVSD and DS will be revealed one day.

Supplementary Materials

The following are available online at https://www.mdpi.com/2073-4425/9/4/208/s1, Supplementary Material S1: Output feature list derived from MCFS method with first 5000 features ranked by their RI values; Supplementary Material S2: Two series of MCCs and AUCs resulting from IFS method and SNN classifiers; Supplementary Material S3: MCCs and AUCs resulting from IFS method and RF classifiers.

Acknowledgments

This study was supported by the National Natural Science Foundation of China (31371335, 31701151, 31571343), Natural Science Foundation of Shanghai (17ZR1412500, 16ZR1403100), Shanghai Sailing Program, the Youth Innovation Promotion Association of Chinese Academy of Sciences (CAS) (2016245), the fund of the key Laboratory of Stem Cell Biology of Chinese Academy of Sciences (201703).

Author Contributions

X.P., L.C., T.H. and Y.D.C. conceived and designed the experiments; X.P., X.H.H., and K.F. performed the experiments; X.P., X.H.H., K.F. and Y.H.Z. analyzed the data; X.H.H. and S.P.W. contributed reagents/materials/analysis tools; X.P., X.H.H., K.F. and L.C. wrote the paper.

Conflicts of Interest

The authors declare no conflicts of interest.

References

  1. Lara, D.A.; Lopez, K.N. Public health research in congenital heart disease. Congenit. Heart Dis. 2014, 9, 549–558. [Google Scholar] [CrossRef] [PubMed]
  2. Ross, H.J.; Law, Y.; Book, W.M.; Broberg, C.S.; Burchill, L.; Cecchin, F.; Chen, J.M.; Delgado, D.; Dimopoulos, K.; Everitt, M.D.; et al. Transplantation and mechanical circulatory support in congenital heart disease: A scientific statement from the American heart association. Circulation 2016, 133, 802–820. [Google Scholar] [CrossRef] [PubMed]
  3. Van Hare, G.F.; Ackerman, M.J.; Evangelista, J.K.; Kovacs, R.J.; Myerburg, R.J.; Shafer, K.M.; Warnes, C.A.; Washington, R.L. Eligibility and disqualification recommendations for competitive athletes with cardiovascular abnormalities: Task force 4: Congenital heart disease: A scientific statement from the American heart association and American college of cardiology. J. Am. Coll. Cardiol. 2015, 66, 2372–2384. [Google Scholar] [CrossRef] [PubMed]
  4. Bermudez, B.E.; Medeiros, S.L.; Bermudez, M.B.; Novadzki, I.M.; Magdalena, N.I. Down syndrome: Prevalence and distribution of congenital heart disease in brazil. Sao Paulo Med. J. 2015, 133, 521–524. [Google Scholar] [CrossRef] [PubMed]
  5. Perez-Navero, J.L.; de la Torre-Aguilar, M.J.; Ibarra de la Rosa, I.; Gil-Campos, M.; Gomez-Guzman, E.; Merino-Cejas, C.; Munoz-Villanueva, M.C.; Llorente-Cantarero, F.J. Cardiac biomarkers of low cardiac output syndrome in the postoperative period after congenital heart disease surgery in children. Rev. Esp. Cardiol. 2017, 70, 267–274. [Google Scholar] [CrossRef] [PubMed]
  6. Scansen, B.A.; Schneider, M.; Bonagura, J.D. Sequential segmental classification of feline congenital heart disease. J. Vet. Cardiol. 2015, 17, S10–S52. [Google Scholar] [CrossRef] [PubMed]
  7. Cohen, M.S.; Jegatheeswaran, A.; Baffa, J.M.; Gremmels, D.B.; Overman, D.M.; Caldarone, C.A.; McCrindle, B.W.; Mertens, L. Echocardiographic features defining right dominant unbalanced atrioventricular septal defect: A multi-institutional congenital heart surgeons’ society study. Circ. Cardiovasc. Imaging 2013, 6, 508–513. [Google Scholar] [CrossRef] [PubMed]
  8. Korten, M.A.; Helm, P.C.; Abdul-Khaliq, H.; Baumgartner, H.; Kececioglu, D.; Schlensak, C.; Bauer, U.M.; Diller, G.P.; Competence network for congenital heart defects, I. Eisenmenger syndrome and long-term survival in patients with down syndrome and congenital heart disease. Heart 2016, 102, 1552–1557. [Google Scholar] [PubMed]
  9. Mourato, F.A.; Villachan, L.R.; Mattos Sda, S. Prevalence and profile of congenital heart disease and pulmonary hypertension in down syndrome in a pediatric cardiology service. Rev. Paul. Pediatr. 2014, 32, 159–163. [Google Scholar] [CrossRef] [PubMed]
  10. Ko, J.M. Genetic syndromes associated with congenital heart disease. Korean Circ. J. 2015, 45, 357–361. [Google Scholar] [CrossRef] [PubMed]
  11. Gelb, B.D. Genetic basis of syndromes associated with congenital heart disease. Curr. Opin. Cardiol. 2001, 16, 188–194. [Google Scholar] [CrossRef] [PubMed]
  12. Ghosh, P.; Bhaumik, P.; Ghosh, S.; Ozbek, U.; Feingold, E.; Maslen, C.; Sarkar, B.; Pramanik, V.; Biswas, P.; Bandyopadhyay, B.; et al. Polymorphic haplotypes of CRELD1 differentially predispose Down syndrome and euploids individuals to atrioventricular septal defect. Am. J. Med. Genet. A 2012, 158A, 2843–2848. [Google Scholar] [CrossRef] [PubMed]
  13. Alcantara-Ortigoza, M.A.; De Rubens-Figueroa, J.; Reyna-Fabian, M.E.; Estandia-Ortega, B.; Gonzalez-del Angel, A.; Molina-Alvarez, B.; Velazquez-Aragon, J.A.; Villagomez-Martinez, S.; Pereira-Lopez, G.I.; Martinez-Cruz, V.; et al. Germline mutations in NKX2-5, GATA4, and CRELD1 are rare in a Mexican sample of down syndrome patients with endocardial cushion and septal heart defects. Pediatr. Cardiol. 2015, 36, 802–808. [Google Scholar] [CrossRef] [PubMed]
  14. Mahadevaiah, G.; Gupta, M.; Ashwath, R. Down syndrome with complete atrioventricular septal defect, hypertrophic cardiomyopathy, and pulmonary vein stenosis. Tex. Heart Inst. J. 2015, 42, 458–461. [Google Scholar] [CrossRef] [PubMed]
  15. Wang, L.; Li, Z.; Song, X.; Liu, L.; Su, G.; Cui, Y. Bioinformatic analysis of genes and microRNAs associated with atrioventricular septal defect in down syndrome patients. Int. Heart J. 2016, 57, 490–495. [Google Scholar] [CrossRef] [PubMed]
  16. Rambomartin, B.L.; Mulle, J.G.; Cutler, D.J.; Bean, L.J.H.; Rosser, T.C.; Dooley, K.J.; Cua, C.; Capone, G.; Maslen, C.L.; Reeves, R.H. Analysis of copy number variants on chromosome 21 in down syndrome-associated congenital heart defects. G3 2018, 8, 105–111. [Google Scholar] [CrossRef] [PubMed]
  17. Clough, E.; Barrett, T. The gene expression omnibus database. Methods Mol. Biol. 2016, 1418, 93–110. [Google Scholar] [PubMed]
  18. Ostrovnaya, I.; Nanjangud, G.; Olshen, A.B. A classification model for distinguishing copy number variants from cancer-related alterations. BMC Bioinform. 2010, 11, 297. [Google Scholar] [CrossRef] [PubMed]
  19. Ding, X.; Tsang, S.Y.; Ng, S.K.; Xue, H. Application of machine learning to development of copy number variation-based prediction of cancer risk. Genom. Insights 2014, 7, 1–11. [Google Scholar] [CrossRef] [PubMed]
  20. Angermueller, C.; Pärnamaa, T.; Parts, L.; Stegle, O. Deep learning for computational biology. Mol. Syst. Biol. 2016, 12, 878. [Google Scholar] [CrossRef] [PubMed]
  21. LeCun, Y.; Bengio, Y.; Hinton, G. Deep learning. Nature 2015, 521, 436–444. [Google Scholar] [CrossRef] [PubMed]
  22. Mohan, R.; Sree, P.K. An extensive survey on deep learning applications. IJIACS 2017, 6, 1Y3V4C. [Google Scholar]
  23. Najafabadi, M.M.; Villanustre, F.; Khoshgoftaar, T.M.; Seliya, N.; Wald, R.; Muharemagic, E. Deep learning applications and challenges in big data analytics. J. Big Data 2015, 2, 1. [Google Scholar] [CrossRef]
  24. Pan, X.Y.; Shen, H.B. RNA-protein binding motifs mining with a new hybrid deep learning based cross-domain knowledge integration approach. BMC Bioinform. 2017, 18, 136. [Google Scholar] [CrossRef] [PubMed]
  25. Pan, X.Y.; Fan, Y.X.; Yan, J.C.; Shen, H.B. IPMiner: Hidden ncRNA-protein interaction sequential pattern mining with stacked autoencoder for accurate computational prediction. BMC Genom. 2016, 17, 582. [Google Scholar] [CrossRef] [PubMed]
  26. Zhang, C.; Yan, J.; Li, C.; Rui, X.; Liu, L.; Bie, F. On Estimating Air Pollution from Photos Using Convolutional Neural Network. In Proceedings of the 2016 ACM on Multimedia Conference, Amsterdam, The Netherlands, 15–19 October 2016. [Google Scholar]
  27. Ren, Z.; Yan, J.; Ni, B.; Zha, H.; Yang, X. Unsupervised Deep Learning for Optical Flow Estimation. In Proceedings of the Thirty-First AAAI Conference on Artificial Intelligence, San Francisco, CA, USA, 4–9 February 2017. [Google Scholar]
  28. Ioffe, S.; Szegedy, C. Batch normalization: Accelerating deep network training by reducing internal covariate shift. In Proceedings of the International Conference on Machine Learning, Lille, France, 6–11 July 2015; pp. 448–456. [Google Scholar]
  29. Bengio, Y.; Simard, P.; Frasconi, P. Learning long-term dependencies with gradient descent is difficult. IEEE Trans. Neural Netw. 1994, 5, 157–166. [Google Scholar] [CrossRef] [PubMed]
  30. Pascanu, R.; Mikolov, T.; Bengio, Y. Understanding the exploding gradient problem. CoRR, abs/1211.5063 2012.
  31. Pascanu, R.; Mikolov, T.; Bengio, Y. On the Difficulty of Training Recurrent Neural Networks. In Proceedings of the International Conference on Machine Learning, Atlanta, GA, USA, 16–21 June 2013; pp. 1310–1318. [Google Scholar]
  32. Klambauer, G.; Unterthiner, T.; Mayr, A.; Hochreiter, S. Self-normalizing neural networks. Adv. Neural Inf. Process. Syst. 2017, 972–981. [Google Scholar]
  33. He, K.; Zhang, X.; Ren, S.; Sun, J. Deep Residual Learning for Image Recognition. In Proceedings of the 2016 IEEE Conference on Computer Vision and Pattern Recognition (CVPR), Las Vegas, NV, USA, 27–30 June 2016; pp. 770–778. [Google Scholar]
  34. Breiman, L. Random forests. Mach. Learn. 2001, 45, 5–32. [Google Scholar] [CrossRef]
  35. Rambo-Martin, B.L.; Zwick, M.E. Analysis of Copy Number Variants on Chromosome 21 in Down Syndrome-Associated Congenital Heart Defects. Available online: https://www.ncbi.nlm.nih.gov/geo/query/acc.cgi?acc=GSE93004 (accessed on 30 January 2017).
  36. Draminski, M.; Rada-Iglesias, A.; Enroth, S.; Wadelius, C.; Koronacki, J.; Komorowski, J. Monte carlo feature selection for supervised classification. Bioinformatics 2008, 24, 110–117. [Google Scholar] [CrossRef] [PubMed]
  37. Draminski, M. Available online:. Available online: http://www.ipipan.eu/staff/m.draminski/mcfs.html (accessed on 5 April 2018).
  38. Johnson, D.S. Approximation algorithms for combinatorial problems. J. Comput. Syst. Sci. 1974, 9, 256–278. [Google Scholar] [CrossRef]
  39. Cohen, W.W. Fast Effective Rule Induction. In Proceedings of the Twelfth International Conference on Machine Learning, Tahoe City, CA, USA, 9–12 July 1995; pp. 115–123. [Google Scholar]
  40. Johannes, F.; Widmer, G. Incremental Reduced Error Pruning. In Proceedings of the Eleventh Annual Conference on Machine Learning, New Brunswick, NJ, USA, 10–13 July 1994. [Google Scholar]
  41. Quinlan, J.R. Learning logical definitions from relations. Mach. Learn. 1990, 266, 239–266. [Google Scholar] [CrossRef]
  42. Brunnk, C.A.; Pazzani, M.J. An investigation of noise-tolerant relational concept learning algorithms. In Proceedings of the 8th International Workshop on Machine Learning, Evanston, IL, USA, 1991; Elsevier: Amsterdam, The Netherlands, 1991; pp. 389–393. [Google Scholar]
  43. Ho, T.K. Random Decision Forests. In Proceedings of the 3rd International Conference on Document Analysis and Recognition, Montreal, QC, USA, 14–16 August 1995; pp. 278–282. [Google Scholar]
  44. Ho, T.K. The random subspace method for constructing decision forests. IEEE Trans. Pattern Anal. Mach. Intell. 1998, 20, 832–844. [Google Scholar]
  45. Ting, K.M.; Witten, I.H. Stacking Bagged and Dagged Models. In Proceedings of the Fourteenth International Conference on Machine Learning, San Francisco, CA, USA, 8–12 July 1997. [Google Scholar]
  46. Chen, L.; Zhang, Y.-H.; Zheng, M.; Huang, T.; Cai, Y.-D. Identification of compound–protein interactions through the analysis of gene ontology, KEGG enrichment for proteins and molecular fragments of compounds. Mol. Genet. Genom. 2016, 291, 2065–2079. [Google Scholar] [CrossRef] [PubMed]
  47. Chen, L.; Chu, C.; Huang, T.; Kong, X.; Cai, Y.D. Prediction and analysis of cell-penetrating peptides using pseudo-amino acid composition and random forest models. Amino Acids 2015, 47, 1485–1493. [Google Scholar] [CrossRef] [PubMed]
  48. Li, B.-Q.; Zheng, L.-L.; Hu, L.-L.; Feng, K.-Y.; Huang, G.; Chen, L. Prediction of linear B-cell epitopes with mRMR feature selection and analysis. Curr. Bioinform. 2016, 11, 22–31. [Google Scholar] [CrossRef]
  49. Li, B.Q.; Hu, L.L.; Chen, L.; Feng, K.Y.; Cai, Y.D.; Chou, K.C. Prediction of protein domain with mRMR feature selection and analysis. PLoS ONE 2012, 7, e39308. [Google Scholar] [CrossRef] [PubMed]
  50. Casanova, R.; Saldana, S.; Chew, E.Y.; Danis, R.P.; Greven, C.M.; Ambrosius, W.T. Application of random forests methods to diabetic retinopathy classification analyses. PLoS ONE 2014, 9, e98587. [Google Scholar] [CrossRef] [PubMed]
  51. Kandaswamy, K.K.; Chou, K.-C.; Martinetz, T.; Möller, S.; Suganthan, P.; Sridharan, S.; Pugalenthi, G. AFP-Pred: A random forest approach for predicting antifreeze proteins from sequence-derived properties. J. Theor. Biol. 2011, 270, 56–62. [Google Scholar] [CrossRef] [PubMed]
  52. Pugalenthi, G.; Kandaswamy, K.; Chou, K.-C.; Vivekanandan, S.; Kolatkar, P. RSARF: Prediction of residue solvent accessibility from protein sequence using random forest method. Protein Pept. Lett. 2011, 19, 50–56. [Google Scholar] [CrossRef]
  53. Pan, X.Y.; Zhang, Y.N.; Shen, H.B. Large-scale prediction of human protein-protein interactions from amino acid sequence based on latent topic features. J. Proteome Res. 2010, 9, 4992–5001. [Google Scholar] [CrossRef] [PubMed]
  54. Zhang, Q.; Sun, X.; Feng, K.; Wang, S.; Zhang, Y.H.; Wang, S.; Lu, L.; Cai, Y.D. Predicting citrullination sites in protein sequences using mRMR method and random forest algorithm. Comb. Chem. High Throughput Screen 2017, 20, 164–173. [Google Scholar] [CrossRef] [PubMed]
  55. Chen, L.; Zhang, Y.H.; Huang, T.; Cai, Y.D. Gene expression profiling gut microbiota in different races of humans. Sci. Rep. 2016, 6, 23075. [Google Scholar] [CrossRef] [PubMed]
  56. Witten, I.H.; Frank, E. Data Mining: Practical Machine Learning Tools and Techniques; Morgan Kaufmann: San Francisco, CA, USA, 2005. [Google Scholar]
  57. Kohavi, R. A Study of Cross-Validation and Bootstrap for Accuracy Estimation and Model Selection. In Proceedings of the 14th International Joint Conference on Artificial Intelligence, Montreal, QC, Canada, 20–25 August 1995; Lawrence Erlbaum Associates Ltd.: Mahwah, NJ, USA; pp. 1137–1145. [Google Scholar]
  58. Chen, L.; Wang, S.; Zhang, Y.-H.; Li, J.; Xing, Z.-H.; Yang, J.; Huang, T.; Cai, Y.-D. Identify key sequence features to improve CRISPR sgRNA efficacy. IEEE Access 2017, 5, 26582–26590. [Google Scholar] [CrossRef]
  59. Chen, L.; Li, J.; Zhang, Y.-H.; Feng, K.; Wang, S.; Zhang, Y.; Huang, T.; Kong, X.; Cai, Y.-D. Identification of gene expression signatures across different types of neural stem cells with the Monte-carlo feature selection method. J. Cell. Biochem. 2017, 119, 3394–3403. [Google Scholar] [CrossRef] [PubMed]
  60. Chen, L.; Zhang, Y.H.; Lu, G.; Huang, T.; Cai, Y.D. Analysis of cancer-related lncRNAs using gene ontology and KEGG pathways. Artif. Intell. Med. 2017, 76, 27–36. [Google Scholar] [CrossRef] [PubMed]
  61. Chen, L.; Zeng, W.-M.; Cai, Y.-D.; Feng, K.-Y.; Chou, K.-C. Predicting anatomical therapeutic chemical (ATC) classification of drugs by integrating chemical-chemical interactions and similarities. PLoS ONE 2012, 7, e35254. [Google Scholar] [CrossRef] [PubMed]
  62. Chen, L.; Chu, C.; Zhang, Y.-H.; Zheng, M.-Y.; Zhu, L.; Kong, X.; Huang, T. Identification of drug-drug interactions using chemical interactions. Curr. Bioinform. 2017, 12, 526–534. [Google Scholar] [CrossRef]
  63. Chen, L.; Feng, K.Y.; Cai, Y.D.; Chou, K.C.; Li, H.P. Predicting the network of substrate-enzyme-product triads by combining compound similarity and functional domain composition. BMC Bioinform. 2010, 11, 293. [Google Scholar] [CrossRef] [PubMed]
  64. Matthews, B.W. Comparison of the predicted and observed secondary structure of T4 phage lysozyme. Biochim. Biophys. Acta 1975, 405, 442–451. [Google Scholar] [CrossRef]
  65. Ramachandran, D.; Mulle, J.G.; Locke, A.E.; Bean, L.J.; Rosser, T.C.; Bose, P.; Dooley, K.J.; Cua, C.L.; Capone, G.T.; Reeves, R.H.; et al. Contribution of copy-number variation to down syndrome-associated atrioventricular septal defects. Genet. Med. 2015, 17, 554–560. [Google Scholar] [CrossRef] [PubMed]
  66. Michaud, J.; Kudoh, J.; Berry, A.; Bonne-Tamir, B.; Lalioti, M.D.; Rossier, C.; Shibuya, K.; Kawasaki, K.; Asakawa, S.; Minoshima, S.; et al. Isolation and characterization of a human chromosome 21q22.3 gene (WDR4) and its mouse homologue that code for a WD-repeat protein. Genomics 2000, 68, 71–79. [Google Scholar] [CrossRef] [PubMed]
  67. Lim, J.H.; Kim, S.Y.; Park, S.Y.; Lee, S.Y.; Kim, M.J.; Han, Y.J.; Lee, S.W.; Chung, J.H.; Kim, M.Y.; Yang, J.H.; et al. Non-invasive epigenetic detection of fetal trisomy 21 in first trimester maternal plasma. PLoS ONE 2011, 6, e27709. [Google Scholar] [CrossRef] [PubMed]
  68. Almeida, C.B.; Traina, F.; Lanaro, C.; Canalli, A.A.; Saad, S.T.; Costa, F.F.; Conran, N. High expression of the cGMP-specific phosphodiesterase, PDE9a, in sickle cell disease (SCD) and the effects of its inhibition in erythroid cells and SCD neutrophils. Br. J. Haematol. 2008, 142, 836–844. [Google Scholar] [CrossRef] [PubMed]
  69. Lee, D.I.; Zhu, G.; Sasaki, T.; Cho, G.S.; Hamdani, N.; Holewinski, R.; Jo, S.H.; Danner, T.; Zhang, M.; Rainer, P.P.; et al. Phosphodiesterase 9A controls nitric-oxide-independent cGMP and hypertrophic heart disease. Nature 2015, 519, 472–476. [Google Scholar] [CrossRef] [PubMed]
  70. Gorenflo, M.; Zheng, C.; Poge, A.; Bettendorf, M.; Werle, E.; Fiehn, W.; Ulmer, H.E. Metabolites of the L-arginine-NO pathway in patients with left-to-right shunt. Clin. Lab. 2001, 47, 441–447. [Google Scholar] [PubMed]
  71. Gorenflo, M.; Ullmann, M.V.; Eitel, K.; Gross, J.; Fiehn, W.; Hagl, S.; Dreyhaupt, J. Plasma L-arginine and metabolites of nitric oxide synthase in patients with left-to-right shunt after intracardiac repair. Chest 2005, 127, 1184–1189. [Google Scholar] [CrossRef]
  72. Seghaye, M.C.; Duchateau, J.; Bruniaux, J.; Demontoux, S.; Detruit, H.; Bosson, C.; Lecronier, G.; Mokhfi, E.; Serraf, A.; Planche, C. Endogenous nitric oxide production and atrial natriuretic peptide biological activity in infants undergoing cardiac operations. Crit. Care Med. 1997, 25, 1063–1070. [Google Scholar] [CrossRef] [PubMed]
  73. Rachidi, M.; Lopes, C.; Costantine, M.; Delabar, J.M. C21orf5, a new member of dopey family involved in morphogenesis, could participate in neurological alterations and mental retardation in down syndrome. DNA Res. 2005, 12, 203–210. [Google Scholar] [CrossRef] [PubMed]
  74. Rachidi, M.; Lopes, C.; Delezoide, A.L.; Delabar, J.M. C21orf5, a human candidate gene for brain abnormalities and mental retardation in down syndrome. Cytogenet. Genome Res. 2006, 112, 16–22. [Google Scholar] [CrossRef] [PubMed]
  75. Antonarakis, S.E. Down syndrome and the complexity of genome dosage imbalance. Nat. Rev. Genet. 2017, 18, 147–163. [Google Scholar] [CrossRef] [PubMed]
  76. Lu, L.; Madugula, V. Mechanisms of ciliary targeting: Entering importins and rabs. Cell. Mol. Life Sci. 2018, 75, 597–606. [Google Scholar] [CrossRef] [PubMed]
  77. Liang, Y.; Meng, D.; Zhu, B.; Pan, J. Mechanism of ciliary disassembly. Cell. Mol. Life Sci. 2016, 73, 1787–1802. [Google Scholar] [CrossRef] [PubMed]
  78. Kondo, T.; Onitsuka, S.; Ryoji, O.; Kihara, T.; Goto, Y.; Satoh, T.; Nakazawa, H.; Toma, H. Analysis of prognostic factors related to primary superficial bladder cancer tumor recurrence in prophylactic intravesical epirubicin therapy. Int. J. Urol. 1999, 6, 178–183. [Google Scholar] [CrossRef] [PubMed]
  79. Slusarski, D.C.; Pelegri, F. Calcium signaling in vertebrate embryonic patterning and morphogenesis. Dev. Biol. 2007, 307, 1–13. [Google Scholar] [CrossRef] [PubMed]
  80. Zhang, F.; Gu, W.; Hurles, M.E.; Lupski, J.R. Copy number variation in human health, disease, and evolution. Annu. Rev. Genom. Hum. Genet. 2009, 10, 451–481. [Google Scholar] [CrossRef] [PubMed]
  81. Mlynarski, E.E.; Sheridan, M.B.; Xie, M.; Guo, T.; Racedo, S.E.; McDonald-McGinn, D.M.; Gai, X.; Chow, E.W.; Vorstman, J.; Swillen, A.; et al. Copy-number variation of the glucose transporter gene SLC2A3 and congenital heart defects in the 22q11.2 deletion syndrome. Am. J. Hum. Genet. 2015, 96, 753–764. [Google Scholar] [CrossRef] [PubMed]
  82. Asai, S.; Yamaki, A.; Kudoh, J.; Shimizu, N.; Shimizu, Y. Analysis of the promoter region of human placenta-specific DSCR4 gene. Biochim. Biophys. Acta 2008, 1779, 40–50. [Google Scholar] [CrossRef] [PubMed]
  83. Al-Biltagi, M.A. Echocardiography in children with down syndrome. World J. Clin. Pediatr. 2013, 2, 36–45. [Google Scholar] [CrossRef] [PubMed]
  84. Pelleri, M.C.; Gennari, E.; Locatelli, C.; Piovesan, A.; Caracausi, M.; Antonaros, F.; Rocca, A.; Donati, C.M.; Conti, L.; Strippoli, P.; et al. Genotype-phenotype correlation for congenital heart disease in down syndrome through analysis of partial trisomy 21 cases. Genomics 2017, 109, 391–400. [Google Scholar] [CrossRef] [PubMed]
  85. Ait Yahya-Graison, E.; Aubert, J.; Dauphinot, L.; Rivals, I.; Prieur, M.; Golfier, G.; Rossier, J.; Personnaz, L.; Creau, N.; Blehaut, H.; et al. Classification of human chromosome 21 gene-expression variations in down syndrome: Impact on disease phenotypes. Am. J. Hum. Genet. 2007, 81, 475–491. [Google Scholar] [CrossRef] [PubMed]
  86. Ramos, P.S.; Brown, E.E.; Kimberly, R.P.; Langefeld, C.D. Genetic factors predisposing to systemic lupus erythematosus and lupus nephritis. Semin. Nephrol. 2010, 30, 164–176. [Google Scholar] [CrossRef] [PubMed]
  87. Lintas, C.; Sacco, R.; Persico, A.M. Genome-wide expression studies in autism spectrum disorder, rett syndrome, and down syndrome. Neurobiol. Dis. 2012, 45, 57–68. [Google Scholar] [CrossRef] [PubMed]
  88. Liu, C.; Morishima, M.; Yu, T.; Matsui, S.; Zhang, L.; Fu, D.; Pao, A.; Costa, A.C.; Gardiner, K.J.; Cowell, J.K.; et al. Genetic analysis of down syndrome-associated heart defects in mice. Hum. Genet. 2011, 130, 623–632. [Google Scholar] [CrossRef] [PubMed]
  89. Rost, I.; Fiegler, H.; Fauth, C.; Carr, P.; Bettecken, T.; Kraus, J.; Meyer, C.; Enders, A.; Wirtz, A.; Meitinger, T.; et al. Tetrasomy 21pter→q21.2 in a male infant without typical down’s syndrome dysmorphic features but moderate mental retardation. J. Med. Genet. 2004, 41, e26. [Google Scholar] [CrossRef] [PubMed]
Figure 1. Flowchart of our proposed pipeline. 236 patients with both Down syndrome (DS) and atrioventricular septal defect (AVSD) (positive samples) and 290 patients had only DS (negative samples) were measured by the copy numbers of 52,842 probes on chromosome 21. Then, all features were evaluated by Monte Carlo feature selection method (MCFS), resulting in a feature list and several informative features. The feature list was used in the incremental feature selection method to construct an optimal self-normalizing neural network (SNN) classifier and extract optimal features. The informative features were feed into the Johnson Reducer algorithm to extract decision rules.
Genes 09 00208 g001
Figure 2. The procedures of RIPPER algorithm.
Genes 09 00208 g002
Figure 3. Incremental feature selection (IFS) curves derived from the IFS method and SNN algorithm. X-axis is the number of features participating in building classifiers in feature subsets. Y-axis is their corresponding Matthew’s correlation coefficient (MCC) or area under the curve (AUC) values. (A) IFS curve with X-values of 10 to 5000. The selected feature interval for SNN algorithm is [2001, 4999], which were marked with two vertical lines. (B) IFS curve with X-values of 2001 to 4999 for SNN algorithm. When first 2737 features in feature list were considered, the optimal MCC value reached 0.748, which is marked by a red diamond.
Genes 09 00208 g003
Figure 4. The receiver operating characteristic (ROC) curves for the optimal SNN and Random Forest classifier.
Genes 09 00208 g004
Figure 5. IFS curves derived from the IFS method and RF algorithm. X-axis is the number of features participating in building classifiers in feature subsets. Y-axis is their corresponding MCC or AUC values. When first 132 features in feature list were considered, the optimal MCC value reached 0.582, which is marked by a triangle.
Genes 09 00208 g005
Table 1. Optimal number of features and MCC values yielded from the optimal SNN and RF classifiers.
Classification AlgorithmNumber of FeaturesMCCAUC
SNN27370.7480.915
Random forest1320.5820.834
Table 2. Three decision rules extracted from the informative features.
ClassificationRulesFeaturesCriteria
With AVSDRule 1A_16_P41408273≤−0.00593
With AVSDRule 2A_16_P03593084≥−0.0164
A_16_P03593084≤0.075
A_16_P41408273≥0.0248
Without DSRule 3Other conditions
Table 3. Detailed analyzed optimal features in Section 4.2.
No.Feature NameGene Name
1A_16_P03593084PDE9A
2A_16_P03583086DOPEY2
3A_16_P03587947LCA5L
4A_16_P21251330DSCR4
5A_16_P41466725ITGB2
6A_16_P41430034U16296

